Embed Size (px)
Citation preview

Economic Impact of Travel
on West Virginia 2000-2012 Detailed State and County Estimates
Photo credit: West Virginia Division of Tourism
October 2013
Prepared for the
West Virginia Division of Tourism
South Charleston, West Virginia

Economic Impact of Travel
on West Virginia
2000-2012 Detailed State and County Estimates
October 2013
prepared for the
West Virginia Division of Tourism
South Charleston, West Virginia
Dean Runyan Associates
833 SW Eleventh Avenue, Suite 920
Portland, Oregon 97205 503/226-2973
www.deanrunyan.com

This page intentionally blank

DEAN RUNYAN ASSOCIATES PAGE i
TABLE OF CONTENTS
I. Introduction ............................................................................................................ 1
II: West Virginia Travel Impacts ................................................................................. 5
Direct Impacts of Travel in West Virginia: A Summary .............................................. 6
Gross State Product ................................................................................................ 12
III. Regional Travel Impacts ...................................................................................... 15
IV. County Travel Impacts ........................................................................................ 29
Appendices ................................................................................................................ 41
Appendix A. Regional Travel Impact Model (RTIM) Methodology ......................... 43
Appendix B. Definition of Terms ............................................................................ 45
Appendix C. Travel Industry Business Classifications .............................................. 47

PAGE ii DEAN RUNYAN ASSOCIATES
LIST OF TABLES AND FIGURES
page
State Travel Impacts
West Virginia Direct Travel Impacts, 2000-2012 7
West Virginia Visitor Spending Adjusted for Inflation, 2000-2012 8
West Virginia Visitor Spending by Type of Traveler Accommodation, 2012 8
West Virginia Visitor Spending by Commodity Purchased, 2012 9
West Virginia Direct Employment Generated by Travel Spending, 2012 9
State and Local Travel-Generated Government Revenue, 2012 10
West Virginia Visitor Impacts, 2004-2012 11
West Virginia Travel Industry Gross Domestic Product, 2012 12
West Virginia Gross Domestic Product, 2010 & 2011: Selected Export-Orientated Industries 13
Regional Travel Impacts
Northern Panhandle Travel Impacts, 2004-2012 17
Mid-Ohio Valley Travel Impacts, 2004-2012 18
Metro Valley Travel Impacts, 2004-2012 19
Mountain Lakes Travel Impacts, 2004-2012 20
New River/Greenbrier Valley Travel Impacts, 2004-2012 21
Potomac Highlands Travel Impacts, 2004-2012 22
Eastern Panhandle Travel Impacts, 2004-2012 23
Mountaineer Country Travel Impacts, 2004-2012 24
Hatfield-McCoy Mountains Travel Impacts, 2004-2012 25
Summary: Regional Travel Impacts, 2012 26-27
County Travel Impacts
Barbour through Clay, 2004-2012 31
Doddridge through Hardy, 2004-2012 32
Harrison through McDowell, 2004-2012 33
Marion through Monroe, 2004-2012 34
Morgan through Putnam, 2004-2012 35
Raleigh through Tyler, 2004-2012 36
Upshur through Wyoming, 2004-2012 37
Total & Travel-Generated Employment and Earnings by County, 2012 38-39

DEAN RUNYAN ASSOCIATES PAGE iii
PREFACE
The purpose of this study is to document the economic significance of the
travel industry in West Virginia from 2000 to 2012. These findings show the
level of travel spending by visitors traveling to and within the state and the
impact this spending had on the economy in terms of earnings, employment,
and tax revenue.
Dean Runyan Associates prepared this study for then West Virginia Division of
Tourism. Dean Runyan Associates has specialized in research and planning
services for the travel, tourism and recreation industry since 1984. With
respect to economic impact analysis, the firm developed and currently
maintains the Regional Travel Impact Model (RTIM), a proprietary computer
model for analyzing travel economic impacts at the state, regional and local
level. Dean Runyan Associates also has extensive experience in project
feasibility analysis, market evaluation, survey research, and travel and tourism
planning.
Many individuals and agencies provided information and advice for this report.
Among the organizations involved in this effort were the West Virginia
Department of Tax and Revenue, the West Virginia Racing Commission, the
West Virginia Lottery, and the West Virginia State Parks and Forests. Federal
agencies that provided assistance included the USDA Forest Service, the
Department of Labor and the Bureau of Economic Analysis.
Finally, special thanks are due to Joe Black, Director of Research, West
Virginia Division of Tourism. Without his support and assistance, this report
would not have been possible.
Dean Runyan Associates
833 SW 11th Ave., Suite 920
Portland, OR 97205
(503) 226-2973
www.deanrunyan.com

This page intentionally blank

DEAN RUNYAN ASSOCIATES PAGE 1
I. Introduction
Visitors traveling to and throughout West Virginia represent an important
component of the state's economy. Travel originating in domestic and
international markets generates valuable business sales, payroll, employment
and tax receipts for the state as well as for local jurisdictions. Further, many
locations within West Virginia serve as travel destinations in their own right.
These areas accordingly consider travel and tourism a primary industry.
Objectives
This report describes the economic impacts of travel to and through the state of
West Virginia and each of its 55 counties from 2000 to 2012. Previous
estimates may be slightly adjusted when original data sources are revised.
Detailed breakouts of travel impacts are provided for 2004 through 2012 at the
state level, the nine tourism regions, and the 55 counties. A primary objective
of this research is to provide reliable, detailed figures that allow comparisons
from year-to year for the state and county levels.
Direct Impacts
The estimates of the direct impacts associated with traveler spending in West
Virginia were produced using the Regional Travel Impact Model (RTIM)
developed by Dean Runyan Associates. The input data used to detail the
economic impacts of the West Virginia travel industry were gathered from
various local, state and federal sources.
Travel impacts consist of estimates of travel spending and the employment,
earnings, and state and local taxes generated by this spending. These estimates
are also broken out by type of traveler accommodation and by the type of
business in which the expenditures occur. A description of RTIM
methodology is included in Appendix A.
Gross State Product
An estimate of the Gross State Product of the travel industry is also included in this
report. Gross State Product is a measure of industry output that excludes the value
of intermediate inputs purchased from businesses in other industries. As a single
measure, it provides a more meaningful gauge of industry output than spending,
earnings, or tax receipts. It also permits comparisons with other industries.
Types of Travel Impacts Included
Most of the travel that occurs in West Virginia is included in the scope of this
analysis. The purpose of such travel can be for business, pleasure, shopping, to
attend meetings, or for personal, medical, or educational purposes. All trips to West
Virginia by U.S. residents and foreign visitors are included. The travel of West
Virginia residents to other destinations in West Virginia is included, provided that it
is neither commuting nor other routine travel. Travel to non-West Virginia

PAGE 2 DEAN RUNYAN ASSOCIATES
destinations by West Virginia residents in not included as a component of visitor
spending.
The impacts associated with travel are included if the travelers remain at the
destination overnight and day travel for both in-state and out-of-state residents
whose trip does not include an overnight stay at a destination in West Virginia. In
general, the terms “traveler” and “visitor” are used interchangeably in this report.
Both represent a person who is traveling in the state of West Virginia, away from his
or her home, on a trip as defined above.
State and Local Government Revenue
Approximately 70 percent of all travel-generated government revenue accrues to
state government in West Virginia. State taxes include the 6 percent state sales tax,
the motor fuel tax, income taxes on travel-generated earnings and travel-related
business income, and state revenue generated through racetrack video lottery and
wagering (distributed by the West Virginia Lottery and the West Virginia Racing
Commission). Local taxes consist of the Hotel/Motel Occupancy Tax and the
Business & Occupation Tax, levied by municipal governments in West Virginia.
The West Virginia Lottery makes distributions to racetrack and non-racetrack
counties and municipalities throughout the state.
Transportation Impacts
The focus of this analysis is on the destination-specific impacts of visitors. This is
straightforward with respect to the spending on commodities such as
accommodations, food services, recreation, and retail purchases. It is less obvious
with respect to ground and air transportation services, in that transportation provides
a link between an origin and destination. In this report, the impacts related to
spending on transportation are allocated to the location (i.e., region or county) in
which those spending impacts occur, regardless of whether that location is the
ultimate destination of the visitor. For this reason, counties with urban centers will
tend to have relatively greater transportation impacts even though some of that
spending on transportation will be related to visits at other destinations.

DEAN RUNYAN ASSOCIATES PAGE 3
Impact Categories
Visitor Categories
Impact Category Description
Expenditures Purchases by travelers during their trip, including hotel/motel
occupancy taxes and other applicable local and state taxes, paid by
the traveler at the point of sale.
Total Earnings The earnings (wage and salary disbursements, earned benefits, and
proprietor income) of employees and owners of businesses that
receive travel expenditures. Only the earnings attributable to travel
expenditures are included; this typically is only a portion of all
business receipts.
Employment Employment associated with the above earnings; this includes both
full- and part-time positions of wage and salary workers and
proprietors.
Local Tax Receipts Hotel/motel occupancy tax levied by cities and counties. Property
taxes are not included.
State Tax Receipts State exise taxes including sales and motor fuel taxes, income taxes
attributable to travel-generated personal earnings and business
receipts, and taxes on gaming revenue (levied by the West Virginia
Lottery and the West Virginia Racing Commission).
Type of Visitor Description
Hotel/Motel/B&B
Guest
Travelers staying in hotels, motels, resorts, bed & breakfast
establishments, and other commercial accommodations, excluding
campgrounds, where a hotel/motel occupancy tax is collected.
Private Camper Travelers staying in a privately owned (i.e., commercial)
campground.
Public Camper Travelers staying in a publicly managed campground such as those
managed by West Virginia State Parks and Forests, the U.S. Forest
Service, or the National Park Service.
Private Home Visitor Travelers staying as guests with friends or relatives.
Vacation Home
Visitor
Travelers using their own vacation home or timeshare and those
borrowing or renting a vacation home where hotel/motel occupancy
tax is not collected.
Day Visitor Both in-state and out-of-state residents whose trip does not include
an overnight stay at a destination in West Virginia.

PAGE 4 DEAN RUNYAN ASSOCIATES
Report Contents
Section II provides an overview of Travel Impacts in the state, detailed estimates for
2004 through 2012, an estimate of gross state product, and the relative impacts for
counties measured in terms of the proportion of total earnings and employment that
is travel-generated. Section III details estimates for the nine tourism regions.
Section IV contains summary estimates for all of West Virginia’s 55 counties.
The first part of this section focuses on the direct impacts of travel spending. This
section provides an overview of travel-generated impacts since 2000, including state
and local tax revenues directly generated by travel spending. More detailed travel
impacts for the state are reported on the following pages.
A description of the RTIM methodology is included in Appendix A. Definitions of
the travel terms used in this report can be found in Appendix B. Appendix C
provides a description of travel industries in terms of NAICS.

DEAN RUNYAN ASSOCIATES PAGE 5
II: West Virginia Travel Impacts
2000-2012

PAGE 6 DEAN RUNYAN ASSOCIATES
West Virginia’s $5.1 billion in travel-generated spending is a vital part of the state and
local economies. In some areas of the state, it is one of the primary sources of
earnings and employment. The types of business that serve travelers are represented
primarily by service and retail firms, including lodging establishments, restaurants,
gaming establishments, recreation-orientated businesses, retail stores, gasoline service
stations, transportation, and other travel-related services. The money that is spent on
these goods and services in West Virginia produces business receipts at these firms,
which in turn employ West Virginia residents. State and local government units
benefit from the travel industry as well through the collection of taxes on the sale of
goods and services and on the income generated by these sales.
DIRECT IMPACTS OF TRAVEL IN WEST VIRGINIA: A SUMMARY
Travel spending by all overnight and day visitors in West Virginia was
$5.1 billion in the 2012 calendar year. This is equivalent to
approximately $13.9 million dollars per day.
Travel spending in West Virginia has increased by 6.3 percent per year
since 2000. In constant dollars (adjusted for inflation), travel spending
has increased by 3.3 percent over the same period.
Visitors who stayed overnight in commercial lodging facilities spent $1.5
billion in 2012 – or about one-third of all travel spending in the state.
Day travelers who spent substantially on gaming and entertainment spent
nearly $2.5 billion, or about one-half (49%) the state total.
During 2012, visitor spending in West Virginia directly supported about
46,400 jobs with earnings of $1.1 billion. Travel spending generated the
greatest number of jobs in accommodations & food services, and arts,
entertainment, recreation.
Local and state government revenues generated by travel spending were
$707 million in 2012 (does not include property taxes). Without these
government revenues generated travel spending, each household in West
Virginia would have had to pay an additional $924 in state and local
taxes to maintain current service levels.
The following tables and graphs document these travel impacts. Detailed travel
impact estimates for the state from 2004 to 2012 are found on page 11.

DEAN RUNYAN ASSOCIATES PAGE 7
Spending Earnings Employment Gov't Revenue ($Million)
($Million) ($Million) (Thousand) Local State Federal
2000 2,450 610 36.0 18.2 280.8 140.4
2001 2,708 667 38.4 21.3 340.6 153.6
2002 3,010 734 40.8 24.8 396.1 165.6
2003 3,349 787 42.5 27.7 449.5 180.6
2004 3,594 815 42.9 31.0 525.7 190.0
2005 3,855 848 44.3 32.8 536.3 192.5
2006 4,088 874 44.6 35.6 552.4 197.9
2007 4,201 905 44.5 37.8 556.7 203.3
2008 4,500 932 44.7 47.8 557.2 208.9
2009 4,034 941 44.6 46.9 545.4 208.4
2010 4,313 996 45.0 51.6 533.9 217.5
2011 4,842 1,037 45.6 63.0 575.8 207.4
2012 5,103 1,075 46.4 69.8 637.0 214.3
Annual Percentage Change
11-12 5.4 3.7 1.8 10.8 10.6 3.3
00-12 6.3 4.8 2.1 11.8 7.1 3.6
West Virginia Direct Travel Impacts, 2000-2012
Spending includes passenger air transportation. Total Earnings includes wage and salary
disbursements, other earned income and proprietor income. Employment includes payroll
employees and proprietors. Government revenue includes the state share of racetrack
video lottery and wagering, local hotel/motel taxes, state sales and income taxes, and the
gasoline tax. Property taxes are not included. Annual Change refers to the average annual
change. Details may not add to totals due to rounding.

PAGE 8 DEAN RUNYAN ASSOCIATES
West Virginia Visitor Spending Adjusted for Inflation, 2000-2012
Real
Current
$2.0
$2.5
$3.0
$3.5
$4.0
$4.5
$5.0
$5.5
00 01 02 03 04 05 06 07 08 09 10 11 12
Spen
din
g in
Bil
lions
Source: Dean Runyan Associates, Bureau of Labor Statistics and Smith Travel Research.
West Virginia Visitor Spending
by Type of Traveler Accommodation, 2012 ($ Millions)
Hotel, Motel
$1,544
31%
Campground$35
1%Private Home
$802
16%
Vacation Home
$100
2%
Day Travel
$2,485
50%

DEAN RUNYAN ASSOCIATES PAGE 9
West Virginia Visitor Spending
by Commodity Purchased, 2012
$221
$315
$509
$550
$939
$1,111
$1,321
$0 $200 $400 $600 $800 $1,000 $1,200 $1,400
Food Stores
Recreation & Entertainment
Accommodations
Retail Sales
Food & Beverage Service
Gaming
Ground Transportation
Travel Spending In Millions
West Virginia Direct Employment
Generated by Travel Spending, 2012
573
797
5,233
14,816
25,002
0 5,000 10,000 15,000 20,000 25,000 30,000
Ground Transportation
Other Travel
Retail
Arts, Entertainment, Rec.
Accom. & Food Service
Number of Jobs

PAGE 10 DEAN RUNYAN ASSOCIATES
State and Local Travel-Generated
Government Revenue, 2012 ($ Millions)
Local Hotel/Motel
$25.54%
State Gaming
$381.4
54%
Local Other
$7.6
1%
Local Gaming$36.7
5%
State Sales$121.3
17%
State Gas$78.4
11%
State Income$56.0
8%
Note: Local Other include local B&O, local sales and Passenger Facility Charge (PFC).

DEAN RUNYAN ASSOCIATES PAGE 11
2004 2006 2008 2009 2010 2011 2012
Total Direct Travel Spending ($Million)
Destination Spending 3,480 3,958 4,370 3,919 4,188 4,709 4,966
Other Travel* 114 129 131 116 125 133 136
Total Direct Spending 3,594 4,088 4,500 4,034 4,313 4,842 5,103
Visitor Spending by Type of Traveler Accommodation ($Million)
Hotel, Motel 1,102 1,232 1,413 1,207 1,336 1,443 1,544
Campground 24 28 31 28 31 35 35
Private Home 561 659 768 669 732 796 802
Vacation Home 73 84 95 86 92 99 100
Day Travel 1,720 1,955 2,062 1,928 1,997 2,336 2,485
Destination Spending 3,480 3,958 4,370 3,919 4,188 4,709 4,966
Visitor Spending by Commodity Purchased ($Million)
Accommodations 373 399 433 390 420 461 509
Food Service 667 727 791 809 842 897 939
Food Stores 162 173 191 191 197 212 221
Local Tran. & Gas 696 980 1,279 900 1,105 1,322 1,321
Arts, Ent. & Rec. 273 278 278 268 279 297 315
Gaming 835 915 916 873 839 988 1,111
Retail Sales 475 487 482 487 505 533 550
Destination Spending 3,480 3,958 4,370 3,919 4,188 4,709 4,966
Industry Earnings Generated by Travel Spending ($Million)
Accom. & Food Serv. 389 428 469 467 490 492 505
Arts, Ent. & Rec. 270 282 300 312 337 370 393
Retail** 109 115 119 121 126 130 132
Ground Tran. 14 15 16 15 15 17 17
Other Travel* 33 34 29 26 27 28 28
Total Direct Earnings 815 874 932 941 996 1,037 1,075
Industry Employment Generated by Travel Spending (Thousand Jobs)
Accom. & Food Serv. 23.4 24.8 25.3 25.2 25.3 24.9 25.0
Arts, Ent. & Rec. 12.3 12.7 12.6 13.0 13.1 14.1 14.8
Retail** 5.3 5.4 5.2 5.1 5.1 5.2 5.2
Ground Tran. 0.5 0.5 0.6 0.5 0.5 0.6 0.6
Other Travel* 1.5 1.2 1.0 0.9 0.8 0.9 0.8
Total Direct Employment 42.9 44.6 44.7 44.6 45.0 45.6 46.4
Government Revenue Generated by Travel Spending ($Million)
Local Tax Receipts 31 36 48 47 52 63 70
State Tax Receipts 526 552 557 545 534 576 637
Federal Tax Receipts 190 198 209 208 218 207 214
Total Direct Gov't Revenue 747 786 814 801 803 846 921
Details may not add to totals due to rounding.
*Other Travel includesair travel and travel agencies. **Retail includes gasoline.
West Virginia
Travel Impacts, 2004-2012

PAGE 12 DEAN RUNYAN ASSOCIATES
GROSS STATE PRODUCT
In concept, the Gross State Product (GDP) of a particular industry is equal to
gross output (sales or receipts) minus intermediate inputs (the goods and
services purchased from other industries). GDP is always smaller than output or
sales because GDP measures only the “value-added” of an industry and does
not include the cost of inputs that are also necessary to produce a good or
service. Estimates of travel spending and travel industry GDP are shown in the
chart below. For West Virginia, travel industry GDP represents about 3.2
percent of total state GDP. By way of comparison, the U.S. travel industry
comprises about 2.5 percent of national GDP.
About 57 percent of all travel spending in West Virginia is attributed to
intermediate inputs and goods resold at retail. Intermediate inputs cover a range
of goods and services that are purchased by travel industry businesses for the
purpose of creating a product or service for the traveler. For example, many
lodging establishments purchase cable television services. Restaurants purchase
food and beverages from vendors. In both cases, these inputs are classified as
the GDP of other industries. In addition, travel spending occurs at many retail
establishments where the goods purchased from the retailer are purchased as
finished goods from suppliers. These resold goods are also counted as the
products of other industries. This would include motor fuel, groceries, and most
the commodities sold at retail establishments.
West Virginia Travel Industry Gross Domestic Product, 2012
$0.6 $0.6
$0.5 $0.5
$1.1 $1.1
$2.9
$0
$1
$2
$3
$4
$5
$6
Spending ($5.1) GDP ($2.2)
Billio
ns
$2.9 Inputs
$1.1 Earnings
$0.5 Other Surplus
$0.6 Gov't Revenue
Source: Dean Runyan Associates and Bureau of Economic Analysis

DEAN RUNYAN ASSOCIATES PAGE 13
Gross Domestic Product of West Virginia Export-Orientated Industries
Export-orientated industries are those industries that primarily market their products
and services to other regions, states, or nations. Mining, manufacturing, and
chemicals are the best examples of export-orientated industries. Clearly, there are
cases in each of these three sectors where the products are sold within the local or
regional market. Nonetheless, in general most businesses within these industries
depend on export markets. The travel industry is also an export-orientated industry
because goods and services are sold to visitors, rather than residents. The travel
industry injects money into the local economy, as do exports of other industries.
A comparison of the GDP’s of the leading export-orientated industries in West
Virginia is shown below. The comparison years are for 2010 and 2011 – data for
2012 is not yet available for the comparison industries.
West Virginia Gross Domestic Product, 2010 & 2011 Selected Export-Orientated Industries
$1.9
$1.0
$2.3
$2.3
$6.3
$2.1
$1.0
$2.4
$2.5
$7.3
$0 $2 $4 $6 $8
Travel
All Other Manf
Chemical manufacturing
Durable goods
Mining
Gross Domestic Product (Billions)
2011
2010

This page intentionally blank

DEAN RUNYAN ASSOCIATES PAGE 15
III. Regional Travel Impacts
2004-2012

PAGE 16 DEAN RUNYAN ASSOCIATES
The tables in this section provide detailed estimates for the regions of West Virginia
for 2000-2012. The geographic definitions of the regions are shown below.
West Virginia’s Tourism Regions
Northern Panhandle Mid-Ohio Valley Metro Valley
Brooke Calhoun Cabell
Hancock Jackson Kanawha
Marshall Pleasants Mason
Ohio Ritchie Putnam
Tyler Roane
Wetzel Wirt
Wood
Mountain Lakes New River/Greenbrier Valley Potomac Highlands
Braxton Fayette Grant
Clay Greenbrier Hampshire
Gilmer McDowell Hardy
Lewis Mercer Mineral
Nicholas Monroe Pendleton
Upshur Raleigh Pocahontas
Webster Summers Randolph
Wyoming Tucker
Eastern Panhandle Mountaineer Country Hatfield-McCoy MountainsBerkeley Barbour Boone
Jefferson Doddridge Lincoln
Morgan Harrison Logan
Marion Mingo
Monongalia Wayne
Preston
Taylor

DEAN RUNYAN ASSOCIATES PAGE 17
2004 2006 2008 2009 2010 2011 2012
Total Direct Travel Spending ($Million)
Destination Spending 815 847 874 847 801 910 992
Other Travel* 4 5 5 4 3 4 5
Total Direct Spending 819 852 879 851 804 914 996
Visitor Spending by Type of Traveler Accommodation ($Million)
Hotel, Motel 98 102 137 116 118 106 117
Campground 0 0 0 0 1 1 1
Private Home 45 51 57 51 54 58 58
Vacation Home 3 4 5 4 4 5 5
Day Travel 668 690 675 676 625 741 812
Destination Spending 815 847 874 847 801 910 992
Visitor Spending by Commodity Purchased ($Million)
Accommodations 31 32 37 36 38 41 46
Food Service 150 156 164 175 181 194 204
Food Stores 30 31 33 35 35 38 40
Local Tran. & Gas 55 79 104 71 89 107 107
Arts, Ent. & Rec. 17 17 13 18 19 23 24
Gaming 439 440 436 418 345 405 464
Retail Sales 93 92 87 92 95 102 106
Destination Spending 815 847 874 847 801 910 992
Industry Earnings Generated by Travel Spending ($Million)
Accom. & Food Serv. 67.5 70.1 75.2 80.8 83.0 84.2 87.7
Arts, Ent. & Rec. 77.5 72.7 79.5 86.3 75.3 82.8 85.6
Retail** 17.3 17.4 17.3 18.2 18.8 19.7 20.2
Ground Tran. 0.0 0.0 0.0 0.0 0.0 0.0 0.0
Other Travel* 2.1 2.4 2.4 2.2 1.5 2.0 2.5
Total Direct Earnings 164.5 162.6 174.4 187.5 178.6 188.6 195.9
Industry Employment Generated by Travel Spending (Thousand Jobs)
Accom. & Food Serv. 4.8 5.1 4.8 5.2 5.3 5.3 5.5
Arts, Ent. & Rec. 3.0 2.9 2.9 3.1 2.6 2.8 2.8
Retail** 0.9 0.9 0.8 0.8 0.8 0.8 0.8
Ground Tran. 0.0 0.0 0.0 0.0 0.0 0.0 0.0
Other Travel* 0.1 0.1 0.1 0.1 0.1 0.0 0.0
Total Direct Employment 8.8 9.0 8.7 9.2 8.7 9.0 9.1
Government Revenue Generated by Travel Spending ($Million)
Local Tax Receipts 9.9 10.3 12.8 12.5 11.4 13.7 16.1
State Tax Receipts 191.5 189.7 173.1 171.2 145.2 174.0 226.0
Total Direct Gov't Revenue 201.3 200.0 185.8 183.7 156.6 187.8 242.0
Details may not add to totals due to rounding.
*Other Travel includesair travel and travel agencies. **Retail includes gasoline.
Northern Panhandle
Travel Impacts, 2004-2012

PAGE 18 DEAN RUNYAN ASSOCIATES
2004 2006 2008 2009 2010 2011 2012
Total Direct Travel Spending ($Million)
Destination Spending 142 164 193 161 178 196 204
Other Travel* 3 5 5 2 5 2 4
Total Direct Spending 145 169 198 163 182 198 208
Visitor Spending by Type of Traveler Accommodation ($Million)
Hotel, Motel 52 55 65 54 58 62 70
Campground 1 2 2 2 2 2 2
Private Home 48 58 67 58 64 71 70
Vacation Home 6 6 7 6 7 8 8
Day Travel 35 43 52 41 47 53 54
Destination Spending 142 164 193 161 178 196 204
Visitor Spending by Commodity Purchased ($Million)
Accommodations 17 16 18 16 16 17 20
Food Service 28 29 32 32 32 33 35
Food Stores 8 8 9 9 9 9 10
Local Tran. & Gas 51 73 97 66 82 99 99
Arts, Ent. & Rec. 15 15 15 15 15 15 16
Gaming 0 0 0 0 0 0 0
Retail Sales 23 23 23 23 23 23 24
Destination Spending 142 164 193 161 178 196 204
Industry Earnings Generated by Travel Spending ($Million)
Accom. & Food Serv. 16.1 16.2 17.8 17.8 17.8 17.1 18.5
Arts, Ent. & Rec. 7.1 7.0 7.4 8.2 9.0 8.7 9.3
Retail** 6.4 6.5 6.8 6.9 7.1 7.2 7.4
Ground Tran. 0.0 0.0 0.0 0.0 0.0 0.0 0.0
Other Travel* 1.7 2.7 2.7 1.1 2.3 1.1 2.0
Total Direct Earnings 31.3 32.4 34.8 34.0 36.3 34.1 37.3
Industry Employment Generated by Travel Spending (Thousand Jobs)
Accom. & Food Serv. 1.1 1.1 1.1 1.1 1.0 1.0 1.0
Arts, Ent. & Rec. 0.5 0.5 0.4 0.5 0.5 0.5 0.5
Retail** 0.3 0.3 0.3 0.3 0.3 0.3 0.3
Ground Tran. 0.0 0.0 0.0 0.0 0.0 0.0 0.0
Other Travel* 0.1 0.1 0.1 0.0 0.1 0.0 0.1
Total Direct Employment 1.9 1.9 2.0 1.9 1.9 1.8 1.9
Government Revenue Generated by Travel Spending ($Million)
Local Tax Receipts 0.6 0.7 1.5 1.5 1.6 2.0 2.2
State Tax Receipts 10.5 11.1 12.5 11.9 12.4 12.3 13.0
Total Direct Gov't Revenue 11.2 11.7 14.0 13.3 14.1 14.2 15.2
Details may not add to totals due to rounding.
*Other Travel includesair travel and travel agencies. **Retail includes gasoline.
Travel Impacts, 2004-2012
Mid-Ohio Valley

DEAN RUNYAN ASSOCIATES PAGE 19
2004 2006 2008 2009 2010 2011 2012
Total Direct Travel Spending ($Million)
Destination Spending 558 651 731 675 733 781 811
Other Travel* 75 87 82 71 76 81 82
Total Direct Spending 633 737 814 746 808 862 893
Visitor Spending by Type of Traveler Accommodation ($Million)
Hotel, Motel 231 284 314 310 333 338 357
Campground 1 1 1 1 1 1 1
Private Home 131 152 178 154 168 186 188
Vacation Home 4 5 5 5 5 6 6
Day Travel 191 209 233 206 225 250 259
Destination Spending 558 651 731 675 733 781 811
Visitor Spending by Commodity Purchased ($Million)
Accommodations 72 84 88 93 97 97 106
Food Service 102 112 120 130 134 133 139
Food Stores 21 23 25 26 27 27 29
Local Tran. & Gas 198 265 333 252 299 351 352
Arts, Ent. & Rec. 46 49 49 53 54 53 55
Gaming 44 42 42 43 42 40 46
Retail Sales 74 76 74 79 81 80 83
Destination Spending 558 651 731 675 733 781 811
Industry Earnings Generated by Travel Spending ($Million)
Accom. & Food Serv. 63.1 70.6 76.3 83.7 85.9 80.1 83.8
Arts, Ent. & Rec. 31.1 31.5 33.0 39.6 43.4 41.6 44.6
Retail** 17.9 18.7 19.3 20.4 21.1 21.0 21.5
Ground Tran. 13.9 14.9 15.5 14.9 15.3 16.6 17.0
Other Travel* 13.6 14.4 11.6 10.3 10.4 10.7 10.0
Total Direct Earnings 139.6 150.2 155.8 168.9 176.2 170.0 176.9
Industry Employment Generated by Travel Spending (Thousand Jobs)
Accom. & Food Serv. 3.5 3.8 3.7 4.0 4.0 3.6 3.6
Arts, Ent. & Rec. 1.7 1.7 1.6 1.8 1.9 1.8 2.0
Retail** 0.8 0.9 0.8 0.8 0.8 0.8 0.8
Ground Tran. 0.5 0.5 0.6 0.5 0.5 0.6 0.6
Other Travel* 0.6 0.5 0.4 0.3 0.3 0.3 0.3
Total Direct Employment 7.1 7.3 7.1 7.5 7.5 7.1 7.3
Government Revenue Generated by Travel Spending ($Million)
Local Tax Receipts 4.3 5.9 7.2 7.7 8.2 8.6 9.6
State Tax Receipts 51.8 54.5 58.2 57.8 59.1 59.1 61.7
Total Direct Gov't Revenue 56.0 60.4 65.4 65.6 67.3 67.7 71.3
Details may not add to totals due to rounding.
*Other Travel includesair travel and travel agencies. **Retail includes gasoline.
Metro Valley
Travel Impacts, 2004-2012

PAGE 20 DEAN RUNYAN ASSOCIATES
2004 2006 2008 2009 2010 2011 2012
Total Direct Travel Spending ($Million)
Destination Spending 136 162 196 167 189 216 215
Other Travel* 2 2 2 1 1 2 1
Total Direct Spending 138 164 197 168 190 217 216
Visitor Spending by Type of Traveler Accommodation ($Million)
Hotel, Motel 56 65 80 71 82 96 94
Campground 6 7 8 7 8 9 9
Private Home 32 39 45 38 42 46 47
Vacation Home 9 11 12 11 12 12 13
Day Travel 32 41 50 40 46 52 52
Destination Spending 136 162 196 167 189 216 215
Visitor Spending by Commodity Purchased ($Million)
Accommodations 19 20 23 23 25 29 29
Food Service 24 25 29 30 32 35 34
Food Stores 9 9 10 10 11 12 12
Local Tran. & Gas 51 73 97 66 83 99 99
Arts, Ent. & Rec. 14 15 16 16 17 18 17
Gaming 0 0 0 0 0 0 0
Retail Sales 20 20 21 21 22 23 23
Destination Spending 136 162 196 167 189 216 215
Industry Earnings Generated by Travel Spending ($Million)
Accom. & Food Serv. 15.0 16.0 18.7 19.4 20.7 21.7 21.1
Arts, Ent. & Rec. 8.1 8.4 9.1 10.5 12.2 12.8 12.7
Retail** 5.9 6.2 6.6 6.8 7.2 7.4 7.4
Ground Tran. 0.0 0.0 0.0 0.0 0.0 0.0 0.0
Other Travel* 0.8 0.9 1.0 0.4 0.3 0.8 0.7
Total Direct Earnings 29.8 31.5 35.4 37.1 40.4 42.7 41.9
Industry Employment Generated by Travel Spending (Thousand Jobs)
Accom. & Food Serv. 1.0 1.1 1.1 1.1 1.2 1.2 1.1
Arts, Ent. & Rec. 0.5 0.5 0.5 0.5 0.6 0.6 0.6
Retail** 0.3 0.3 0.3 0.3 0.3 0.3 0.3
Ground Tran. 0.0 0.0 0.0 0.0 0.0 0.0 0.0
Other Travel* 0.0 0.0 0.0 0.0 0.0 0.0 0.0
Total Direct Employment 1.9 1.9 2.0 2.0 2.1 2.1 2.1
Government Revenue Generated by Travel Spending ($Million)
Local Tax Receipts 0.6 0.7 1.6 1.6 1.9 2.4 2.6
State Tax Receipts 10.0 10.7 12.5 12.1 12.9 13.5 13.5
Total Direct Gov't Revenue 10.6 11.4 14.1 13.8 14.8 15.9 16.0
Details may not add to totals due to rounding.
*Other Travel includesair travel and travel agencies. **Retail includes gasoline.
Mountain Lakes
Travel Impacts, 2004-2012

DEAN RUNYAN ASSOCIATES PAGE 21
2004 2006 2008 2009 2010 2011 2012
Total Direct Travel S pending ($Million)
Des tination S pending 529 592 669 495 577 651 694
Other Travel* 7 6 8 7 7 9 8
Total Direct S pending 536 598 677 502 584 660 702
Vis itor S pending by Type of Traveler Accommodation ($Million)
Hotel, Motel 309 336 375 250 302 344 381
Campground 6 6 7 6 7 8 8
Private Home 96 112 129 116 127 139 139
Vacation Home 10 11 12 12 12 13 13
Day Travel 108 126 147 111 129 147 153
Des tination S pending 529 592 669 495 577 651 694
Vis itor S pending by Commodity Purchas ed ($Million)
Accommodations 106 111 119 80 93 107 123
Food S ervice 107 112 123 100 111 120 131
Food S tores 26 26 29 25 27 29 31
Local Tran. & Gas 123 177 234 161 200 241 240
Arts , E nt. & Rec. 88 87 85 65 69 70 76
Gaming 0 0 0 1 7 9 12
Retail S ales 78 78 78 64 70 75 80
Des tination S pending 529 592 669 495 577 651 694
Indus try E arnings Generated by Travel S pending ($Million)
Accom. & Food S erv. 82.9 92.6 100.6 75.2 85.8 89.8 88.9
Arts , E nt. & Rec. 50.4 53.4 53.0 42.8 55.2 58.7 56.8
Retail** 18.4 19.3 20.0 18.1 19.5 20.3 21.1
Ground Tran. 0.0 0.0 0.0 0.0 0.0 0.0 0.0
Other Travel* 3.7 3.3 4.2 3.8 3.6 4.5 4.1
Total Direct E arnings 155.4 168.6 177.7 139.9 164.0 173.2 170.9
Indus try E mployment Generated by Travel S pending (Thous and J obs )
Accom. & Food S erv. 3.8 4.0 4.2 3.2 3.4 3.5 3.4
Arts , E nt. & Rec. 2.3 2.2 2.2 1.9 2.1 2.2 2.1
Retail** 0.8 0.8 0.8 0.7 0.7 0.7 0.8
Ground Tran. 0.0 0.0 0.0 0.0 0.0 0.0 0.0
Other Travel* 0.2 0.1 0.2 0.1 0.1 0.2 0.1
Total Direct E mployment 7.1 7.1 7.4 6.0 6.4 6.6 6.4
Government Revenue Generated by Travel S pending ($Million)
Local Tax Receipts 3.4 3.7 6.0 4.9 5.9 7.2 7.8
S tate Tax Receipts 37.7 39.5 43.7 36.3 41.5 44.5 47.3
Total Direct Gov't Revenue 41.1 43.2 49.7 41.2 47.4 51.7 55.1
Details may not add to totals due to rounding.
*Other Travel includes air travel and travel agencies . **R etail includes gas oline.
New River/Greenbrier Valley
Travel Impacts , 2004-2012

PAGE 22 DEAN RUNYAN ASSOCIATES
2004 2006 2008 2009 2010 2011 2012
Total Direct Travel Spending ($Million)
Destination Spending 233 246 291 251 272 275 276
Other Travel* 3 2 2 2 2 2 2
Total Direct Spending 236 248 293 253 274 277 278
Visitor Spending by Type of Traveler Accommodation ($Million)
Hotel, Motel 123 119 146 126 135 127 127
Campground 4 4 4 4 5 5 5
Private Home 35 41 46 41 44 48 49
Vacation Home 25 28 31 29 30 33 33
Day Travel 47 53 63 52 58 62 62
Destination Spending 233 246 291 251 272 275 276
Visitor Spending by Commodity Purchased ($Million)
Accommodations 49 47 56 48 50 47 48
Food Service 49 49 58 55 57 54 54
Food Stores 21 21 24 24 24 24 25
Local Tran. & Gas 42 60 79 54 68 82 81
Arts, Ent. & Rec. 32 31 34 32 33 30 30
Gaming 0 0 0 0 0 0 0
Retail Sales 40 39 41 39 40 39 38
Destination Spending 233 246 291 251 272 275 276
Industry Earnings Generated by Travel Spending ($Million)
Accom. & Food Serv. 33.8 33.9 40.6 37.7 39.0 34.3 34.1
Arts, Ent. & Rec. 14.0 13.7 15.4 16.5 18.8 17.5 17.4
Retail** 11.3 11.2 12.2 11.9 12.3 11.9 11.9
Ground Tran. 0.0 0.0 0.0 0.0 0.0 0.0 0.0
Other Travel* 1.3 0.9 0.9 0.8 1.3 1.2 1.1
Total Direct Earnings 60.3 59.7 69.1 66.9 71.4 65.0 64.4
Industry Employment Generated by Travel Spending (Thousand Jobs)
Accom. & Food Serv. 2.1 2.1 2.3 2.2 2.2 1.9 1.9
Arts, Ent. & Rec. 1.0 1.0 1.0 1.1 1.1 1.0 1.1
Retail** 0.5 0.5 0.5 0.5 0.5 0.5 0.5
Ground Tran. 0.0 0.0 0.0 0.0 0.0 0.0 0.0
Other Travel* 0.1 0.0 0.0 0.0 0.0 0.0 0.0
Total Direct Employment 3.7 3.6 3.9 3.8 3.8 3.5 3.5
Government Revenue Generated by Travel Spending ($Million)
Local Tax Receipts 1.4 1.3 3.4 3.0 3.3 3.6 3.8
State Tax Receipts 15.9 15.8 18.4 17.1 18.0 17.1 17.0
Total Direct Gov't Revenue 17.3 17.1 21.7 20.1 21.3 20.7 20.7
Details may not add to totals due to rounding.
*Other Travel includesair travel and travel agencies. **Retail includes gasoline.
Potomac Highlands
Travel Impacts, 2004-2012

DEAN RUNYAN ASSOCIATES PAGE 23
2004 2006 2008 2009 2010 2011 2012
Total Direct Travel Spending ($Million)
Destination Spending 685 839 899 860 915 1,057 1,116
Other Travel* 5 3 3 5 5 5 5
Total Direct Spending 690 842 902 865 920 1,062 1,120
Visitor Spending by Type of Traveler Accommodation ($Million)
Hotel, Motel 91 104 128 109 111 104 101
Campground 1 1 1 1 1 1 1
Private Home 39 46 52 50 55 59 61
Vacation Home 8 9 10 10 10 11 11
Day Travel 547 680 708 691 738 882 941
Destination Spending 685 839 899 860 915 1,057 1,116
Visitor Spending by Commodity Purchased ($Million)
Accommodations 30 34 41 35 35 37 36
Food Service 128 158 176 189 192 209 210
Food Stores 28 34 38 40 40 44 45
Local Tran. & Gas 44 63 83 57 71 86 85
Arts, Ent. & Rec. 20 22 24 23 23 26 25
Gaming 352 432 438 412 449 543 601
Retail Sales 83 96 98 103 105 113 113
Destination Spending 685 839 899 860 915 1,057 1,116
Industry Earnings Generated by Travel Spending ($Million)
Accom. & Food Serv. 63.3 76.9 87.2 92.4 93.2 95.5 94.0
Arts, Ent. & Rec. 61.0 73.1 80.0 81.2 91.7 113.3 129.1
Retail** 15.4 17.9 18.7 19.6 20.0 21.1 20.9
Ground Tran. 0.0 0.0 0.0 0.0 0.0 0.0 0.0
Other Travel* 2.7 1.4 1.8 2.8 2.7 2.6 2.4
Total Direct Earnings 142.4 169.3 187.7 196.0 207.6 232.4 246.3
Industry Employment Generated by Travel Spending (Thousand Jobs)
Accom. & Food Serv. 3.8 4.5 5.0 5.0 4.8 4.9 4.7
Arts, Ent. & Rec. 2.3 2.9 3.0 2.9 3.2 3.8 4.2
Retail** 0.7 0.8 0.7 0.8 0.8 0.8 0.8
Ground Tran. 0.0 0.0 0.0 0.0 0.0 0.0 0.0
Other Travel* 0.1 0.1 0.1 0.1 0.1 0.1 0.1
Total Direct Employment 7.0 8.2 8.8 8.8 8.9 9.5 9.8
Government Revenue Generated by Travel Spending ($Million)
Local Tax Receipts 9.1 10.1 11.5 11.1 13.8 18.0 19.3
State Tax Receipts 180.0 200.6 205.7 205.2 208.7 216.1 216.9
Total Direct Gov't Revenue 189.0 210.7 217.2 216.3 222.5 234.0 236.3
Details may not add to totals due to rounding.
*Other Travel includesair travel and travel agencies. **Retail includes gasoline.
Travel Impacts, 2004-2012
Eastern Panhandle

PAGE 24 DEAN RUNYAN ASSOCIATES
2004 2006 2008 2009 2010 2011 2012
Total Direct Travel Spending ($Million)
Destination Spending 265 313 348 331 372 444 479
Other Travel* 7 8 7 7 7 7 7
Total Direct Spending 272 322 355 337 379 451 487
Visitor Spending by Type of Traveler Accommodation ($Million)
Hotel, Motel 122 144 149 160 184 237 269
Campground 2 2 3 2 3 3 3
Private Home 76 88 105 89 96 101 101
Vacation Home 7 8 9 8 8 9 9
Day Travel 58 71 83 71 81 94 97
Destination Spending 265 313 348 331 372 444 479
Visitor Spending by Commodity Purchased ($Million)
Accommodations 43 48 47 55 61 79 93
Food Service 58 63 66 76 81 94 104
Food Stores 14 15 16 18 19 22 24
Local Tran. & Gas 75 108 143 98 122 147 147
Arts, Ent. & Rec. 31 32 32 36 38 43 47
Gaming 0 0 0 0 0 0 0
Retail Sales 45 46 45 49 52 59 64
Destination Spending 265 313 348 331 372 444 479
Industry Earnings Generated by Travel Spending ($Million)
Accom. & Food Serv. 37.8 41.6 42.9 50.6 54.6 58.4 65.2
Arts, Ent. & Rec. 17.3 18.4 18.3 23.1 27.2 29.1 32.0
Retail** 11.1 11.6 11.8 12.8 13.6 14.7 15.5
Ground Tran. 0.0 0.0 0.0 0.0 0.0 0.0 0.0
Other Travel* 3.3 3.7 2.5 2.4 2.5 2.5 2.6
Total Direct Earnings 69.4 75.3 75.6 88.9 97.8 104.7 115.3
Industry Employment Generated by Travel Spending (Thousand Jobs)
Accom. & Food Serv. 2.4 2.5 2.4 2.7 2.8 2.9 3.1
Arts, Ent. & Rec. 0.9 0.9 0.8 1.0 1.1 1.1 1.2
Retail** 0.6 0.6 0.6 0.6 0.6 0.6 0.6
Ground Tran. 0.0 0.0 0.0 0.0 0.0 0.0 0.0
Other Travel* 0.1 0.1 0.1 0.1 0.1 0.1 0.1
Total Direct Employment 4.0 4.1 3.8 4.3 4.5 4.7 5.1
Government Revenue Generated by Travel Spending ($Million)
Local Tax Receipts 1.6 2.6 3.3 3.9 4.5 6.3 7.2
State Tax Receipts 19.2 20.9 22.4 23.6 25.4 28.0 30.2
Total Direct Gov't Revenue 20.8 23.5 25.7 27.5 29.9 34.3 37.4
Details may not add to totals due to rounding.
*Other Travel includesair travel and travel agencies. **Retail includes gasoline.
Travel Impacts, 2004-2012
Mountaineer Country
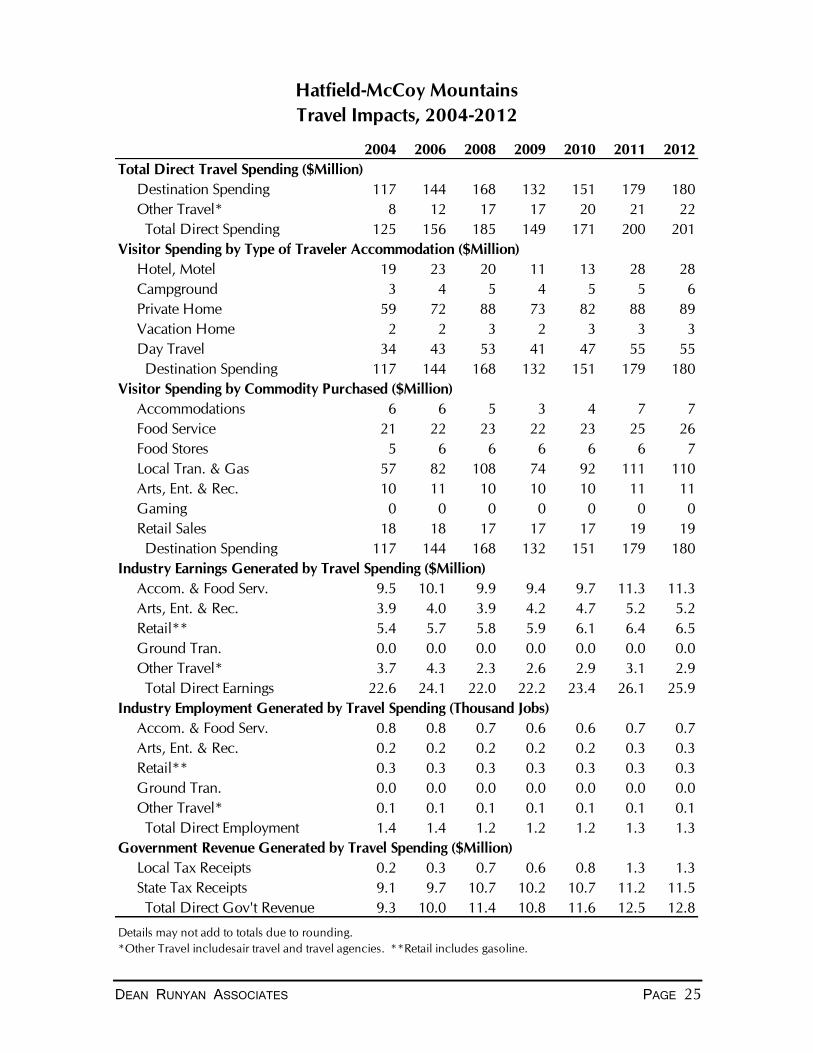
DEAN RUNYAN ASSOCIATES PAGE 25
2004 2006 2008 2009 2010 2011 2012
Total Direct Travel Spending ($Million)
Destination Spending 117 144 168 132 151 179 180
Other Travel* 8 12 17 17 20 21 22
Total Direct Spending 125 156 185 149 171 200 201
Visitor Spending by Type of Traveler Accommodation ($Million)
Hotel, Motel 19 23 20 11 13 28 28
Campground 3 4 5 4 5 5 6
Private Home 59 72 88 73 82 88 89
Vacation Home 2 2 3 2 3 3 3
Day Travel 34 43 53 41 47 55 55
Destination Spending 117 144 168 132 151 179 180
Visitor Spending by Commodity Purchased ($Million)
Accommodations 6 6 5 3 4 7 7
Food Service 21 22 23 22 23 25 26
Food Stores 5 6 6 6 6 6 7
Local Tran. & Gas 57 82 108 74 92 111 110
Arts, Ent. & Rec. 10 11 10 10 10 11 11
Gaming 0 0 0 0 0 0 0
Retail Sales 18 18 17 17 17 19 19
Destination Spending 117 144 168 132 151 179 180
Industry Earnings Generated by Travel Spending ($Million)
Accom. & Food Serv. 9.5 10.1 9.9 9.4 9.7 11.3 11.3
Arts, Ent. & Rec. 3.9 4.0 3.9 4.2 4.7 5.2 5.2
Retail** 5.4 5.7 5.8 5.9 6.1 6.4 6.5
Ground Tran. 0.0 0.0 0.0 0.0 0.0 0.0 0.0
Other Travel* 3.7 4.3 2.3 2.6 2.9 3.1 2.9
Total Direct Earnings 22.6 24.1 22.0 22.2 23.4 26.1 25.9
Industry Employment Generated by Travel Spending (Thousand Jobs)
Accom. & Food Serv. 0.8 0.8 0.7 0.6 0.6 0.7 0.7
Arts, Ent. & Rec. 0.2 0.2 0.2 0.2 0.2 0.3 0.3
Retail** 0.3 0.3 0.3 0.3 0.3 0.3 0.3
Ground Tran. 0.0 0.0 0.0 0.0 0.0 0.0 0.0
Other Travel* 0.1 0.1 0.1 0.1 0.1 0.1 0.1
Total Direct Employment 1.4 1.4 1.2 1.2 1.2 1.3 1.3
Government Revenue Generated by Travel Spending ($Million)
Local Tax Receipts 0.2 0.3 0.7 0.6 0.8 1.3 1.3
State Tax Receipts 9.1 9.7 10.7 10.2 10.7 11.2 11.5
Total Direct Gov't Revenue 9.3 10.0 11.4 10.8 11.6 12.5 12.8
Details may not add to totals due to rounding.
*Other Travel includesair travel and travel agencies. **Retail includes gasoline.
Hatfield-McCoy Mountains
Travel Impacts, 2004-2012
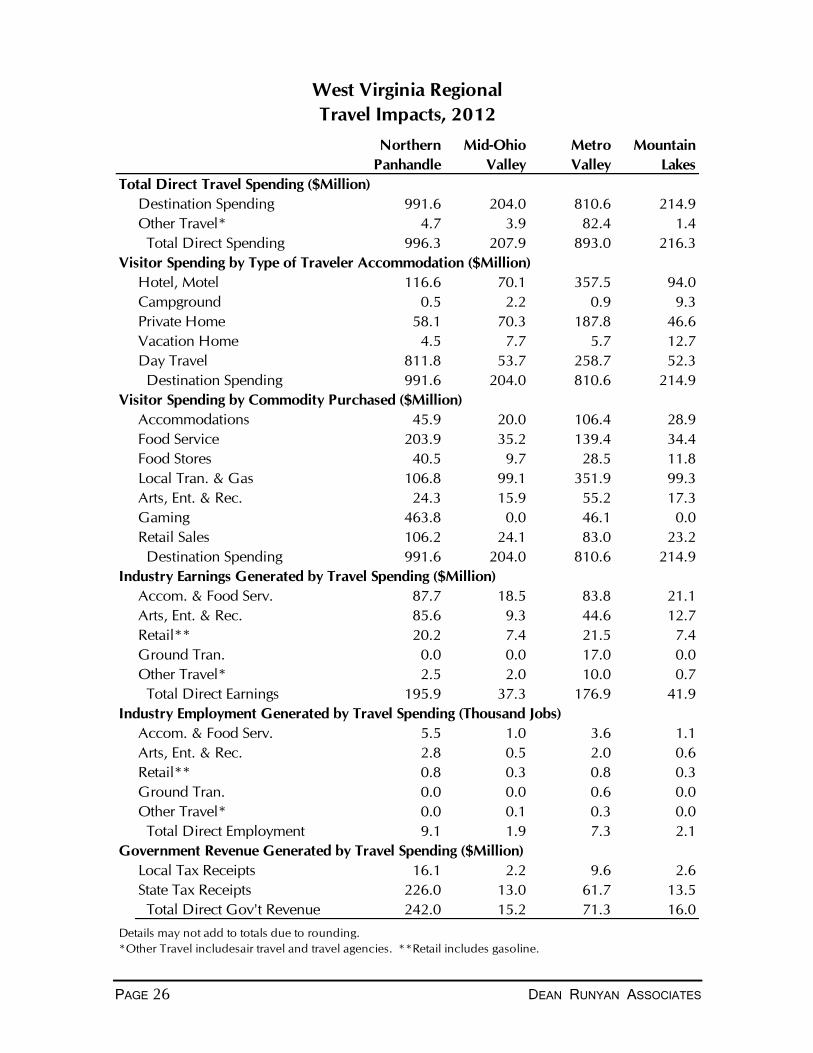
PAGE 26 DEAN RUNYAN ASSOCIATES
Northern
Panhandle
Mid-Ohio
Valley
Metro
Valley
Mountain
Lakes
Total Direct Travel Spending ($Million)
Destination Spending 991.6 204.0 810.6 214.9
Other Travel* 4.7 3.9 82.4 1.4
Total Direct Spending 996.3 207.9 893.0 216.3
Hotel, Motel 116.6 70.1 357.5 94.0
Campground 0.5 2.2 0.9 9.3
Private Home 58.1 70.3 187.8 46.6
Vacation Home 4.5 7.7 5.7 12.7
Day Travel 811.8 53.7 258.7 52.3
Destination Spending 991.6 204.0 810.6 214.9
Accommodations 45.9 20.0 106.4 28.9
Food Service 203.9 35.2 139.4 34.4
Food Stores 40.5 9.7 28.5 11.8
Local Tran. & Gas 106.8 99.1 351.9 99.3
Arts, Ent. & Rec. 24.3 15.9 55.2 17.3
Gaming 463.8 0.0 46.1 0.0
Retail Sales 106.2 24.1 83.0 23.2
Destination Spending 991.6 204.0 810.6 214.9
Accom. & Food Serv. 87.7 18.5 83.8 21.1
Arts, Ent. & Rec. 85.6 9.3 44.6 12.7
Retail** 20.2 7.4 21.5 7.4
Ground Tran. 0.0 0.0 17.0 0.0
Other Travel* 2.5 2.0 10.0 0.7
Total Direct Earnings 195.9 37.3 176.9 41.9
Accom. & Food Serv. 5.5 1.0 3.6 1.1
Arts, Ent. & Rec. 2.8 0.5 2.0 0.6
Retail** 0.8 0.3 0.8 0.3
Ground Tran. 0.0 0.0 0.6 0.0
Other Travel* 0.0 0.1 0.3 0.0
Total Direct Employment 9.1 1.9 7.3 2.1
Local Tax Receipts 16.1 2.2 9.6 2.6
State Tax Receipts 226.0 13.0 61.7 13.5
Total Direct Gov't Revenue 242.0 15.2 71.3 16.0
Details may not add to totals due to rounding.
*Other Travel includesair travel and travel agencies. **Retail includes gasoline.
West Virginia Regional
Travel Impacts, 2012
Industry Earnings Generated by Travel Spending ($Million)
Industry Employment Generated by Travel Spending (Thousand Jobs)
Visitor Spending by Type of Traveler Accommodation ($Million)
Visitor Spending by Commodity Purchased ($Million)
Government Revenue Generated by Travel Spending ($Million)

DEAN RUNYAN ASSOCIATES PAGE 27
New River/
Greenbrier
Potomac
Highlands
Eastern
Panhandle
Mountaineer
Country
Hatfield-
McCoy Mts.
Total Direct Travel Spending ($Million)
Destination Spending 694.4 276.3 1,115.7 479.1 179.7
Other Travel* 8.0 2.1 4.7 7.5 21.7
Total Direct Spending 702.4 278.4 1,120.4 486.6 201.4
Hotel, Motel 381.2 126.9 100.9 269.1 27.9
Campground 8.0 5.1 0.7 3.0 5.7
Private Home 139.3 49.0 61.3 100.8 88.6
Vacation Home 13.1 33.1 11.5 9.0 2.9
Day Travel 152.8 62.3 941.4 97.2 54.6
Destination Spending 694.4 276.3 1,115.7 479.1 179.7
Accommodations 123.4 47.7 36.3 93.5 7.2
Food Service 131.3 54.0 210.2 104.4 25.8
Food Stores 31.2 24.5 44.7 23.7 6.6
Local Tran. & Gas 240.2 81.5 85.5 146.5 110.5
Arts, Ent. & Rec. 75.5 30.2 25.4 47.3 10.9
Gaming 12.4 0.0 600.6 0.0 0.0
Retail Sales 80.2 38.5 112.9 63.7 18.7
Destination Spending 694.4 276.3 1,115.7 479.1 179.7
Industry Earnings Generated by Travel Spending ($Million)
Accom. & Food Serv. 88.9 34.1 94.0 65.2 11.3
Arts, Ent. & Rec. 56.8 17.4 129.1 32.0 5.2
Retail** 21.1 11.9 20.9 15.5 6.5
Ground Tran. 0.0 0.0 0.0 0.0 0.0
Other Travel* 4.1 1.1 2.4 2.6 2.9
Total Direct Earnings 170.9 64.4 246.3 115.3 25.9
Industry Employment Generated by Travel Spending (Thousand Jobs)
Accom. & Food Serv. 3.4 1.9 4.7 3.1 0.7
Arts, Ent. & Rec. 2.1 1.1 4.2 1.2 0.3
Retail** 0.8 0.5 0.8 0.6 0.3
Ground Tran. 0.0 0.0 0.0 0.0 0.0
Other Travel* 0.1 0.0 0.1 0.1 0.1
Total Direct Employment 6.4 3.5 9.8 5.1 1.3
Government Revenue Generated by Travel Spending ($Million)
Local Tax Receipts 7.8 3.8 19.3 7.2 1.3
State Tax Receipts 47.3 17.0 216.9 30.2 11.5
Total Direct Gov't Revenue 55.1 20.7 236.3 37.4 12.8
Details may not add to totals due to rounding.
*Other Travel includesair travel and travel agencies. **Retail includes gasoline.
West Virginia Regional
Travel Impacts, 2012
Visitor Spending by Type of Traveler Accommodation ($Million)
Visitor Spending by Commodity Purchased ($Million)

This page intentionally blank

DEAN RUNYAN ASSOCIATES PAGE 29
IV. County Travel Impacts
2004-2012

PAGE 30 DEAN RUNYAN ASSOCIATES
The analysis of travel impacts at the county level provides a valuable overview of
how the economic benefits of travel and tourism are distributed throughout the state.
Travel impacts, in absolute terms, are highest in the state’s most urban area
(Charleston metropolitan area in Kanawha County), which offers visitors a variety of
commercial lodging accommodations and entertainment facilities. However, the size
of the travel industry in relation to the total economy of a locale is more significant in
some smaller communities and rural areas of the state, which tend to be more
orientated to scenic and outdoor recreational opportunities. For example, in the
counties of Greenbrier, Tucker, and Pocahontas the travel industry is an extremely
significant component of the total local economy.
Day travelers are particularly notable for some areas. Day visitors are most significant
in the counties of Hancock, Ohio, and Jefferson where the racetracks lie within close
proximity to major population centers in Pennsylvania, Maryland, and Washington
D.C. Shopping destination areas also receive a higher proportion of day visitation,
and visitors tend to spend a higher proportion of their total spending on retail
expenditures.
Travel Generated Earnings
The significance of the visitor impact to local economies can be very substantial in
some of the state’s destination areas. A useful measure of the relative significance of
the visitor impact in each area is travel-generated earnings in relation to total earnings
(See the table on page 36-37). A high percentage of travel-generated earnings
indicate a relatively high reliance on income generated from visitor spending.

DEAN RUNYAN ASSOCIATES PAGE 31
2004 2006 2008 2009 2010 2011 2012
Barbour
Direct Spending ($Million) 11.3 13.5 16.0 13.7 15.3 17.2 17.2
Earnings ($Million) 1.9 2.0 2.1 2.3 2.4 2.5 2.4
Employment (jobs) 150 150 140 140 150 150 140
Local Govt. Revenue ($000) 15 16 91 102 129 181 188
State Govt. Revenue ($000) 817 865 987 979 1,029 1,039 1,046
Berkeley
Direct Spending ($Million) 91.3 108.9 139.3 114.2 122.4 132.5 131.2
Earnings ($Million) 20.4 21.5 27.6 26.4 26.6 25.8 25.1
Employment (jobs) 1,120 1,080 1,340 1,230 1,230 1,180 1,160
Local Govt. Revenue ($000) 451 590 1,088 1,001 999 1,054 1,028
State Govt. Revenue ($000) 6,544 7,085 8,824 8,093 8,267 8,244 8,183
Boone
Direct Spending ($Million) 21.0 27.1 33.5 25.2 29.5 34.0 34.1
Earnings ($Million) 2.6 2.7 2.9 2.8 3.0 2.9 3.0
Employment (jobs) 170 170 160 160 160 160 150
Local Govt. Revenue ($000) 9 10 82 84 112 167 175
State Govt. Revenue ($000) 1,684 1,820 2,125 1,998 2,099 2,086 2,156
Braxton
Direct Spending ($Million) 25.8 31.0 36.7 31.3 36.4 40.6 40.2
Earnings ($Million) 5.8 6.0 6.4 7.2 8.2 8.1 7.8
Employment (jobs) 320 330 320 350 360 340 320
Local Govt. Revenue ($000) 86 90 166 181 227 289 397
State Govt. Revenue ($000) 1,903 2,012 2,293 2,283 2,476 2,489 2,481
Brooke
Direct Spending ($Million) 13.6 16.0 18.4 15.6 16.1 17.8 17.9
Earnings ($Million) 4.4 4.6 4.7 4.9 4.7 4.5 4.6
Employment (jobs) 220 220 210 210 200 190 170
Local Govt. Revenue ($000) 32 34 116 125 157 218 228
State Govt. Revenue ($000) 976 1,039 1,152 1,117 1,089 1,085 1,109
Cabell
Direct Spending ($Million) 98.7 115.0 126.1 123.3 133.8 139.7 144.0
Earnings ($Million) 25.2 26.6 26.6 32.6 34.2 31.7 32.7
Employment (jobs) 1,380 1,390 1,290 1,550 1,540 1,420 1,450
Local Govt. Revenue ($000) 666 743 1,264 1,545 1,627 1,604 2,080
State Govt. Revenue ($000) 7,033 7,533 8,034 8,721 9,065 8,778 9,070
Calhoun
Direct Spending ($Million) 5.3 6.3 7.5 6.2 7.0 7.7 7.8
Earnings ($Million) 1.0 1.0 1.1 1.1 1.2 1.2 1.2
Employment (jobs) 70 70 70 70 80 70 70
Local Govt. Revenue ($000) 1 1 47 52 69 103 108
State Govt. Revenue ($000) 378 399 454 441 461 461 463
Clay
Direct Spending ($Million) 5.2 6.9 8.7 6.5 7.7 8.9 9.0
Earnings ($Million) 0.6 0.6 0.7 0.7 0.7 0.7 0.7
Employment (jobs) 40 40 40 40 40 30 30
Local Govt. Revenue ($000) 3 3 49 54 71 105 110
State Govt. Revenue ($000) 432 468 553 524 553 549 567
West Virginia County Travel Impacts, 2004-2012

PAGE 32 DEAN RUNYAN ASSOCIATES
2004 2006 2008 2009 2010 2011 2012
Doddridge
Direct Spending ($Million) 4.9 5.6 6.4 5.6 6.1 6.6 6.7
Earnings ($Million) 1.0 1.0 1.1 1.2 1.2 1.2 1.2
Employment (jobs) 60 50 50 50 50 50 50
Local Govt. Revenue ($000) 3 3 49 54 71 105 110
State Govt. Revenue ($000) 329 343 383 377 392 392 390
Fayette
Direct Spending ($Million) 46.8 58.8 70.7 56.9 67.2 78.2 80.4
Earnings ($Million) 9.4 10.9 12.3 11.6 13.5 14.9 15.5
Employment (jobs) 620 700 710 660 730 770 790
Local Govt. Revenue ($000) 201 263 620 545 695 865 933
State Govt. Revenue ($000) 3,432 3,852 4,474 4,138 4,584 4,883 5,057
Gilmer
Direct Spending ($Million) 5.9 7.1 8.2 7.0 7.8 8.5 8.7
Earnings ($Million) 1.0 1.1 1.2 1.2 1.3 1.2 1.3
Employment (jobs) 80 90 80 80 80 80 80
Local Govt. Revenue ($000) 7 8 63 68 89 131 137
State Govt. Revenue ($000) 413 440 494 482 504 503 505
Grant
Direct Spending ($Million) 11.5 14.2 17.2 14.0 15.8 17.7 17.8
Earnings ($Million) 1.8 1.9 2.0 2.1 2.2 2.2 2.2
Employment (jobs) 130 140 140 140 140 140 130
Local Govt. Revenue ($000) 10 10 65 70 92 133 139
State Govt. Revenue ($000) 855 918 1,060 1,022 1,070 1,067 1,079
Greenbrier
Direct Spending ($Million) 220.6 222.6 215.4 140.4 180.1 204.8 243.7
Earnings ($Million) 85.3 93.2 87.5 59.8 79.1 85.6 83.2
Employment (jobs) 2,700 2,640 2,480 1,660 2,010 2,150 2,060
Local Govt. Revenue ($000) 1,712 1,815 1,801 1,219 1,740 2,162 2,633
State Govt. Revenue ($000) 14,868 14,880 14,294 10,168 13,947 16,097 18,436
Hampshire
Direct Spending ($Million) 23.7 27.7 35.9 31.7 35.4 38.2 37.7
Earnings ($Million) 4.4 4.3 5.6 6.2 6.8 6.5 6.3
Employment (jobs) 330 320 390 400 400 380 370
Local Govt. Revenue ($000) 14 16 104 117 135 174 174
State Govt. Revenue ($000) 1,678 1,731 2,180 2,190 2,321 2,286 2,225
Hancock
Direct Spending ($Million) 409.3 410.6 426.6 390.9 369.2 426.5 447.6
Earnings ($Million) 83.2 80.5 88.8 87.6 83.8 96.0 100.1
Employment (jobs) 4,480 4,710 4,620 4,590 4,510 4,890 4,970
Local Govt. Revenue ($000) 5,215 5,174 6,596 5,962 5,626 5,625 5,605
State Govt. Revenue ($000) 102,477 99,200 93,210 86,921 75,687 73,216 76,031
Hardy
Direct Spending ($Million) 17.5 18.9 21.0 22.2 23.1 22.6 22.3
Earnings ($Million) 3.6 3.5 3.6 4.8 4.8 4.0 3.9
Employment (jobs) 270 290 250 330 310 250 240
Local Govt. Revenue ($000) 63 55 107 147 162 192 234
State Govt. Revenue ($000) 1,193 1,184 1,286 1,494 1,505 1,365 1,318
West Virginia County Travel Impacts, 2004-2012

DEAN RUNYAN ASSOCIATES PAGE 33
2004 2006 2008 2009 2010 2011 2012
Harrison
Direct Spending ($Million) 66.5 79.0 102.4 97.9 115.6 129.5 142.4
Earnings ($Million) 16.8 18.2 23.6 26.8 31.7 33.2 37.2
Employment (jobs) 940 930 1,110 1,240 1,380 1,430 1,530
Local Govt. Revenue ($000) 408 744 1,185 1,320 1,633 1,926 2,252
State Govt. Revenue ($000) 4,666 5,065 6,401 6,696 7,597 8,062 8,861
Jackson
Direct Spending ($Million) 28.8 34.9 43.9 35.9 40.4 45.8 46.4
Earnings ($Million) 4.9 5.4 6.5 6.5 6.8 7.0 7.1
Employment (jobs) 340 360 400 370 390 390 400
Local Govt. Revenue ($000) 94 153 270 256 289 359 379
State Govt. Revenue ($000) 2,161 2,308 2,791 2,661 2,792 2,852 2,923
Jefferson
Direct Spending ($Million) 571.5 702.0 731.3 723.5 769.7 899.4 959.2
Earnings ($Million) 113.5 138.7 151.5 161.0 172.7 198.3 213.2
Employment (jobs) 5,410 6,630 6,970 7,080 7,180 7,890 8,190
Local Govt. Revenue ($000) 8,465 9,306 10,177 9,914 12,601 16,670 18,032
State Govt. Revenue ($000) 171,571 191,547 194,931 195,219 198,621 205,966 206,916
Kanawha
Direct Spending ($Million) 471.0 540.9 589.8 545.7 586.3 622.2 649.0
Earnings ($Million) 104.0 111.9 117.1 123.9 129.1 125.6 131.5
Employment (jobs) 5,080 5,210 5,100 5,270 5,280 5,010 5,220
Local Govt. Revenue ($000) 3,544 5,120 5,636 5,913 6,257 6,517 7,030
State Govt. Revenue ($000) 39,839 41,585 44,004 43,230 43,842 44,215 46,407
Lewis
Direct Spending ($Million) 30.0 35.1 42.1 38.4 42.4 47.5 47.3
Earnings ($Million) 8.0 8.9 10.4 10.8 11.8 12.3 12.1
Employment (jobs) 460 470 490 500 510 550 530
Local Govt. Revenue ($000) 202 229 569 559 624 737 747
State Govt. Revenue ($000) 2,084 2,291 2,700 2,659 2,843 3,018 2,991
Lincoln
Direct Spending ($Million) 11.9 14.6 17.5 14.3 16.2 18.1 18.3
Earnings ($Million) 1.9 2.0 2.1 2.2 2.3 2.3 2.3
Employment (jobs) 140 140 140 140 140 130 130
Local Govt. Revenue ($000) 0 0 54 61 81 122 128
State Govt. Revenue ($000) 888 949 1,090 1,059 1,106 1,102 1,128
Logan
Direct Spending ($Million) 40.7 50.4 55.7 45.5 52.5 64.2 64.1
Earnings ($Million) 7.2 7.6 6.2 7.3 7.7 9.1 9.0
Employment (jobs) 420 400 300 330 340 410 390
Local Govt. Revenue ($000) 114 173 233 242 289 464 474
State Govt. Revenue ($000) 3,133 3,366 3,537 3,500 3,694 3,996 4,066
McDowell
Direct Spending ($Million) 18.0 22.3 26.9 21.3 24.4 27.5 27.6
Earnings ($Million) 2.6 2.7 2.8 2.9 3.0 2.9 2.9
Employment (jobs) 190 190 180 170 170 160 160
Local Govt. Revenue ($000) 49 51 178 194 247 342 356
State Govt. Revenue ($000) 1,383 1,474 1,692 1,627 1,702 1,687 1,728
West Virginia County Travel Impacts, 2004-2012

PAGE 34 DEAN RUNYAN ASSOCIATES
2004 2006 2008 2009 2010 2011 2012
Marion
Direct Spending ($Million) 45.2 58.7 55.5 57.8 67.8 76.9 84.2
Earnings ($Million) 10.6 13.5 9.6 14.4 16.8 17.5 19.9
Employment (jobs) 680 800 530 750 810 840 950
Local Govt. Revenue ($000) 212 357 371 436 554 983 1,166
State Govt. Revenue ($000) 3,261 3,838 3,493 4,133 4,591 4,807 5,289
Marshall
Direct Spending ($Million) 19.9 23.8 28.0 23.1 26.0 29.1 29.4
Earnings ($Million) 5.6 5.8 5.9 6.4 6.9 6.8 6.9
Employment (jobs) 260 270 260 260 250 250 260
Local Govt. Revenue ($000) 23 22 107 118 153 216 229
State Govt. Revenue ($000) 1,461 1,537 1,739 1,691 1,768 1,765 1,807
Mason
Direct Spending ($Million) 16.5 19.8 23.4 19.6 21.8 24.2 24.4
Earnings ($Million) 3.1 3.2 3.4 3.6 3.8 3.7 3.8
Employment (jobs) 210 230 230 230 230 230 230
Local Govt. Revenue ($000) 18 19 109 119 156 225 235
State Govt. Revenue ($000) 1,197 1,273 1,450 1,411 1,471 1,469 1,492
Mercer
Direct Spending ($Million) 76.9 94.8 110.9 83.0 91.9 101.7 102.1
Earnings ($Million) 17.0 18.9 20.9 17.5 18.0 17.7 17.6
Employment (jobs) 1,060 1,120 1,130 920 930 890 870
Local Govt. Revenue ($000) 394 481 971 692 739 831 852
State Govt. Revenue ($000) 5,618 6,235 7,076 6,102 6,332 6,340 6,439
Mineral
Direct Spending ($Million) 14.9 16.7 21.2 19.3 20.5 22.5 22.5
Earnings ($Million) 2.9 2.9 3.7 4.1 4.1 4.1 4.1
Employment (jobs) 200 220 250 260 240 240 240
Local Govt. Revenue ($000) 25 22 126 139 167 276 283
State Govt. Revenue ($000) 1,024 1,054 1,309 1,323 1,342 1,372 1,367
Mingo
Direct Spending ($Million) 19.7 24.0 28.3 20.0 22.9 29.4 29.6
Earnings ($Million) 3.6 3.8 4.0 3.0 3.2 4.3 4.3
Employment (jobs) 240 250 230 170 180 240 230
Local Govt. Revenue ($000) 42 45 126 98 131 233 245
State Govt. Revenue ($000) 1,474 1,577 1,783 1,515 1,590 1,811 1,855
Monongalia
Direct Spending ($Million) 113.0 126.9 129.5 124.0 129.8 170.6 185.3
Earnings ($Million) 32.7 33.6 31.5 36.2 36.4 40.9 45.1
Employment (jobs) 1,720 1,680 1,490 1,660 1,570 1,740 1,870
Local Govt. Revenue ($000) 895 1,434 1,353 1,718 1,708 2,480 2,840
State Govt. Revenue ($000) 7,892 8,290 8,288 8,690 8,767 10,620 11,517
Monroe
Direct Spending ($Million) 8.0 8.8 9.9 9.2 9.7 10.3 10.4
Earnings ($Million) 1.9 2.0 2.1 2.2 2.3 2.3 2.3
Employment (jobs) 130 120 130 130 130 160 150
Local Govt. Revenue ($000) 1 1 55 62 82 124 129
State Govt. Revenue ($000) 505 518 574 575 592 597 581
West Virginia County Travel Impacts, 2004-2012

DEAN RUNYAN ASSOCIATES PAGE 35
2004 2006 2008 2009 2010 2011 2012
Morgan
Direct Spending ($Million) 27.6 31.0 31.6 27.4 27.7 30.1 30.0
Earnings ($Million) 8.5 9.0 8.7 8.5 8.3 8.3 8.1
Employment (jobs) 440 440 450 450 440 440 440
Local Govt. Revenue ($000) 156 165 189 176 185 255 275
State Govt. Revenue ($000) 1,862 1,969 1,975 1,859 1,817 1,853 1,818
Nicholas
Direct Spending ($Million) 42.2 49.9 61.4 51.6 59.5 68.3 66.5
Earnings ($Million) 7.5 7.5 8.7 9.3 10.2 10.9 10.2
Employment (jobs) 550 540 560 600 630 630 580
Local Govt. Revenue ($000) 186 301 480 489 569 679 653
State Govt. Revenue ($000) 3,161 3,300 3,905 3,824 4,106 4,267 4,197
Ohio
Direct Spending ($Million) 355.9 376.3 377.3 395.9 362.7 407.6 467.4
Earnings ($Million) 67.4 67.4 70.5 83.4 77.3 75.6 78.3
Employment (jobs) 3,480 3,470 3,250 3,740 3,410 3,280 3,350
Local Govt. Revenue ($000) 4,534 4,981 5,696 5,982 5,051 7,125 9,420
State Govt. Revenue ($000) 85,101 86,297 75,161 79,627 64,628 95,927 144,904
Pendleton
Direct Spending ($Million) 6.3 7.2 8.8 7.5 8.1 8.8 9.0
Earnings ($Million) 1.6 1.6 1.9 1.9 1.9 1.9 1.9
Employment (jobs) 120 110 130 130 110 100 100
Local Govt. Revenue ($000) 21 21 98 100 114 149 159
State Govt. Revenue ($000) 446 463 549 531 540 536 549
Pleasants
Direct Spending ($Million) 4.9 5.9 7.0 5.7 6.4 7.2 7.3
Earnings ($Million) 0.8 0.8 0.8 0.9 0.9 0.9 0.9
Employment (jobs) 60 60 60 60 60 50 50
Local Govt. Revenue ($000) 6 6 61 66 87 129 135
State Govt. Revenue ($000) 361 385 437 421 439 438 448
Pocahontas
Direct Spending ($Million) 92.5 85.8 101.3 78.4 85.5 76.4 79.6
Earnings ($Million) 25.2 23.9 28.5 23.0 25.2 20.7 21.3
Employment (jobs) 1,330 1,190 1,340 1,170 1,220 1,010 1,040
Local Govt. Revenue ($000) 813 730 1,756 1,300 1,447 1,291 1,385
State Govt. Revenue ($000) 6,008 5,493 6,489 5,156 5,579 4,830 4,928
Preston
Direct Spending ($Million) 22.1 27.3 33.3 27.4 32.5 36.9 36.9
Earnings ($Million) 4.2 4.6 5.3 5.4 6.3 6.5 6.4
Employment (jobs) 290 310 320 320 340 340 350
Local Govt. Revenue ($000) 23 30 165 188 292 410 419
State Govt. Revenue ($000) 1,629 1,768 2,078 1,995 2,202 2,259 2,275
Putnam
Direct Spending ($Million) 46.9 61.5 74.3 57.4 66.3 75.5 75.6
Earnings ($Million) 7.4 8.5 8.7 8.8 9.1 8.9 8.9
Employment (jobs) 450 470 450 430 440 430 420
Local Govt. Revenue ($000) 33 50 155 146 182 249 254
State Govt. Revenue ($000) 3,710 4,123 4,718 4,471 4,683 4,654 4,775
West Virginia County Travel Impacts, 2004-2012

PAGE 36 DEAN RUNYAN ASSOCIATES
2004 2006 2008 2009 2010 2011 2012
Raleigh
Direct Spending ($Million) 126.3 144.4 185.9 145.3 158.8 179.8 180.6
Earnings ($Million) 31.3 33.3 43.2 36.8 38.8 40.7 40.5
Employment (jobs) 1,830 1,850 2,180 1,850 1,840 1,910 1,830
Local Govt. Revenue ($000) 914 975 2,026 1,861 1,993 2,317 2,374
State Govt. Revenue ($000) 8,896 9,465 11,943 10,244 10,752 11,382 11,449
Randolph
Direct Spending ($Million) 30.7 36.2 44.5 41.0 45.4 48.7 48.3
Earnings ($Million) 8.5 9.2 10.9 12.2 13.2 12.8 12.5
Employment (jobs) 560 590 620 670 670 660 650
Local Govt. Revenue ($000) 117 130 411 452 525 606 612
State Govt. Revenue ($000) 2,167 2,331 2,791 2,857 3,028 3,016 2,977
Ritchie
Direct Spending ($Million) 4.7 5.5 6.3 5.8 6.5 6.0 6.2
Earnings ($Million) 1.4 1.5 1.5 1.8 1.9 1.4 1.4
Employment (jobs) 100 100 100 110 110 80 90
Local Govt. Revenue ($000) 12 13 115 132 172 222 234
State Govt. Revenue ($000) 324 343 380 397 422 359 366
Roane
Direct Spending ($Million) 9.9 11.9 13.8 11.6 12.9 14.2 14.3
Earnings ($Million) 1.7 1.8 1.9 2.0 2.1 2.0 2.1
Employment (jobs) 120 140 130 130 130 120 120
Local Govt. Revenue ($000) 15 16 71 77 98 140 146
State Govt. Revenue ($000) 710 758 853 828 864 861 870
Summers
Direct Spending ($Million) 17.1 17.4 20.9 18.1 19.0 21.3 20.6
Earnings ($Million) 4.5 4.0 4.7 4.7 4.7 4.9 4.6
Employment (jobs) 310 290 300 300 310 300 290
Local Govt. Revenue ($000) 120 111 281 261 274 324 313
State Govt. Revenue ($000) 1,168 1,105 1,306 1,236 1,253 1,315 1,252
Taylor
Direct Spending ($Million) 9.2 10.8 12.1 10.8 12.3 13.5 13.9
Earnings ($Million) 2.2 2.3 2.3 2.6 2.9 2.9 3.0
Employment (jobs) 140 150 150 140 150 150 160
Local Govt. Revenue ($000) 28 31 97 102 133 177 188
State Govt. Revenue ($000) 640 686 747 754 812 822 851
Tucker
Direct Spending ($Million) 38.8 40.8 43.0 38.7 40.1 42.3 41.1
Earnings ($Million) 12.3 12.4 12.8 12.6 13.0 12.7 12.1
Employment (jobs) 750 730 710 690 680 670 640
Local Govt. Revenue ($000) 306 318 689 650 692 770 764
State Govt. Revenue ($000) 2,563 2,609 2,728 2,567 2,623 2,664 2,543
Tyler
Direct Spending ($Million) 4.6 5.4 6.3 5.2 5.8 6.3 6.4
Earnings ($Million) 1.1 1.2 1.2 1.2 1.3 1.2 1.3
Employment (jobs) 90 80 80 80 70 70 80
Local Govt. Revenue ($000) 15 17 81 86 112 160 168
State Govt. Revenue ($000) 330 351 393 374 393 390 399
West Virginia County Travel Impacts, 2004-2012

DEAN RUNYAN ASSOCIATES PAGE 37
2004 2006 2008 2009 2010 2011 2012
Upshur
Direct Spending ($Million) 21.7 25.9 30.3 24.9 27.2 33.2 34.3
Earnings ($Million) 6.0 6.5 7.0 6.8 7.2 8.5 8.8
Employment (jobs) 330 330 370 340 320 390 410
Local Govt. Revenue ($000) 73 80 198 194 209 321 346
State Govt. Revenue ($000) 1,550 1,667 1,893 1,766 1,822 2,043 2,103
Wayne
Direct Spending ($Million) 31.4 39.6 49.8 43.9 49.6 54.7 55.3
Earnings ($Million) 7.4 8.0 6.8 6.8 7.2 7.5 7.3
Employment (jobs) 440 410 370 370 360 360 340
Local Govt. Revenue ($000) 61 74 166 160 224 274 297
State Govt. Revenue ($000) 1,891 2,019 2,189 2,131 2,223 2,225 2,248
Webster
Direct Spending ($Million) 6.6 8.3 10.0 7.9 9.1 10.3 10.4
Earnings ($Million) 0.9 0.9 1.0 1.0 1.1 1.0 1.1
Employment (jobs) 70 70 70 70 80 70 70
Local Govt. Revenue ($000) 11 11 75 81 106 155 162
State Govt. Revenue ($000) 504 539 623 596 628 623 637
Wetzel
Direct Spending ($Million) 15.5 19.6 22.3 20.6 24.5 26.6 27.5
Earnings ($Million) 2.8 3.2 3.3 3.9 4.7 4.5 4.7
Employment (jobs) 200 230 220 250 280 260 260
Local Govt. Revenue ($000) 51 67 156 238 313 379 408
State Govt. Revenue ($000) 1,135 1,273 1,400 1,479 1,657 1,650 1,716
Wirt
Direct Spending ($Million) 1.2 1.2 1.3 1.3 1.3 1.3 1.4
Earnings ($Million) 0.4 0.4 0.4 0.4 0.4 0.4 0.4
Employment (jobs) 20 20 20 20 20 20 20
Local Govt. Revenue ($000) 0 0 46 51 68 102 107
State Govt. Revenue ($000) 66 67 70 71 73 75 70
Wood
Direct Spending ($Million) 90.4 103.4 118.6 96.7 107.8 116.0 124.5
Earnings ($Million) 21.1 21.5 22.5 21.3 22.9 21.2 24.2
Employment (jobs) 1,200 1,160 1,150 1,090 1,080 1,010 1,100
Local Govt. Revenue ($000) 491 488 880 846 866 930 1,099
State Govt. Revenue ($000) 6,543 6,796 7,552 7,032 7,386 7,216 7,848
Wyoming
Direct Spending ($Million) 22.6 29.0 36.5 28.4 32.8 36.2 36.9
Earnings ($Million) 3.4 3.7 4.2 4.3 4.6 4.1 4.3
Employment (jobs) 190 200 220 210 210 180 190
Local Govt. Revenue ($000) 26 32 109 110 139 197 219
State Govt. Revenue ($000) 1,782 1,939 2,313 2,195 2,314 2,228 2,331
West Virginia County Travel Impacts, 2004-2012

PAGE 38 DEAN RUNYAN ASSOCIATES
County Total Travel Percent Total Travel Percent
Barbour 5,850 148 2.5% 190 2.4 1.3%
Berkeley 43,590 1,162 2.7% 1,933 25.1 1.3%
Boone 9,680 159 1.6% 608 3.0 0.5%
Braxton 5,460 328 6.0% 192 7.8 4.1%
Brooke 11,180 180 1.6% 451 4.6 1.0%
Cabell 65,090 1,452 2.2% 3,017 32.7 1.1%
Calhoun 3,220 78 2.4% 83 1.2 1.4%
Clay 2,710 39 1.4% 100 0.7 0.7%
Doddridge 3,040 50 1.7% 78 1.2 1.5%
Fayette 16,500 792 4.8% 668 15.5 2.3%
Gilmer 3,590 82 2.3% 128 1.3 1.0%
Grant 5,970 139 2.3% 247 2.2 0.9%
Greenbrier 19,060 2,064 10.8% 714 83.2 11.7%
Hampshire 7,750 374 4.8% 215 6.3 2.9%
Hancock 13,160 4,976 37.8% 561 100.1 17.9%
Hardy 7,630 249 3.3% 247 3.9 1.6%
Harrison 45,200 1,531 3.4% 2,336 37.2 1.6%
Jackson 11,640 402 3.5% 431 7.1 1.6%
Jefferson 22,470 8,192 36.5% 884 213.2 24.1%
Kanawha 131,750 5,222 4.0% 7,129 131.5 1.8%
Lewis 9,730 539 5.5% 464 12.1 2.6%
Lincoln 4,920 135 2.7% 197 2.3 1.2%
Logan 14,140 398 2.8% 725 9.0 1.2%
McDowell 7,580 168 2.2% 420 2.9 0.7%
Marion 27,950 959 3.4% 1,320 19.9 1.5%
Marshall 18,270 267 1.5% 923 6.9 0.7%
Mason 9,410 231 2.5% 384 3.8 1.0%
Mercer 28,020 879 3.1% 1,146 17.6 1.5%
Total Employment and Earnings Compared to Direct
Travel-Generated Employment and Earnings by County, 2012
Employment Earnings ($Millions)

DEAN RUNYAN ASSOCIATES PAGE 39
County Total Travel Percent Total Travel Percent
Mineral 10,780 246 2.3% 441 4.1 0.9%
Mingo 9,860 235 2.4% 596 4.3 0.7%
Monongalia 68,700 1,875 2.7% 3,607 45.1 1.2%
Monroe 4,240 158 3.7% 122 2.3 1.9%
Morgan 4,770 447 9.4% 151 8.1 5.4%
Nicholas 10,830 587 5.4% 482 10.2 2.1%
Ohio 33,100 3,356 10.1% 1,436 78.3 5.5%
Pendleton 3,330 109 3.3% 111 1.9 1.7%
Pleasants 3,910 59 1.5% 184 0.9 0.5%
Pocahontas 4,860 1,049 21.6% 146 21.3 14.6%
Preston 11,500 355 3.1% 447 6.4 1.4%
Putnam 27,020 425 1.6% 1,348 8.9 0.7%
Raleigh 42,750 1,836 4.3% 2,072 40.5 2.0%
Randolph 15,500 651 4.2% 578 12.5 2.2%
Ritchie 5,350 92 1.7% 185 1.4 0.8%
Roane 6,280 121 1.9% 155 2.1 1.3%
Summers 3,860 295 7.6% 115 4.6 4.0%
Taylor 4,710 162 3.4% 151 3.0 2.0%
Tucker 3,590 649 18.1% 103 12.1 11.8%
Tyler 3,590 86 2.4% 143 1.3 0.9%
Upshur 11,620 415 3.6% 466 8.8 1.9%
Wayne 11,610 349 3.0% 592 7.3 1.2%
Webster 2,990 73 2.4% 111 1.1 1.0%
Wetzel 6,480 267 4.1% 218 4.7 2.2%
Wirt 1,530 26 1.7% 33 0.4 1.3%
Wood 49,270 1,109 2.3% 2,145 24.2 1.1%
Wyoming 6,760 195 2.9% 328 4.3 1.3%
West Virginia 923,340 46,421 5.0% 42,257 1,075 2.5%
Total Employment and Earnings Compared to Direct
Travel-Generated Employment and Earnings by County, 2012
Employment Earnings ($Millions)

This page intentionally blank

DEAN RUNYAN ASSOCIATES PAGE 41
Appendices
Appendix A. Regional Travel Impact Model (RTIM) Methodology
Appendix B. Definition of Terms
Appendix C. Travel Industry Business Classifications

This page intentionally blank

DEAN RUNYAN ASSOCIATES PAGE 43
APPENDIX A
TRAVEL IMPACT ESTIMATION PROCEDURES
TRAVEL SPENDING
Hotel, Motel, B&B. Spending on commercial accommodations by hotel
and motel guests is estimated from hotel/motel occupancy tax receipts for
each jurisdiction and county. Where room tax receipts are unavailable or
incomplete, room sales are estimated from lodging inventories, occupancy
rates, and room rates. Other lodging industry data, such as sales tax
receipts, employment and earnings, are also used to estimate and/or
validate room sales. Spending by hotel and motel guests in other business
categories, such as food and transportation, is estimated using spending
distributions reported in visitor survey data. The spending distribution
shows how travelers divide their spending between lodging and other
purchases.
Private Campground. Spending by campers using commercial
campgrounds is estimated from the number of commercial campsites, the
average occupancy of these campsites, and the average daily expenditures
of visitor camp parties reported in survey data. Spending in other business
categories is estimated in the same way as for hotel/motel guests.
Public Campground. Spending by campers using public campgrounds is
estimated from visitor counts at federally, state, and locally managed
campsites and recreation areas, and daily spending estimates from visitor
survey data.
Private Home. Spending by private home guests is determined from
census data and visitor survey data. The number of owner occupied
housing units per county is taken from the decennial census and updated
annually. The average number of days per year visitors hosted by residents
and the average daily spending of these visitors are estimated from visitor
survey data.
Vacation Home. The estimated spending by vacation home renters and
owners is also based on census data and visitor survey data. The number
of seasonal housing units per county is taken from the decennial census
and updated annually. The average number of days per year that these
units are occupied by owners or renters (where a hotel/motel occupancy

PAGE 44 DEAN RUNYAN ASSOCIATES
tax is not collected) and the average daily spending of these visitors are
estimated from visitor survey data.
Day Travel. The share of day visits as a percentage of total travel is
estimated from visitor survey data and applied to average daily spending
estimates to produce day visitor spending.
Air Transportation. Visitor spending estimates for air transportation are
derived from the Origin-Destination survey conducted for the Bureau of
Transportation Statistics. Employment and earnings estimates are derived
from industry receipts, payroll, and employment data for passenger traffic.
The impacts of air cargo operations on scheduled passenger flights are not
included in these estimates.
Travel Arrangement Services. This category consists of travel agencies
(NAICS 56151). Employment estimates are based on employment data
provided by the Bureau of Labor Statistics. Spending estimates are derived
from the 2007 Economic Census.
RELATED TRAVEL IMPACTS
Spending by travelers generates jobs, payroll, and state and local tax
revenue.
Earnings generated directly from traveler expenditures are estimated from
the payroll-to-receipts ratio obtained from data published in the 2007
Economic Census and the state and county estimates of earnings and
employment produced annually by the Bureau of Economic Analysis’
Regional Economic Information System (REIS). Earnings includes payroll
and other earned benefits of employees, and proprietor income.
Employment in each business category is calculated from average
earnings data derived from ES-202 statistics and the earnings and
employment produced annually by the Bureau of Economic Analysis’
Regional Economic Information System (REIS).
Local Taxes consist of all local (municipality, county, special districts)
point-of-sale taxes, including room taxes, sales taxes, and auto rental taxes.
Property taxes are not included.
State Taxes consist of all statewide point of sale taxes (including sales
taxes and motor fuel taxes) and personal and business income taxes.

DEAN RUNYAN ASSOCIATES PAGE 45
APPENDIX B
DEFINITION OF TERMS
Accommodation: Spending for lodging by hotel and motel guests, campers and
vacation home users.
Air Transportation: Air passenger spending attributable to travelers in and to
West Virginia. The spending total includes air travel spending made outside
West Virginia for travel to West Virginia, purchases by West Virginia residents
who travel outside the state, and air travel within the state.
Campers: Travelers staying at RV parks and commercial campgrounds or at
public campgrounds such as those in State or National Parks.
Day Visitor: A traveler whose trip does not include an overnight stay and who
travels from out of state or within state and out of his/her local area (50+ miles
one way).
Travel Spending: Spending by travelers at or near their destinations. This
includes spending on air transportation and for travel arrangement. All
automobile operating expenses are included in the ground transportation
component of destination spending.
Earnings: Total earnings include wage and salary disbursements, other earned
benefits and proprietor income. Only the earnings attributable to travel
expenditures are included.
Eating, Drinking: Businesses serving food and beverages for immediate
consumption. In addition to table service restaurants, this category includes fast-
food outlets and refreshment stands.
Employment: Industry employment (jobs) associated with the travel-generated
payroll and proprietors. This includes both full- and part-time positions.
Expenditures: Purchases by travelers during their trip, including hotel/motel
taxes and other applicable local and state taxes paid by the traveler at the point
of sale.

PAGE 46 DEAN RUNYAN ASSOCIATES
Hotel and Motel Guests: Travelers staying in hotels, motels, resorts, bed &
breakfast establishments, condominiums, and other lodging places where the
Hotel/Motel Occupancy Tax is collected.
Local Tax Receipts: Hotel/Motel Occupancy Tax revenue collected by counties
and municipalities (no other local or municipal sales taxes are levied in the state).
Private Home Guests: Travelers staying as guests with friends or relatives.
Receipts: Travel expenditures less the sales and excise taxes imposed on those
expenditures (also referred to as business receipts).
Recreation: Spending on amusement and recreation, such as admissions to tourist
attractions.
Gaming: Revenue generated on racetrack video lottery and “live” on-site and
simulcast wagering by visitors.
Retail Sales: Spending for gifts, souvenirs and other items (excludes spending
listed separately, such as food stores or recreation).
Spending Distributions: Information from visitor surveys showing how spending
by each type of visitor is divided between various business categories.
State Tax Receipts: State sales taxes, personal and business income taxes, motor
fuel taxes, and car rental taxes attributable to travel expenditures.
Travel: A day or overnight trip that is not of a local or commuting nature. Travel
may be for business or pleasure purposes.
Travel Arrangement: Spending for fees paid to travel agents and tour operators.
Traveler: A person traveling in West Virginia. A traveler may be a West Virginia
resident or a resident of another state. The terms traveler and visitor have the
same meaning in this report.
Vacation Home User: Travelers using their own vacation home or timeshare and
those renting a vacation home or privately owned cabin where a hotel/motel
occupancy tax is not collected.
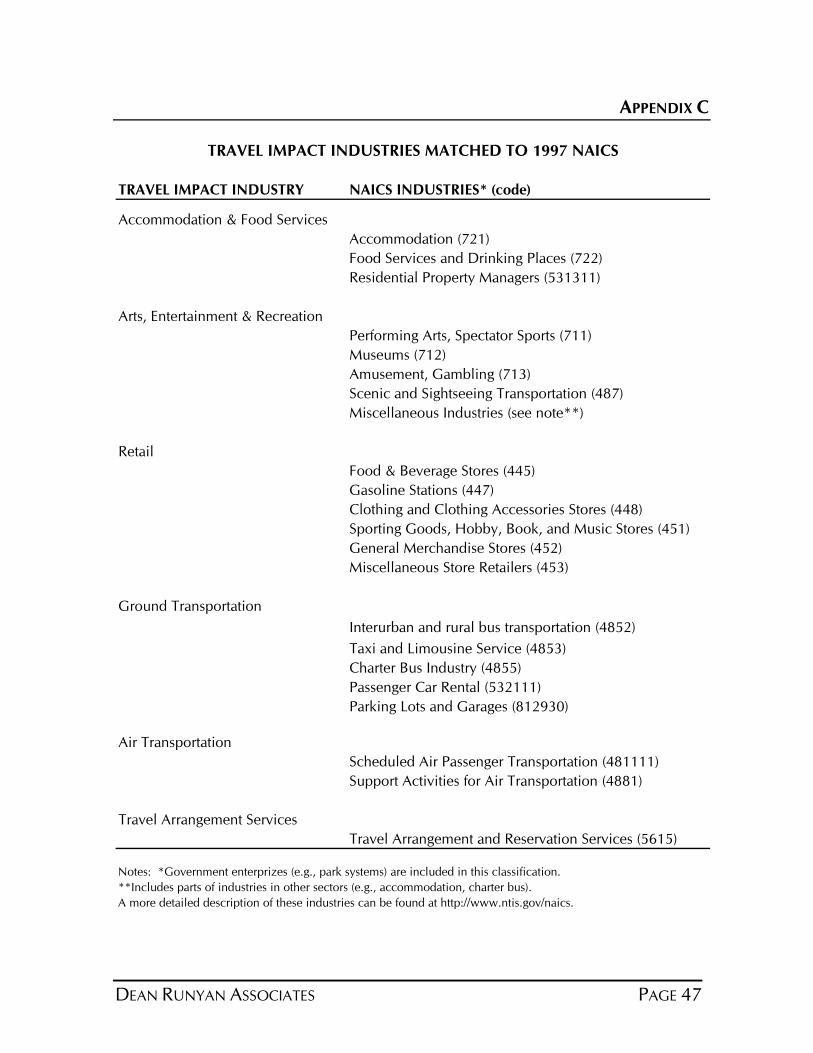
DEAN RUNYAN ASSOCIATES PAGE 47
APPENDIX C
TRAVEL IMPACT INDUSTRY NAICS INDUSTRIES* (code)
Accommodation & Food Services
Accommodation (721)
Food Services and Drinking Places (722)
Residential Property Managers (531311)
Arts, Entertainment & Recreation
Performing Arts, Spectator Sports (711)
Museums (712)
Amusement, Gambling (713)
Scenic and Sightseeing Transportation (487)
Miscellaneous Industries (see note**)
Retail
Food & Beverage Stores (445)
Gasoline Stations (447)
Clothing and Clothing Accessories Stores (448)
Sporting Goods, Hobby, Book, and Music Stores (451)
General Merchandise Stores (452)
Miscellaneous Store Retailers (453)
Ground Transportation
Interurban and rural bus transportation (4852)
Taxi and Limousine Service (4853)
Charter Bus Industry (4855)
Passenger Car Rental (532111)
Parking Lots and Garages (812930)
Air Transportation
Scheduled Air Passenger Transportation (481111)
Support Activities for Air Transportation (4881)
Travel Arrangement Services
Travel Arrangement and Reservation Services (5615)
Notes: *Government enterprizes (e.g., park systems) are included in this classification.
**Includes parts of industries in other sectors (e.g., accommodation, charter bus).
A more detailed description of these industries can be found at http://www.ntis.gov/naics.
TRAVEL IMPACT INDUSTRIES MATCHED TO 1997 NAICS


![STATE OF WEST VIRGINIA AUDIT REPORT OF WEST VIRGINIA STATE ... · WEST VIRGINIA STATE POLICE INTRODUCTION The West Virginia State Police [State Police] was created in 1919 by Chapter](https://img.pdfslide.net/doc/110x75/5e268e4aa6c417777a2293bb/state-of-west-virginia-audit-report-of-west-virginia-state-west-virginia-state.jpg)