Embed Size (px)
Citation preview

WESTAR Council – Continuous WESTAR Council – Continuous PMPM2.52.5 Monitoring Workshop Monitoring Workshop
Portland, OregonPortland, OregonApril 13-14, 2005April 13-14, 2005
Real-Time Smoke MonitoringReal-Time Smoke Monitoring

Real-Time Smoke Monitoring
John says to talk about: • The monitors we’ve
tested/used
• What’s worked/hasn’t worked
• Still to do

Smoke Monitors for USFSSmoke Monitors for USFSPrimary purpose to monitor Rx smoke
Operators will be non-technicians
Monitors will be shared
across the country
When we got startedWhen we got started
1998 – Air Program started at MTDC
– What’s a nep-helo-meter?
– Field personnel need help
– Evaluate commercial real-time continuous monitors• Portable• Ease of use• Accuracy• Rugged

Real-Time Continuous MonitorsReal-Time Continuous Monitors
TEOM

Real-Time Continuous MonitorsReal-Time Continuous Monitors
Beta Attenuation (BAM)

Real-Time Continuous MonitorsReal-Time Continuous Monitors
Light ScatteringLight Scattering

Smoke Monitors - Laboratory & Smoke Monitors - Laboratory & Field TestsField Tests
Fire Science Laboratory’s Smoke Chamber

Smoke Monitors - Laboratory & Smoke Monitors - Laboratory & Field TestsField Tests
Fire Science Laboratory Tests

Smoke Monitors - Laboratory & Smoke Monitors - Laboratory & Field TestsField Tests
Field Testing– Rx burns in 1999 &
2000– Wildland fires in 2000

Smoke Monitors - Laboratory & Smoke Monitors - Laboratory & Field TestsField Tests
4 reports detail results

Smoke Monitors - Laboratory & Smoke Monitors - Laboratory & Field TestsField Tests
Summary of reports:– Instruments usually overestimate mass concentration
of smoke
– Correction algorithms needed
– Unique corrections for different manufacturers
– Results gets you in the ball park
– Trend data
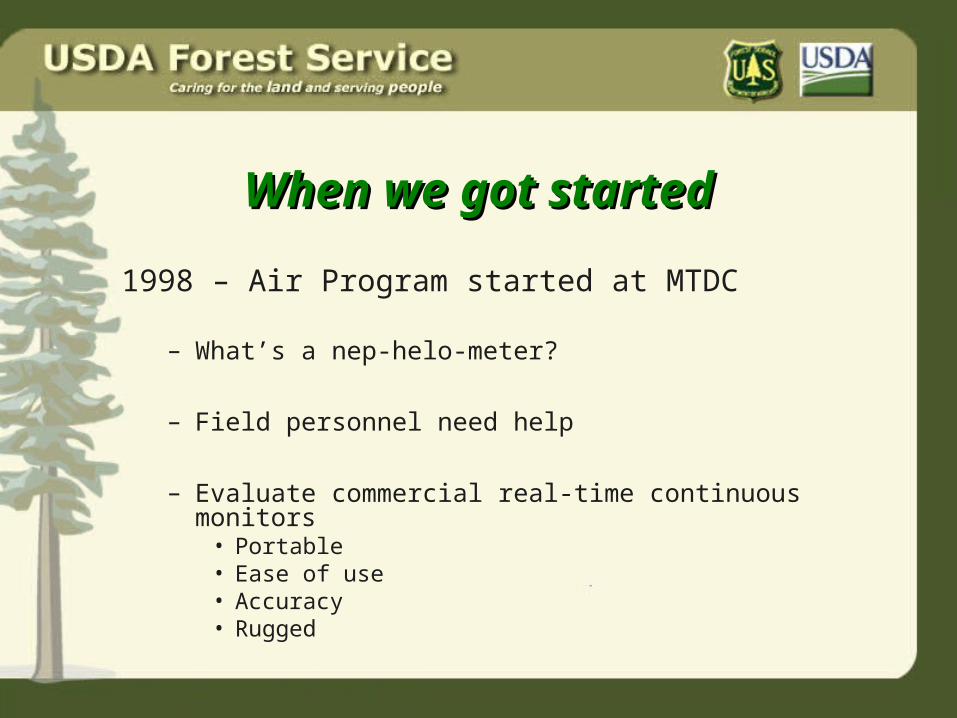
Instruments - Radiance Research Neph
Positives– Reliable, stable– Low power consumption– Portable/light– Price ~ $4,500
Negatives– No mass concentration display– Must convert scattering to mass
concentration– Difficult calibration/use for non-technician– Tech support– No PM2.5 cutoff– No shelter

Radiance Research Nephelometer ResultsWildland Fire Smoke
y = 1.42x
R2 = 0.99
0
100
200
300
400
500
600
700
800
0 100 200 300 400 500 600 700 800
Gravimeteric Concentration (ug/m3)
Rad
ian
ce C
on
cen
trat
ion
(u
g/m
3)
For wildland fire smoke, mass concentration = bscat * 175,000

Instruments – MIE DataRam 2000
Positives– Easy to use– Reliable– Inlet heater/PM2.5 cutoff– Tech support– Displays mass concentration
Negatives– No shelter– Cost ~ $10,000+

DataRam PM 2.5 Concentrations Wildland Fire Smoke
0
200
400
600
800
1000
1200
0 200 400 600 800 1000 1200
Gravimetric Concentration (u g/m3)
Da
taR
am
Co
nc
en
tra
tio
n (u
g/m
3 )
y = 2.08x
R2 = 0.97
For wildland fire smoke, Mass Concentration = DataRam 2000 estimated mass * 0.48

Instruments – MIE DataRam 4
Positives– Dual wavelength– Displays mass concentration– Temp and RH (internal)
Negatives– Reliability– Customer service– No Shelter– Accuracy – Cost ~$11,500+

DataRam 4 Laboratory Test Results
0
500
1000
1500
2000
2500
0 500 1000 1500 2000 2500
FRM Concentration (ug/m3)
Dat
aRam
4 C
once
ntra
tion
(ug/
m3)
y = 2.80x
R2 = 0.98
For smoke, mass concentration = DataRam 4 estimated mass conc * 0.36 (with size correction feature: ENABLED)

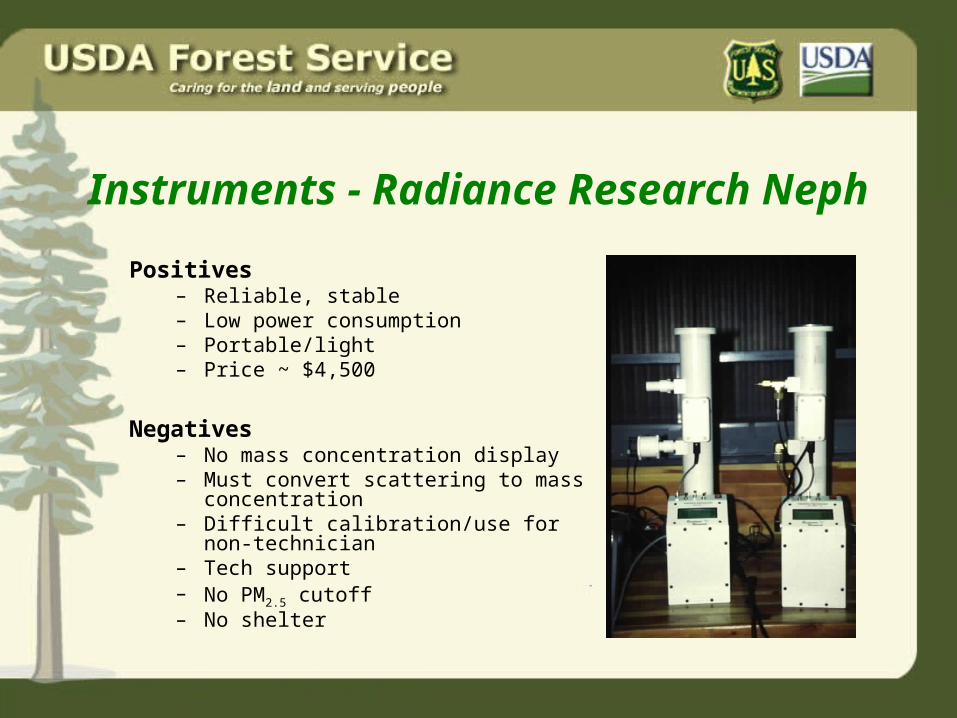
Instruments – Optec NGN-3
Positives– Reliable– Accurate– Inlet heater– PM2.5 cutoff
Negatives– Heavy and bulky– No shelter– Calibration– Power consumption– Requires Datalogger– Cost ~$13,000
Optec NGN-3 PM 2.5 Concentration Results Wildland Fire Smoke
y = 1.36x
R2 = 1.00
0
100
200
300
400
500
600
0 100 200 300 400 500 600
Gravimetric Concentration (ug/m3)
Op
tec
Co
nce
ntr
atio
n (u
g/m
3)
Wildland fire smoke, Mass concentration = OPTEC estimated mass concentration * 0.74

Instruments – Met One E-SamplerPositives
– Easy to use– Tripod mount– Portable/lightweight– Heater and PM2.5 cutoff– Environmentally enclosed– Can add other met instruments– Low power consumption– Temp and Pressure– Filter for calibration– Cost ~ $4,500
Negatives– Low levels tend to read zero– Reliability

E-Sampler Laboratory Test Results
y = 1.14x
R2 = 0.96
0
100
200
300
400
500
600
700
800
900
1000
0 100 200 300 400 500 600 700 800 900 1000
FRM Concentration (ug/m3)
E-S
ampl
er C
once
ntra
tion
(ug/
m3)
For smoke, mass concentration = E-Sampler estimated mass * 0.88

Instruments – R&P Dustscan Sentinel
Positives – Easy to use– Portable/lightweight– Inlet Heater– Environmentally enclosed– Can add wind spd/dir– Low power consumption– Cost ~ $4,500
Negatives– Did not use long enough
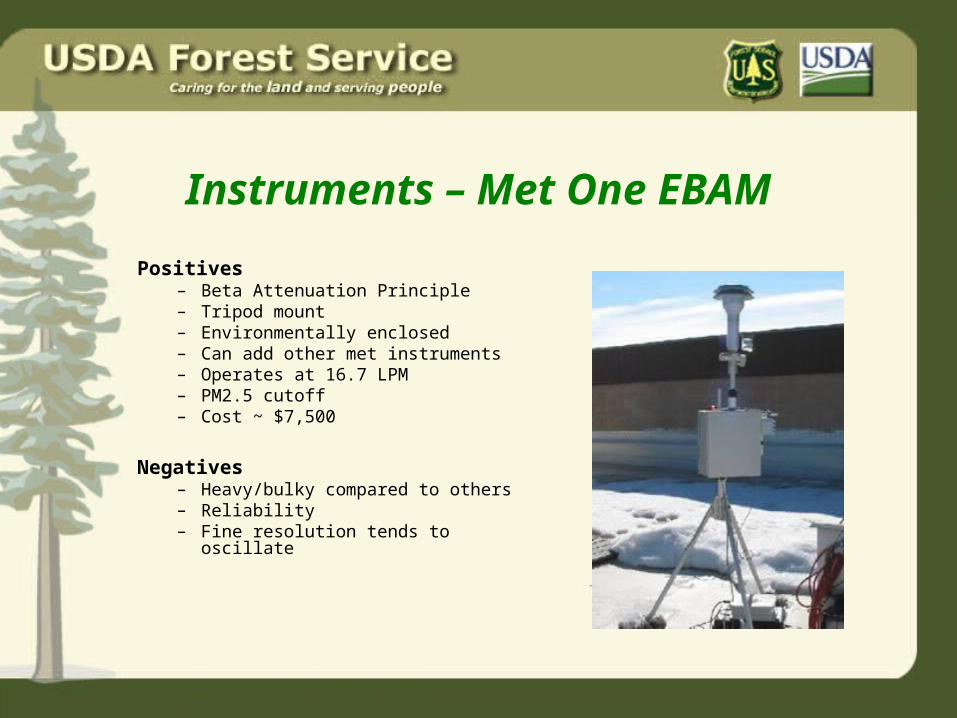
Instruments – Met One EBAM
Positives – Beta Attenuation Principle – Tripod mount– Environmentally enclosed– Can add other met instruments– Operates at 16.7 LPM – PM2.5 cutoff– Cost ~ $7,500
Negatives– Heavy/bulky compared to others– Reliability– Fine resolution tends to oscillate

Instruments – Met One EBAM

EBAM Laboratory Results
0
100
200
300
400
500
600
700
800
900
1000
0 100 200 300 400 500 600 700 800 900 1000
FRM Concentration (ug/m3)
EBA
M C
once
ntra
iton
(ug/
m3)
y = 1.09x
R2 = 0.98
For smoke, conversion = EBAM estimated mass concentration * 0.91

What’s work, not worked
• Real-time dataReal-time data
• Deployment

Real-time Data
2001 – Wenatchee NF wildland fires
Need for data retrieval system

Real-Time Data – Telemetry
Data telemetry system– LAN line, limited availability
– Cellular, limited availability
– Satellite – full coverage
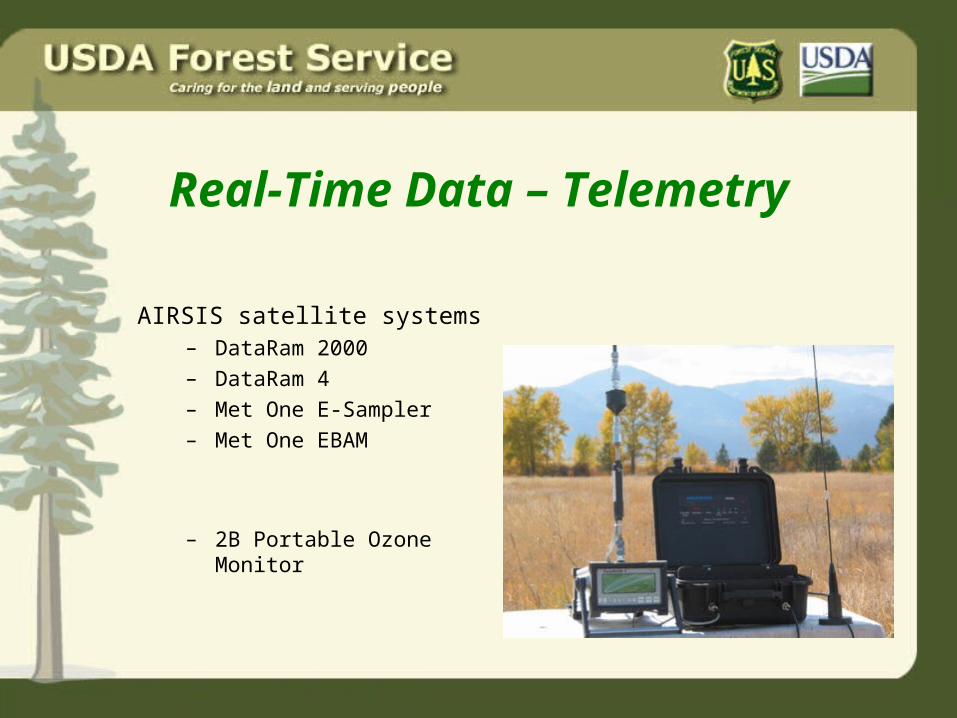
Real-Time Data – Telemetry
AIRSIS satellite systems– DataRam 2000– DataRam 4– Met One E-Sampler– Met One EBAM
– 2B Portable Ozone Monitor

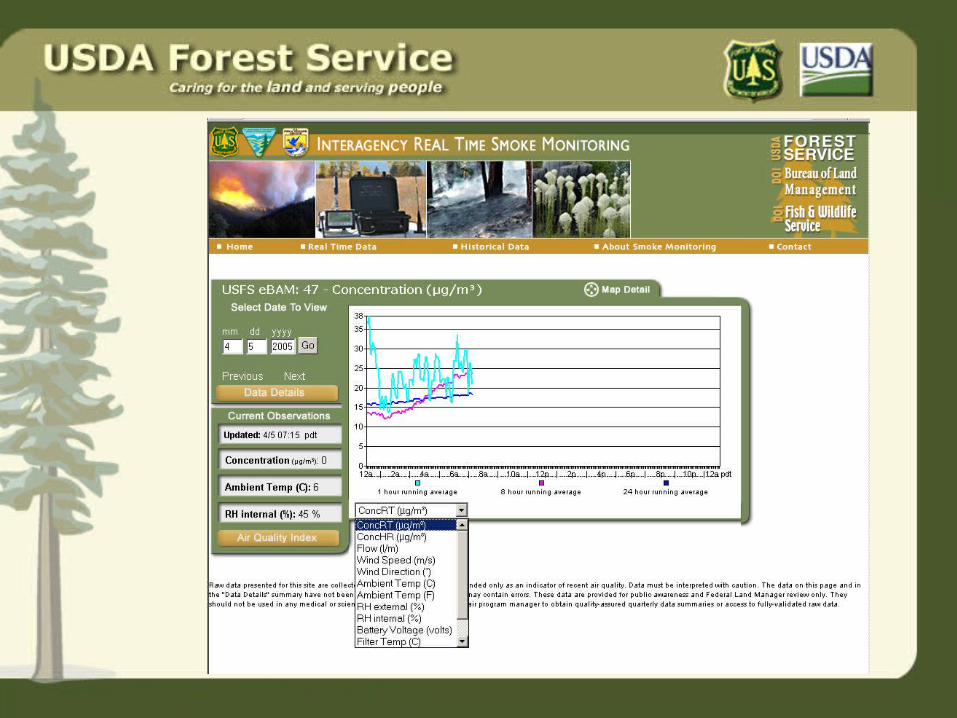
Real-Time Data: Web SiteInteragency Real-Time Smoke Monitoring Web Site
www.satguard.com/usfs


What’s work, not workedWhat’s work, not worked
• Real-time data
• DeploymentDeployment

Smoke Monitoring: DeploymentSmoke Monitoring: Deployment
Instruments & Equipment– Checklist
– Phone numbers• Instrument tech support• Satellite
– Know how to operate equipment

Smoke Monitoring: DeploymentSmoke Monitoring: Deployment
Siting– Line power
– Residents usually likelike to help
– Keep telemetry away from power lines, etc
– Security

Smoke Monitoring: DeploymentSmoke Monitoring: Deployment
Successes
• Rx burning season in MT
• Wildfires in MT 2000, 2003
• Wildfires in OR 2002
• Rx & Wildfire in CA 2004

Smoke Monitoring: DeploymentSmoke Monitoring: Deployment
Problems– Instrument malfunctions
– No telemetry data
– Instrument malfunctions after you leave
– Good to have someone on-site to help troubleshoot if leaving for extended period

Real-Time Smoke Monitoring: Real-Time Smoke Monitoring: Still to DoStill to Do
• EBAM study with EPA – Jim Homolya– Instrument accuracy– Field Test– Telemetry data
• Test different fuel types (lab and field)
• Determine humidity effects