Embed Size (px)
Citation preview
SFMTA.COMMARCH 2017
Western Addition Community-Based Transportation PlanPromoting Equity through Access
Creating Opportunities through AccessBringing local residents, community organizations and transportation agencies
together to address and overcome neighborhood transportation challenges.

SAN FRANCISCO MUNICIPAL TRANSPORTATION AGENCY 1
Table of Contents
EXECUTIVE SUMMARY 5
INTRODUCTION:
HOW DID THE WESTERN ADDITION CBTP COME TO BE? 9
EXISTING CONDITIONS: WHAT MAKES UP THE WESTERN
ADDITION AND WHO LIVES THERE? 15
Methodology 17
Demographic Analysis: Western Addition Community 17
Summary: Over a Decade Later, Is Western Addition Still a Community of Concern 27
Land Use Conditions: Western Addition Block by Block 31
Existing Transportation Network and Infrastructure:
Western Addition Street by Street 37
COMMUNITY OUTREACH:
WHAT DID THE WESTERN ADDITION COMMUNITY SAY? 53
Community Outreach Phase 1: Community Transportation Goals + Priorities 55
Community Outreach Phase 2: Transportation Opportunities + Improvement Locations 71
Community Outreach Phase 3: Street Design Evaluation 80
RECOMMENDATIONS, FUNDING AND IMPLEMENTATION:
WHAT’S RECOMMENDED FOR THE STREETS OF THE WESTERN
ADDITION? 96
Funding 98 Recommendations and Implementation: What’s Planned for the Western Addition? 99
CONCLUSION 116

THOSE THAT MADE THE WESTERN ADDITION CBTP POSSIBLE
Acknowledgments
This project is funded through the San Francisco County Transportation Authority’s (SFCTA) Neighborhood Transportation Improvement Program (NTIP) and Metropolitan Transportation Commission’s (MTC) Community Based Transportation Planning (CBTP) Grant Program. The NTIP was established to fund community-based efforts in San Francisco neighborhoods, especially in underserved neighborhoods and areas with vulnerable populations (e.g. seniors, children, and/or people with disabilities). The NTIP is made possible with Proposition K local transportation sales tax funds. The San Francisco Municipal Transportation Agency (SFMTA) would like to thank Supervisor London Breed for recommending The Western Addition Community-Based Transportation Plan for NTIP funding. The SFMTA would also like to acknowledge our project partners, including Mo’MAGIC Collective, Supervisor Breed, SFCTA, MTC, SF Public Utilities Commission, SF Recreation and Park Department, SF Police Department, SF Planning Department and SF Public Works. The final report was adopted by the Transportation Authority Board on April, 25 2017.
Thank you to the individuals who participated in the Western Addition CBTP, an effort to promote equity through transportation.
A. SFMTA BOARD OF DIRECTORSCheryl Brinkman, Chairman of the BoardMalcolm A. Heinicke, Vice ChairmanGwyneth Borden, DirectorLee Hsu, DirectorTom Nolan, DirectorJoél Ramos, DirectorCristina Rubke, DirectorRoberta Boomer, Board Secretary
B. EXECUTIVE TEAMEdward D. Reiskin, Director of TransportationSonali Bose, Chief Financial OfficerKate Breen, Director of Government AffairsDonald Ellison, Director of Human Resources John Haley, Director of Transit Melvyn Henry, Director of System SafetyTom Maguire, Director of Sustainable Streets Candace Sue, Director of Communications & Marketing Kate Toran, Director of Taxi & Accessible ServicesSiew-Chin Yeong, Director of Capital Programs & Construction
C. SFMTA PROJECT TEAMPeter Albert, former Planning Director, SFMTA PlanningDana Baker, Graphic Designer, SFMTA Creative ServicesCalvin Gee, Engineer, SFMTA Livable StreetsSherie George, Planner, SFMTA PlanningAnna Harkman, Planner, SFMTA PlanningDanielle J. Harris, Associate Planner, SFMTA PlanningSarah Jones, Planning Director, SFMTA PlanningChimmy Lee, Senior Graphic Designer, SFMTA Creative ServicesAdrian Leung, Planner, SFMTA Livable StreetsMonica Munowitch, Senior Planner, SFMTA PlanningRachel Om, Planner, SFMTA PlanningJesse Rosemoore, Associate Planner, SFMTA PlanningGrahm Satterwhite, Senior Planning Manager, SFMTA PlanningWilliam Tabojonda, Engineer, SFMTA Livable StreetsAriel Ward, former Student Intern, SFMTA Planning
SAN FRANCISCO MUNICIPAL TRANSPORTATION AGENCY 3
D. DISTRICT SUPERVISOR BREED’S OFFICEBoard President, District 5 Supervisor BreedVallie Brown, former Supervisor AideConor Johnston, Supervisor AideSamantha Roxas, Supervisor Aide
E. MO’MAGIC, COMMUNITY-BASED ORGANIZATIONSheryl Davis, former Executive Director, Mo’MAGIC | Collective ImpactLori Gannon , Administrative Coordinator, Mo’MAGIC Devi Zinzuvadia, Director of Engagement, Collective Impact
F. TECHNICAL ADVISORY COMMITTEEJohn M. Francis, Planner/Urban Designer, SF Planning DepartmentChester Fung, former Senior Planner, SFCTA Rachel Hiatt, Senior Planner, SFCTA Casey Hildreth, Senior Planner, SFMTA Livable StreetsCaptain Ann Mannix, SF Police DepartmentYoli Quiso, Public Utilities Commission, Project ManagerCraig Raphael, Senior Planner, SFMTA Capital Finance Dustin White, Senior Planner, SFMTA Transit Division
G. WESTERN ADDITION COMMUNITYRobin Bill, Director, Western Addition Senior CenterDaniel English, Board Liaison, Freedom West Homes Dornesha Landers, Director, Rosa Parks Senior CenterJanice Li, Advocacy Director, San Francisco Bicycle CoalitionShawn Mansager, Principal, John Muir Elementary SchoolTulsi Pi, former Outreach Coordinator, Western Addition Beacon CenterJulia Raskin, Community Organizer, San Francisco Bicycle Coalition
H. THE MO’MAGIC COLLABORATIVEAfrican American Art & Culture ComplexAfroSoloBooker T. Washington Community Service CenterBoys & Girls Club of San Francisco | Don Fisher ClubhouseBuchanan YMCACommunity GrowsFriendship VillageGateway High SchoolHamilton Recreation CenterHandful PlayersHayward Rec ConnectHayes Valley Neighborhood AssociationJapanese Community Youth Council (JCYC)Jewish Community High School of the BayMagic ZonePrince Hall Computer Learning CenterSan Francisco Youth CommissionStreet Soccer USATruancy Assessment & Referral Center (TARC)Up on Top Afterschool & Summer ProgramUniversity of San FranciscoUrban Services YMCA | Western Addition Family Resource CenterThe Village ProjectWestern Addition Beacon CenterWestside Community ServicesWomen’s Community Clinic
4
A step toward ensuring mobility for all Community planning effort to address transportation gaps or barriers for
underserved neighborhoods and areas with vulnerable populations
SAN FRANCISCO MUNICIPAL TRANSPORTATION AGENCY 5
WHAT IS THE WESTERN ADDITION CBTP?
Executive Summary
The Western Addition Community-Based Transportation Plan (CBTP) includes a transportation planning analysis and community engagement process and recommendations. Through the engagement process, community members identified their transportation challenges and ideal solutions to improve mobility and access within the Western Addition.
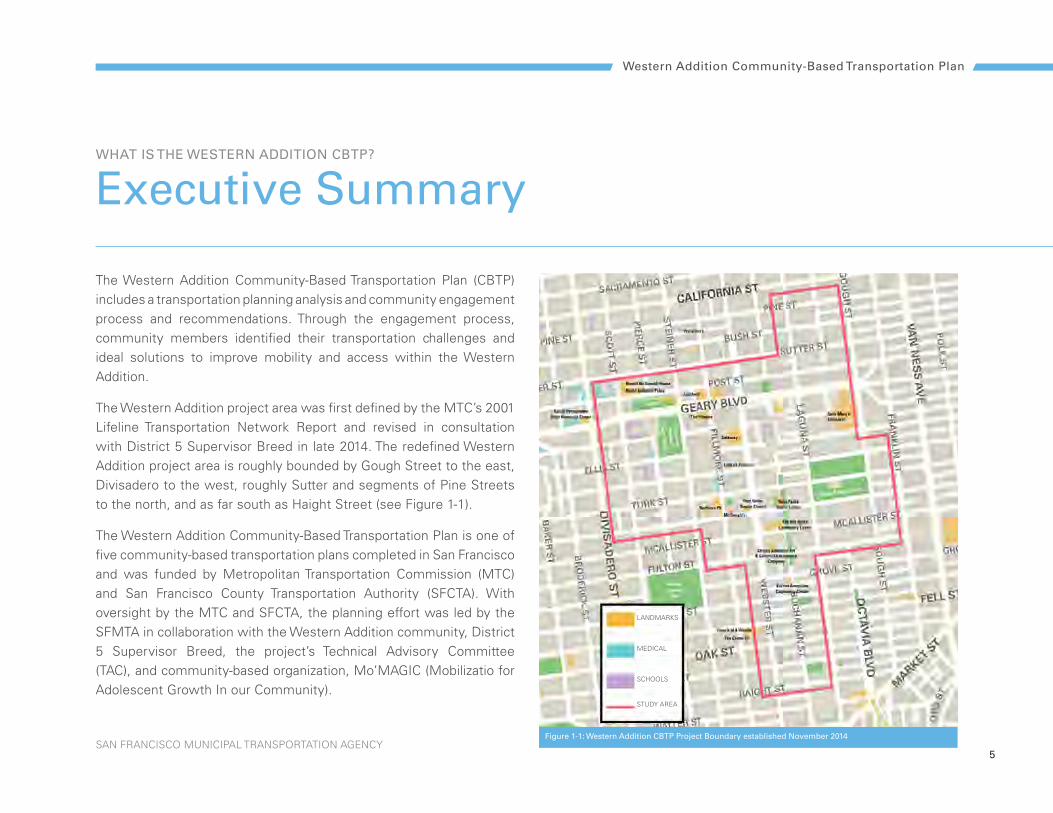
The Western Addition project area was first defined by the MTC’s 2001 Lifeline Transportation Network Report and revised in consultation with District 5 Supervisor Breed in late 2014. The redefined Western Addition project area is roughly bounded by Gough Street to the east, Divisadero to the west, roughly Sutter and segments of Pine Streets to the north, and as far south as Haight Street (see Figure 1-1).
The Western Addition Community-Based Transportation Plan is one of five community-based transportation plans completed in San Francisco and was funded by Metropolitan Transportation Commission (MTC) and San Francisco County Transportation Authority (SFCTA). With oversight by the MTC and SFCTA, the planning effort was led by the SFMTA in collaboration with the Western Addition community, District 5 Supervisor Breed, the project’s Technical Advisory Committee (TAC), and community-based organization, Mo’MAGIC (Mobilizatio for Adolescent Growth In our Community).
Western Addition Community-Based Transportation Plan
Figure 1-1: Western Addition CBTP Project Boundary established November 2014
LANDMARKS
MEDICAL
SCHOOLS
STUDY AREA
6
The Western Addition CBTP was designed to address the findings of the MTC’s 2001 Lifeline Transportation Network Report and MTC 2001 Regional Transportation Plan’s Environmental Justice Report. Both reports focused on the need to promote equity and support neighborhood-planning efforts in low-income communities throughout the Bay Area, in order to improve access to education and economic opportunity. This planning effort empowers community members with the opportunity to share their transportation challenges and work with SFMTA staff to create solutions that shape the future of their community.
The Western Addition CBTP builds on previous plans and projects by the San Francisco Planning Department, Recreation and Park Department, SFMTA and SFCTA, relevant to the Western Addition. Some of these plans and projects include the Octavia Boulevard Enhancement Project, Green Connections Plan, Buchanan Street Mall Activation Project, Muni Equity Strategy and 5 Fulton Rapid Project as well as citywide efforts like Muni Forward, Vision Zero and WalkFirst. Community engagement efforts from these previous documents provided a starting point for strategies to engage with the community.
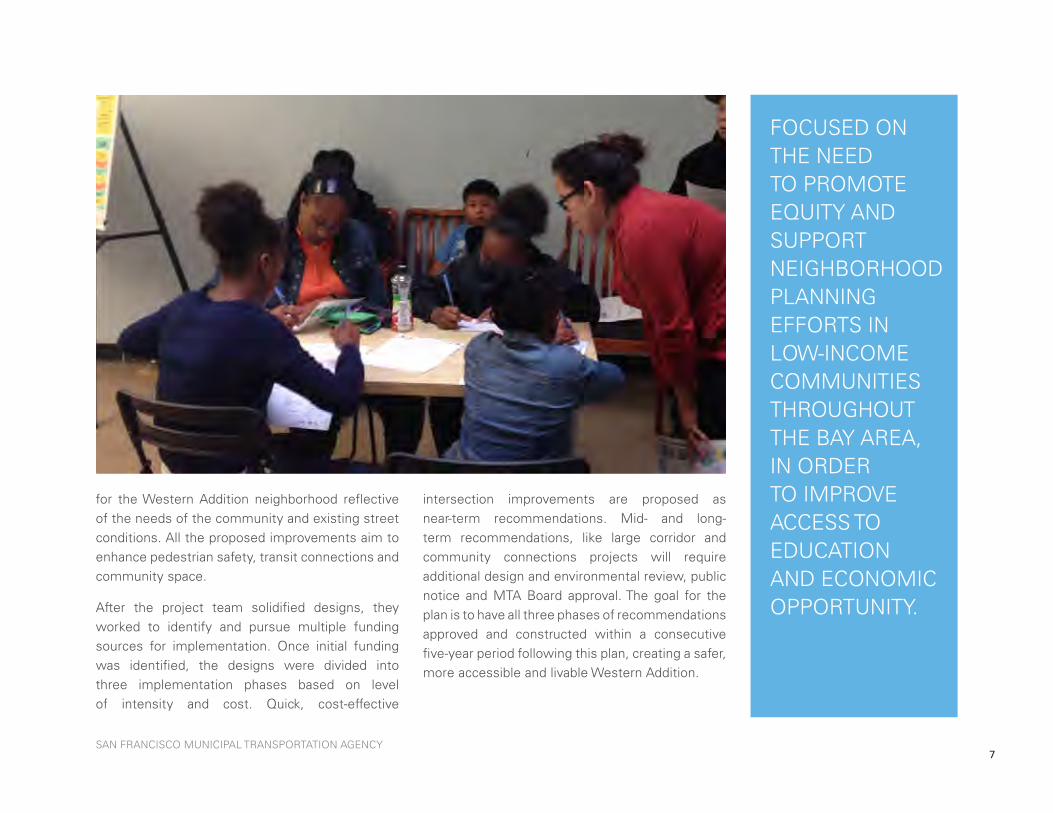
For ten months, the project team partnered with community-based organization, Mo’MAGIC, to collaborate directly with community members to identify transportation challenges and solutions. Mo’MAGIC provides social services and resources for at-risk and in-risk young people. Mo’MAGIC also brings together other local social service providers in an effort to support and serve the greater needs of the Western Addition community. They connected the project team with diverse community groups throughout the neighborhood and facilitated workshops at senior centers, elementary schools, and community centers.
Through these workshops, the project team obtained a broad understanding of the community’s transportation challenges and their ideal solutions. The project team incorporated community input in the development of streetscape recommendations throughout the neighborhood. In addition to the community input, the project team received guidance from District 5 Supervisor Breed and received additional support from the project’s Technical Advisory Committee (TAC), which consisted of City staff from the Planning Department, SFCTA, SF Public Utilities Commission, and SFMTA’s Transit Division and Livable Streets Group. Based on community input and technical expertise, the project team recommended transportation solutions
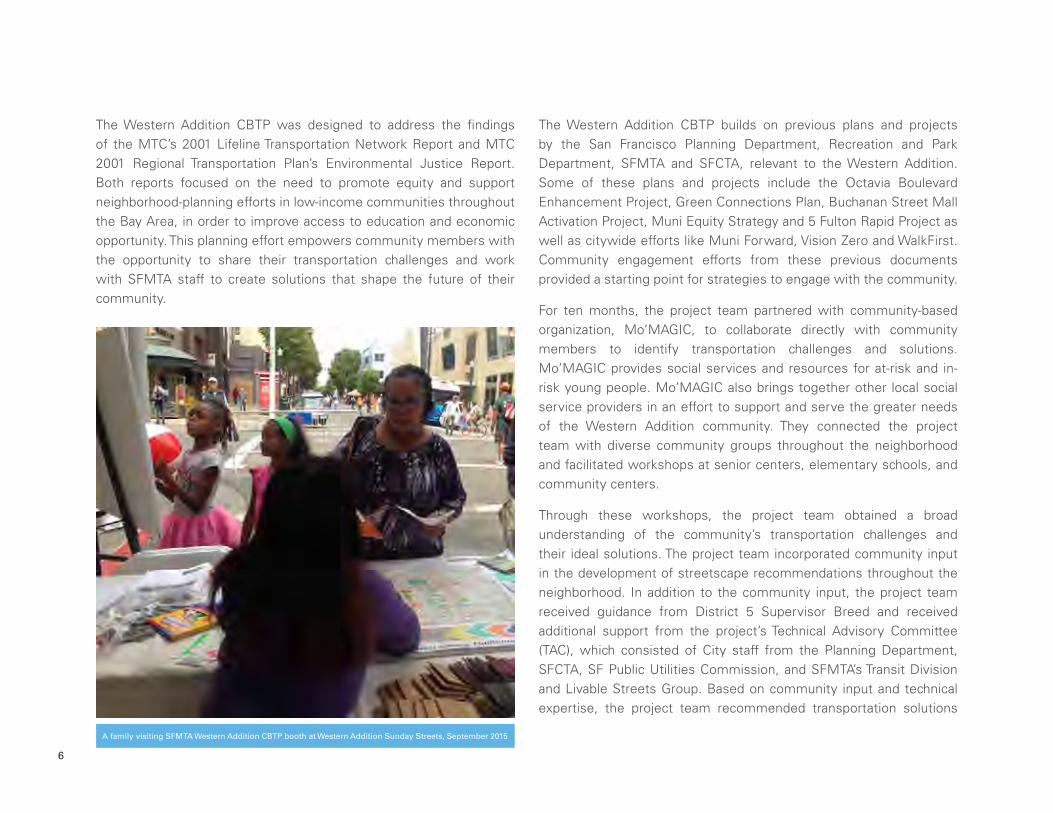
A family visiting SFMTA Western Addition CBTP booth at Western Addition Sunday Streets, September 2015
SAN FRANCISCO MUNICIPAL TRANSPORTATION AGENCY 7
for the Western Addition neighborhood reflective of the needs of the community and existing street conditions. All the proposed improvements aim to enhance pedestrian safety, transit connections and community space.
After the project team solidified designs, they worked to identify and pursue multiple funding sources for implementation. Once initial funding was identified, the designs were divided into three implementation phases based on level of intensity and cost. Quick, cost-effective
intersection improvements are proposed as near-term recommendations. Mid- and long-term recommendations, like large corridor and community connections projects will require additional design and environmental review, public notice and MTA Board approval. The goal for the plan is to have all three phases of recommendations approved and constructed within a consecutive five-year period following this plan, creating a safer, more accessible and livable Western Addition.
FOCUSED ON THE NEED TO PROMOTE EQUITY AND SUPPORT NEIGHBORHOOD PLANNING EFFORTS IN LOW-INCOME COMMUNITIES THROUGHOUT THE BAY AREA, IN ORDER TO IMPROVE ACCESS TO EDUCATION AND ECONOMIC OPPORTUNITY.


9
Introduction How did the Western Addition CBTP come to be?
10
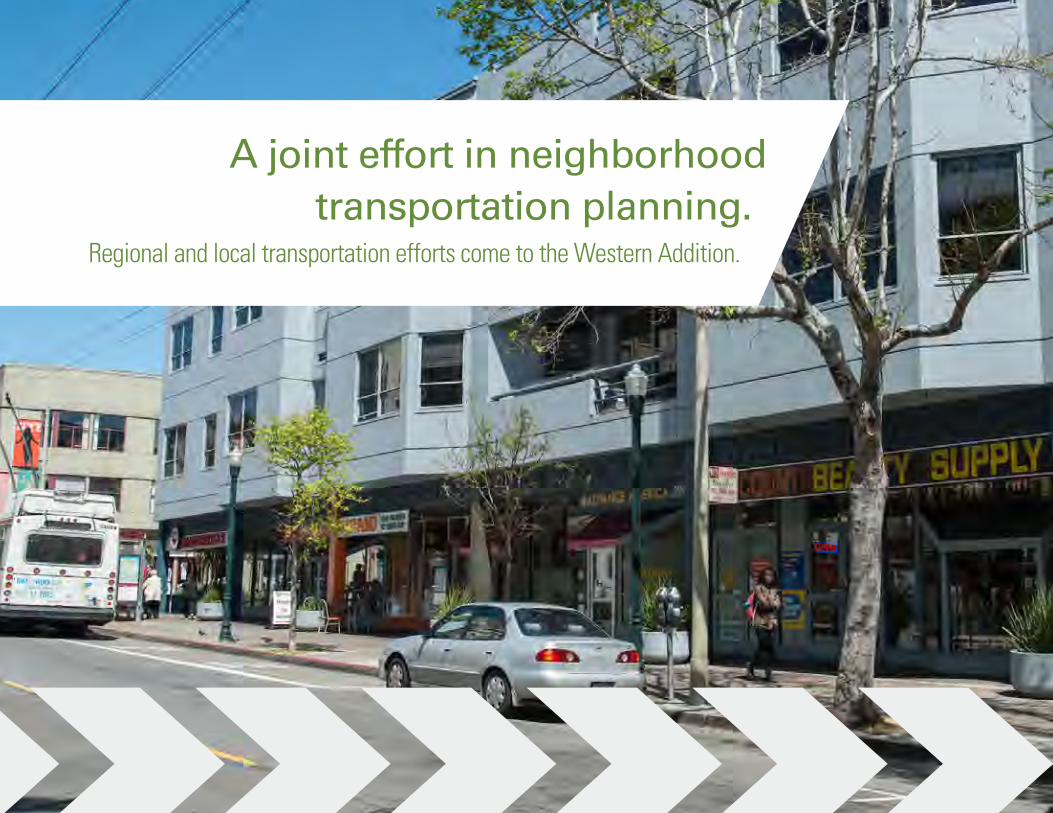
A joint effort in neighborhood transportation planning.
Regional and local transportation efforts come to the Western Addition.

SAN FRANCISCO MUNICIPAL TRANSPORTATION AGENCY 11
HOW DID THE WESTERN ADDITION CBTP COME TO BE?
Introduction
At the center of San Francisco, the Western Addition is a residential neighborhood located east of Golden Gate Park and west of City Hall between Market Street and Geary Boulevard. This neighborhood is home to many low-income housing residents as well as a large minority community. These characteristics in combination with San Francisco’s high-cost of living, led to the Western Addition’s classification as a Community of Concern in the Metropolitan Transportation Commission’s (MTC) initial transportation equity efforts of the early 2000s.
BackgroundIn 2002, the MTC launched a Bay Area-wide Community-Based Transportation Planning (CBTP) Program, which evolved from their Lifeline Transportation Network Report and the Environmental Justice Report. Both served to promote equity in low-income communities of color and recommended community-based planning as a method for setting neighborhood priorities for addressing transportation gaps. This program provides these identified communities an opportunity to address transportation challenges and collaborate with transportation agencies to find solutions.
Community-Based Transportation Plans (CBTPs) are intended to bring local residents, community organizations and transportation
agencies together to identify communities’ transportation disparities and develop improvement strategies. Community-based planning serves to identify projects, programs and/or strategies developed with robust community involvement that increase the efficacy of improving community members’ safety and access to their everyday destinations.
After community-supported projects, programs and/or strategies are identified, the SFMTA develops a potential implementation strategy including a funding plan. CBTPs are then used as a tool to compete for transportation funding for implementation. Each completed plan contains CBTP Requirements :
• Demographic analysis of the area• Documented results of community outreach efforts• List of community-prioritized transportation challenges• Implementation Strategy that addresses community
challenges• Viable public and private funding options for implementation• Identify stakeholder(s) committed to implementing the plan
Western Addition Community-Based Transportation Plan
12
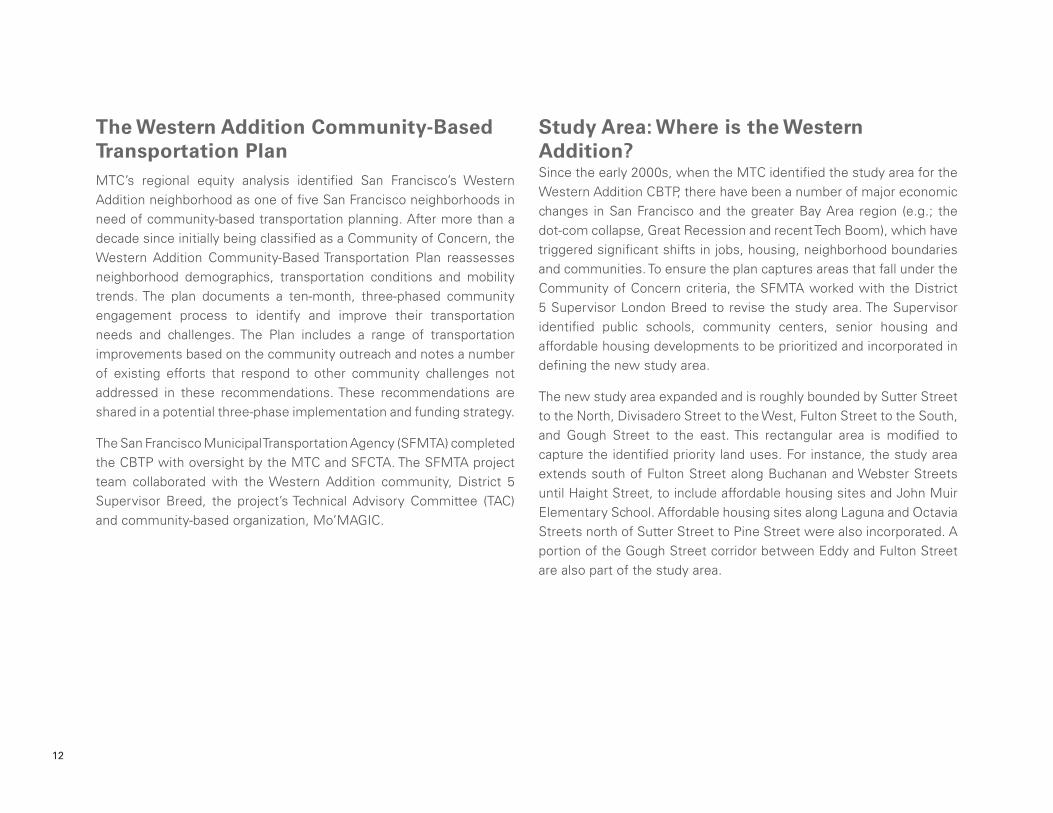
The Western Addition Community-Based Transportation PlanMTC’s regional equity analysis identified San Francisco’s Western Addition neighborhood as one of five San Francisco neighborhoods in need of community-based transportation planning. After more than a decade since initially being classified as a Community of Concern, the Western Addition Community-Based Transportation Plan reassesses neighborhood demographics, transportation conditions and mobility trends. The plan documents a ten-month, three-phased community engagement process to identify and improve their transportation needs and challenges. The Plan includes a range of transportation improvements based on the community outreach and notes a number of existing efforts that respond to other community challenges not addressed in these recommendations. These recommendations are shared in a potential three-phase implementation and funding strategy.
The San Francisco Municipal Transportation Agency (SFMTA) completed the CBTP with oversight by the MTC and SFCTA. The SFMTA project team collaborated with the Western Addition community, District 5 Supervisor Breed, the project’s Technical Advisory Committee (TAC) and community-based organization, Mo’MAGIC.
Study Area: Where is the Western Addition?Since the early 2000s, when the MTC identified the study area for the Western Addition CBTP, there have been a number of major economic changes in San Francisco and the greater Bay Area region (e.g.; the dot-com collapse, Great Recession and recent Tech Boom), which have triggered significant shifts in jobs, housing, neighborhood boundaries and communities. To ensure the plan captures areas that fall under the Community of Concern criteria, the SFMTA worked with the District 5 Supervisor London Breed to revise the study area. The Supervisor identified public schools, community centers, senior housing and affordable housing developments to be prioritized and incorporated in defining the new study area.
The new study area expanded and is roughly bounded by Sutter Street to the North, Divisadero Street to the West, Fulton Street to the South, and Gough Street to the east. This rectangular area is modified to capture the identified priority land uses. For instance, the study area extends south of Fulton Street along Buchanan and Webster Streets until Haight Street, to include affordable housing sites and John Muir Elementary School. Affordable housing sites along Laguna and Octavia Streets north of Sutter Street to Pine Street were also incorporated. A portion of the Gough Street corridor between Eddy and Fulton Street are also part of the study area.
SAN FRANCISCO MUNICIPAL TRANSPORTATION AGENCY 13
Eddy
Eddy
Post
Post
Post
Post
Larkin
Larkin
Ashbury
Ellis
Ellis
Haight
Hayes
Hayes
Hayes
Anzavista
Clay
Clay
Lyon Octavia
Polk
Polk
Steiner
Steiner
Steiner
Fillmore
Fillmore
Fillmore
Broderick Laguna
LagunaBuchanan
Buchanan
11th St
Waller
Ofarrell
Mcallister
Mcallister
Mcallister
Mcallister
Duboce
Jackson
Presidio
Buchanan
Baker
Central
Broderick
Leavenworth
Leavenworth
Scott
Scott
Central
BakerBaker
Pierce
Lyon
Hyde
Hyde
Gough
Webster
Saint Josephs
Page
Page
Page
Buena Vista East
Pine
Sacramento
Sacramento
Ofarrell
Grove
Grove
Grove
Fulton
Fulton
Fulton
Waller
Waller
Sutter
Hermann
Gough
Franklin
9th St
Market
DivisaderoDivisadero
Oak
Oak
Geary
California
Fell
Fell
13th St
Gough
Franklin
Larkin
10th St
CaliforniaCalifornia
California
Market
Franklin
Divisadero
Divisadero
Mission
FellFell
Fell
Van Ness
Van Ness
Oak
Oak
Oak
GearySutterBush
13th St
Masonic
South Van Ness
GearyGeary
Western AdditionCommunity-BasedTransportation Plan
User Name: dharris1Document Path: G:\01_Projects\Planning\WesternAdditionCommunityBasedTransportationProject\04_MXD\MTC Project Area.mxd
For reference contact: [email protected] Saved: 12/22/2016
1:10,000Scale[ 0.15 Miles miles
By downloading this map, you are agreeing to the following disclaimer: “The City and County of San Francisco(“City”) provides the following data as a public record and no rights of any kind are granted to any person by theCity’s provision of this data. The City and County of San Francisco (“City”) makes no representation regardingand does not guarantee or otherwise warrant the accuracy or completeness of this data. Anyone who uses thisdata for any purpose whatsoever does so entirely at their own risk. The City shall not be liable or otherwiseresponsible for any loss, harm, claim or action of any kind from any person arising from the use of this data. Byaccessing this data, the person accessing it acknowledges that she or he has read and does so under thecondition that she or he agrees to the contents and terms of this disclaimer."
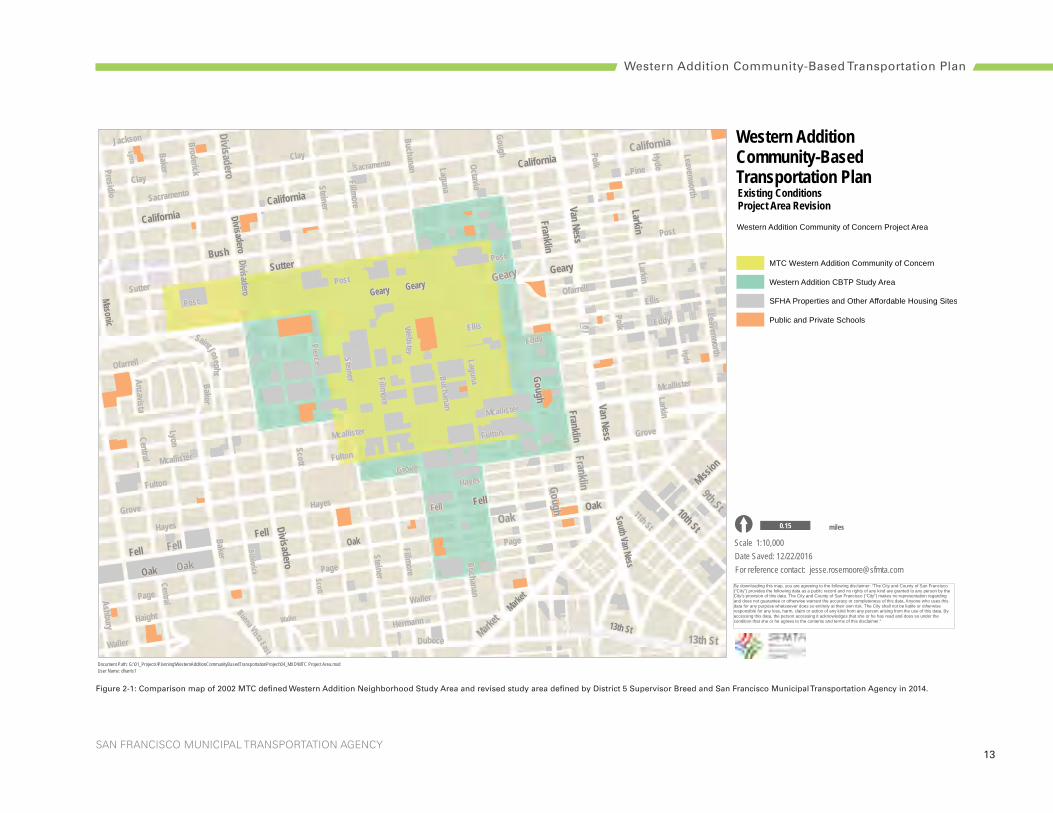
Existing ConditionsProject Area Revision
MTC Western Addition Community of Concern
Western Addition CBTP Study Area
SFHA Properties and Other Affordable Housing Sites
Public and Private Schools
Western Addition Community of Concern Project Area
Figure 2-1: Comparison map of 2002 MTC defined Western Addition Neighborhood Study Area and revised study area defined by District 5 Supervisor Breed and San Francisco Municipal Transportation Agency in 2014.
Western Addition Community-Based Transportation Plan
Report StructureThe Community-Based Transportation Planning process was comprised of three sequential phases leading to a funding and implementation strategy of the community-based transportation recommendations.
1. Existing Conditions and Demographics Analysis2. Community Engagement3. Funding and Implementation Strategy Development
This final plan contains the following chapters:
ExEcutivE Summary
Brief summary of the Western Addition CBTP
introduction
Overview of the contents of the planExiSting conditionS
Evaluation of the Western Addition’s demographics, land use, and transportation network
community outrEach
Summary of the community outreach process and findings
rEcommEndationS, Funding and implEmEntation Explanation of project recommendations, including a potential implementation and funding strategy
The Western Addition CBTP report structure serves to first tell the story of the Western Addition and how they became a community of concern, then the community’ issues and needs related to transportation and finally present the project team’s interpretation of the data collected and input from the community in the form of recommended physical improvements.

Existing Conditions What makes up the Western Addition and Who Lives There?
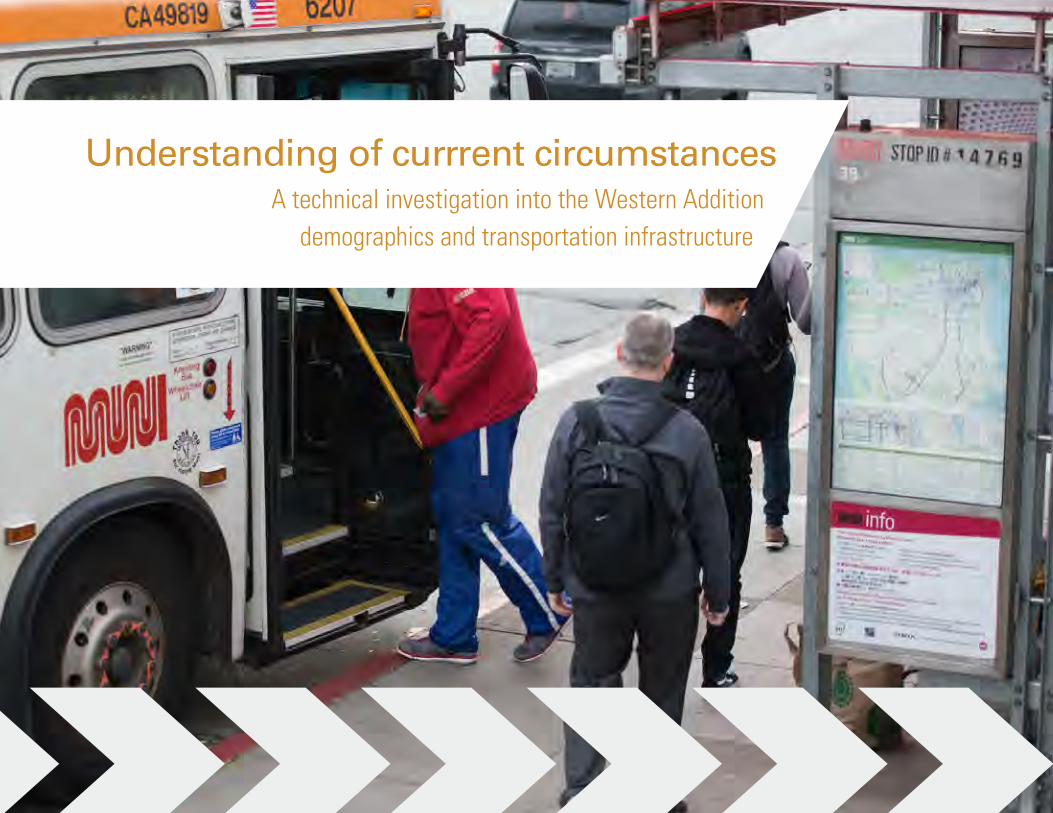
Understanding of currrent circumstances A technical investigation into the Western Addition
demographics and transportation infrastructure
SAN FRANCISCO MUNICIPAL TRANSPORTATION AGENCY 17
WHAT MAKES UP THE WESTERN ADDITION AND WHO LIVES THERE?
Existing Conditions
This chapter of the Western Addition CBTP includes a demographic analysis of the age, race, and income of the community, as well as an assessment of how residents travel throughout the neighborhood. The goal of this analysis is to understand how the community is living – who and how many people call the Western Addition home and how are they making their everyday trips. This chapter also summarizes the neighborhood land uses and transportation infrastructure. The land use assessments provide information regarding the type of housing in the neighborhood as well as churches, schools, community centers, stores and parks in the Western Addition. The neighborhood-wide transportation inventory includes all bus lines and other transit services and street infrastructure, like pedestrian countdown signals, bike lanes and sidewalk ramps. The transportation inventory also identifies transportation projects planned and recently constructed in the Western Addition. This analysis aims to help to answer two key questions:
1. After nearly 15 years since first being defined, is the Western Addition still a community of concern? and;
2. How does the Western Addition neighborhood conditions compare to the rest of San Francisco?
MethodologyThe MTC used U.S. Census data in its initial classification of Bay Area Communities of Concern. Similarly U.S. Census and American Community Survey (ACS) data is used to assess the Western Addition demographics for this chapter. These data sources create a demographic profile for the Western Addition and then compare with the demographic profile of San Francisco as a whole. These profiles are developed using 2000 decennial Census data and 2009-2013 Five-Year Estimates from the ACS.
Data was gathered at the smaller Census block group scale due to the neighbor scale of the project. There are roughly 24 Census block groups that intersect the project area and these block groups are used to represent the Western Addition for the Existing Conditions analysis. For this report, the Western Addition refers specifically to the project area boundaries in Figure 1-1.
WESTERN ADDITION COMMUNITY
Demographics Analysis
RACE
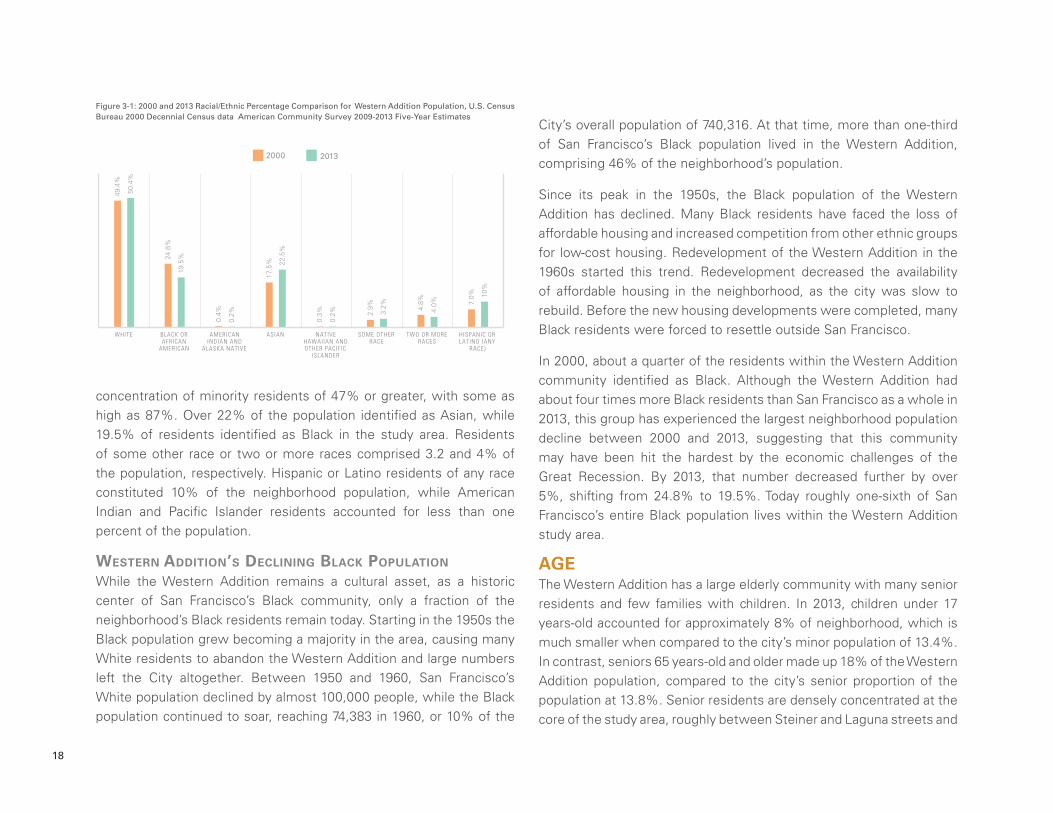
Today, the Western Addition neighborhood is divided equally between non-White minorities and White residents. The study area had a minority population of 50% in 2013. Most block groups have a
Western Addition Community-Based Transportation Plan
18
concentration of minority residents of 47% or greater, with some as high as 87%. Over 22% of the population identified as Asian, while 19.5% of residents identified as Black in the study area. Residents of some other race or two or more races comprised 3.2 and 4% of the population, respectively. Hispanic or Latino residents of any race constituted 10% of the neighborhood population, while American Indian and Pacific Islander residents accounted for less than one percent of the population.
WEStErn addition’S dEclining Black population
While the Western Addition remains a cultural asset, as a historic center of San Francisco’s Black community, only a fraction of the neighborhood’s Black residents remain today. Starting in the 1950s the Black population grew becoming a majority in the area, causing many White residents to abandon the Western Addition and large numbers left the City altogether. Between 1950 and 1960, San Francisco’s White population declined by almost 100,000 people, while the Black population continued to soar, reaching 74,383 in 1960, or 10% of the
City’s overall population of 740,316. At that time, more than one-third of San Francisco’s Black population lived in the Western Addition, comprising 46% of the neighborhood’s population.
Since its peak in the 1950s, the Black population of the Western Addition has declined. Many Black residents have faced the loss of affordable housing and increased competition from other ethnic groups for low-cost housing. Redevelopment of the Western Addition in the 1960s started this trend. Redevelopment decreased the availability of affordable housing in the neighborhood, as the city was slow to rebuild. Before the new housing developments were completed, many Black residents were forced to resettle outside San Francisco.
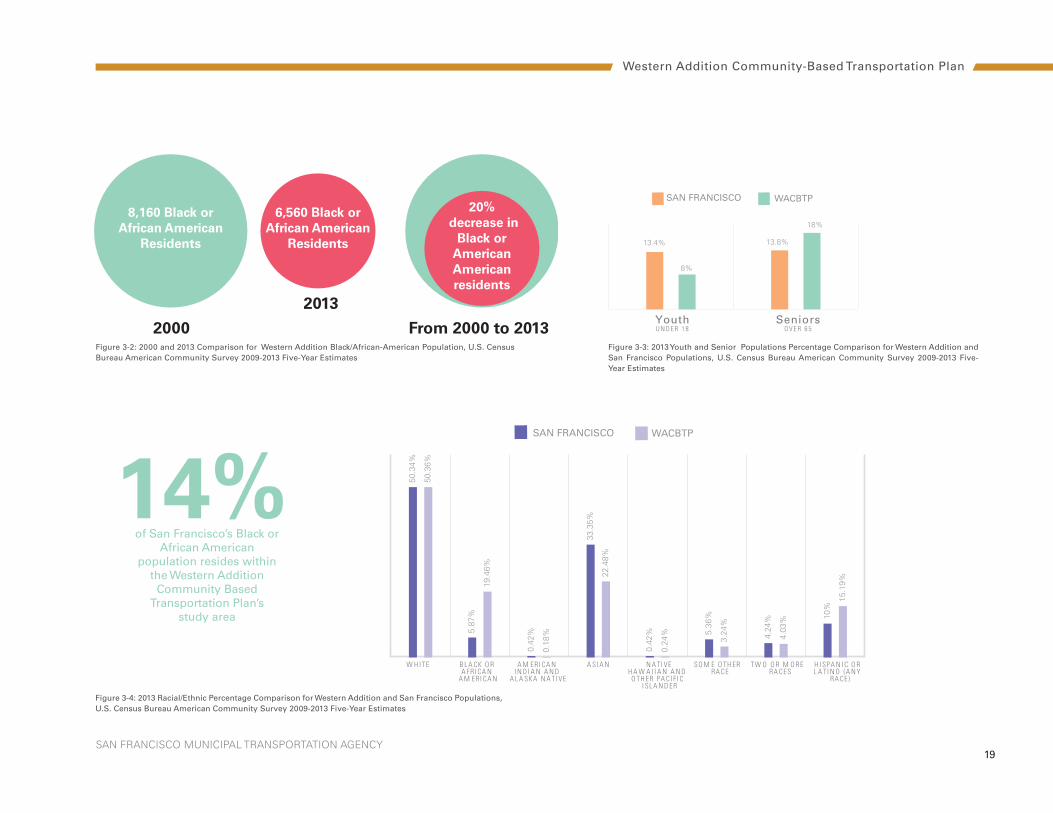
In 2000, about a quarter of the residents within the Western Addition community identified as Black. Although the Western Addition had about four times more Black residents than San Francisco as a whole in 2013, this group has experienced the largest neighborhood population decline between 2000 and 2013, suggesting that this community may have been hit the hardest by the economic challenges of the Great Recession. By 2013, that number decreased further by over 5%, shifting from 24.8% to 19.5%. Today roughly one-sixth of San Francisco’s entire Black population lives within the Western Addition study area.
AGEThe Western Addition has a large elderly community with many senior residents and few families with children. In 2013, children under 17 years-old accounted for approximately 8% of neighborhood, which is much smaller when compared to the city’s minor population of 13.4%. In contrast, seniors 65 years-old and older made up 18% of the Western Addition population, compared to the city’s senior proportion of the population at 13.8%. Senior residents are densely concentrated at the core of the study area, roughly between Steiner and Laguna streets and
14%of San Francisco’s Black or
African American population resides within
the Western Addition Community Based
Transportation Plan’s study area
49.4
%
24.8
%
0.4%
17.5
%
0.3% 2.
9% 4.8% 7.
0%
50.4
%
19.5
%
0.2%
22.5
%
0.2% 3.
2% 4.0%
10%
WHITE BLACK OR AFRICAN
AMERICAN
AMERICAN INDIAN AND
ALASKA NATIVE
ASIAN NATIVE HAWAIIAN AND OTHER PACIFIC
ISLANDER
SOME OTHER RACE
TWO OR MORE RACES
HISPANIC OR LATINO (ANY
RACE)
20132000
50.3
4%
5.87
%
0.42
%
33.3
5%
0.42
% 5.36
%
4.24
% 10%
50.3
6%
19.4
6%
0.18
%
22.4
8%
0.24
%
3.24
%
4.03
%
15.1
9%
W H I TE B L A CK O R A FRI CA N
A M ERI CA N
A M ERI CA N I N D I A N A N D
A L A SKA N A TI VE
A SI A N N A TI VE H A W A I I A N A N D O TH ER PA CI F I C
I SL A N D ER
SO M E O TH ER RA CE
TW O O R M O RE RA CES
H I SPA N I C O R L A TI N O (A N Y
RA CE)
WACBTPSAN FRANCISCO
WACBTP Black Population - 2013
WACBTP Black Population - 2000
20% decrease in
Black or American American residents
8,160 Black or African American
Residents
6,560 Black or African American
Residents
2000
2013
From 2000 to 2013
Figure 3-1: 2000 and 2013 Racial/Ethnic Percentage Comparison for Western Addition Population, U.S. Census Bureau 2000 Decennial Census data American Community Survey 2009-2013 Five-Year Estimates
SAN FRANCISCO MUNICIPAL TRANSPORTATION AGENCY 19
Figure 3-4: 2013 Racial/Ethnic Percentage Comparison for Western Addition and San Francisco Populations, U.S. Census Bureau American Community Survey 2009-2013 Five-Year Estimates
14%of San Francisco’s Black or
African American population resides within
the Western Addition Community Based
Transportation Plan’s study area
49.4
%
24.8
%
0.4%
17.5
%
0.3% 2.
9% 4.8% 7.
0%
50.4
%
19.5
%
0.2%
22.5
%
0.2% 3.
2% 4.0%
10%
WHITE BLACK OR AFRICAN
AMERICAN
AMERICAN INDIAN AND
ALASKA NATIVE
ASIAN NATIVE HAWAIIAN AND OTHER PACIFIC
ISLANDER
SOME OTHER RACE
TWO OR MORE RACES
HISPANIC OR LATINO (ANY
RACE)
20132000
50.3
4%
5.87
%
0.42
%
33.3
5%
0.42
% 5.36
%
4.24
% 10%
50.3
6%
19.4
6%
0.18
%
22.4
8%
0.24
%
3.24
%
4.03
%
15.1
9%
W H I TE B L A CK O R A FRI CA N
A M ERI CA N
A M ERI CA N I N D I A N A N D
A L A SKA N A TI VE
A SI A N N A TI VE H A W A I I A N A N D O TH ER PA CI F I C
I SL A N D ER
SO M E O TH ER RA CE
TW O O R M O RE RA CES
H I SPA N I C O R L A TI N O (A N Y
RA CE)
WACBTPSAN FRANCISCO
WACBTP Black Population - 2013
WACBTP Black Population - 2000
20% decrease in
Black or American American residents
8,160 Black or African American
Residents
6,560 Black or African American
Residents
2000
2013
From 2000 to 2013
14%of San Francisco’s Black or
African American population resides within
the Western Addition Community Based
Transportation Plan’s study area
49.4
%
24.8
%
0.4%
17.5
%
0.3% 2.
9% 4.8% 7.
0%
50.4
%
19.5
%
0.2%
22.5
%
0.2% 3.
2% 4.0%
10%
WHITE BLACK OR AFRICAN
AMERICAN
AMERICAN INDIAN AND
ALASKA NATIVE
ASIAN NATIVE HAWAIIAN AND OTHER PACIFIC
ISLANDER
SOME OTHER RACE
TWO OR MORE RACES
HISPANIC OR LATINO (ANY
RACE)
20132000
50.3
4%
5.87
%
0.42
%
33.3
5%
0.42
% 5.36
%
4.24
% 10%
50.3
6%
19.4
6%
0.18
%
22.4
8%
0.24
%
3.24
%
4.03
%
15.1
9%
W H I TE B L A CK O R A FRI CA N
A M ERI CA N
A M ERI CA N I N D I A N A N D
A L A SKA N A TI VE
A SI A N N A TI VE H A W A I I A N A N D O TH ER PA CI F I C
I SL A N D ER
SO M E O TH ER RA CE
TW O O R M O RE RA CES
H I SPA N I C O R L A TI N O (A N Y
RA CE)
WACBTPSAN FRANCISCO
WACBTP Black Population - 2013
WACBTP Black Population - 2000
20% decrease in
Black or American American residents
8,160 Black or African American
Residents
6,560 Black or African American
Residents
2000
2013
From 2000 to 2013Figure 3-2: 2000 and 2013 Comparison for Western Addition Black/African-American Population, U.S. Census Bureau American Community Survey 2009-2013 Five-Year Estimates
Western Addition Community-Based Transportation Plan
Figure 3-3: 2013 Youth and Senior Populations Percentage Comparison for Western Addition and San Francisco Populations, U.S. Census Bureau American Community Survey 2009-2013 Five-Year Estimates
Family
Single
Mutliple Occupany (Non-Family)
50%
31%19%
WACBTP households account for 5% of
San Francisco’s total households.
5%
WACBTP 2013 POPULATION
33,707SAN FRANCSICO 2013 POPULATION
817,501WACBTP residents make up about 4% of the population of San Francisco
13.4% 13.8%
8%
18%
U N D E R 1 8 O V E R 6 5
SAN FRANCISCO WACBTP
SeniorsYouth
20
THE WESTERN
ADDITION IS
ONE OF SAN
FRANCISCO’S
LOW-INCOME
NEIGHBORHOODS
WITH AN
AVERAGE MEDIAN
INCOME OF
APPROXIMATELY
$55,770.
COMPARED TO
SAN FRANCISCO’S
MEDIAN INCOME
OF $75,604,
THE WESTERN
ADDITION’S
MEDIAN INCOME
IS NEARLY
$20,000 LESS.
Eddy and McAllister Streets, at Rosa Parks Senior Center, Western Addition Senior Center, Freedom West Housing and Willie B. Kennedy Apartments.
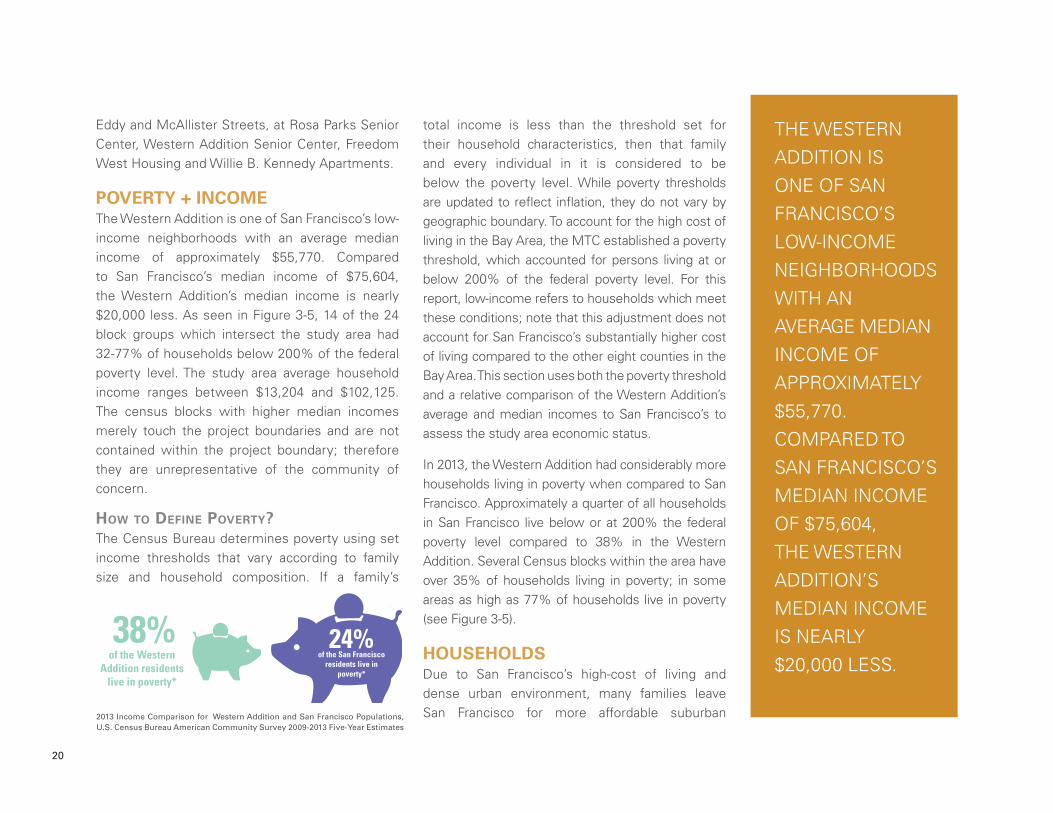
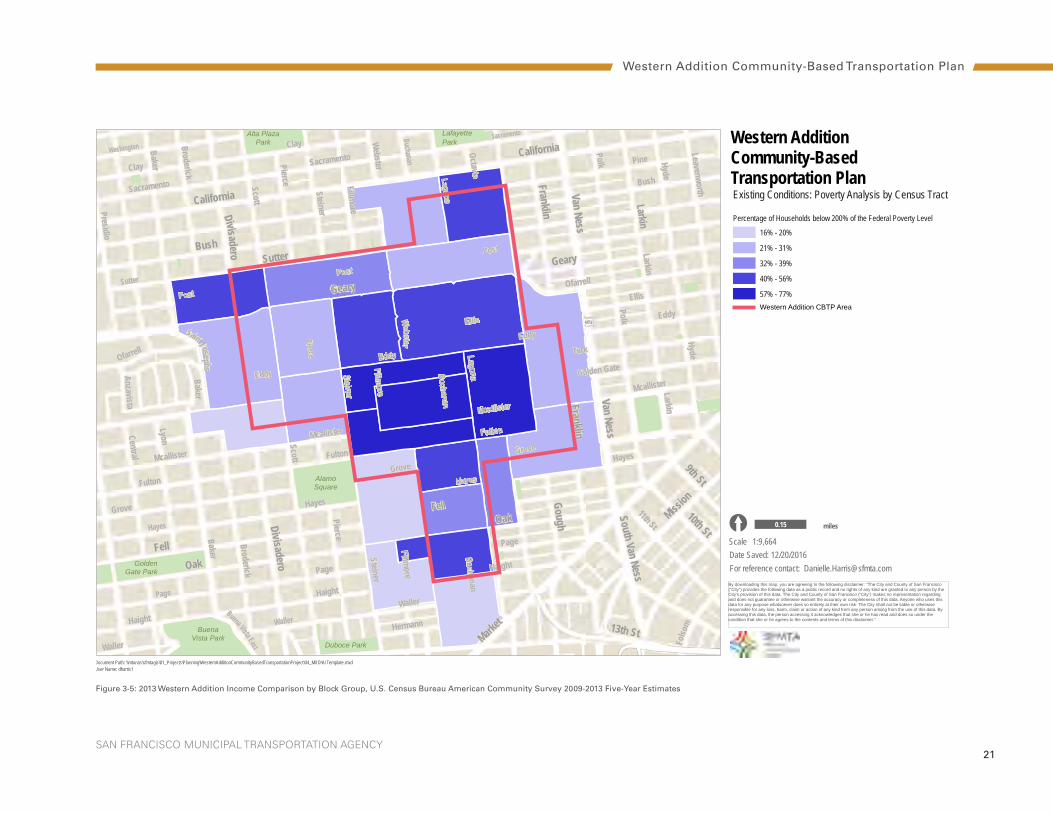
POVERTY + INCOMEThe Western Addition is one of San Francisco’s low-income neighborhoods with an average median income of approximately $55,770. Compared to San Francisco’s median income of $75,604, the Western Addition’s median income is nearly $20,000 less. As seen in Figure 3-5, 14 of the 24 block groups which intersect the study area had 32-77% of households below 200% of the federal poverty level. The study area average household income ranges between $13,204 and $102,125. The census blocks with higher median incomes merely touch the project boundaries and are not contained within the project boundary; therefore they are unrepresentative of the community of concern.
hoW to dEFinE povErty?The Census Bureau determines poverty using set income thresholds that vary according to family size and household composition. If a family’s
total income is less than the threshold set for their household characteristics, then that family and every individual in it is considered to be below the poverty level. While poverty thresholds are updated to reflect inflation, they do not vary by geographic boundary. To account for the high cost of living in the Bay Area, the MTC established a poverty threshold, which accounted for persons living at or below 200% of the federal poverty level. For this report, low-income refers to households which meet these conditions; note that this adjustment does not account for San Francisco’s substantially higher cost of living compared to the other eight counties in the Bay Area. This section uses both the poverty threshold and a relative comparison of the Western Addition’s average and median incomes to San Francisco’s to assess the study area economic status.
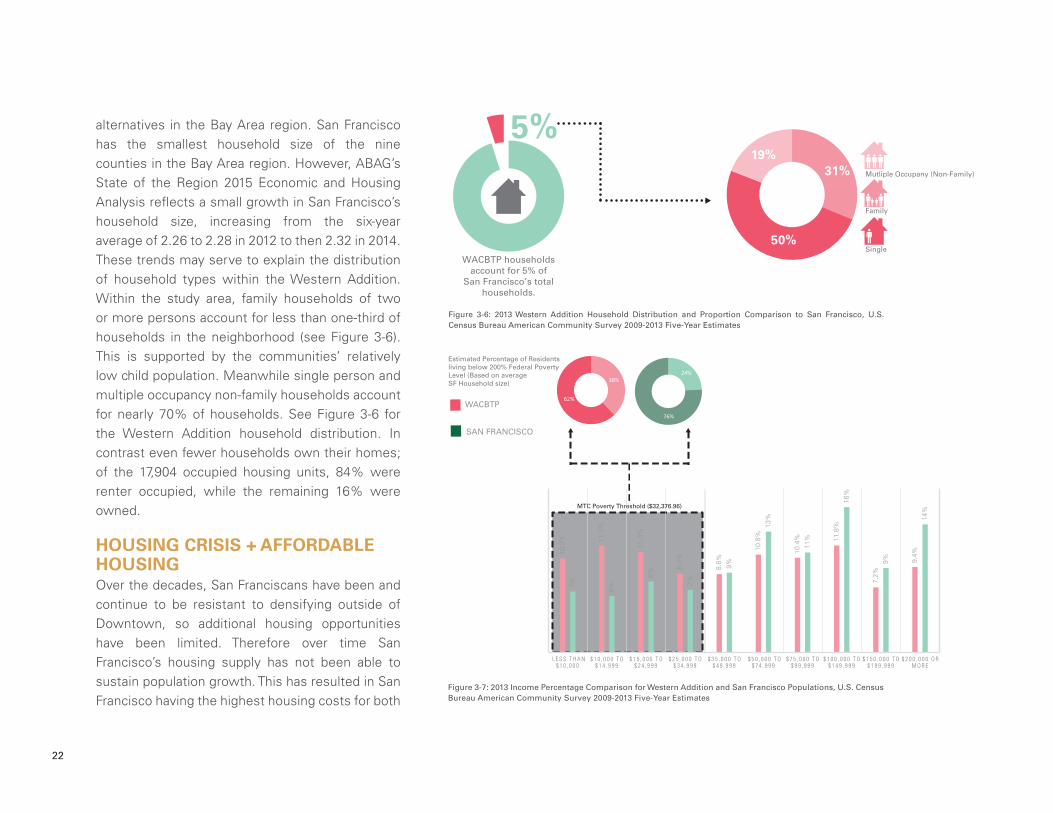
In 2013, the Western Addition had considerably more households living in poverty when compared to San Francisco. Approximately a quarter of all households in San Francisco live below or at 200% the federal poverty level compared to 38% in the Western Addition. Several Census blocks within the area have over 35% of households living in poverty; in some areas as high as 77% of households live in poverty (see Figure 3-5).
HOUSEHOLDSDue to San Francisco’s high-cost of living and dense urban environment, many families leave San Francisco for more affordable suburban
10.3
% 11.7
%
11.0
%
8.7%
8.6%
10.8
%
10.4
% 11.8
%
7.2%
9.4%
7%
6%
8%
7%
9%
13%
11%
16%
9%
14%
L E S S T H A N $ 1 0 , 0 0 0
$ 1 0 , 0 0 0 T O $ 1 4 , 9 9 9
$ 1 5 , 0 0 0 T O $ 2 4 , 9 9 9
$ 2 5 , 0 0 0 T O $ 3 4 , 9 9 9
$ 3 5 , 0 0 0 T O $ 4 9 , 9 9 9
$ 5 0 , 0 0 0 T O $ 7 4 , 9 9 9
$ 7 5 , 0 0 0 T O $ 9 9 , 9 9 9
$ 1 0 0 , 0 0 0 T O $ 1 4 9 , 9 9 9
$ 1 5 0 , 0 0 0 T O $ 1 9 9 , 9 9 9
$ 2 0 0 , 0 0 0 O R M O R E
38%
62%
24%
76%
Estimated Percentage of Residentsliving below 200% Federal Poverty Level (Based on average SF Household size)
MTC Poverty Threshold ($32,376.96)
SAN FRANCISCO
WACBTP
-
of the San Francisco residents live in
poverty*
of the Western 24%
Addition residents live in poverty*
38%
2013 Income Comparison for Western Addition and San Francisco Populations, U.S. Census Bureau American Community Survey 2009-2013 Five-Year Estimates
SAN FRANCISCO MUNICIPAL TRANSPORTATION AGENCY 21
Western AdditionCommunity-BasedTransportation Plan
User Name: dharris1Document Path: \\mtanas\sfmtagis\01_Projects\Planning\WesternAdditionCommunityBasedTransportationProject\04_MXD\Ai Template.mxd
For reference contact: [email protected] Saved: 12/20/2016
1:9,664Scale[ 0.15 Milesmiles
By downloading this map, you are agreeing to the following disclaimer: “The City and County of San Francisco(“City”) provides the following data as a public record and no rights of any kind are granted to any person by theCity’s provision of this data. The City and County of San Francisco (“City”) makes no representation regardingand does not guarantee or otherwise warrant the accuracy or completeness of this data. Anyone who uses thisdata for any purpose whatsoever does so entirely at their own risk. The City shall not be liable or otherwiseresponsible for any loss, harm, claim or action of any kind from any person arising from the use of this data. Byaccessing this data, the person accessing it acknowledges that she or he has read and does so under thecondition that she or he agrees to the contents and terms of this disclaimer."
Western Addition CBTP Area
AlamoSquare
Alta PlazaPark
LafayettePark
Duboce Park
BuenaVista Park
GoldenGate Park
Golden Gate
Buchanan
Turk
Larkin
Larkin
Ellis
Ellis
Hayes
Hayes
Hayes
Hayes
Anzavista
Eddy
Eddy
Eddy
Eddy
Clay
Clay
Leavenworth
Folso
m
Pierce
Webster
Polk
Polk
Steiner
Steiner
Steiner
Fillmore
Fillmore
Fillmore
Broderick Laguna
LagunaBuchanan
Buchanan
11th St
Sacramento
Sacramento
Sacramento
Waller
Ofarrell
Mcallister
Mcallister
Mcallister
Mcallister
Washington
Post
Post
Post
Octavia
Pierce
Baker
Presidio
Central
BroderickScott
Scott
BakerBaker
Pierce
Lyon
Hyde
Hyde
Webster
Saint Josephs
Buena Vista East
Bush
Haight
Haight
Haight
Page
Page
Page
Pine
Ofarrell
Grove
Grove
Grove
Fulton
Fulton
Fulton
Waller
Waller
Sutter
Hermann
9th St
California
California
13th St
Mission
Larkin
Franklin
GoughFranklin
Geary
10th St
Divisade r o
Divisadero
Van Ness
Van Ness
Oak
Oak
SutterBush
Fell
Fell
Market
South Van Ness
Geary
Percentage of Households below 200% of the Federal Poverty Level
16% - 20%
21% - 31%
32% - 39%
40% - 56%
57% - 77%
Existing Conditions: Poverty Analysis by Census Tract
Figure 3-5: 2013 Western Addition Income Comparison by Block Group, U.S. Census Bureau American Community Survey 2009-2013 Five-Year Estimates
Western Addition Community-Based Transportation Plan
22
10.3
% 11.7
%
11.0
%
8.7%
8.6%
10.8
%
10.4
% 11.8
%
7.2%
9.4%
7%
6%
8%
7%
9%
13%
11%
16%
9%
14%
L E S S T H A N $ 1 0 , 0 0 0
$ 1 0 , 0 0 0 T O $ 1 4 , 9 9 9
$ 1 5 , 0 0 0 T O $ 2 4 , 9 9 9
$ 2 5 , 0 0 0 T O $ 3 4 , 9 9 9
$ 3 5 , 0 0 0 T O $ 4 9 , 9 9 9
$ 5 0 , 0 0 0 T O $ 7 4 , 9 9 9
$ 7 5 , 0 0 0 T O $ 9 9 , 9 9 9
$ 1 0 0 , 0 0 0 T O $ 1 4 9 , 9 9 9
$ 1 5 0 , 0 0 0 T O $ 1 9 9 , 9 9 9
$ 2 0 0 , 0 0 0 O R M O R E
38%
62%
24%
76%
Estimated Percentage of Residentsliving below 200% Federal Poverty Level (Based on average SF Household size)
MTC Poverty Threshold ($32,376.96)
SAN FRANCISCO
WACBTP
-
of the San Francisco residents live in
poverty*
of the Western 24%
Addition residents live in poverty*
38%
Family
Single
Mutliple Occupany (Non-Family)
50%
31%19%
WACBTP households account for 5% of
San Francisco’s total households.
5%
WACBTP 2013 POPULATION
33,707SAN FRANCSICO 2013 POPULATION
817,501WACBTP residents make up about 4% of the population of San Francisco
13.4% 13.8%
8%
18%
U N D E R 1 8 O V E R 6 5
SAN FRANCISCO WACBTP
SeniorsYouth
Figure 3-6: 2013 Western Addition Household Distribution and Proportion Comparison to San Francisco, U.S. Census Bureau American Community Survey 2009-2013 Five-Year Estimates
Figure 3-7: 2013 Income Percentage Comparison for Western Addition and San Francisco Populations, U.S. Census Bureau American Community Survey 2009-2013 Five-Year Estimates
alternatives in the Bay Area region. San Francisco has the smallest household size of the nine counties in the Bay Area region. However, ABAG’s State of the Region 2015 Economic and Housing Analysis reflects a small growth in San Francisco’s household size, increasing from the six-year average of 2.26 to 2.28 in 2012 to then 2.32 in 2014. These trends may serve to explain the distribution of household types within the Western Addition. Within the study area, family households of two or more persons account for less than one-third of households in the neighborhood (see Figure 3-6). This is supported by the communities’ relatively low child population. Meanwhile single person and multiple occupancy non-family households account for nearly 70% of households. See Figure 3-6 for the Western Addition household distribution. In contrast even fewer households own their homes; of the 17,904 occupied housing units, 84% were renter occupied, while the remaining 16% were owned.
HOUSING CRISIS + AFFORDABLE HOUSINGOver the decades, San Franciscans have been and continue to be resistant to densifying outside of Downtown, so additional housing opportunities have been limited. Therefore over time San Francisco’s housing supply has not been able to sustain population growth. This has resulted in San Francisco having the highest housing costs for both
SAN FRANCISCO MUNICIPAL TRANSPORTATION AGENCY 23
AlamoSquare
AltaPlazaPark
LafayettePark
JeffersonSquare
Duboce ParkBuena
Vista Park
GoldenGate Park
9th St
13th St
Marke
t
Mission
Larkin
Gough
Franklin
Franklin
10th St
California
California
California
Divisadero
Divisadero
Divisadero
Van Ness
Van Ness
Sutter
Oak
Oak
Oak
BushGeary
Geary
Fell
Fell
Fell
Mark
et
Market
Masonic
South Van Ness
Geary
Western AdditionCommunity BasedTransportation Plan
User Name: dharris1Document Path: G:\01_Projects\Planning\WesternAdditionCommunityBasedTransportationProject\04_MXD\HousingMap_JR.mxd
For reference contact: [email protected] Saved: 12/22/2016
1:10,000Scale[
Existing ConditionsExisting and Proposed Housingand Affordable Housing Units
0.15 Miles miles
By downloading this map, you are agreeing to the following disclaimer: “The City and County of San Francisco(“City”) provides the following data as a public record and no rights of any kind are granted to any person by theCity’s provision of this data. The City and County of San Francisco (“City”) makes no representation regardingand does not guarantee or otherwise warrant the accuracy or completeness of this data. Anyone who uses thisdata for any purpose whatsoever does so entirely at their own risk. The City shall not be liable or otherwiseresponsible for any loss, harm, claim or action of any kind from any person arising from the use of this data. Byaccessing this data, the person accessing it acknowledges that she or he has read and does so under thecondition that she or he agrees to the contents and terms of this disclaimer."
Net New Affordable Units
Net New Housing Units
Western Addition CBTP Study Area
Existing Affordable Housing Units
Existing Affordable Housing
Parks
1 - 25
26 - 5
0
51 - 7
5
76 - 1
60
161 -
260
261 -
450
451 -
767
1 - 25
26 - 5
0
51 - 7
5
76 - 1
60
15 - 3
7
38 - 6
9
70 - 1
13
114 -
178
179 -
276
277 -
469
470 -
767
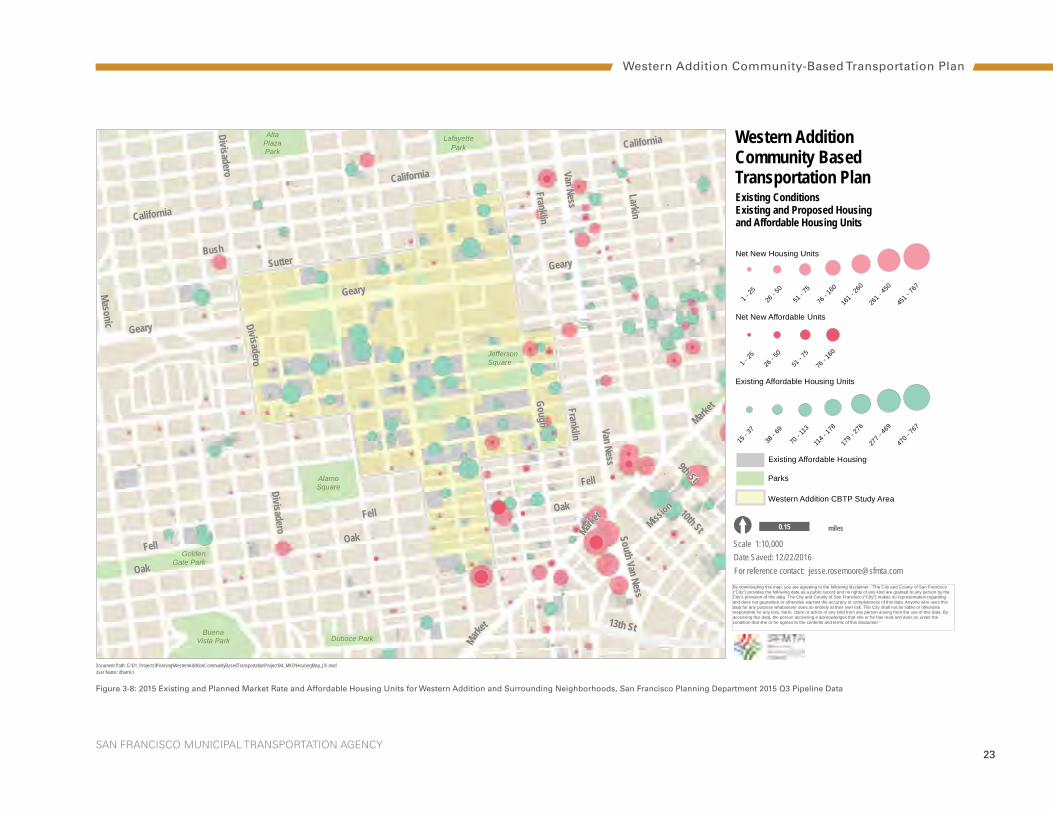
Figure 3-8: 2015 Existing and Planned Market Rate and Affordable Housing Units for Western Addition and Surrounding Neighborhoods, San Francisco Planning Department 2015 Q3 Pipeline Data
Western Addition Community-Based Transportation Plan
24
buyers and renters within the Bay Area. This imbalance heightened soon after the Great Recession as San Francisco became one of the most desirable places due to its job growth, especially with white collar tech jobs. This population increase has created even greater housing demand and thus further increasing housing costs, resulting in San Francisco having the one of the most expensive housing markets in the nation. The City is working to address the housing crisis by promoting pro-development legislation, increasing the City’s overall housing supply. However without specifically focusing on the development of affordable housing units, the City will need to substantially increase the overall number housing units than planned in order to reduce the housing cost enough to enable low- and mid-income families to afford to stay in San Francisco. The Proposed Housing Map (Figure 3-8) identifies the number of new housing units with the light pink circles, while the smaller dark pink circles highlights the proportion of those new units that are affordable. The turquoise circles indicate the proportion of existing affordable housing within the Western Addition, which are currently not meeting the housing needs of the Western Addition community, as displacement continues. Without addressing the community’s housing needs, there is potential for greater displacement in the Western Addition in the near future.
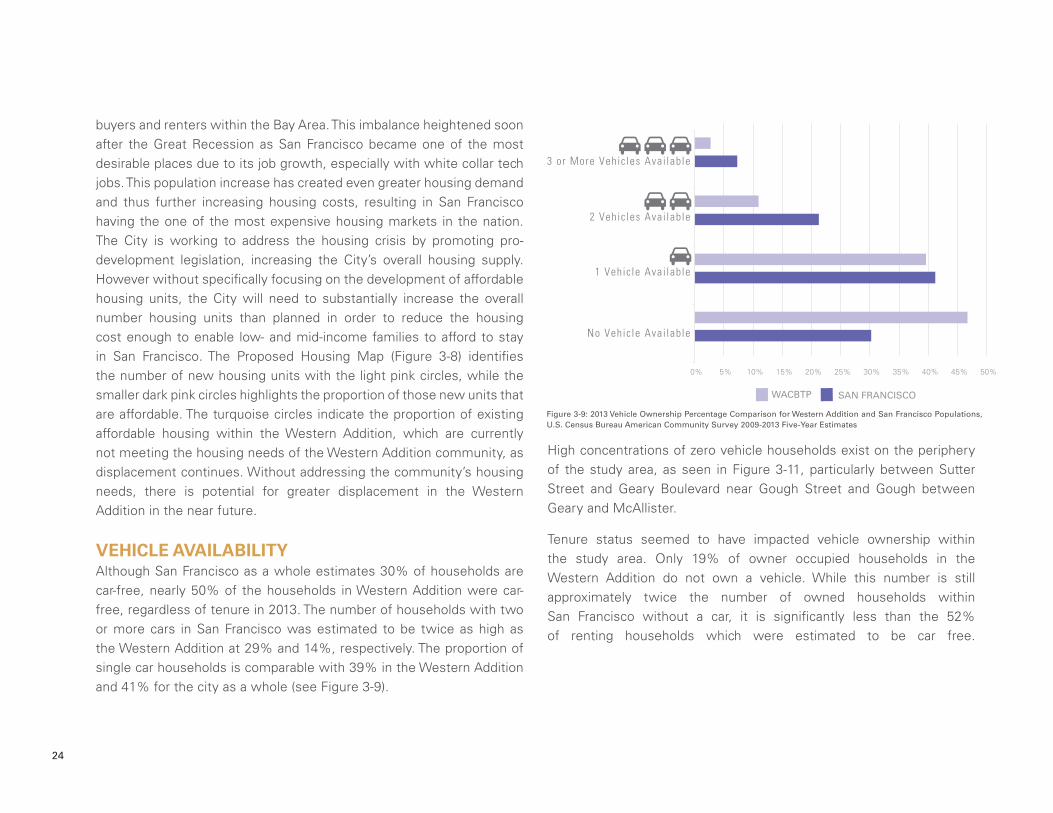
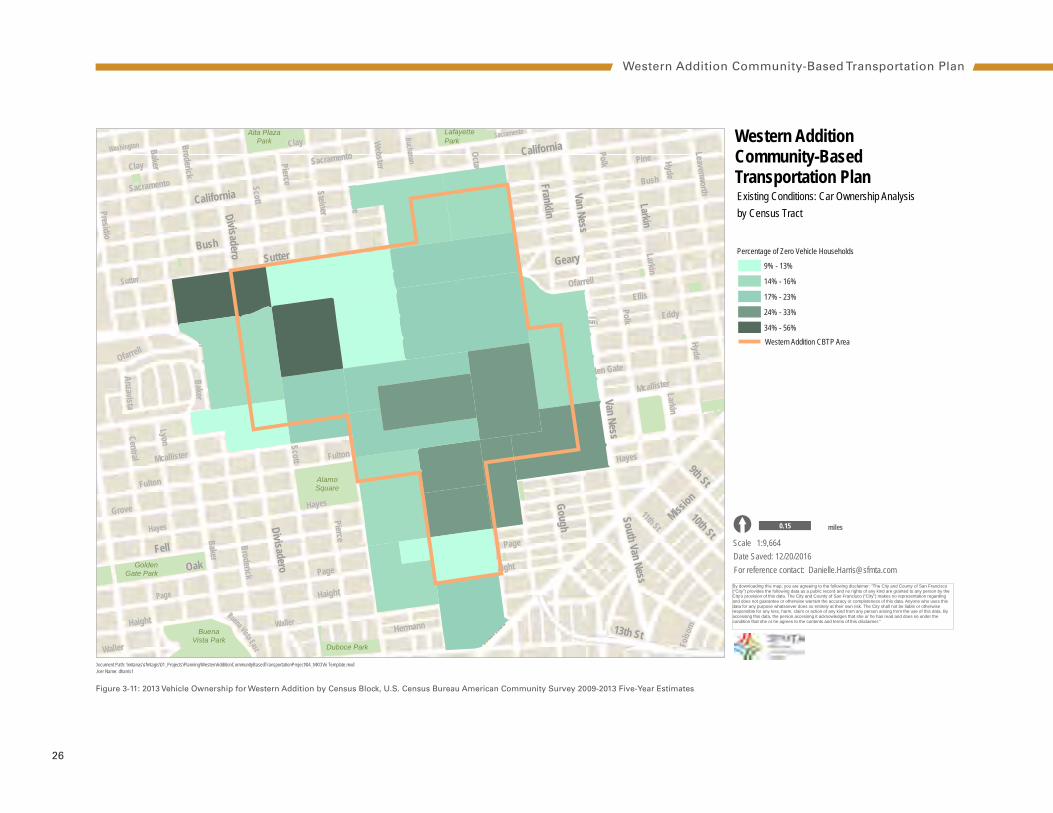
VEHICLE AVAILABILITYAlthough San Francisco as a whole estimates 30% of households are car-free, nearly 50% of the households in Western Addition were car-free, regardless of tenure in 2013. The number of households with two or more cars in San Francisco was estimated to be twice as high as the Western Addition at 29% and 14%, respectively. The proportion of single car households is comparable with 39% in the Western Addition and 41% for the city as a whole (see Figure 3-9).
High concentrations of zero vehicle households exist on the periphery of the study area, as seen in Figure 3-11, particularly between Sutter Street and Geary Boulevard near Gough Street and Gough between Geary and McAllister.
Tenure status seemed to have impacted vehicle ownership within the study area. Only 19% of owner occupied households in the Western Addition do not own a vehicle. While this number is still approximately twice the number of owned households within San Francisco without a car, it is significantly less than the 52% of renting households which were estimated to be car free.
0% 5% 10% 15% 20% 25% 30% 35% 40% 45% 50%
No Vehic le Avai lable
1 Vehic le Avai lable
2 Vehic les Avai lable
3 or More Vehic les Avai lable
SAN FRANCISCOWACBTP
5%Other
4%
Carpool
26%
Drive Alone
40%
Publ ic Transi t
8%
Work From Home
11%
Walk
6%
Bicyc le
57%of residents within the Western
Addition Community Based Transportation Plan’s study area take transit, walk, or bike to work
Figure 3-9: 2013 Vehicle Ownership Percentage Comparison for Western Addition and San Francisco Populations, U.S. Census Bureau American Community Survey 2009-2013 Five-Year Estimates
SAN FRANCISCO MUNICIPAL TRANSPORTATION AGENCY 25
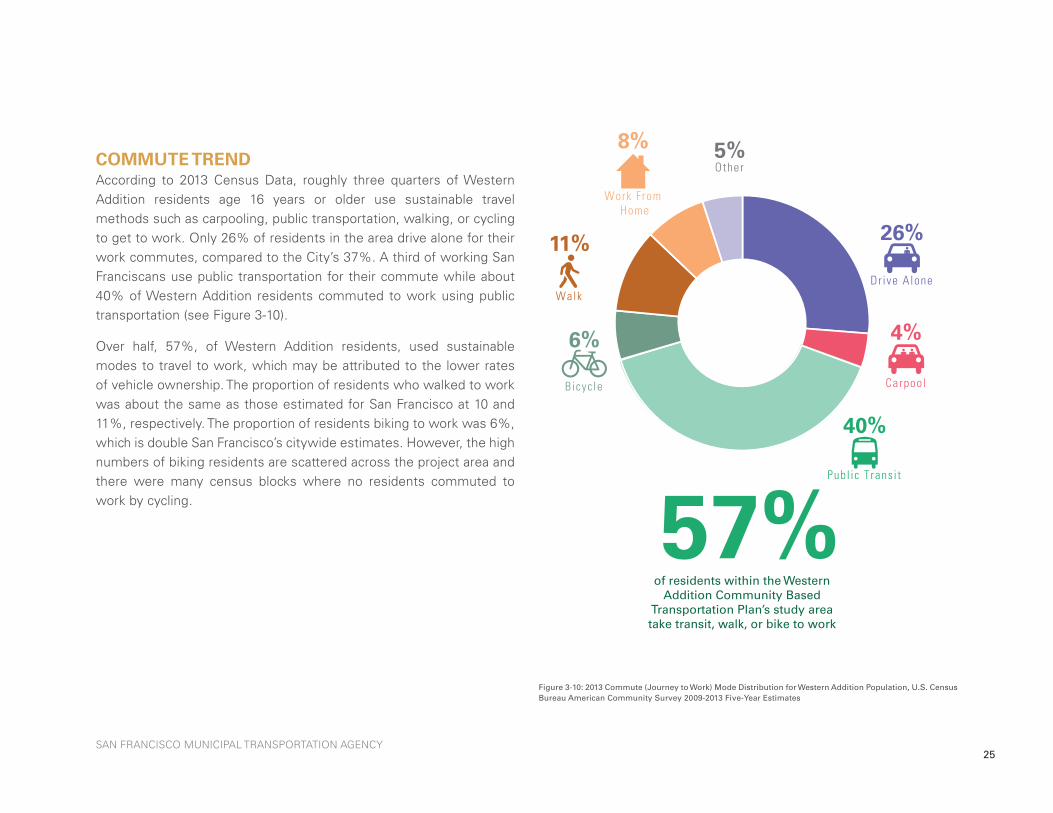
COMMUTE TRENDAccording to 2013 Census Data, roughly three quarters of Western Addition residents age 16 years or older use sustainable travel methods such as carpooling, public transportation, walking, or cycling to get to work. Only 26% of residents in the area drive alone for their work commutes, compared to the City’s 37%. A third of working San Franciscans use public transportation for their commute while about 40% of Western Addition residents commuted to work using public transportation (see Figure 3-10).
Over half, 57%, of Western Addition residents, used sustainable modes to travel to work, which may be attributed to the lower rates of vehicle ownership. The proportion of residents who walked to work was about the same as those estimated for San Francisco at 10 and 11%, respectively. The proportion of residents biking to work was 6%, which is double San Francisco’s citywide estimates. However, the high numbers of biking residents are scattered across the project area and there were many census blocks where no residents commuted to work by cycling.
0% 5% 10% 15% 20% 25% 30% 35% 40% 45% 50%
No Vehic le Avai lable
1 Vehic le Avai lable
2 Vehic les Avai lable
3 or More Vehic les Avai lable
SAN FRANCISCOWACBTP
5%Other
4%
Carpool
26%
Drive Alone
40%
Publ ic Transi t
8%
Work From Home
11%
Walk
6%
Bicyc le
57%of residents within the Western
Addition Community Based Transportation Plan’s study area take transit, walk, or bike to work
Figure 3-10: 2013 Commute (Journey to Work) Mode Distribution for Western Addition Population, U.S. Census Bureau American Community Survey 2009-2013 Five-Year Estimates
26
AlamoSquare
Alta PlazaPark
LafayettePark
JeffersonSquare
Duboce Park
BuenaVista Park
GoldenGate Park
Golden Gate
Buchanan
Turk
Larkin
Larkin
Ellis
Ellis
Hayes
Hayes
Hayes
Hayes
Anzavista
Eddy
Eddy
Eddy
Eddy
Clay
Clay
Leavenworth
Folso
m
Pierce
Webster
Polk
Polk
Steiner
Steiner
Steiner
Fillmore
Fillmore
Fillmore
Broderick Laguna
LagunaBuchanan
Buchanan
11th St
Sacramento
Sacramento
Sacramento
Waller
Ofarrell
Mcallister
Mcallister
Mcallister
Mcallister
Washington
Post
Post
Post
Octavia
Pierce
Baker
Presidio
Central
BroderickScott
Scott
BakerBaker
Pierce
Lyon
Hyde
Hyde
Webster
Saint Josephs
Buena Vista East
Bush
Haight
Haight
Haight
Page
Page
Page
Pine
Ofarrell
Grove
Grove
Grove
Fulton
Fulton
Fulton
Waller
Waller
Sutter
Hermann
9th St
California
California
13th St
Mission
Larkin
Franklin
GoughFranklin
Geary
10th St
Divisade r o
Divisadero
Van Ness
Van Ness
Oak
Oak
SutterBush
Fell
Fell
Market
South Van Ness
Geary
Western AdditionCommunity-BasedTransportation Plan
User Name: dharris1Document Path: \\mtanas\sfmtagis\01_Projects\Planning\WesternAdditionCommunityBasedTransportationProject\04_MXD\Ai Template.mxd
For reference contact: [email protected] Saved: 12/20/2016
1:9,664Scale[ 0.15 Milesmiles
By downloading this map, you are agreeing to the following disclaimer: “The City and County of San Francisco(“City”) provides the following data as a public record and no rights of any kind are granted to any person by theCity’s provision of this data. The City and County of San Francisco (“City”) makes no representation regardingand does not guarantee or otherwise warrant the accuracy or completeness of this data. Anyone who uses thisdata for any purpose whatsoever does so entirely at their own risk. The City shall not be liable or otherwiseresponsible for any loss, harm, claim or action of any kind from any person arising from the use of this data. Byaccessing this data, the person accessing it acknowledges that she or he has read and does so under thecondition that she or he agrees to the contents and terms of this disclaimer."
Existing Conditions: Car Ownership Analysisby Census Tract
Percentage of Zero Vehicle Households
9% - 13%
14% - 16%
17% - 23%
24% - 33%
34% - 56%
Western Addition CBTP Area
Figure 3-11: 2013 Vehicle Ownership for Western Addition by Census Block, U.S. Census Bureau American Community Survey 2009-2013 Five-Year Estimates
Western Addition Community-Based Transportation Plan
SAN FRANCISCO MUNICIPAL TRANSPORTATION AGENCY 27
OVER A DECADE LATER, IS WESTERN ADDITION STILL A COMMUNITY OF CONCERN?
Summary
FACTORS AND THRESHOLDS FOR COMMUNITIES OF CONCERN
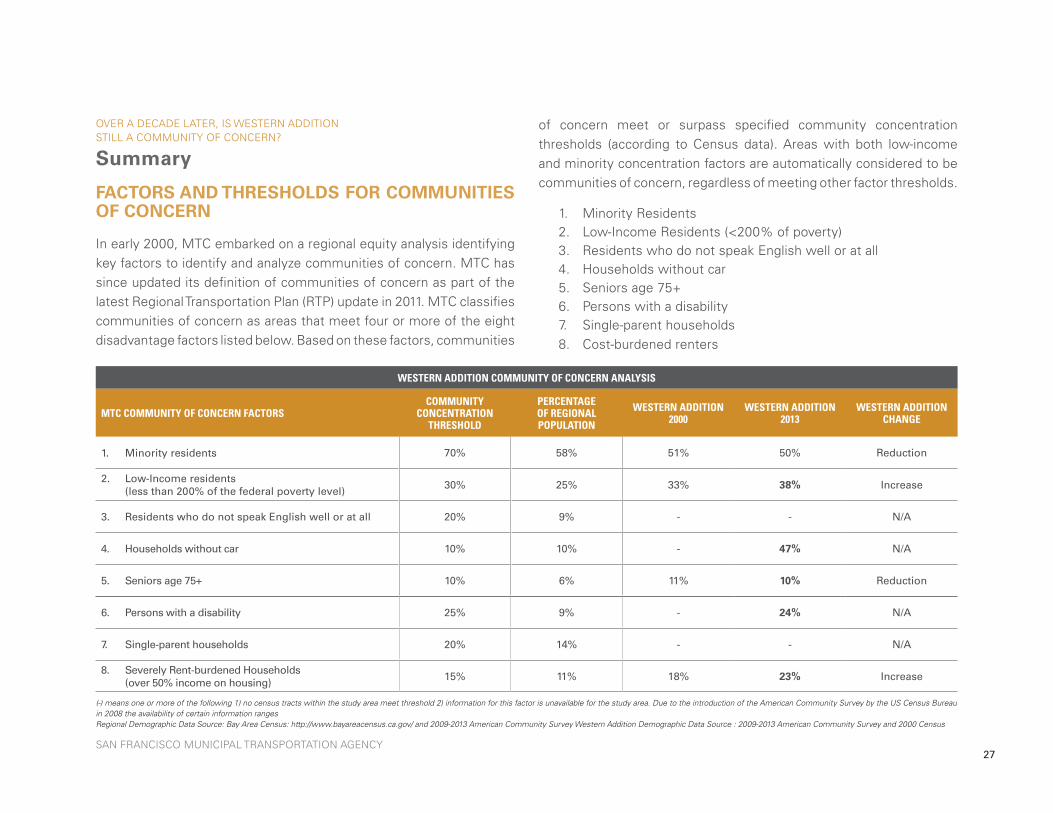
In early 2000, MTC embarked on a regional equity analysis identifying key factors to identify and analyze communities of concern. MTC has since updated its definition of communities of concern as part of the latest Regional Transportation Plan (RTP) update in 2011. MTC classifies communities of concern as areas that meet four or more of the eight disadvantage factors listed below. Based on these factors, communities
of concern meet or surpass specified community concentration thresholds (according to Census data). Areas with both low-income and minority concentration factors are automatically considered to be communities of concern, regardless of meeting other factor thresholds.
1. Minority Residents 2. Low-Income Residents (<200% of poverty) 3. Residents who do not speak English well or at all 4. Households without car 5. Seniors age 75+ 6. Persons with a disability 7. Single-parent households 8. Cost-burdened renters
WESTERN ADDITION COMMUNITY OF CONCERN ANALYSIS
MTC COMMUNITY OF CONCERN FACTORSCOMMUNITY
CONCENTRATION THRESHOLD
PERCENTAGE OF REGIONAL POPULATION
WESTERN ADDITION 2000
WESTERN ADDITION 2013
WESTERN ADDITION CHANGE
1. Minority residents 70% 58% 51% 50% Reduction
2. Low-Income residents (less than 200% of the federal poverty level)
30% 25% 33% 38% Increase
3. Residents who do not speak English well or at all 20% 9% - - N/A
4. Households without car 10% 10% - 47% N/A
5. Seniors age 75+ 10% 6% 11% 10% Reduction
6. Persons with a disability 25% 9% - 24% N/A
7. Single-parent households 20% 14% - - N/A
8. Severely Rent-burdened Households (over 50% income on housing)
15% 11% 18% 23% Increase
(-) means one or more of the following 1) no census tracts within the study area meet threshold 2) information for this factor is unavailable for the study area. Due to the introduction of the American Community Survey by the US Census Bureau in 2008 the availability of certain information ranges Regional Demographic Data Source: Bay Area Census: http://www.bayareacensus.ca.gov/ and 2009-2013 American Community Survey Western Addition Demographic Data Source : 2009-2013 American Community Survey and 2000 Census
28
The Western Addition was identified as a community of concern as a result of the MTC’s initial equity analysis effort in 2000. Despite the rapidly changing socio-economic profile of the San Francisco Bay Area within the last decade, the Western Addition remains a community of concern, having maintained an overwhelming number of environmental disparities for residents over the past one and a half decades. The Western Addition’s demographic profile reflects a high concentration of low median incomes, substantial minority population and high senior population at the core of the neighborhood. The table on page 27 summarizes the Western Addition’s thresholds for the MTC’s eight factors and compares the neighborhood demographics from 2000 and 2013.
WESTERN ADDITION’S COMMUNITY OF CONCERN RESULTS FROM 2000 TO 2013
minority rESidEntS
Between 2000 and 2013, there has been a slight decrease in the Western Addition’s minority residents, specifically the neighborhood’s Black population deceasing by 5%.
povErty
The percentage of low-income households within the Western Addition grew from 33% to 38% from 2000 to 2013, above the community of concern threshold of 30%.
vEhiclE oWnErShip
At 47%, the rate of zero vehicle households is more than four times greater than the COC community concentration threshold of 10%. This could partially be attributed to San Francisco’s urban density and SFMTA’s Transit First policy, which promotes the use of public transit and other sustainable transportation option rather than single-occupancy vehicles.
coSt BurdEnEd rEntErS
The U.S Census identifies cost burdened renters as those who spend 30% or more of their income on housing. Accounting for the Bay Area’s high-cost of living, the MTC, however, refers to those spending spending 30 to 49.9% of income on housing costs as moderately cost burdened, while residents who spend 50% or more of their income on housing are severely cost burdened.
According to the US census, 44% of the residents in the Western Addition would be considered housing cost burdened. Using MTC’s definitions about a quarter of the renters, 23%, in the Western Addition would be considered severely cost burdened, spending 50% or more of their earnings on housing. The amount of severely cost burdened renters grew by about 5% from 18% to 23% between 2000 and 2013.
crimE
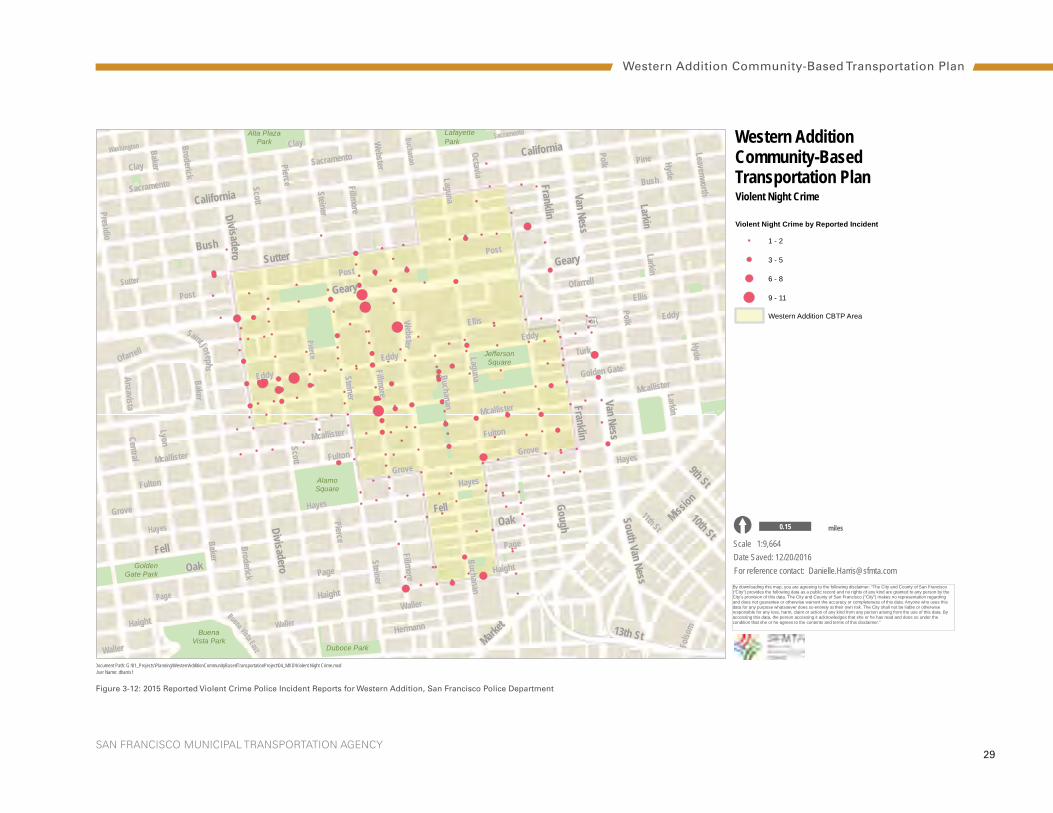
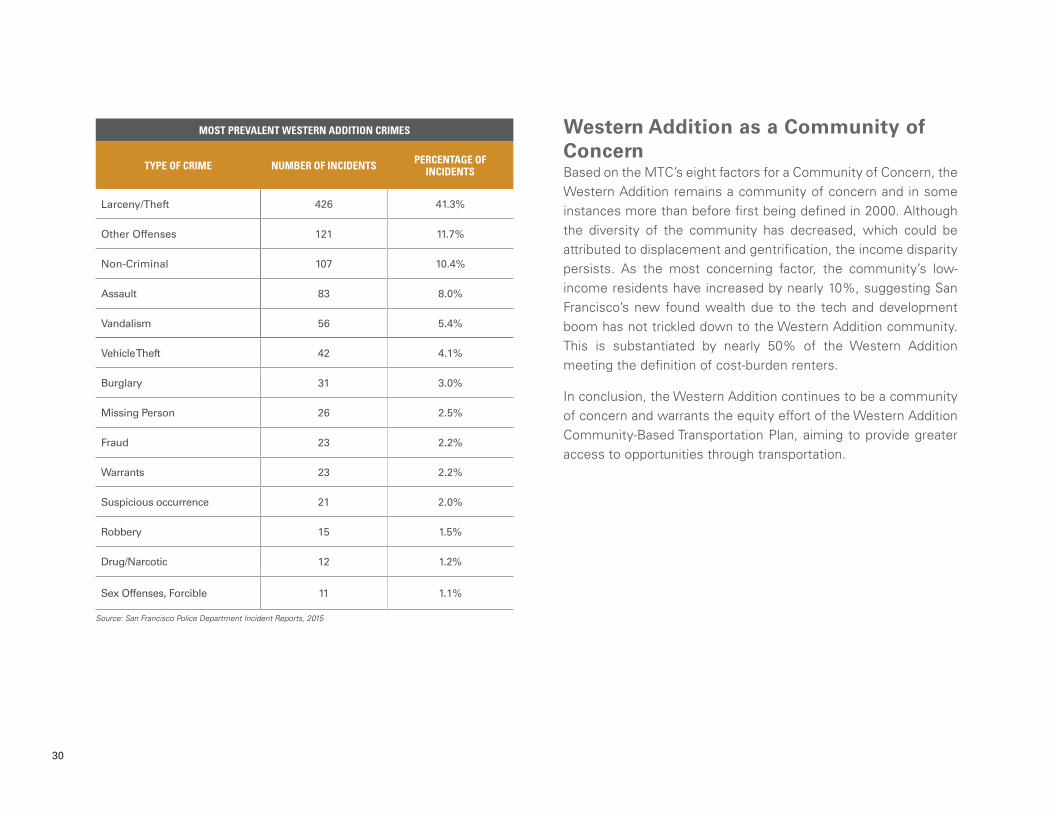
Although crime is not a factor in the MTC community of concern analysis, crime is a factor affecting many communities of concern and significantly impacts the quality of life for residents of these neighborhoods. The Western Addition hosts some of the highest crime rates in San Francisco. The table on page 28 shows crime incidents in 2014 as reported by the San Francisco Police Department. It should be noted however that these numbers reflect a fraction of the crime in the neighborhood as they do not account for unreported crimes that may have occurred.
SAN FRANCISCO MUNICIPAL TRANSPORTATION AGENCY 29
AlamoSquare
Alta PlazaPark
LafayettePark
JeffersonSquare
Duboce Park
BuenaVista Park
GoldenGate Park
Golden Gate
Buchanan
Turk
Larkin
Larkin
Ellis
Ellis
Hayes
Hayes
Hayes
Hayes
Anzavista
Eddy
Eddy
Eddy
Eddy
Clay
Clay
Leavenworth
Folso
m
Pierce
Webster
Polk
Polk
Steiner
Steiner
Steiner
Fillmore
Fillmore
Fillmore
Broderick Laguna
LagunaBuchanan
Buchanan
11th St
Sacramento
Sacramento
Sacramento
Waller
Ofarrell
Mcallister
Mcallister
Mcallister
Mcallister
Washington
Post
Post
Post
Octavia
Pierce
Baker
Presidio
Central
BroderickScott
Scott
B akerBaker
Pierce
Lyon
Hyde
Hyde
Webster
Saint Josep hs
Buena Vista East
Bush
Haight
Haight
Haight
Page
Page
Page
Pine
Ofarrell
Grove
Grove
Grove
Fulton
Fulton
Fulton
Waller
Waller
Sutter
Hermann
9th St
California
California
13th St
Mission
Larkin
Franklin
GoughFranklin
Geary
10th St
Divisadero
Divisadero
Van Ness
Van Ness
Oak
Oak
SutterBush
Fell
Fell
Market
South Van Ness
Geary
Western AdditionCommunity-BasedTransportation Plan
User Name: dharris1Document Path: G:\01_Projects\Planning\WesternAdditionCommunityBasedTransportationProject\04_MXD\Violent Night Crime.mxd
For reference contact: [email protected] Saved: 12/20/2016
1:9,664Scale[ 0.15 Milesmiles
By downloading this map, you are agreeing to the following disclaimer: “The City and County of San Francisco(“City”) provides the following data as a public record and no rights of any kind are granted to any person by theCity’s provision of this data. The City and County of San Francisco (“City”) makes no representation regardingand does not guarantee or otherwise warrant the accuracy or completeness of this data. Anyone who uses thisdata for any purpose whatsoever does so entirely at their own risk. The City shall not be liable or otherwiseresponsible for any loss, harm, claim or action of any kind from any person arising from the use of this data. Byaccessing this data, the person accessing it acknowledges that she or he has read and does so under thecondition that she or he agrees to the contents and terms of this disclaimer."
Violent Night Crime
Violent Night Crime by Reported Incident
Western Addition CBTP Area
1 - 2
3 - 5
6 - 8
9 - 11
Figure 3-12: 2015 Reported Violent Crime Police Incident Reports for Western Addition, San Francisco Police Department
Western Addition Community-Based Transportation Plan
30
Western Addition as a Community of ConcernBased on the MTC’s eight factors for a Community of Concern, the Western Addition remains a community of concern and in some instances more than before first being defined in 2000. Although the diversity of the community has decreased, which could be attributed to displacement and gentrification, the income disparity persists. As the most concerning factor, the community’s low-income residents have increased by nearly 10%, suggesting San Francisco’s new found wealth due to the tech and development boom has not trickled down to the Western Addition community. This is substantiated by nearly 50% of the Western Addition meeting the definition of cost-burden renters.
In conclusion, the Western Addition continues to be a community of concern and warrants the equity effort of the Western Addition Community-Based Transportation Plan, aiming to provide greater access to opportunities through transportation.
MOST PREVALENT WESTERN ADDITION CRIMES
TYPE OF CRIME NUMBER OF INCIDENTS PERCENTAGE OF INCIDENTS
Larceny/Theft 426 41.3%
Other Offenses 121 11.7%
Non-Criminal 107 10.4%
Assault 83 8.0%
Vandalism 56 5.4%
Vehicle Theft 42 4.1%
Burglary 31 3.0%
Missing Person 26 2.5%
Fraud 23 2.2%
Warrants 23 2.2%
Suspicious occurrence 21 2.0%
Robbery 15 1.5%
Drug/Narcotic 12 1.2%
Sex Offenses, Forcible 11 1.1%
Source: San Francisco Police Department Incident Reports, 2015

SAN FRANCISCO MUNICIPAL TRANSPORTATION AGENCY 31
WESTERN ADDITION BLOCK BY BLOCK
Land Use Conditions
Similar to many neighborhoods in San Francisco, the Western Addition has changed as a result of increasing development pressures and the rising cost of living. However much of the land use within the neighborhood has not changed. The City’s Planning Code determines the zoning and districts that define and control the land uses in San Francisco. The Western Addition remains a primarily residential neighborhood comprised of a mix of land uses, including purely residential blocks, blocks combining a mixture of residential, institutional and commercial uses and blocks entirely contained of commercial uses.
HOUSING + PUBLIC HOUSINGDevelopment in the Western Addition area began during the rebuilding of the city after the 1906 Earthquake, but by the 1940s the area had become overcrowded. The Victorian style homes that made up the Western Addition were over- burdened by multiple families and soon deteriorated.
The San Francisco Housing Authority responded to overcrowding in the 1960s by constructing public housing projects throughout the city. These public housing projects suffered from many delays and prolonged construction, forcing families to relocate to other Bay Area cities, most notably Oakland. Other affordable housing options were
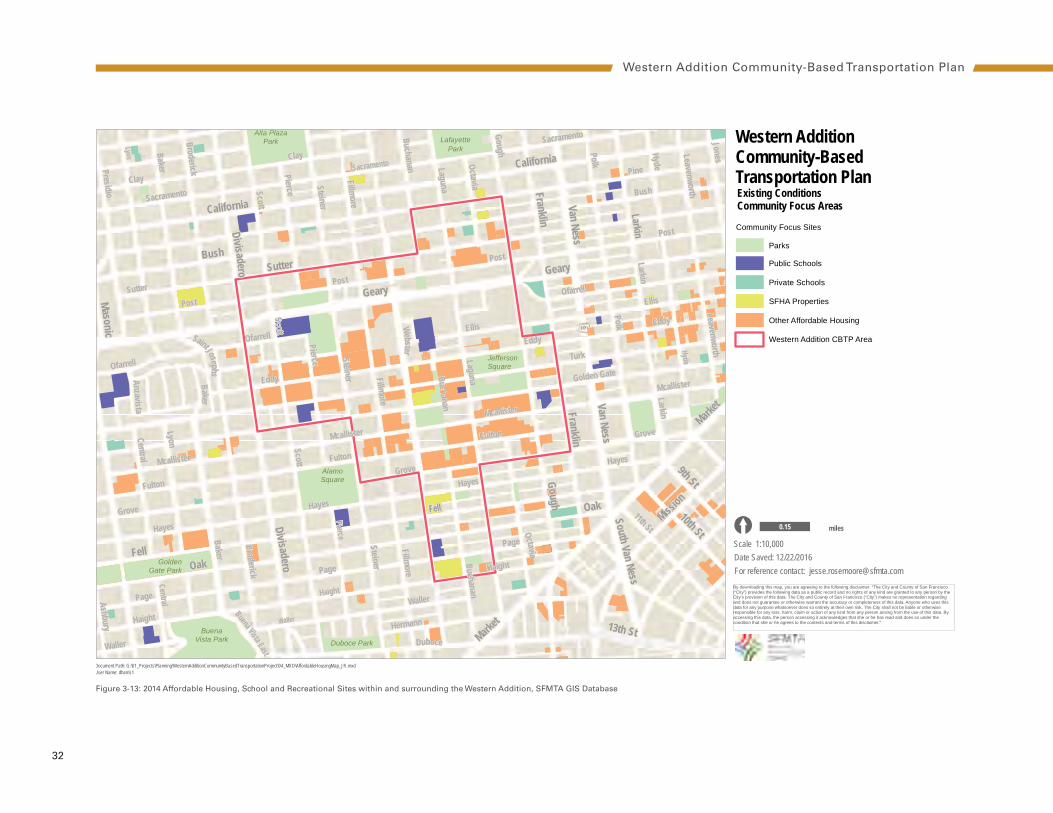
established by Black churches in the area including Freedom West Homes. Currently, there are over forty San Francisco Housing Authority (SFHA) properties located within the study area (Figure 3-13).
COMMERCIALThe Western Addition is home to two culturally significant and historic commercial centers – the Fillmore District and Japantown.
thE FillmorE diStrict
During the late 1940s and the early 1950s, a period when the Fillmore District was nicknamed the “Harlem of the West,” as a thriving business district containing dozens of Black-owned businesses, including barbershops, billiards parlors, cleaners, shoeshine stands, barbecue restaurants, record stores and various other stores and offices. During this time Black entrepreneurs opened several notable bars and nightclubs, like Jimbo’s Bop City.
The Fillmore District, once one of America’s most important Black-dominated entertainment zones, was demolished during the 1960s and 1970s by the Redevelopment Agency. Though several businesses were relocated, most closed because the community that had sustained them were displaced to various parts of the Bay Area. The remnants of the Fillmore District’s legacy is captured in the “Historic
Western Addition Community-Based Transportation Plan
32
AlamoSquare
Alta PlazaPark Lafayette
Park
JeffersonSquare
Duboce Park
BuenaVista Park
GoldenGate Park
Eddy
Eddy
Eddy
Post
Post
Post
Post
Gough
Larkin
Larkin
Duboce
Ashbury
Ellis
Ellis
Hayes
Hayes
Hayes
Hayes
Anzavista
Clay
Clay
Lyon
Bush
Polk
Polk
Steiner
Steiner
Steiner
Fillmore
Fillmore
Fillmore
Broderick Laguna
LagunaBuchanan
Buchanan
11th St
Jones
Golden Gate
Waller
Ofarrell
Ofarrell
Mcallister
Mcallister
Mcallister
Mcallister
Buchanan
Turk
Octavia
Pierce
BakerPresidio
Central
Broderick
Leavenworth
Leavenworth
Scott
Scott
Scott
Central
BakerBaker
Pierce
Pierce
Lyon
Hyde
Hyde
Octavia
Webster
Saint Josephs
Haight
Haight
Haight
Page
Page
Page
Buena Vista East
Pine
Sacramento
Sacramento
Sacramento
Ofarrell
Grove
Grove
Grove
Fulton
Fulton
Fulton
Waller
Waller
Sutter
Hermann
9th St
Market 13th St
Mission
Larkin
Franklin
GoughFranklin
10th St
California
California
Divisadero
Divisadero
Van Ness
Van Ness
Oak
Oak
GearySutterBush
Fell
Fell
Market
Masonic
South Van Ness
Geary
Western AdditionCommunity-BasedTransportation Plan
User Name: dharris1Document Path: G:\01_Projects\Planning\WesternAdditionCommunityBasedTransportationProject\04_MXD\AffordableHousingMap_JR.mxd
For reference contact: [email protected] Saved: 12/22/2016
1:10,000Scale[ 0.15 Miles miles
By downloading this map, you are agreeing to the following disclaimer: “The City and County of San Francisco(“City”) provides the following data as a public record and no rights of any kind are granted to any person by theCity’s provision of this data. The City and County of San Francisco (“City”) makes no representation regardingand does not guarantee or otherwise warrant the accuracy or completeness of this data. Anyone who uses thisdata for any purpose whatsoever does so entirely at their own risk. The City shall not be liable or otherwiseresponsible for any loss, harm, claim or action of any kind from any person arising from the use of this data. Byaccessing this data, the person accessing it acknowledges that she or he has read and does so under thecondition that she or he agrees to the contents and terms of this disclaimer."
Existing ConditionsCommunity Focus Areas
Parks
Public Schools
Private Schools
SFHA Properties
Other Affordable Housing
Western Addition CBTP Area
Community Focus Sites
Figure 3-13: 2014 Affordable Housing, School and Recreational Sites within and surrounding the Western Addition, SFMTA GIS Database
Western Addition Community-Based Transportation Plan
SAN FRANCISCO MUNICIPAL TRANSPORTATION AGENCY 33
THE WESTERN ADDITION IS A HISTORICALLY AND CULTURALLY RICH COMMUNITY AND ASSET TO BE PRESERVED BY SAN FRANCISCO.
Fillmore Jazz Preservation District” on Fillmore Street roughly bounded by Grove Street to the south and Geary Boulevard to the north.
JapantoWn
For over a century, Japantown has been the cultural heart of San Francisco and the Bay Area’s Japanese American community. Today Japantown is bounded by Steiner, California, Gough, and O’Farrell streets with some overlap with the Fillmore District to the south and Cathedral Hill to the east. Japanese residents began to occupy the area in 1906 and opened many business and community establishments. After Japanese-Americans were forced into internment camps in the early 1940s and Urban Renewal/ Redevelopment occurred in the 1960s, most of the historic Japantown was demolished. These devasting impacts to the community caused many Japanese-American community activists to mobilize and bring awareness to these social, political and economic injustices. This community activism spurred a wave of renewal and revitalization in Japantown.
As one of three remaining Japantowns in the country, the area’s cultural and historical resources are widely appreciated and play a significant role in the history of San Francisco and the region at large. Much of what makes Japantown a culturally-rich and recognizable place are the businesses and community-based organizations around Post, Buchanan and Sutter streets. A unique mix of
businesses offers Japanese, Japanese American, Korean and other culturally specific services, wares and food products as well as cultural and community institutions.
PARKSCompared to the other four Communities of Concern within San Francisco, the Western Addition neighborhood has an impressive number of green space, parks and other recreational facilities. Some of the major parks within the community are featured below.
Buchanan mall
The Buchanan Street Mall, a non-automobile street between Grove and Eddy streets, is a six-block landscaped greenway, dotted with play structures and benches. Bordering Rosa Parks Senior Center, Ella Hill Hutch Community Center and numerous housing developments, the mall serves as a community space with green space, three playgrounds, a half-basketball court and asphalt paths. Unfortunately the Buchanan Street Mall fell victim to gang violence and drug use causing the space to be deemed unsafe and abandoned by the community. However, recently the San Francisco Recreation and Park Department, Supervisor Breed, the community and a number of private partners have embarked on efforts to revitalize and activate the space through physical treatments and programming.

34
margarEt hayWard playground
Built in 1955, the Margaret Hayward Playground is comprised of two city blocks in the Western Addition Neighborhood and bounded by Turk, Golden Gate, Gough, and Laguna Streets. Margaret Hayward Playground is one of San Francisco’s more spacious parks at approximately 265,000 square feet, offering sports courts, play fields with bleachers, a children’s play area and indoor recreation space. The space also hosts a Recreation and Park Department facility building and a City operations facility owned and operated by the Department of Emergency Management.
Currently there is an effort by the City’s Recreation and Park Department to revitalize the park by improving access and replacing sports courts, play fields, children’s play area and other amenities.
koShland park
Located in the southern tip of the project area at Page and Buchanan streets, Koshland Park provides a beautiful city view, play structures, half-court for basketball and a sand pit. There are also garden beds used by local schools as the Community Learning Garden to educate students about gardening and food sources.
raymond kimBEll playground
Located at Ellis and Steiner, the northwest corner of the project area, Raymond Kimbell Playground is a recent improvement site for the Recreation and Parks Department. The park offers three ball fields, a clubhouse, an outdoor sport court, play structures, and a large lawn. Over time many of these facilities have become unusable, unsafe, and in need of repair. The Recreation and Parks Department is continuing its 2008 revitalization effort for the park, which includes a new artificial-turf field, playground and court improvements.
22 Fillmore bus passing Fillmore Heritage Center located on Fillmore Street between Eddy and Ellis Streets.
SAN FRANCISCO MUNICIPAL TRANSPORTATION AGENCY 35
COMMUNITY SPACESThe Western Addition hosts many rich cultural assets including the community’s schools, religious institutions, and community centers.
churchES During the postwar period, when San Francisco’s Black population was growing rapidly, several of the older mainline churches, including A. M. E. Zion and Bethel A. M. E. constructed new churches in the Western Addition. Although the redevelopment of the Western Addition led to much displacement, A. M. E. Zion, one of San Francisco’s older religious institutions, relocated to a new church building that was erected in 1960 at the present location, 2159 Golden Gate Avenue. Bethel A.M.E. Church, was founded in 1852 at 916 Laguna St. During Redevelopment, Bethel A.M.E. Church operated four housing developments – Laurel Gardens, Prince Hall Apartments, Thomas Paine Square and Fellowship Manor, all for low- and middle-income families and seniors. Bethel Church also sponsored the Freedom West Homes, the largest Western Addition co-op built on four square blocks.
Another long- standing church, Third Baptist Church was founded in 1852 as the First Colored Baptist Church in the home of William and Eliza Davis on Kearny Street. In 1952, Third Baptist Church moved to 1399 McAllister Street and thereafter grew quickly with the Youth Building and Frederick Douglas Haynes Gardens.
Long after the Western Addition transitioned from being predominantly Black, these churches have remained, with many parishioners commuting in from Bay Area suburbs for church services. While many parishioners do not live in the Western Addition, they continue to commute on a weekly basis for church services and community events and still very much consider the Western Addition their community.
Ella hill hutch community cEntEr Ella Hill Hutch Community Center was opened in the Western Addition in 1981. Since its opening at 1050 McAllister Street, it has served as an anchor for the community, providing housing as an after-hour homeless shelter until 2008, as well as job training and hosting numerous conferences. The center features an indoor basketball court, four outdoor tennis courts, and a children’s play area.
aFrican amErican art + culturE complEx (aaacc)Established in 1989, the African American Art and Culture Complex, which highlights African American-themed visual and performing arts, moved into the Western Addition Cultural Center at 762 Fulton Street at Webster. The African American Historical and Cultural Society, a descendant of the San Francisco Athenaeum and Literary Association, maintains an archive and a gallery in the same building.
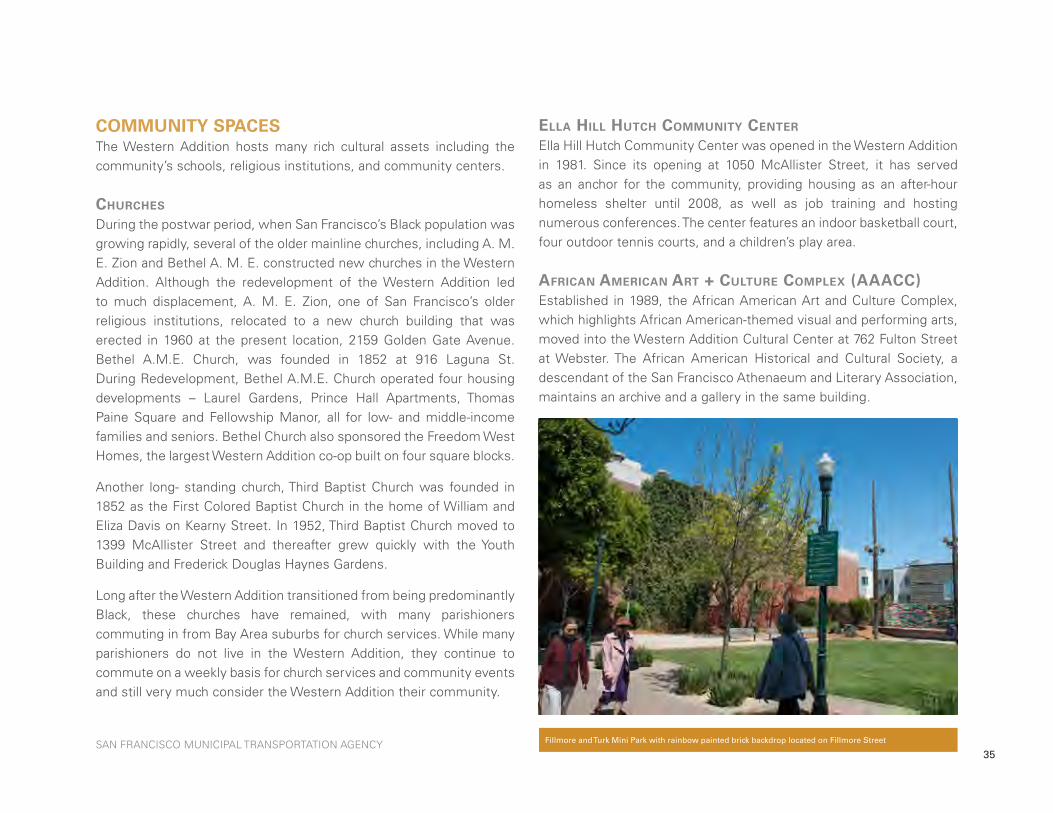
Fillmore and Turk Mini Park with rainbow painted brick backdrop located on Fillmore Street

36
African American Art and Culture Complex is home to organizations that program dance, jazz, country music, theater performances, film, poetry readings, and drumming and dance workshops. Also on site are the Sargent Johnson Gallery and the San Francisco African and African American Historical and Cultural Society Library Archives.
Buchanan StrEEt ymcaOne of the few buildings that was not demolished during Redevelopment, the Buchanan Street YMCA has longstanding associations with both the Japanese-American and Black communities. The Buchanan Y serves the needs of the Western Addition, Japantown and Haight Ashbury neighborhoods by providing affordable fitness memberships, after school programming at 8 locations, 3 summer camps and a variety of teen programming - including Youth and Government and Model United Nations.
Western Addition’s Fertile LandsThe Western Addition is rich with many community facilities, ample housing, two thriving commercial corridors and abundant green park lands. The community has the land use and geographic framework for a thriving livable community. With the Western Addition CBTP effort and funding, the project goal is to enhance the connection to these community assets and aid the neighborhood in reaching its full potential for its community members to benefit from and enjoy.
Southwest entrance to Jefferson Square Park located at Turk and Laguna Street
SAN FRANCISCO MUNICIPAL TRANSPORTATION AGENCY 37
WESTERN ADDITION STREET BY STREET
Existing Transportation Network and Infrastructure
This section describes pedestrian, bicycle and street infrastructure throughout the Western Addition as well as an inventory of Muni transit, paratransit and other mobility services. A brief overview of transportation projects and programs that are planned or have been recently implemented is also included.
In order to help narrow the focus of the transportation assessment for the neighborhood, the project team worked with District Supervisor Breed to identify significant transportation priorities, challenges and locations throughout the Western Addition. These priorities are listed below and helped the project team initiate community outreach, which is discussed in depth in the outreach chapter.
DISTRICT 5 TRANSPORTATION PRIORITIESThrough initial review of previous planning documents, collision data and discussions with District Supervisor Breed, transportation concerns and priorities were identified.
SaFEty
• Pedestrian safety and amenities
• Bicycle safety and facilities
• Children and seniors
• Vehicle speeds
• Streetscape design
tranSit
• Speed and effectiveness• Reliability/access
locationS oF intErESt
• Public housing• Senior homes• John Muir Elementary• Golden Gate Avenue• Turk Street• Geary Boulevard• Webster at Geary• Steiner at Geary
PEDESTRIANSan Francisco is one of the most walkable cities in the Bay Area region and the Western Addition’s central location is prime for walking. The neighborhood has many paved sidewalks, neighborhood-sized blocks and, while the streets are relatively flat when compared to other neighborhoods of San Francisco, it still has its share of steep streets west of Webster Street. Most intersections provide crosswalks and major arterial streets like Gough, Franklin, Turk and Golden Gate streets provide controlled intersection crossings with either a traffic signal or stop sign.
Western Addition Community-Based Transportation Plan
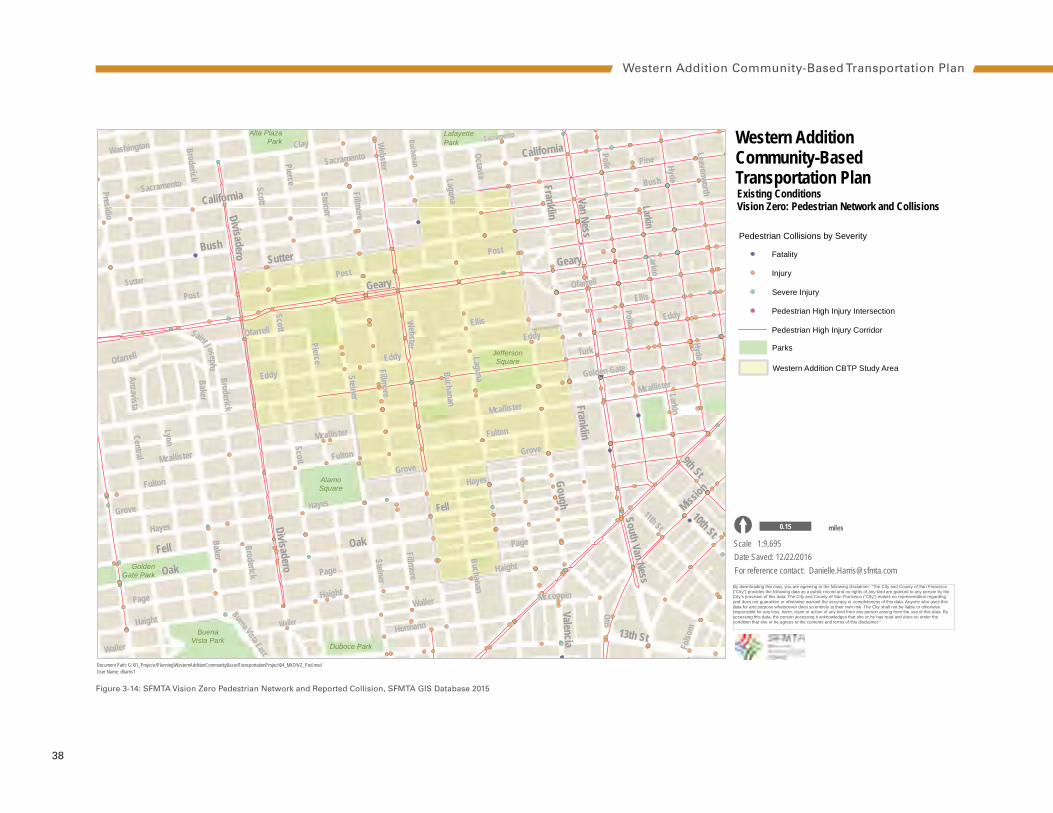
38
AlamoSquare
Alta PlazaPark
LafayettePark
JeffersonSquare
Duboce Park
BuenaVista Park
GoldenGate Park
Golden Gate
Leavenworth
Waller
Turk
Buchanan
Larkin
Larkin
Ellis
Ellis
Eddy
Eddy
Eddy
Eddy
Mccoppin
Hayes
Hayes
Hayes
Anzavista
Clay
Folso
m
Webster
Polk
Polk
Steiner
Steiner
Steiner
Fillmore
Fillmore
Fillmore
Broderick Laguna
LagunaBuchanan
Buchanan
11th St
Ofarrell
Ofarrell
Mcallister
Mcallister
Mcallister
Mcallister
Sacramento
Sacramento
Sacramento
Post
Post
Post
Octavia
Presidio
Central
Broderick
BroderickScott
Scott
Scott
BakerBaker
Pierce
Pierce
Lyon
Hyde
Hyde
Webster
Washington
Bush
Saint Josephs
Buena Vista East
Haight
Haight
Haight
Page
Page
Page
Pine
Ofarrell
Grove
Grove
Grove
Fulton
Fulton
Fulton
Waller
Waller
Sutter
Hermann
Otis
Valencia
California
California
13th St
Mission
Larkin
9th St
Franklin
GoughFranklin
Geary
10th St
Divisadero
Divisadero
Van Ness
Oak
Oak
SutterBush
Fell
Fell
South Van Ness
Geary
Western AdditionCommunity-BasedTransportation Plan
User Name: dharris1Document Path: G:\01_Projects\Planning\WesternAdditionCommunityBasedTransportationProject\04_MXD\VZ_Ped.mxd
For reference contact: [email protected] Saved: 12/22/2016
1:9,695Scale[
Existing ConditionsVision Zero: Pedestrian Network and Collisions
0.15 Milesmiles
By downloading this map, you are agreeing to the following disclaimer: “The City and County of San Francisco(“City”) provides the following data as a public record and no rights of any kind are granted to any person by theCity’s provision of this data. The City and County of San Francisco (“City”) makes no representation regardingand does not guarantee or otherwise warrant the accuracy or completeness of this data. Anyone who uses thisdata for any purpose whatsoever does so entirely at their own risk. The City shall not be liable or otherwiseresponsible for any loss, harm, claim or action of any kind from any person arising from the use of this data. Byaccessing this data, the person accessing it acknowledges that she or he has read and does so under thecondition that she or he agrees to the contents and terms of this disclaimer."
Pedestrian Collisions by Severity
Fatality
Injury
Severe Injury
Pedestrian High Injury Intersection
Pedestrian High Injury Corridor
Western Addition CBTP Study Area
Parks
Figure 3-14: SFMTA Vision Zero Pedestrian Network and Reported Collision, SFMTA GIS Database 2015
Western Addition Community-Based Transportation Plan
SAN FRANCISCO MUNICIPAL TRANSPORTATION AGENCY 39
viSion ZEro
The frequency of traffic fatalities in the City of San Francisco constitutes a public health crisis. To address this crisis, San Francisco has embarked on an effort to eliminate all traffic-related fatalities by 2024, the Vision Zero policy commitment. Through its policy commitment to achieving Vision Zero, San Francisco prioritizes the value human life and the importance of safeguarding people on City streets. San Francisco’s Vision Zero approach relies on a combination of five focus areas: engineering, education, enforcement, evaluation and policy to create a transportation system that is safe for all road users, for all modes of transportation, in all communities, and for people of all ages and abilities.
As part of SFMTA’s commitment to Vision Zero, they identified a high-injury network made up of 12% of city streets, which accounts for nearly 70% of all severe injuries and fatalities related to non-freeway collisions. The SFMTA, with its partners including the Department of Public Works and Planning Department, is prioritizing improvements on the high-injury corridors and at over 150 locations identified through the WalkFirst pedestrian safety planning process. Additionally, the SFMTA has identified over 24 street engineering projects, including Turk Street, that are being expedited to address the recent spike in fatalities in people who walk and bicycle along these high injury corridors.
Figure 3-14 is a map of the pedestrian high-injury corridors throughout the Western Addition.
BICYCLE The SFMTA’s commitment to sustainable transportation is reflected in its on-going effort to grow San Francisco’s bicycle network, an interconnected web of bicycle facilities across the city that promote bicycling as an attractive and safe alternative to private car use. The Western Addition is part of this network with bicycle facilities on Post, Sutter, McAllister, Fulton, Steiner and Webster Streets. “Sharrows” are road markings used to indicate a shared lane environment for bicycles and automobiles. Sharrows are located on Post, Sutter, McAllister, and Steiner streets, while bike lanes offering cyclists a safe and clearly marked lane that separates them from vehicles, reducing the potential for conflicts, are located on Webster and Fulton Streets in both directions. There is also a westbound bike lane on Post Street west of Steiner Street.
BikE StratEgy To increase safety for cyclists and encourage bicycling, the SFMTA’s 2013-2018 Bicycle Strategy identifies and prioritizes corridors to expand the network or enhance infrastructure. The SFMTA has slated funds to complete a series of bicycle capital improvements, including the Western Addition
THE FREQUENCY OF TRAFFIC FATALITIES IN THE CITY OF SAN FRANCISCO CONSTITUTES A PUBLIC HEALTH CRISIS. TO ADDRESS THIS CRISIS, SAN FRANCISCO HAS EMBARKED ON AN EFFORT TO ELIMINATE ALL TRAFFIC-RELATED FATALITIES BY 2024, THE VISION ZERO POLICY COMMITMENT.
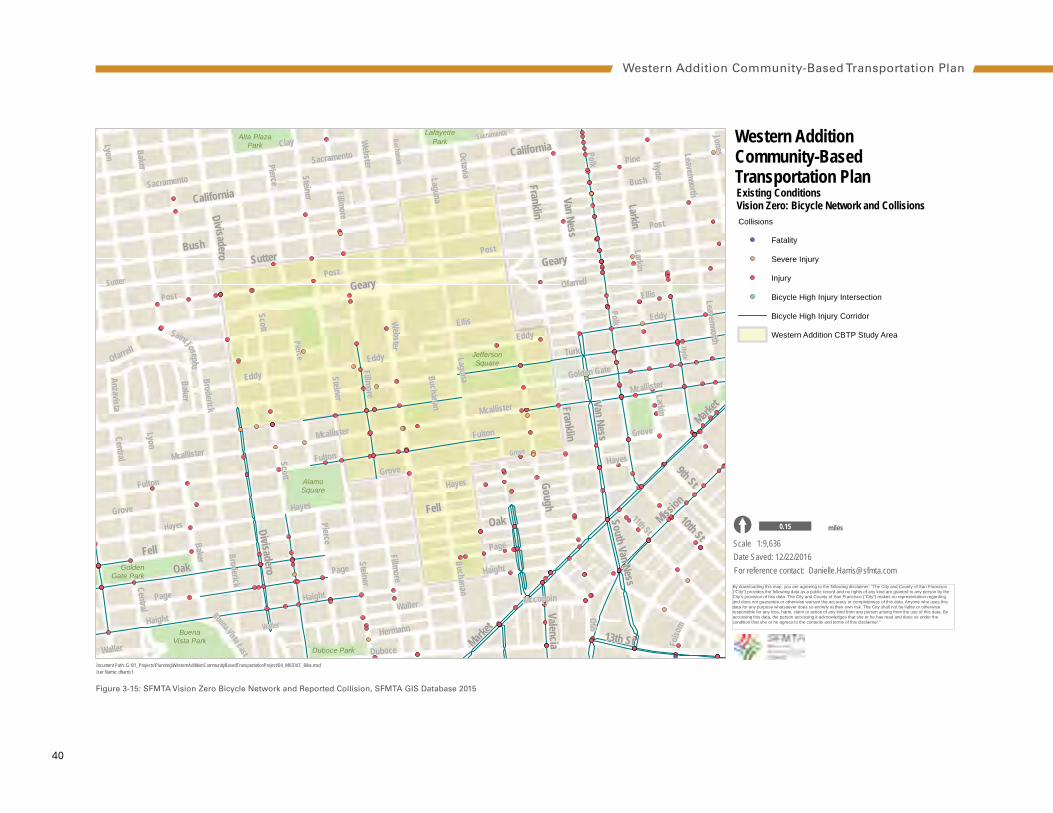
40
AlamoSquare
Alta PlazaPark
LafayettePark
JeffersonSquare
Duboce Park
BuenaVista Park
GoldenGate Park
Eddy
Eddy
Eddy
Eddy
Waller
Jones
Post
Post
Post
Post
Buchanan
Larkin
Larkin
Ellis
Ellis
Mccoppin
Hayes
Hayes
Hayes
Hayes
Anzavista
Bush
ClayLyon
Folso
m
Pierce
Webster
Polk
Polk
Steiner
Steiner
Steiner
Fillmore
Fillmore
Fillmore
Laguna
LagunaBuchanan
Buchanan
11th St
Golden GateOfarrell
Mcallister
Mcallister
Mcallister
Mcallister
Turk
Sacramento
Sacramento
Sacramento
Duboce
Octavia
Pierce
Baker
Central
Broderick
Broderick
Leavenworth
Leavenworth
Scott
Scott
Central
BakerBaker
Pierce
Lyon
Hyde
Hyde
Webster
Buena Vista East
Saint Josephs
Haight
Haight
Haight
Page
Page
Page
Pine
Ofarrell
Grove
Grove
Grove
Grove
Fulton
Fulton
Fulton
Waller
Waller
Sutter
Hermann
Otis
9th St
13th St
California
California
Mission
Larkin
Franklin
GoughFranklin
Valencia
10th St
Divisader o
Divisadero
Geary
Van Ness
Van Ness
Oak
Oak
SutterBush
Fell
Fell
Market
Market
South Van Ness
Geary
Western AdditionCommunity-BasedTransportation Plan
User Name: dharris1Document Path: G:\01_Projects\Planning\WesternAdditionCommunityBasedTransportationProject\04_MXD\VZ_Bike.mxd
For reference contact: [email protected] Saved: 12/22/2016
1:9,636Scale[
Existing ConditionsVision Zero: Bicycle Network and Collisions
0.15 Milesmiles
By downloading this map, you are agreeing to the following disclaimer: “The City and County of San Francisco(“City”) provides the following data as a public record and no rights of any kind are granted to any person by theCity’s provision of this data. The City and County of San Francisco (“City”) makes no representation regardingand does not guarantee or otherwise warrant the accuracy or completeness of this data. Anyone who uses thisdata for any purpose whatsoever does so entirely at their own risk. The City shall not be liable or otherwiseresponsible for any loss, harm, claim or action of any kind from any person arising from the use of this data. Byaccessing this data, the person accessing it acknowledges that she or he has read and does so under thecondition that she or he agrees to the contents and terms of this disclaimer."
Collisions
Fatality
Severe Injury
Injury
Bicycle High Injury Intersection
Bicycle High Injury Corridor
Western Addition CBTP Study Area
Figure 3-15: SFMTA Vision Zero Bicycle Network and Reported Collision, SFMTA GIS Database 2015
Western Addition Community-Based Transportation Plan
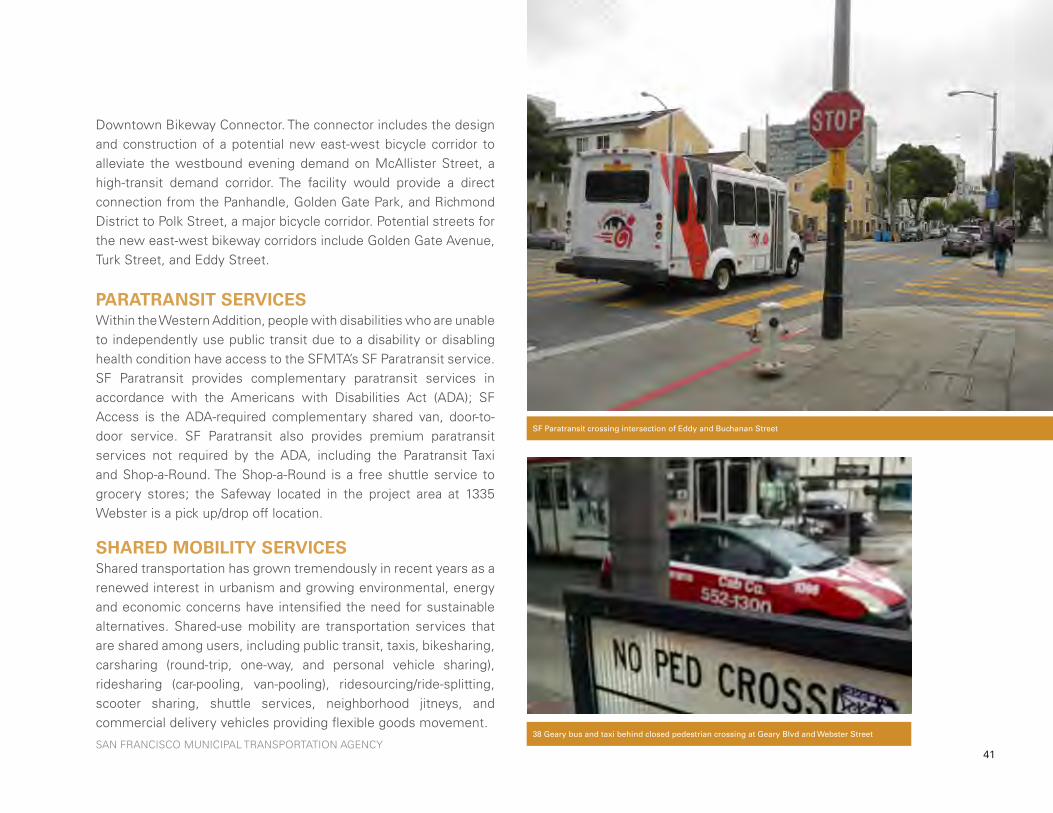
SAN FRANCISCO MUNICIPAL TRANSPORTATION AGENCY 41
SF Paratransit crossing intersection of Eddy and Buchanan Street
38 Geary bus and taxi behind closed pedestrian crossing at Geary Blvd and Webster Street
Downtown Bikeway Connector. The connector includes the design and construction of a potential new east-west bicycle corridor to alleviate the westbound evening demand on McAllister Street, a high-transit demand corridor. The facility would provide a direct connection from the Panhandle, Golden Gate Park, and Richmond District to Polk Street, a major bicycle corridor. Potential streets for the new east-west bikeway corridors include Golden Gate Avenue, Turk Street, and Eddy Street.
PARATRANSIT SERVICESWithin the Western Addition, people with disabilities who are unable to independently use public transit due to a disability or disabling health condition have access to the SFMTA’s SF Paratransit service. SF Paratransit provides complementary paratransit services in accordance with the Americans with Disabilities Act (ADA); SF Access is the ADA-required complementary shared van, door-to-door service. SF Paratransit also provides premium paratransit services not required by the ADA, including the Paratransit Taxi and Shop-a-Round. The Shop-a-Round is a free shuttle service to grocery stores; the Safeway located in the project area at 1335 Webster is a pick up/drop off location.
SHARED MOBILITY SERVICES Shared transportation has grown tremendously in recent years as a renewed interest in urbanism and growing environmental, energy and economic concerns have intensified the need for sustainable alternatives. Shared-use mobility are transportation services that are shared among users, including public transit, taxis, bikesharing, carsharing (round-trip, one-way, and personal vehicle sharing), ridesharing (car-pooling, van-pooling), ridesourcing/ride-splitting, scooter sharing, shuttle services, neighborhood jitneys, and commercial delivery vehicles providing flexible goods movement.

42
These shared mobility services provide new solutions ranging from large physical networks to mobile applications designed to alter routes, fill empty seats and combine fare media and real-time arrival and departure information for customers. Advances in electronic and wireless technologies have made sharing assets easier and more efficient. Automobile manufacturers, rental car companies, venture-backed startups and city-sponsored programs started popping up in San Francisco less than a decade ago.
Shared mobility is an innovative response to the demand for new options, and offer an opportunity to:
• Provide more mobility options
• Address last mile and first mile solutions
• Reduce traffic congestion
• Mitigate various forms of pollution
• Reduce transportation costs
• Reduce fossil fuel consumption
• Reduce pressures on parking spaces
• Identify choices for those who cannot afford to buy and maintain a vehicle
car Sharing
There are two carsharing services serving the Western Addition neighborhood, Zipcar and Getaround. Getaround is a carsharing service in the Bay Area providing users with an access key upon subscription to a membership. There are several Zipcar and Getaround locations in the Western Addition, primarily within apartment garages.
Bay arEa BikE SharE
The Western Addition is included in the second phase of the upcoming Bay Area Bike Share expansion. The Bay Area Bike Share system consists
of a 24-hour fleet of specially designed, durable public use bikes that are made available via a network of automated docking stations located in cities throughout the region. Members can pick up a shared bike from any station in the system and return it to any other. Stations are located every few blocks in the service area, creating an efficient network with many possible combinations of start and end points, linking people to Muni and BART, to jobs and schools, and other Bay Area locations. To maximize the number of trips per day, areas that connect to existing stations and downtown were prioritized for expansion to allow for efficient outward growth. Due to the Western Addition’s close proximity to existing stations located Downtown, it is an ideal neighborhood for the second phase of the five-phase expansion with over a dozen proposed expansion sites.
WESTERN ADDITION CAR SHARE LOCATIONS
LOCATION NUMBER OF VEHICLES AVAILABLE* SERVICE PROVIDERS
Fulton and Fillmore Two Getaround
Post and Webster Two Getaround
Ellis and Fillmore Four Getaround, Zipcar
Ivy and Gough Two Getaround
Gough and Grove Five Getaround
Grove and Franklin Two Getaround
Fulton and Webster Six Zipcar
McAllister and Steiner (On-Street) Two Zipcar
Pierce and Golden Gate One Zipcar
Ivy and Laguna (On-Street) Two Zipcar
2016 Car Share location, SFMTA Car Share Pilot Data
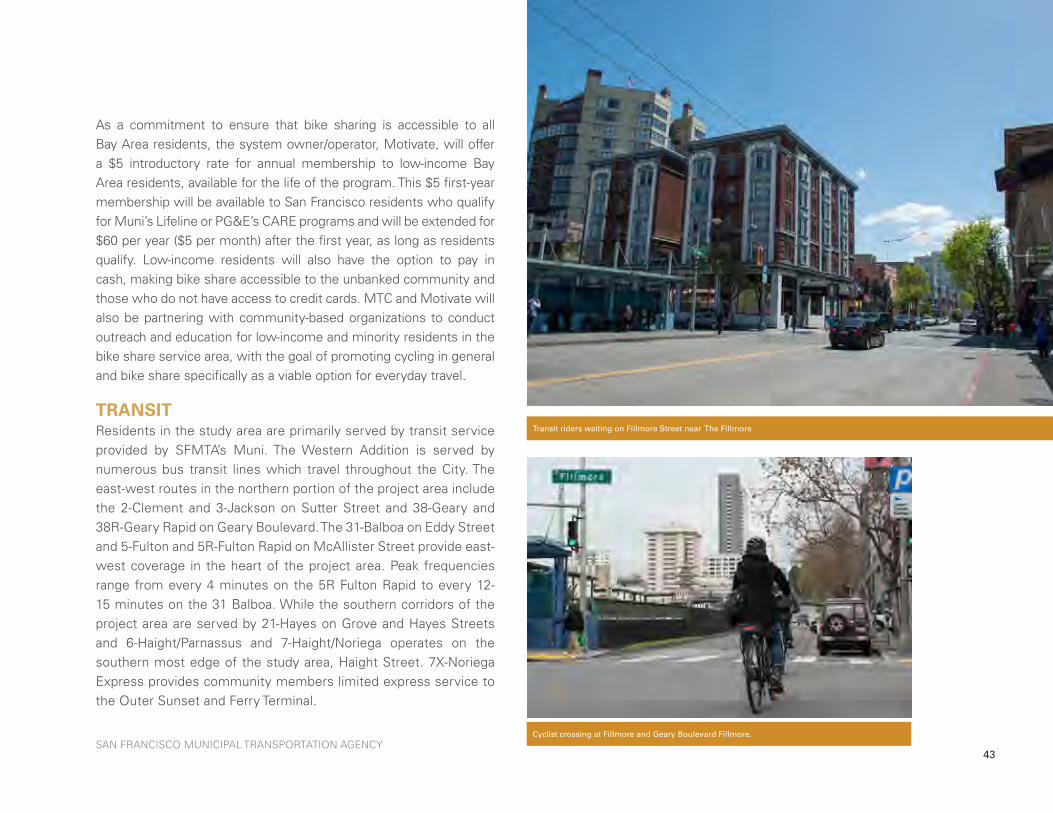
SAN FRANCISCO MUNICIPAL TRANSPORTATION AGENCY 43
As a commitment to ensure that bike sharing is accessible to all Bay Area residents, the system owner/operator, Motivate, will offer a $5 introductory rate for annual membership to low-income Bay Area residents, available for the life of the program. This $5 first-year membership will be available to San Francisco residents who qualify for Muni’s Lifeline or PG&E’s CARE programs and will be extended for $60 per year ($5 per month) after the first year, as long as residents qualify. Low-income residents will also have the option to pay in cash, making bike share accessible to the unbanked community and those who do not have access to credit cards. MTC and Motivate will also be partnering with community-based organizations to conduct outreach and education for low-income and minority residents in the bike share service area, with the goal of promoting cycling in general and bike share specifically as a viable option for everyday travel.
TRANSIT Residents in the study area are primarily served by transit service provided by SFMTA’s Muni. The Western Addition is served by numerous bus transit lines which travel throughout the City. The east-west routes in the northern portion of the project area include the 2-Clement and 3-Jackson on Sutter Street and 38-Geary and 38R-Geary Rapid on Geary Boulevard. The 31-Balboa on Eddy Street and 5-Fulton and 5R-Fulton Rapid on McAllister Street provide east-west coverage in the heart of the project area. Peak frequencies range from every 4 minutes on the 5R Fulton Rapid to every 12-15 minutes on the 31 Balboa. While the southern corridors of the project area are served by 21-Hayes on Grove and Hayes Streets and 6-Haight/Parnassus and 7-Haight/Noriega operates on the southern most edge of the study area, Haight Street. 7X-Noriega Express provides community members limited express service to the Outer Sunset and Ferry Terminal.
Transit riders waiting on Fillmore Street near The Fillmore
Cyclist crossing at Fillmore and Geary Boulevard Fillmore.
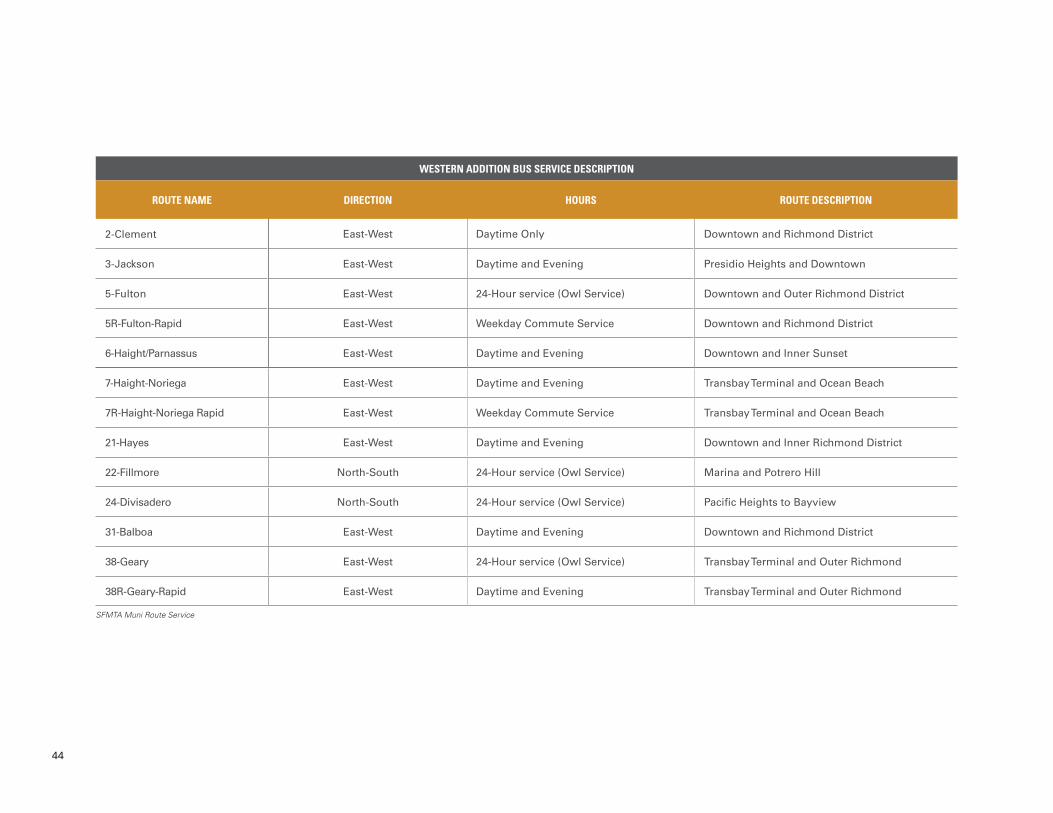
44
WESTERN ADDITION BUS SERVICE DESCRIPTION
ROUTE NAME DIRECTION HOURS ROUTE DESCRIPTION
2-Clement East-West Daytime Only Downtown and Richmond District
3-Jackson East-West Daytime and Evening Presidio Heights and Downtown
5-Fulton East-West 24-Hour service (Owl Service) Downtown and Outer Richmond District
5R-Fulton-Rapid East-West Weekday Commute Service Downtown and Richmond District
6-Haight/Parnassus East-West Daytime and Evening Downtown and Inner Sunset
7-Haight-Noriega East-West Daytime and Evening Transbay Terminal and Ocean Beach
7R-Haight-Noriega Rapid East-West Weekday Commute Service Transbay Terminal and Ocean Beach
21-Hayes East-West Daytime and Evening Downtown and Inner Richmond District
22-Fillmore North-South 24-Hour service (Owl Service) Marina and Potrero Hill
24-Divisadero North-South 24-Hour service (Owl Service) Pacific Heights to Bayview
31-Balboa East-West Daytime and Evening Downtown and Richmond District
38-Geary East-West 24-Hour service (Owl Service) Transbay Terminal and Outer Richmond
38R-Geary-Rapid East-West Daytime and Evening Transbay Terminal and Outer Richmond
SFMTA Muni Route Service
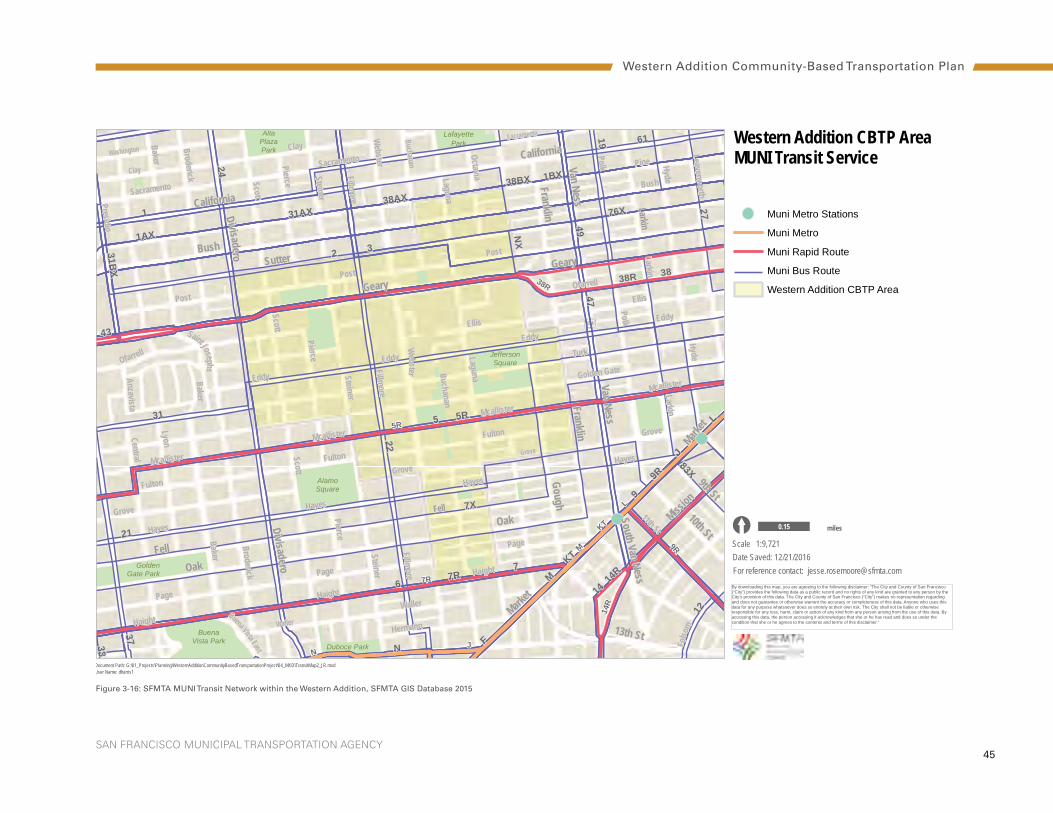
SAN FRANCISCO MUNICIPAL TRANSPORTATION AGENCY 45
AlamoSquare
AltaPlazaPark
LafayettePark
JeffersonSquare
Duboce Park
BuenaVista Park
GoldenGate Park
Golden Gate
Larkin
Larkin
Buchanan
Ellis
Ellis
Turk
Hayes
Hayes
Hayes
Hayes
Anzavista
Clay
Clay
Eddy
Eddy
Eddy
Eddy
Webster
Polk
Polk
Steiner
Steiner
Steiner
Fillmore
Fillmore
Fillmore
Broderick Laguna
LagunaBuchanan
11th St
Folso
m
Ofarrell
Mcallister
Mcallister
Mcallister
Mcallister
Octavia
Pierce
Baker
Presidio
Central
Broderick
Leavenworth
Scott
Scott
Scott
Bake rBaker
Pierce
Pierce
Lyon
Hyde
Hyde
Washington
Web ster
Post
Post
Post
Saint Josephs
Buena Vista East
Haight
Haight
Haight
Page
Page
Page
Bush
Pine
Sacramento
Sacramento
Sacramento
Ofarrell
Grove
Grove
Grove
Grove
Fulton
Fulton
Fulton
Waller
Waller
Hermann
9th St
California
California
13th St
Mission
Larkin
Franklin
GoughFranklin
Geary
10th St
Divisadero
Divisadero
Van Ness
Van Ness
Oak
Oak
SutterBush
Fell
Fell
Market
Market
South Van Ness
Geary
33
37
83X
12
61
4327
14R
14
76X
9
9R
F
KT
M
L
J19
1
3
N
49
24
22
47
38AX
31AX
38R 38
21
1AX
31 5 5R
1BX
NX
7R7
6
231BX
38BX
7X
KT
M
L
JN
14R
9R
38R
5R
7R
Western Addition CBTP Area MUNI Transit Service
User Name: dharris1Document Path: G:\01_Projects\Planning\WesternAdditionCommunityBasedTransportationProject\04_MXD\TransitMap2_JR.mxd
For reference contact: [email protected] Saved: 12/21/2016
1:9,721Scale[ 0.15 Milesmiles
By downloading this map, you are agreeing to the following disclaimer: “The City and County of San Francisco(“City”) provides the following data as a public record and no rights of any kind are granted to any person by theCity’s provision of this data. The City and County of San Francisco (“City”) makes no representation regardingand does not guarantee or otherwise warrant the accuracy or completeness of this data. Anyone who uses thisdata for any purpose whatsoever does so entirely at their own risk. The City shall not be liable or otherwiseresponsible for any loss, harm, claim or action of any kind from any person arising from the use of this data. Byaccessing this data, the person accessing it acknowledges that she or he has read and does so under thecondition that she or he agrees to the contents and terms of this disclaimer."
Muni Metro Stations
Muni Metro
Muni Rapid Route
Muni Bus Route
Western Addition CBTP Area
Figure 3-16: SFMTA MUNI Transit Network within the Western Addition, SFMTA GIS Database 2015
Western Addition Community-Based Transportation Plan
46
North-south routes are the 22-Fillmore on Fillmore Street and 24-Divisadero on Divisadero Street, which run every 7 to 9 minutes during peak hours. One block east of the study area, the 47-Van Ness and 49-Van Ness Mission operate on Van Ness Avenue providing access to the 4th and King Caltrain Station, Fisherman’s Wharf and City College. The highest ridership route in the neighborhood is the 22-Fillmore, which carries over 15,000 customers per day. The 5/5R-Fulton and 24-Divisadero are also high ridership routes. Primary fixed bus routes within the study area are shown in Figure 3-16.
In 2017 the regular adult fare for Muni bus service increased from $2.25 to $2.50 and $1.00 to $1.25 for youth ages 5-17, however customers using Clipper or MuniMobile are not subject to these increases. There are also a variety of subsidized fare rates provided for youth, seniors and people with disabilities. Some low- and moderate-income San Francisco youth, seniors and people with disabilities are eligible for free access to Muni. Qualifying low-income customers are also offered a discounted rate in the form of a Lifeline Pass, which is a Muni-only monthly pass offered at a 50% discount compared to the standard adult monthly pass price.
muni ForWard
Muni Forward is a project led by the SFMTA which aims to make getting around on transit safer and more reliable. A new Rapid Network of core routes serving nearly 70% of all riders is a key element of Muni Forward and will establish additional service increases to provide more reliable and frequent trips. Three of the routes which run through the project area, 5-Fulton, 38-Geary and 7-Haight/Noriega, have undergone service improvements as a result of the SFMTA’s Muni Forward Initiative and are included in the Rapid Network. The Rapid Network may use tools such as transit signal priority (TSP) and transit priority lanes (red lanes) with stop consolidation that aim to improve travel time by moving buses more efficiently with reduced delays.
5/5R-Fulton Muni FoRwaRd iMpRoveMents
The 5-Fulton corridor passes the study area on McAllister Street from Divisadero to Franklin Streets. Several changes are proposed along the 5-Fulton corridor and will build on those already implemented as part of the 5L Fulton Limited pilot project, now the 5R-Fulton Rapid. Changes along the blocks of McAllister Street include bus stop consolidation and relocation, adding transit bulbs and right turn pockets, replacing all-way stop-controlled intersections with traffic signals or traffic calming measures, and adding pedestrian bulbs and continental “ladder-style” crosswalks. The 5R-Fulton Rapid runs weekdays from 7:00 AM to 7:00 PM with headways ranging from 4.5 to 9 minutes. Under Muni Forward these headways will be further reduced to 3 to 7 minutes.
7R-HaigHt/noRiega-Rapid pRoject
Muni Forward proposed service adjustments for the 71-Haight Noriega, which was renamed 7-Haight/Noriega. The 7-Haight/Noriega line passes though the study area, running along Haight Street between Webster and Laguna Streets, with stops at Buchanan and Laguna. Improvements within the study area include new pedestrian bulbs, traffic signals, bus-only signals, turn pockets, transit-only lanes, turn restrictions, and extended bus zones. Additionally, route restructuring, frequency improvements, and vehicle type changes are also planned, which will ideally reduce crowding and improve connections to regional transit. The midday frequency of 7R-Haight/Noriega Rapid will be reduced from 10 to 7.5 minutes.
38R-geaRy Rapid pRoject and geaRy BoulevaRd Bus Rapid tRansit (BRt)Geary Boulevard is the most heavily used transit corridor in the northern part of San Francisco serving over 50,000 daily transit riders. Geary Boulevard spans several blocks within the project area from Divisadero to Gough Streets. As a result of Muni Forward, limited stop service will be expanded to include Sundays and bus frequency will increase slightly, with headways decreasing from 5.5 to 5 minutes.
SAN FRANCISCO MUNICIPAL TRANSPORTATION AGENCY 47
Additionally, due to its high usage, the SFMTA and San Francisco County Transportation Authority (SFCTA) are planning to implement Bus Rapid Transit (BRT) service along Geary Boulevard. The Geary BRT project will improve performance by establishing physically separated bus lanes, installing transit-optimized traffic signals, increasing bus frequencies and constructing high-quality BRT stations along the corridor. The project also includes many pedestrian and streetscape enhancements to improve safety along Geary Boulevard.
latE night tranSportation - oWl SErvicE
Muni’s late-night transit service is called the Owl Network. Muni provides the most late night service routes with 10 bus routes running every half hour between 1 and 5 a.m. nightly, serving San Franciscans and off-peak commuters. All ten all-night service routes serve the city’s low-income neighborhoods.
Within the Western Addition there are three Owl routes, providing late night service; 22-Fillmore, 5-Fulton and 24-Divisadero, and one block east of the project area is 90-San Bruno Owl providing service to Visitacion Valley and Fort Mason (see Figure 3-17).
In 2015, the San Francisco Late Night Transportation Working Group found that all-night commuters are more likely to be low- and moderate-income. Owl service provides an affordable transit option to evening workers, who support San Francisco night economy. Based on the results of Working
Groups’s report, The Other 9-to-5: Improving Late-Night and Early-Morning Transportation for San Francisco Workers, Residents, and Visitors, transit agency partners will be reviewing and consider expansion of all-night local and regional bus service throughout the region. SFMTA will also be exploring flat rate, late night taxi shared-ride program ride and subsidies to low-income late night workers for taxi fares when Owl service does not serve travel needs.
muni Equity StratEgy
In March 2016, the SFMTA completed its first bi-annual Muni Service Equity Strategy Report. The Strategy builds on existing Title VI annual monitoring, targeting service and capital improvements to routes most critical to neighborhoods with high concentrations of residents of color and/or of low-income and also to routes that are most used by people with disabilities. For the Western Addition, the Strategy focuses improvements on the 7R-Haight/Noriega Rapid service and the 5-Fulton (local), specifically infrastructure on the McAllister Street corridor (see Figure 3-18).
DUE TO SFMTA EFFORTS ON IMPROVING HIGH RIDERSHIP ROUTES, MUNI ON-TIME PERFORMANCE IS AS GOOD OR BETTER IN THE WESTERN ADDITION, THAN IT IS ON COMPARABLE ROUTES CITYWIDE.

48
AlamoSquare
AltaPlazaPark
LafayettePark
JeffersonSquare
Duboce Park
BuenaVista Park
GoldenGate Park
Waller
Golden Gate
Larkin
Larkin
Buchanan
Ellis
Ellis
Turk
Hayes
Hayes
Hayes
Hayes
Anzavista
Clay
Clay
Eddy
Eddy
Eddy
Eddy
Webster
Polk
Polk
Steiner
Steiner
Steiner
Fillmore
Fillmore
Fillmore
Broderick Laguna
LagunaBuchanan
Buchanan
11th St
Folso
m
Ofarrell
Mcallister
Mcallister
Mcallister
Octavia
Pierce
Baker
Presidio
Central
Broderick
Leavenworth
Scott
Scott
Scott
Bake rBaker
Pierce
Pierce
Lyon
Hyde
Hyde
Washington
Web ster
Post
Post
Post
Saint Josephs
Buena Vista East
Haight
Haight
Haight
Page
Page
Page
Bush
Pine
Sacramento
Sacramento
Sacramento
Ofarrell
Grove
Grove
Grove
Grove
Fulton
Fulton
Fulton
Waller
Waller
Sutter
Hermann
9th St
California
California
13th St
Mission
Larkin
Franklin
GoughFranklin
Geary
10th St
Divisadero
Divisadero
Van Ness
Van Ness
Oak
Oak
SutterBush
Fell
Fell
Market
Market
South Van Ness
Geary
N
T 9
KT
L
NK
M
24
24
90
5
Western AdditionCommunity-BasedTransportation Plan
User Name: dharris1Document Path: G:\01_Projects\Planning\WesternAdditionCommunityBasedTransportationProject\04_MXD\TransitMap2_JR.mxd
For reference contact: [email protected] Saved: 12/22/2016
1:9,721Scale[ 0.15 Milesmiles
By downloading this map, you are agreeing to the following disclaimer: “The City and County of San Francisco(“City”) provides the following data as a public record and no rights of any kind are granted to any person by theCity’s provision of this data. The City and County of San Francisco (“City”) makes no representation regardingand does not guarantee or otherwise warrant the accuracy or completeness of this data. Anyone who uses thisdata for any purpose whatsoever does so entirely at their own risk. The City shall not be liable or otherwiseresponsible for any loss, harm, claim or action of any kind from any person arising from the use of this data. Byaccessing this data, the person accessing it acknowledges that she or he has read and does so under thecondition that she or he agrees to the contents and terms of this disclaimer."
Existing ConditionsMuni Owl Service - Late Night TransportationOwl Service runs every half hour between 1:00 and 5:00 AM
Muni Owl Service Stops
Muni Owl Service
Parks
Western Addition CBTP Area
Muni Owl Service Routes and Stops
Figure 3-17: SFMTA MUNI Owl Service Network within the Western Addition, SFMTA GIS Database 2015
Western Addition Community-Based Transportation Plan
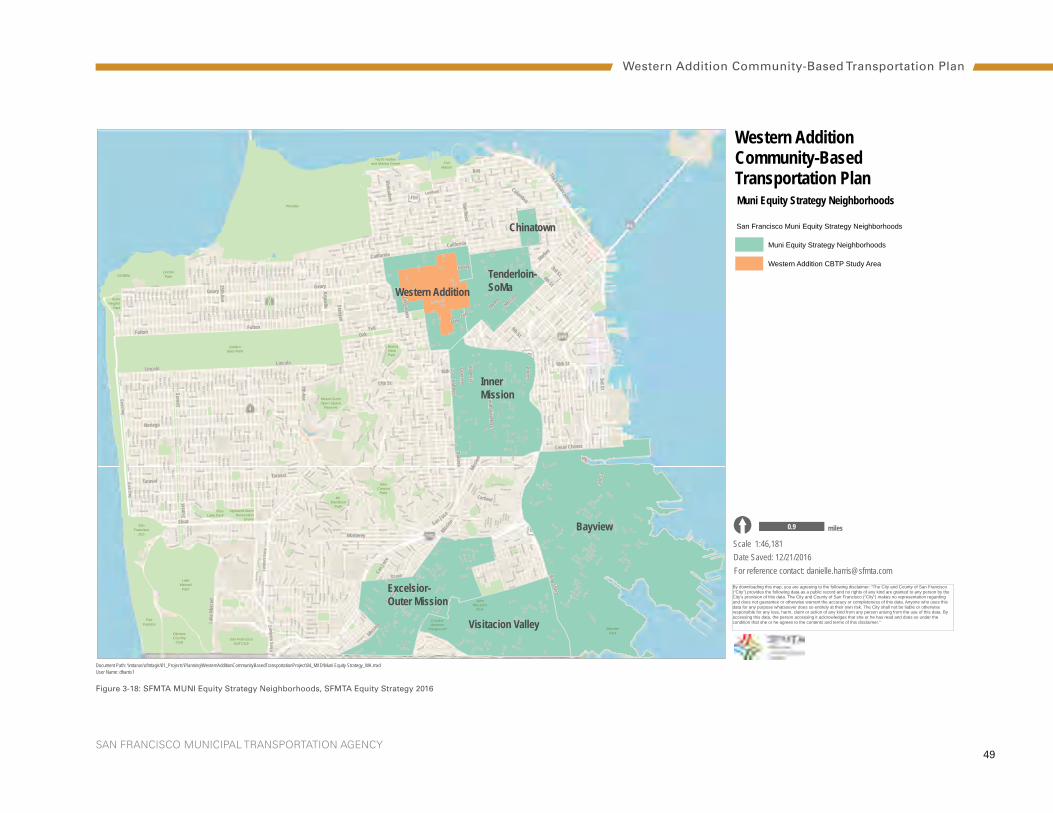
SAN FRANCISCO MUNICIPAL TRANSPORTATION AGENCY 49
GGNRA
Mount SutroOpen Space
Reserve
San FranciscoGolf Club
SutroHeights
Park
FortFunston
OlympicCountry
Club
FortMason
Presidio
CrockerAmazon
Playground
LakeMerced
Park
Mt.Davidson
Park
JohnMcLaren
Park
PineLake Park
SanFrancisco
Zoo
Sigmund SternRecreation
Grove
MonsterPark
GlenCanyon
Park
LincolnPark
Yacht Harborand Marina Green
BuenaVistaPark
GoldenGate Park
Goettingen
Chestnut
Moul
trie
FolsomFolsom
Folsom
Folsom
Skyv
iew
Surrey
Urbano
Bella
Vista
Amber
Juni
p ero
Serra
J uni
per o
Serra
Grant
Marietta
Stone
crest
Cres t l ine
Jones
Jones
Cresta VistaCrescent
Filbert
Filbert
Filbert
Clearfield
Guttenberg
Van Dyke
Sunnydale
Sunnydale
Randall
Vallejo
Vallejo
Vallejo
Munich
Phela
n
M id d
lefie
ld
SanP ablo
Velasco
Warren
Larkin
Str a
t for d
Greenwich
Greenwich
Greenwich
Tun n
el
DiamondDe Haro
De Haro
Baker
Bernal Heights
Townsend
Townsend
Union
Union
Union
Kearny
Turk
Powhattan
CarolinaFo
lsom
Wisconsin
Morse
Sutter
Sutter
Yosemite
Plymouth
CervantesFrancisco
Thornton
Hayes
Hayes
Hayes
Taylor
Taylor
Taylor
Kearny
Folsom
Folsom
Williams
An z a vis ta
H o llow a y
Caselli
30th Ave30th Ave
Joost Joost
Clay
Clay
Clay
Woolsey
Eureka
Panorama
Fitzgerald
Revere
Revere
Holly Park
Lisbo
n
9thAv
e
Washington
Washington
Lyon
UlloaUlloa
Ulloa Ulloa
Moraga
Laidley
Colon
Wayland
19th St
Los Palmos
Wildwood
Ocean
Montgomery
Montgomery
Harkness
France
Grafton
Wawona
Wawona
35th Ave35th Ave
Pros
pect
Burnet t
PaloAlto
Hanover
Quesada
Quesada
Brunswick
OrtegaOrtega
Pacheco
Hoffman
Je r rold
Roo se
velt
Lawton
Gold Mine
Oriza
ba
Pierce
8th St
Rivera
Lane
Eucalyptus Eucalyptus
Loom
is
Webster
Polk
Polk
Steiner
Steiner
SteinerFillm
ore
Fillmore
Broderick
Webster
Laguna
Laguna
Laguna
Buchanan
T op a z
Bush
Bush
Mullen
Casi tas
G len
v iew
Seneca
San Jose
Jarboe
Lansdale
Coler
idge
Addiso n
Mir a lo ma
Eugenia
Whitney Youn g
Teresita
Teresita
Laurel
Hollad
ay
Montcalm
Brazil
WallaceArmstrong
Pacheco
6th St
Battery
Minnesota
Upland
Castenada
1st St
Prague
12th St
Post
Post
Post
Post
Visitacion
Trumbull
Foote
29th St29th St
SantiagoSantiago
Santiago
La Playa
Bowdoin
Diamond
Diamond
Merced
AlabamaA lab am
a
Kirkwood
8th Ave8th Ave
Oakdale
Hester
Buen
aVi
s ta
Wes
t
C h ri stoph er
Clay
t on
Fremont
Ande
rson
Clay
Clay
Clay
Vasquez
La Salle
Ofarrell
46th Ave46th Ave
Newcomb
32nd Ave
Duboce
31st Ave
15th Ave
C orbe
tt
Corbe
ttParnassus
Kenwood
Frederick
Ellis
Ellis
Eddy
Eddy
Eddy
Ofarrell
Mcallister
Mcallister
Mcallister
Saint Francis
Sussex
47th Ave47th Ave
47th Ave
Waller
Ellis
Concord
Laguna Honda
30th Ave30th Ave
30th Ave
Russia
Industrial
Campbell
Carroll
Huron
22nd St
Shrader
Count ryClub
Miguel
Arbor
20th St20th St
M ount VernonOttawa
Upper
Gladstone
Rutla
nd
Leland
Rolph
Rolph
Coro
na
Lakeview
Golden Gate
Sawy
er
23rd St23rd St
23rd St
R and olp h
Blanken
26th St26th St
26th St
21st St21st St
22nd St22nd St
22nd St
25th St25th St
25th St
Avalon
Cole
Brentwood
LawtonLawton
Lombard
Lombard
Excels ior
Garfield
33rd Ave33r d Ave
33rd Ave
Jackson
Jackson
Jackson
Jackson
Jackson
Mangels Mangels
Persia
Rome
Italy
Ingall
s
Ingalls
Mariposa
24th St
18th St
West Point
25th St25th St
Anza AnzaAnza
Anza
Plym
outh
Plym
outh
24th St24th St
24th St
44th Ave44th Ave
44th Ave
45th Ave45th Ave
45th Ave
ParkerParker
20th St20th St
Juani
ta
Graystone
17th St17th St
17th St
Mende
ll
19th St
Phelp
s
J enn in g s
Jenn
ings
Griffith
Beacon
18th St18th St
18th St
Precita27th St
Keith
Berry
Head
Head
Turquoise
Westg
ate
Bartlett
Chestnut
Newha
ll
Shafter
Holloway
DouglassDouglass
Sanchez
VicksburgChurch
ChurchChurch
NoeNoe
Noe
SanchezSanchez
Green
Green
Green
Dwight
Edna
15th Ave
15thA
ve
QuintaraQuintara
CastroCastro
Chattanooga
Bacon
Hudson
BaconBurrows
Felton
FeltonSilliman
Wilde
Theresa
Myra
Evelyn
JudahJudah
Judah
Madrid
Madrid
V ictor
i a
Ortega
Moraga MoragaMoraga
BalboaBalboa
RiveraRivera
36th Ave36th Ave
36th
Ave
AnzaAnza
JudahIrving
IrvingIrving
Irving
Hugo
ClementClement
ClementClement
Quintara
37th Ave37th Ave
37th Ave
KirkhamKirkham
Kirkham Kirkham
CabrilloCabrillo
CabrilloCabrillo
Pacheco
20th St
E l C am in o D e l M a r
VicenteVicen te Vicente
5th St
Brannan
15th St15th St
19th St
Point Lobos
Bryant
Bryant
Bryant
7th St
Capi
tol
Capi
tol
19th St 19th St
Walnut
Locust
Presidio
Pierce
Pierce
Mission
Mckinnon
Tennessee
Gough
Gough
Buchanan
BuchananOctavia
Front
Lak eLake
Arling
t on
Larkin
Larkin
Le Conte
Ter ryAFra ncois
Sant
os
Ingerson
SilverSilver
Silver
Sweeny
39th Ave39th Ave
Ellington
Willard
Jersey
Pierce
5th Ave
Ashbury
Broderick
Lyon
BakerCentral
BroderickBroderick
Scott
Scott
Scott
Scott
Sacramento
Sacramento
Sacramento
Sacramento
Bake
r
4t hSt
Powell
Powell
Powell
Pacific
Pacific
Pacific
Pacific
Lyon
Hyde
Hyde
Hyde
Leavenwor th
Leavenworth
Leavenworth
Hale
10th Ave10th Ave
Topeka
Funston
HarrisonHarrison
Harriso
n
Harriso
n
Harrison
Octavi a
Kensington
Gr an dV iew
Maywood
Howard
Howard
Howard
Bank
s
University
Onondaga
Day
Pine
Howt
h
Foer
ster
30th St
Richland
2nd St
2nd St
Noriega
FloridaFlorida
Florida
Flood Flood
Cambridge
ShotwellShotwell
26th Ave
Duncan
San Jaci
nto
YorkYork
Curtis
Sadowa
11th Ave11th Ave
Faxo
n
Haro
ld
Fax o n
Hazelwood
Mason
Mason
Mason
Washington
Washington
14th
A ve
14th Ave
Connecticut
31st Ave31st Ave
31st Ave
43rd Ave43rd Ave
43rd Ave
La Playa
Chicago
Dorantes
Jamestown
Y er ba Bue na
Carl
Gellert
Schw
erin
C rest m
ont
Pren
tiss
Gene Friend
Newhall
Stockton
Stockton
DeLong
Oxford
Ando
ver
Gate
s
Ellsworth
Ells w
o rt h
Mckinnon
12th Ave
Allison
28th Ave28th Ave
28th Ave
Haight
Haight
Haight
Putna
m
Goettingen
Pope
Justin
Page
Page
Page
Asht
on
Thrift
Madison
Hamilton
Brussels
Brussels
Gambier
25th Ave
Holyoke
Beale
Harvard
Girard
Girard
Harbor
Niagara
IndianaIndiana
Alabama
Buena Vista Eas
t
Mississippi
San Bruno
Texas
MissouriMissouri
Rhode IslandRhode Island
Connecticut
Vermont
Kansas Arkansas
Tennessee
IllinoisIllinois
Carolina
Beach
Owens
Darien
San
F er n
ando
San L
eand
roSa
nta A
na
Spear
Chenery
Chenery
Jules
Valdez
Jefferson
Wash ing to n
Broadway
Broadway
Grove
Grove
Beach
Beach
Grove
Grove
M is s ion B ay N o rth
Francisco
Fulton
Fulton
Waller
Sutter
Hermann
Francisco
Staples
Edinb
urg
Edinb
urg
Euclid
34th Ave34th Ave
Collins
Brid
gevie
w
Kansas
Delan
o
2nd Ave2nd Ave
East
wood
D ens
low e
Ney
Capistr
ano
Winding
3rd Ave3rd Ave
Palou
Palou
Palou
42nd Ave42nd Ave
42nd Ave
26th St
Neva
da
4th Ave4th Ave
San Ju an
Raymond
Collingw ood
Fair Oaks
Hampshire
Hampshire
Hartford
Treat
CappCapp
Lee
Valley
Montana
Rockdale
5th Ave5th Ave
Arleta
Paris
Paris
Lond
on
Lond
on
Hahn
Wawona
San
Beni
to
Blythdale
Liberty
Gard
e nsid
e
11th St
Main
Jerrold
6th Ave6th Ave
Bever
ly
Cesar Chavez
14th St14th St
28th St28th St
Byxbe
e
Teddy
Hill
Alvarado
Elizabeth
Ralst
onVe
rnon
Vict
oria
T iog a
Egbert
Carroll
Circular
Mira
mar
Brig
ht
Gran
ada
Munich
Brig
hton
C r e s t lake
Gilman
Pragu
e
Hearst Hearst
Hollister
Mosco
w
Moscow
Vienn
a
Vienn
a
Judson
Naple
s
Naple
s
Fairfax
A th ens
Athe
ns
Newcomb
ThomasUnderwood
Oakdale
Arch
7th Ave7th Ave
Maynard
40th Ave40th Ave
38th Ave
40th Ave40th Ave
39th Ave39th Ave
Santa Rosa
41st Ave41st Ave
41st Ave
9th Ave9th Ave
27th Ave
29th Ave29th Ave
29th Ave
10th Ave10th Ave
11th Ave11th Ave
38th Ave38th Ave
32nd Ave32nd Ave
32nd Ave
24th Ave24th Ave
24th Ave
12th Ave12th Ave
23rd Ave
FunstonFunston
22nd Ave22nd Ave
22nd Ave21st Ave
21st Ave21st Ave
15th Ave15th Ave
17th Ave17th Ave
17th Ave
16th Ave16th Ave
48th Ave48th Ave
48th Ave
18th Ave18th Ave
20th Ave20th Ave
20th Ave
16th Ave15th Ave14th Ave
19th Ave19th Ave
20th Ave20th Ave
18th Ave18th Ave
18th Ave
21st Ave21st Ave
23rd Ave23rd Ave
33rd Ave47th Ave
24th Ave25th Ave
25th Ave
26th Ave26th Ave
27th Ave27th Ave
16 th Ave16th Ave
23rd Ave23rd Ave
46th Ave45th Ave
26th Ave26th Ave
44th Ave
14th Ave14th Ave
27th Ave27th Ave
43rd Ave
29th Ave29th Ave
8th Ave8th Ave
17th Ave17th Ave
42nd Ave
28th Ave28th Ave
41st Ave
22nd Ave22nd Ave
40th Ave39th Ave38th Ave
37th Ave36th Ave35th Ave34th Ave
Great HwyGreat Hwy
Hernandez
Del l b
r ook
Twin
Peak
s
Spruce
Palm
Magellan
Jordan
Northridge
Broad
Cotter
Comm
onwealth
Idora
Mol im
o
Kiska
Elsie
Winfiel
d
Mansell
Sagamore
FarallonesLobos
Brookd a le
Morn
ingsid
e
Egbert
Clayton
Bluxome
Lakeshore
Winston
Robinhood
Napoleon
Dalewood
States
Cargo
Bu c k i ngham
O s ha ugh ne s s y
Mission
Mission
Mission
Miss
ion
Lake
Mer
ced
Columbus
Arguello
Sloat
9th St
3rd St
Ocean
Sunset
Suns
et
Geary
Cortland
17th St
Monterey
Bay Shore
Cesar Chavez
16th St16th St
4th St
ValenciaDoloresDolores
3rd
St
3rdS t
Noriega
TaravalTaraval
FultonFulton
LincolnLincoln
Divisadero
Divisadero
Stanyan
South Van Ness
CaliforniaCalifornia
Alemany
Bay
Van Ness
Oak
Oak
Potrero
Lombard
Fell
Fell
Guerrero7th Ave
25th Ave
Market
Market
The Embarcadero
Junipe ro Serra
Junip
ero S
erra
GearyGeary
San J
ose
San Jose
Great Hwy
Great Hwy
Western AdditionCommunity-BasedTransportation Plan
User Name: dharris1Document Path: \\mtanas\sfmtagis\01_Projects\Planning\WesternAdditionCommunityBasedTransportationProject\04_MXD\Muni Equity Strategy_WA.mxd
For reference contact: [email protected] Saved: 12/21/2016
1:46,181Scale[ 0.9 Milesmiles
By downloading this map, you are agreeing to the following disclaimer: “The City and County of San Francisco(“City”) provides the following data as a public record and no rights of any kind are granted to any person by theCity’s provision of this data. The City and County of San Francisco (“City”) makes no representation regardingand does not guarantee or otherwise warrant the accuracy or completeness of this data. Anyone who uses thisdata for any purpose whatsoever does so entirely at their own risk. The City shall not be liable or otherwiseresponsible for any loss, harm, claim or action of any kind from any person arising from the use of this data. Byaccessing this data, the person accessing it acknowledges that she or he has read and does so under thecondition that she or he agrees to the contents and terms of this disclaimer."
Muni Equity Strategy Neighborhoods
Muni Equity Strategy Neighborhoods
Western Addition CBTP Study Area
San Francisco Muni Equity Strategy Neighborhoods
Western AdditionTenderloin-SoMa
Chinatown
InnerMission
Bayview
Visitacion Valley
Excelsior-Outer Mission
Figure 3-18: SFMTA MUNI Equity Strategy Neighborhoods, SFMTA Equity Strategy 2016
Western Addition Community-Based Transportation Plan

50
WESTERN ADDITION LIFELINE SERVICE (FREQUENCY OF SERVICE, HOURS OF OPERATION)
ROUTESE
RVES
CA
LWO
RKS
CLU
STER
SERV
ES E
SSEN
TIA
L D
ESTI
NAT
ION
S
OPE
RATO
R TR
UN
KLIN
E RO
UTE
REG
ION
AL
LIN
K
CONNECTION TO OTHER LIFELINE SERVICES
WEE
KDAY
AM
/PM
(1
5 M
IN)
WEE
KDAY
MID
DAY
(3
0 M
IN)
WEE
KDAY
(NIG
HT)
SATU
RDAY
(30
MIN
)
SUN
DAY
(30
MIN
)
WEEKDAY (6 AM TO 12 AM)
SATURDAY (6 AM TO 12 AM)
SUNDAY (7:30 AM TO 12 AM)
2-Clement x x - - BART A B X B B 5:20 to 20:08 5:26 to 19:25 5:26 to 19:25
3-Jackson x x - - BART A B B A A 6:36 to 23:16 6:04 to 23:16 6:04 to 23:16
5-Fulton x x x -AC Transit, Golden Gate, BART, SamTrans
A A A A A 24 Hours 24 Hours 24 Hours
6-Haight/ Parnassus
x x x -AC Transit, SamTrans, BART, Golden Gate
A A B A B 5:20 to 112 5:19 to 1:15 5:19 to 1:15
7-Haight/ Noriega x x x - BART A A B A B 5:39 to 1:10 5:40 to 1:10 5:40 to 1:10
21-Hayes x x x - BART A A B B B 5:39 to 1:03 6:26 to 1:01 6:26 to 1:01
22-Fillmore x x x - BART A A A A A 24 Hours 24 Hours 24 Hours
24-Divisadero x x x - A A A B B 24 Hours 24 Hours 24 Hours
31-Balboa x x x - BART A A B B B 4:40 to 1:47 5:15 to 1:45 5:15 to 1:45
38-Geary x x x - BART A A A A A 24 Hours 24 Hours 24 Hours
HEADWAYS: (A: EQUAL OR LESS THAN 15 MIN) (B: 16-30 MIN) (C: 31-60 MIN) (D: LESS THAN ONCE/HOUR) (X:NO SERVICE)
SAN FRANCISCO MUNICIPAL TRANSPORTATION AGENCY 51
LIFELINE NETWORK AND ANALYSISA key recommendation that emerged from the Regional Welfare-to-Work Transportation Plan adopted by the MTC in 2001 was for the MTC to establish a Lifeline Transit Network for inclusion in the 2001 update of the Regional Transportation Plan (RTP). Completed December 2001, the Lifeline analysis did not identify any spatial gaps in San Francisco. Similarly, temporal gaps identified by the analysis of service schedules were minimal.
WEStErn addition liFElinE nEtWork
The Lifeline Transportation Network analysis identified a series of routes that are considered critical to meeting the needs of low-income communities because they provide:
• Direct service to a neighborhood with high concentrations of CalWORKs (income-assisted) households;
• Direct service to areas with high concentrations of essential destinations like hospitals, jobs, schools, and grocery stores
• Key regional links; or
• Core trunkline service as identified by the transit operator
As an urban core transit operator, over 60% of Muni routes make up San Francisco’s Lifeline Transportation Network, which includes 48 of Muni’s 78 routes. 43 out of the 48 Lifeline routes serve both a large number of income-assisted (CalWorks) households and a concentration of essential destinations. Muni Routes within the Western Addition that were considered Lifeline routes are:
• 2-Clement
• 3-Jackson
• 5-Fulton
• 6-Parnassus
• 7-Haight- Noriega (formerly 71/71L-Haight-Noriega)
• 21-Hayes
• 22-Fillmore
• 24-Divisadero
• 31-Balboa
• 38/38R-Geary (formerly 38L-Geary Limited)
These routes are identified in the table to the left, along with the Lifeline criteria that were satisfied. Lifeline criteria identified the following objectives for frequency of transit service:
• 15-minute peak frequencies, Monday through Friday
• 30-minute midday and night frequencies, Monday through Friday
• 30-minute frequencies on weekends The objectives for hours of operation are:
• 6:00 a.m. – 12:00 a.m. Monday through Saturday
• 7:30 a.m. – 12:00 a.m. on Sundays
Western Addition Access at a GlimpseThe Western Addition lends itself to walking, biking, driving and taking the bus with its central location, flat terrain, connections to major arterial streets and access to 13 bus routes. However these transportation elements alone do not instantly create a utopian-like environment, for the community continues to be challenged with many other disparities. The community outreach process following this analysis will provide greater insight into the neighborhood conditions and understanding of the disparities the community faces.