Embed Size (px)
DESCRIPTION
PRISM. GROUP. Western Region GIS Update: National Suitability Modeling of Biofuel Feedstocks. Chris Daly, Mike Halbleib David Hannaway Sun Grant Western Region GIS Center Oregon State University Corvallis, Oregon, USA. Introduction - PowerPoint PPT Presentation
Citation preview
Western Region GIS Update:Western Region GIS Update:National Suitability Modeling of Biofuel National Suitability Modeling of Biofuel
FeedstocksFeedstocks
Western Region GIS Update:Western Region GIS Update:National Suitability Modeling of Biofuel National Suitability Modeling of Biofuel
FeedstocksFeedstocks
Chris Daly, Mike Halbleib David HannawayChris Daly, Mike Halbleib David HannawaySun Grant Western Region GIS CenterSun Grant Western Region GIS Center
Oregon State UniversityOregon State UniversityCorvallis, Oregon, USACorvallis, Oregon, USA
IntroductionIntroduction
GIS Program Objective: GIS Program Objective: Gain an understanding of the spatial distribution of current and potential feedstock resources regionally and nationally
A couple of envisioned outcomes: A couple of envisioned outcomes: A series of national maps that describe the actual and
potential productivity patterns of various feedstocks Maps showing changes in production patterns under
historical and future climates
How Are We Accomplishing This?How Are We Accomplishing This?
CurrentlyCurrently• Collecting production information from field trials and the literature; some
regions developing models to make spatial estimates
Issues Issues • Data are taken from scattered locations under various management
practices and at varying times
• Difficult to coordinate these regional results into a national, “wall-to-wall” (full national) assessment that is consistent across the country
• Unclear how potential biomass production of new crops will be estimated nationwide, both now and under historical and future climates
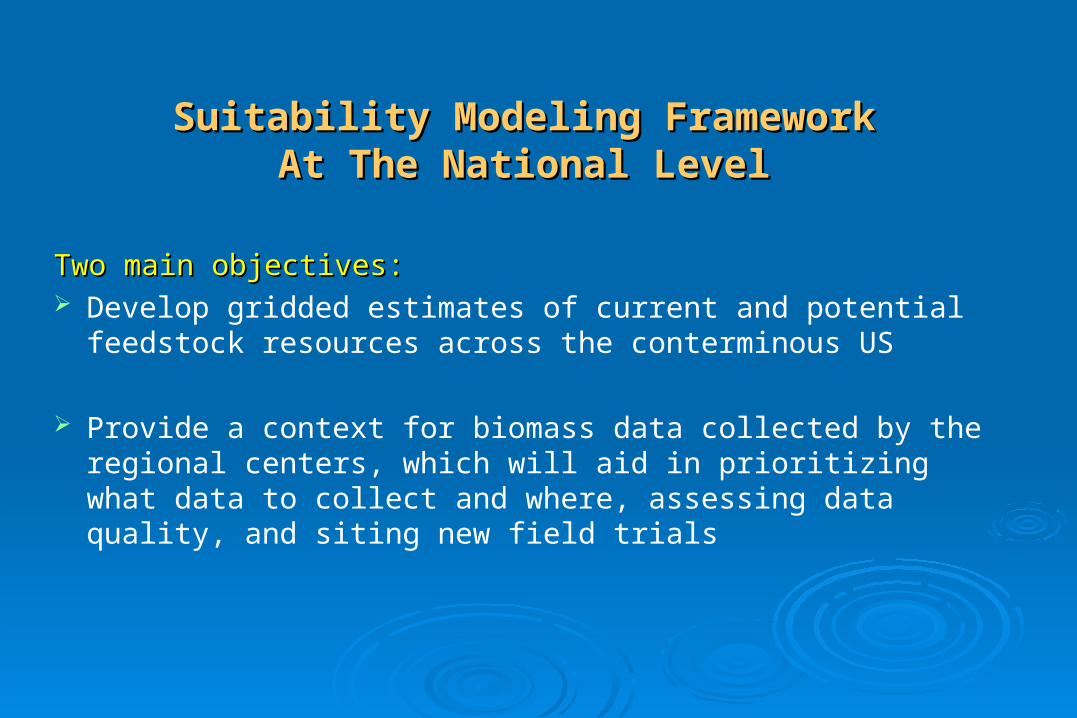
Suitability Modeling FrameworkSuitability Modeling FrameworkAt The National LevelAt The National Level
Two main objectives:Two main objectives: Develop gridded estimates of current and potential feedstock
resources across the conterminous US
Provide a context for biomass data collected by the regional centers, which will aid in prioritizing what data to collect and where, assessing data quality, and siting new field trials
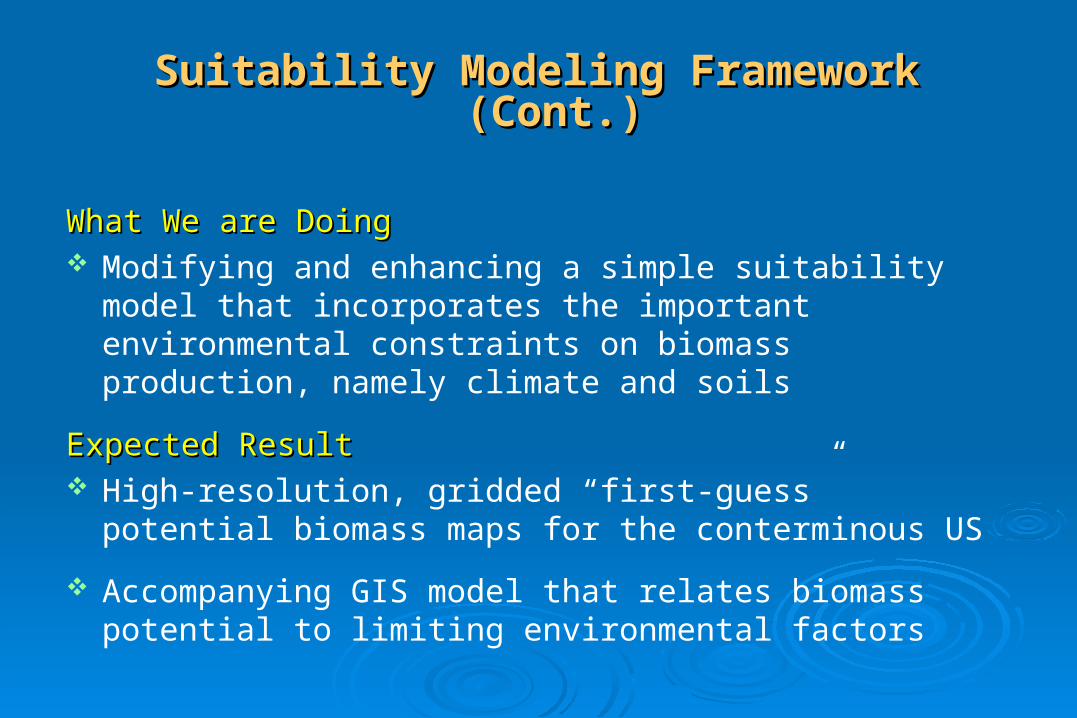
Suitability Modeling Framework (Cont.)Suitability Modeling Framework (Cont.)
What We are DoingWhat We are Doing Modifying and enhancing a simple suitability model that
incorporates the important environmental constraints on biomass production, namely climate and soils
Expected ResultExpected Result High-resolution, gridded “first-guess” potential biomass maps
for the conterminous US
Accompanying GIS model that relates biomass potential to limiting environmental factors
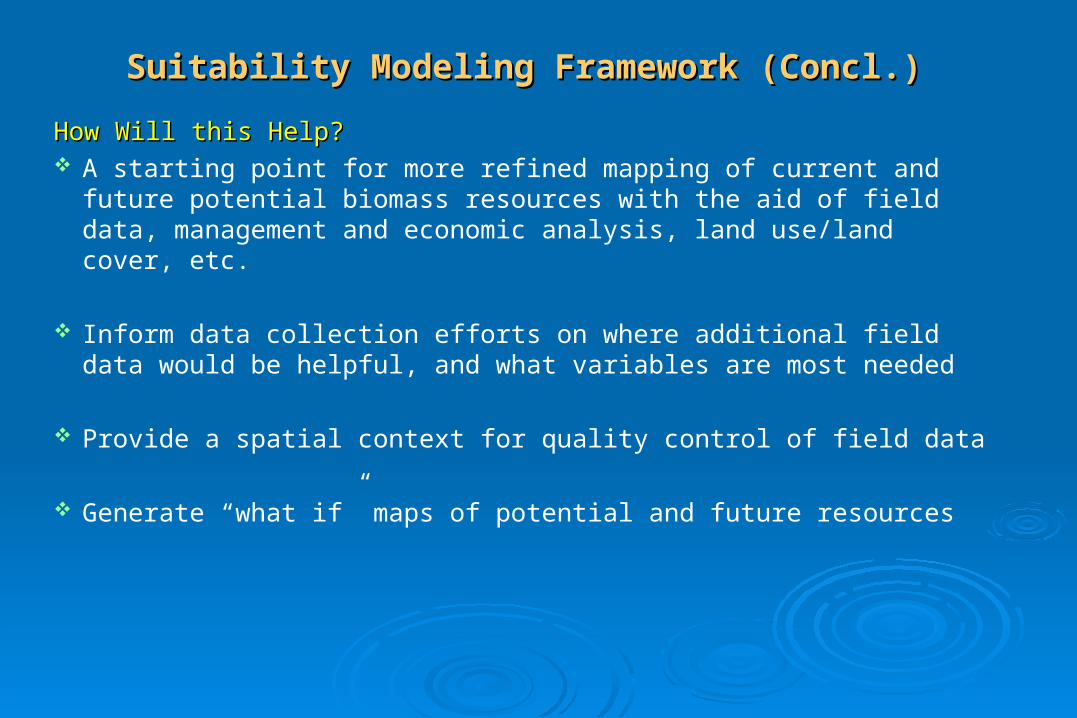
Suitability Modeling Framework (Concl.)Suitability Modeling Framework (Concl.)
How Will this Help?How Will this Help? A starting point for more refined mapping of current and future
potential biomass resources with the aid of field data, management and economic analysis, land use/land cover, etc.
Inform data collection efforts on where additional field data would be helpful, and what variables are most needed
Provide a spatial context for quality control of field data
Generate “what if” maps of potential and future resources
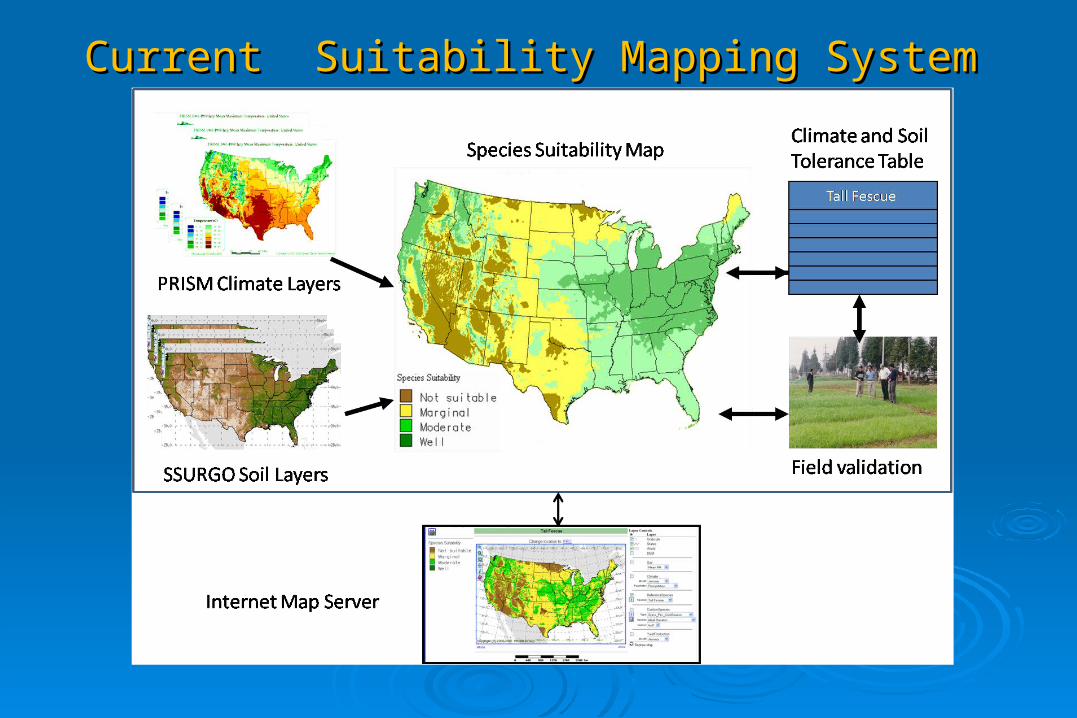
Current Suitability Mapping SystemCurrent Suitability Mapping System
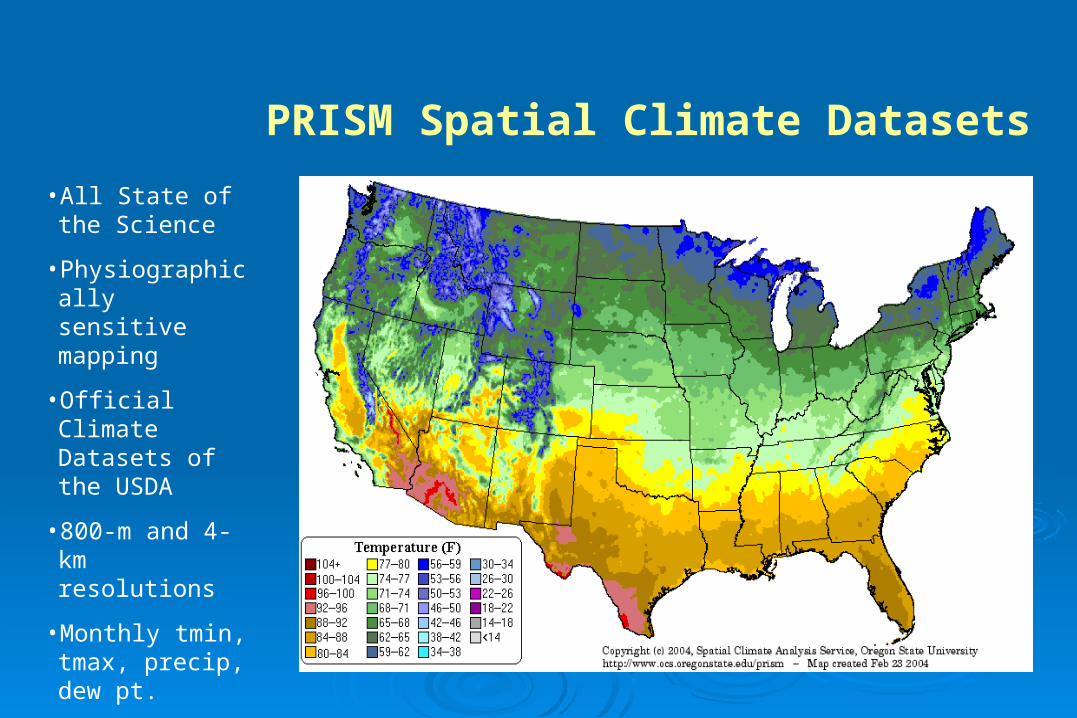
PRISM Spatial Climate Datasets
• All State of the Science
• Physiographically sensitive mapping
• Official Climate Datasets of the USDA
• 800-m and 4-km resolutions
• Monthly tmin, tmax, precip, dew pt.
• 1971-2000 means
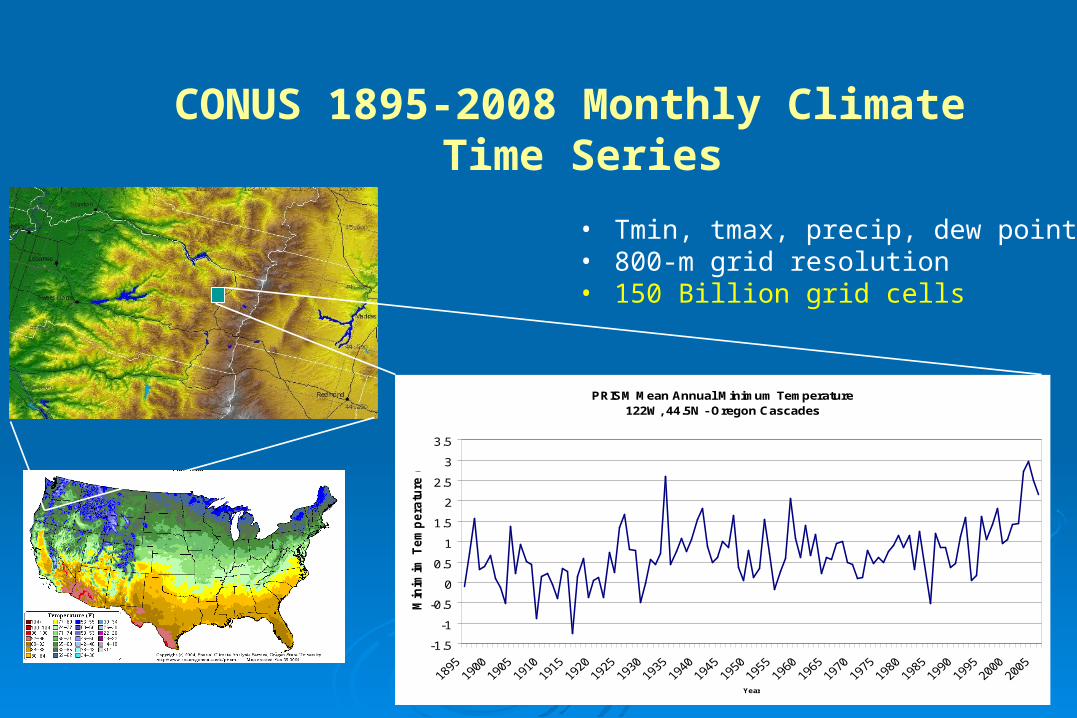
CONUS 1895-2008 Monthly Climate Time Series
PRISM Mean Annual Minimum Temperature122W, 44.5N - Oregon Cascades
-1.5
-1
-0.5
0
0.5
1
1.5
2
2.5
3
3.5
Year
Min
imim
Te
mp
era
ture
(C
)
• Tmin, tmax, precip, dew point• 800-m grid resolution• 150 Billion grid cells
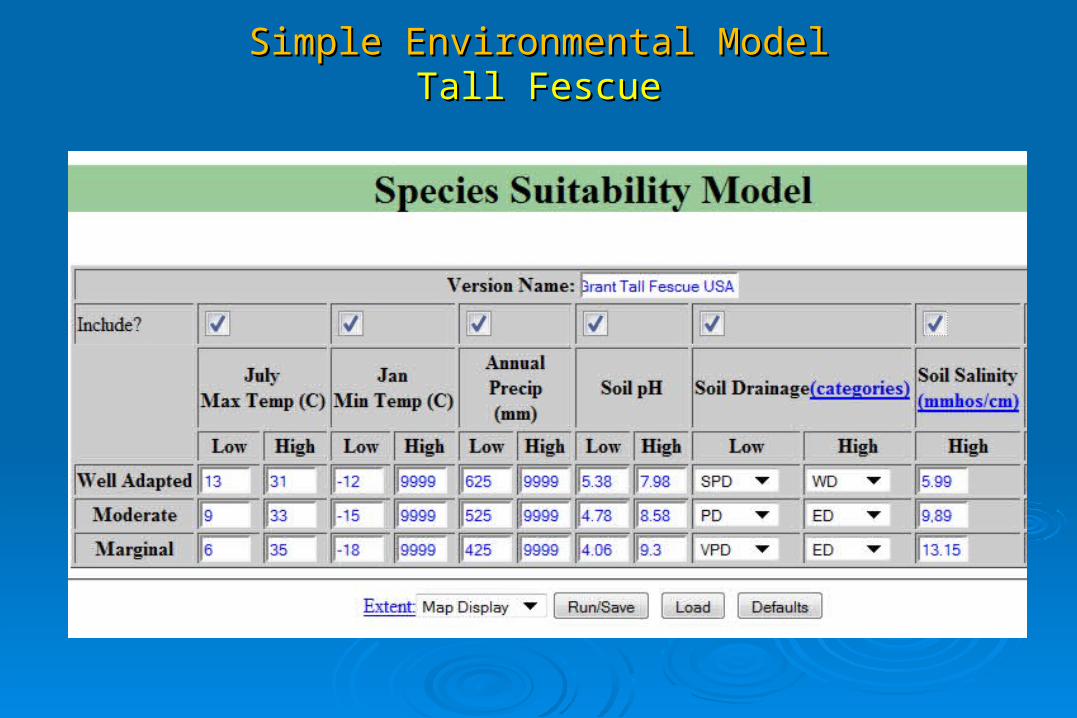
Simple Environmental ModelSimple Environmental ModelTall FescueTall Fescue
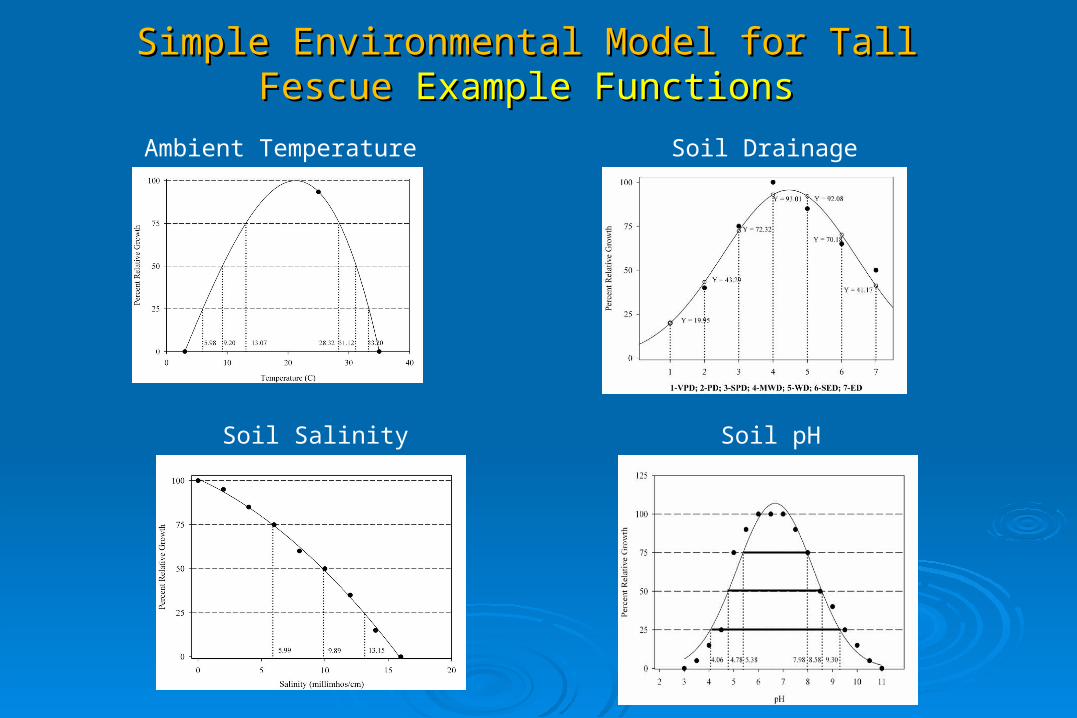
Simple Environmental Model for Tall Fescue Simple Environmental Model for Tall Fescue Example FunctionsExample Functions
Unsuitable
Soil Drainage
Soil Salinity Soil pH
Unsuitable
Ambient Temperature
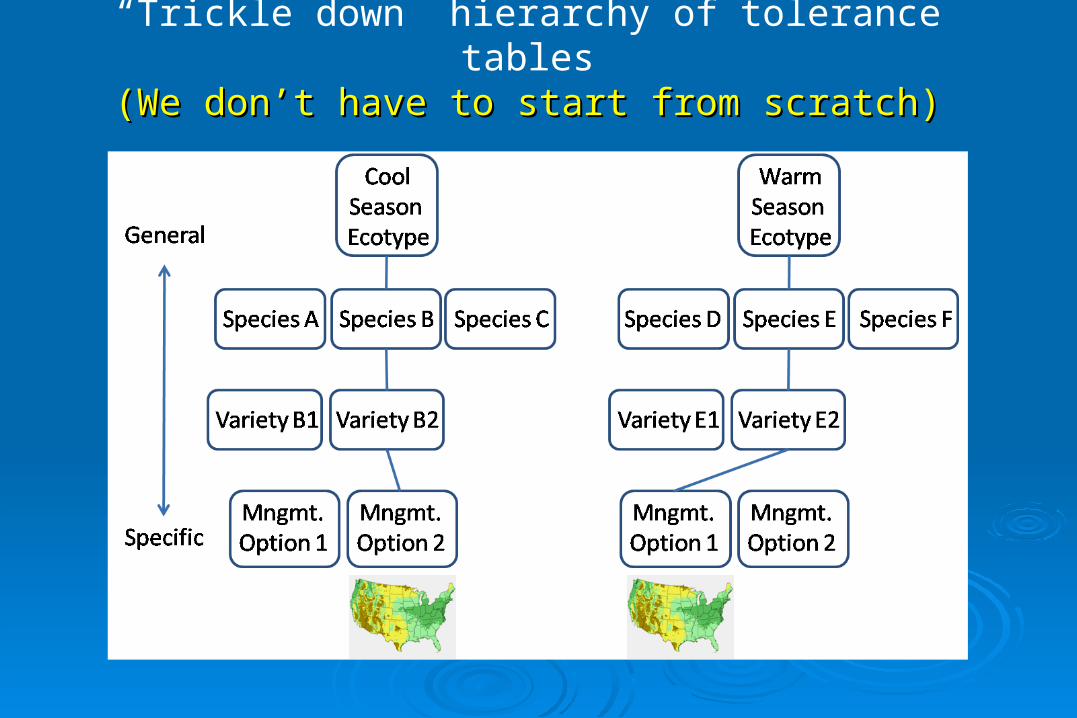
“Trickle down” hierarchy of tolerance tables(We don’t have to start from scratch)(We don’t have to start from scratch)
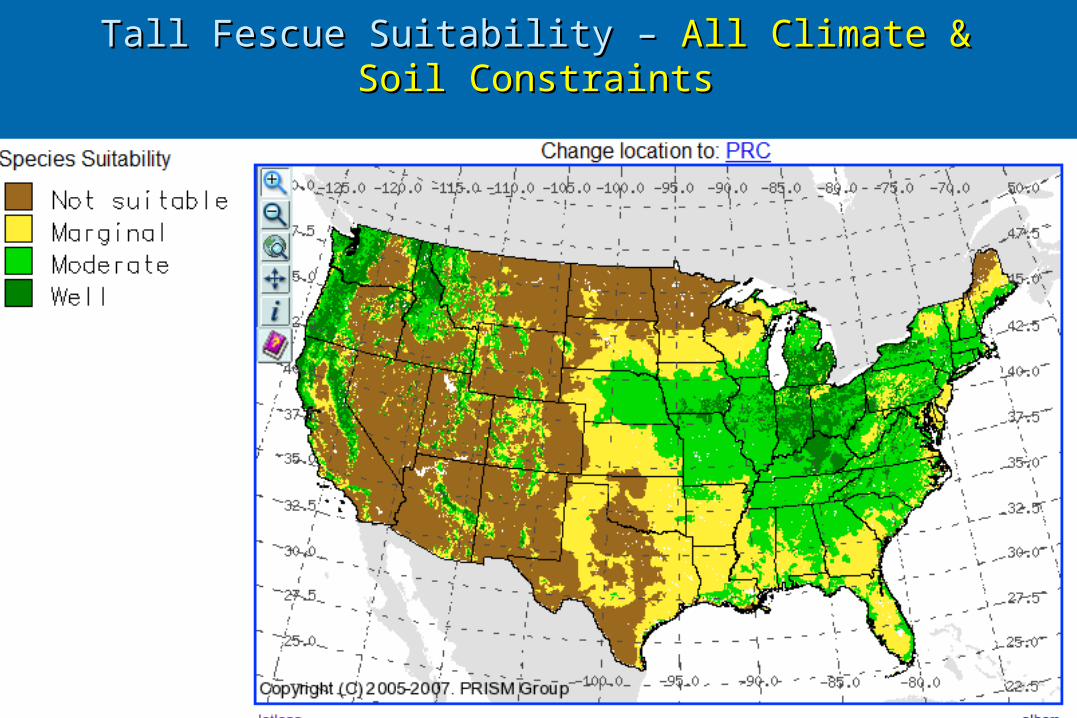
Tall Fescue Suitability – Tall Fescue Suitability – All Climate & Soil ConstraintsAll Climate & Soil Constraints
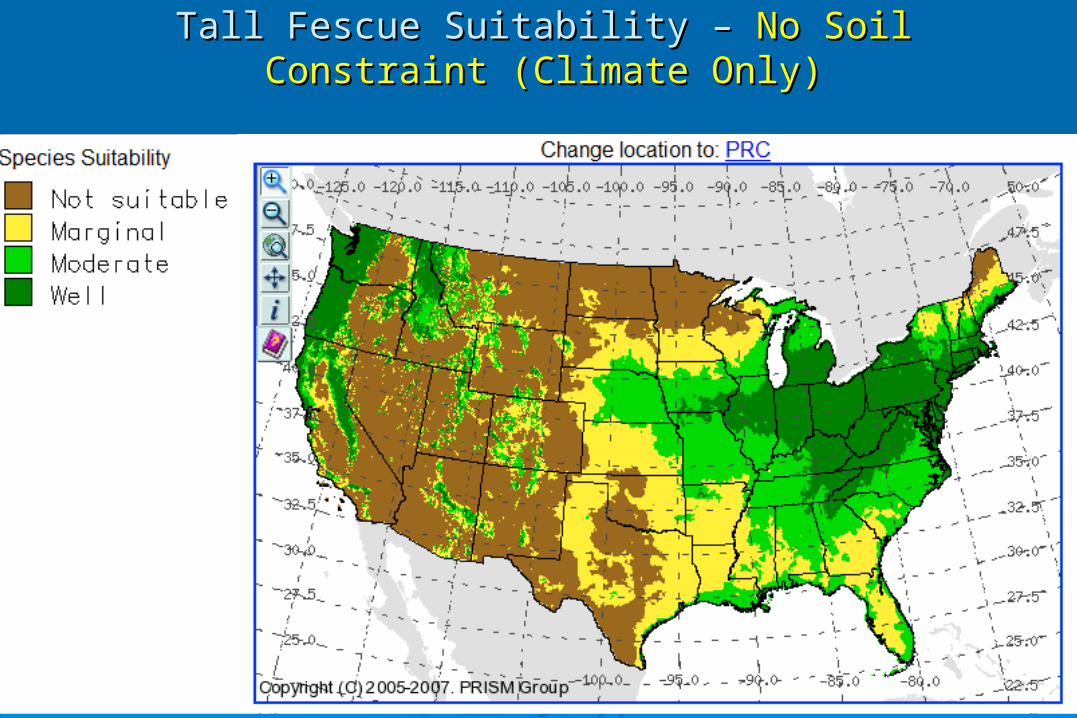
Tall Fescue Suitability – Tall Fescue Suitability – No Soil Constraint (Climate Only)No Soil Constraint (Climate Only)
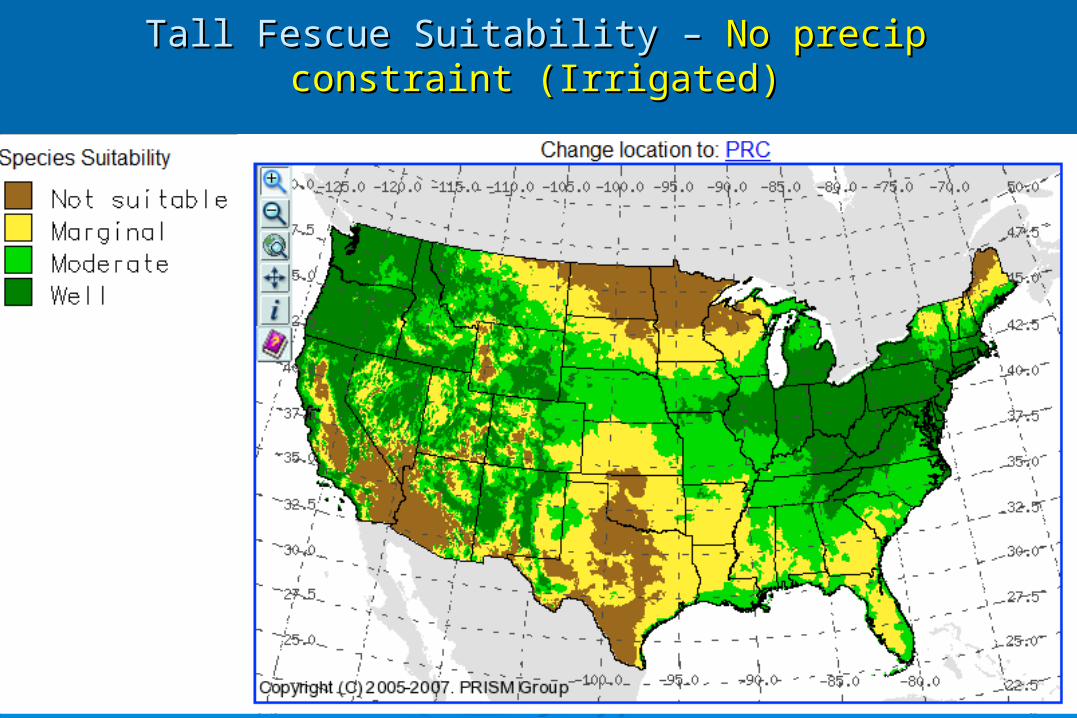
Tall Fescue Suitability – Tall Fescue Suitability – No precip constraint (Irrigated)No precip constraint (Irrigated)
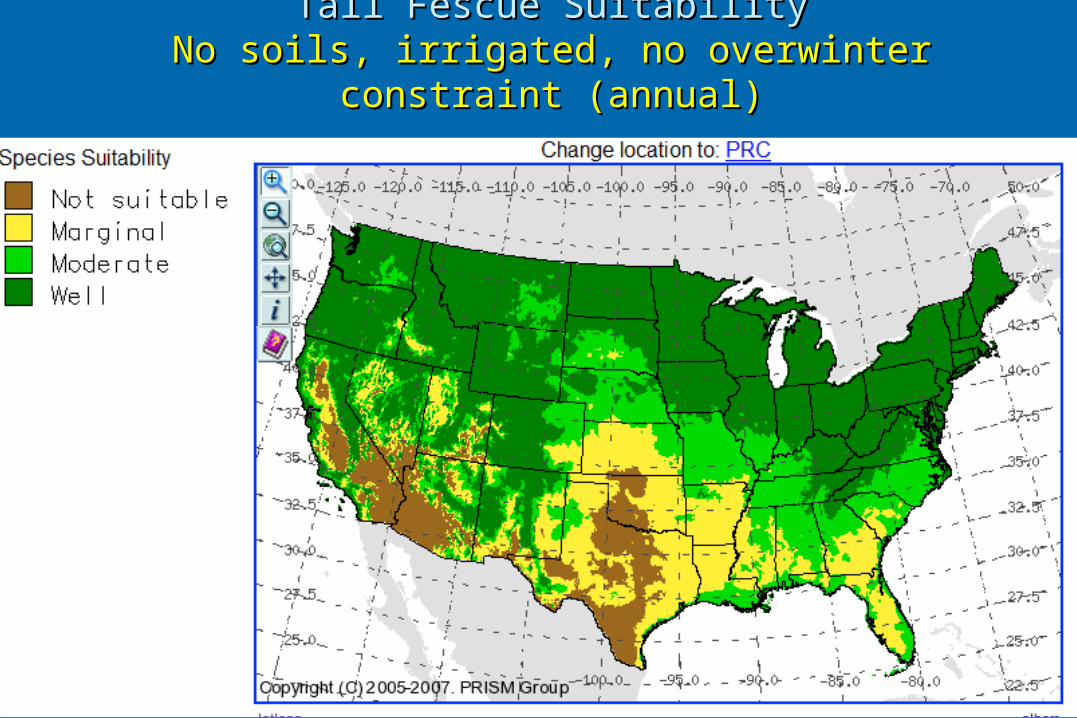
Tall Fescue SuitabilityTall Fescue SuitabilityNo soils, irrigated,No soils, irrigated, no overwinter constraint (annual)no overwinter constraint (annual)
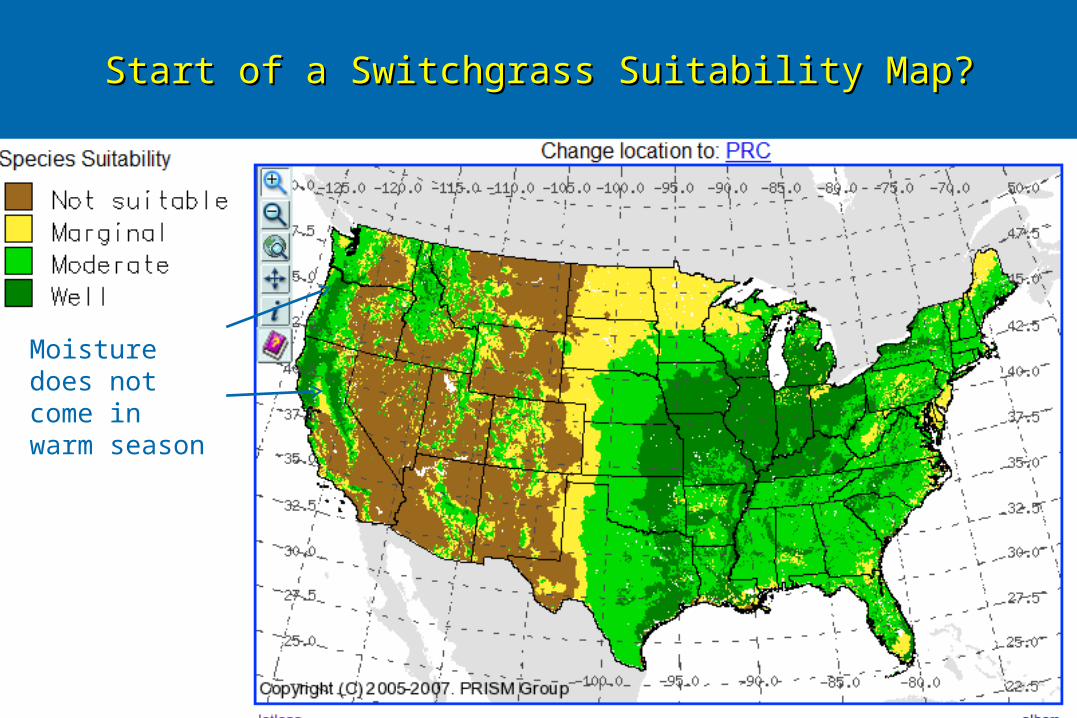
Start of a Switchgrass Suitability Map?Start of a Switchgrass Suitability Map?
Moisture does not come in warm season
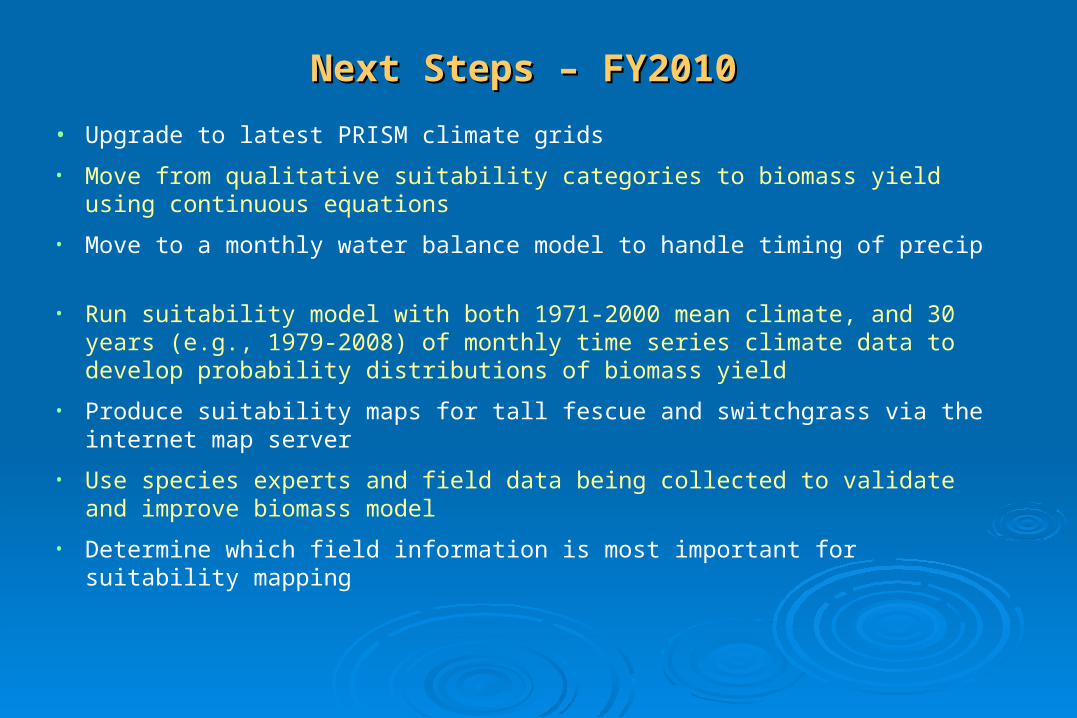
Next Steps – FY2010Next Steps – FY2010
• Upgrade to latest PRISM climate grids
• Move from qualitative suitability categories to biomass yield using continuous equations
• Move to a monthly water balance model to handle timing of precip
• Run suitability model with both 1971-2000 mean climate, and 30 years (e.g., 1979-2008) of monthly time series climate data to develop probability distributions of biomass yield
• Produce suitability maps for tall fescue and switchgrass via the internet map server
• Use species experts and field data being collected to validate and improve biomass model
• Determine which field information is most important for suitability mapping
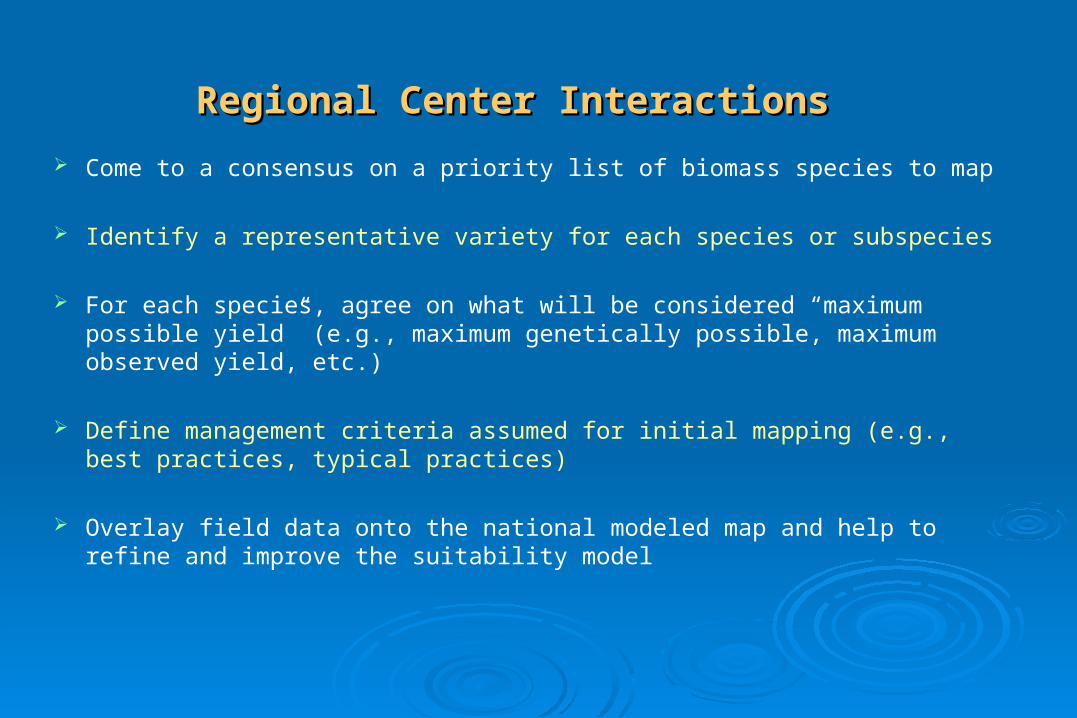
Regional Center Interactions Regional Center Interactions
Come to a consensus on a priority list of biomass species to map
Identify a representative variety for each species or subspecies
For each species, agree on what will be considered “maximum possible yield” (e.g., maximum genetically possible, maximum observed yield, etc.)
Define management criteria assumed for initial mapping (e.g., best practices, typical practices)
Overlay field data onto the national modeled map and help to refine and improve the suitability model
Regional Center Interactions (concl.)Regional Center Interactions (concl.)
Use modeled map to identify locations where field validation of estimated yield should be checked and verified
Use modeled map to assess field data quality (areas of strong disagreement may indicate unrepresentative data)
Incorporate mapped biomass estimates into regional center activities (e.g., POLYSYS, economic modeling, processing facility siting, etc.)
Provide GIS data sets that complement or improve gridded biomass estimates