Embed Size (px)
Citation preview

NREL is a national laboratory of the U.S. Department of Energy, Office of Energy Efficiency and Renewable Energy, operated by the Alliance for Sustainable Energy, LLC.
Western Wind & Solar Integration Studies
Kara Clark, Greg Brinkman, NREL Nick Miller, Miaolei Shao, Slobodan Pajic, Rob D’Aquila, Bruno Leonardi, GE
3/22/17

2
Western Wind & Solar Integration Study - Phase 1
wind
coal
nuclear
hydro Combined cycle
Gas turbine PV CSP
WWSIS 1: The worst week of three years
Can we integrate high penetrations of wind and solar (i.e. 35%) into the Western Interconnection? Yes, but….operational changes needed, such as increased balancing area cooperation, sub-hourly scheduling, access to under used transmission, use of wind and solar forecasts, etc

3
From a system perspective, cycling costs and emissions impacts of cycling are relatively small
Western Wind & Solar Integration Study - Phase 2
What is the impact of 33% wind and solar on the fossil fuel plant cycling and emissions?

4
How do high penetrations of inverter-based generation resources like wind and PV solar affect system reliability in the first minute after a large disturbance? • Examine Western Interconnection large scale
stability and frequency response with high wind and solar penetration
• Explore how power system reliability can be maintained by mitigating any adverse impact via advanced controls, transmission, storage, etc
Western Wind & Solar Integration Study - Phase 3

5
WECC-Wide Summary(1) Light Spring Base(2)
Light Spring High Mix
Light Spring Extreme Sensitivity
Wind (GW) 20.9 27.2 32.6
Utility-Scale PV (GW) 3.9 10.2 13.5
CSP (GW) 0.9 8.4 8.3
Distributed PV (GW) 0 7.0 10.4
Total (GW) = 25.7 52.8 64.8
Penetration(3) (%) = 21% 44% 53%
Wind 4.4
PV 3.7CSP 0.9DG 0.0
Others 19.9
Wind 8.4 PV 0.0
CSP 0.0DG 0.0
Others 14.6
Wind 2.5PV 0.0CSP 0.0DG 0.0Others
12.3
Wind 4.0 PV 0.2CSP 0.0DG 0.0
Others 24.9
Production/Dispatch in GW
Wind 4.7
PV 5.8CSP 1.5DG 3.7
Others 15.1
Wind 8.4
PV 0.3CSP 0.0DG 0.2
Others 11.7
Wind 5.3
PV 0.8CSP 0.0DG 0.4
Others 5.5
Wind 6.9
PV 3.3
CSP 7.0DG 2.6
Others 11.4
Production/Dispatch in GW
WWSIS 3 - Light Spring Load Study Scenarios Base Case High Mix Case
(1) Western Electricity Coordinating Council includes parts of Canada and Mexico, (2) Provided by WECC, (3) Penetration is % of total generation for this snapshot.

6
59.4
59.5
59.6
59.7
59.8
59.9
60
60.1
0 10 20 30 40 50 60
Freq
uenc
y (H
z)
Time (Seconds)
FrequencyMinimum or Nadir
Settling Frequency
First threshold for UFLS
NERC Frequency Stability Criteria NERC BAL-003-1* sets: Design-basis outage (2 Palo Verde units =~2750MW) Frequency response (FR) metric Interconnection frequency response obligation (IFRO, 840 MW/0.1Hz) Goals are: Meet IFRO (840 MW/0.1Hz) Avoid under-frequency load shedding (UFLS)
*http://www.nerc.com/pa/Stand/Project%20200712%20Frequency%20Response%20DL/BAL-003-1_clean_031213.pdf

7
WWSIS Phase 3 Frequency Response
Disturbance: Trip 2 Palo Verde units (~2,750MW)
3
2
Light Spring Base Light Spring High Mix Light Spring Extreme
2 3
1
1
Even at extreme levels of wind and solar, performance meets criteria. No under-frequency load shedding (UFLS). Interconnection frequency response > 840 MW/0.1Hz obligation in all cases.
Case FR (MW/0.1Hz)
Base 1352
High Mix 1311
Extreme 1055

8
Frequency Control on Wind Plants Improves Performance
Light Spring High Mix Light Spring High Mix with governor control* Light Spring High Mix with inertial control* Light Spring High Mix with both controls
Disturbance: Trip 2 Palo Verde units (~2,750MW)
40% of wind plants (i.e., new ones) had these controls, for a total of 300 MW initial curtailment out of 27GW production.
1 2 3
4
1
2
3 4
9
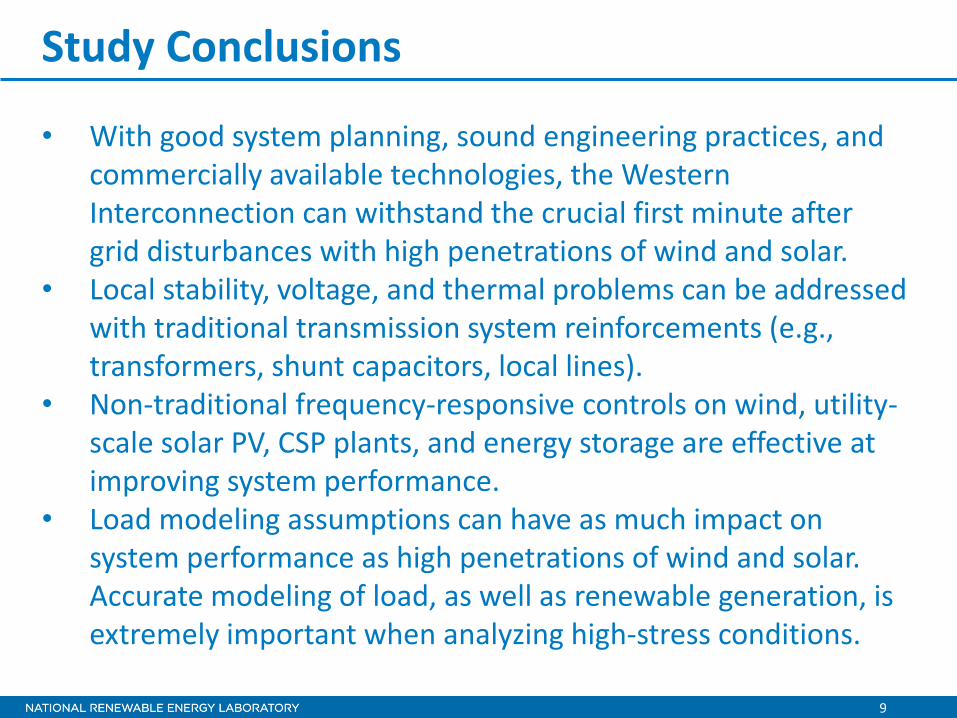
Study Conclusions
• With good system planning, sound engineering practices, and commercially available technologies, the Western Interconnection can withstand the crucial first minute after grid disturbances with high penetrations of wind and solar.
• Local stability, voltage, and thermal problems can be addressed with traditional transmission system reinforcements (e.g., transformers, shunt capacitors, local lines).
• Non-traditional frequency-responsive controls on wind, utility-scale solar PV, CSP plants, and energy storage are effective at improving system performance.
• Load modeling assumptions can have as much impact on system performance as high penetrations of wind and solar. Accurate modeling of load, as well as renewable generation, is extremely important when analyzing high-stress conditions.

10
Demonstration of Essential Reliability Services by a 300-MW Solar PV Power Plant
V. Gevorgian, NREL Clyde Loutan, Peter Klauer, Sirajul Chowdhury, Stephen Hall, CAISO Mahesh Morjaria, Vladimir Chadliev, Nick Milam, Christopher Milan, First Solar
http://www.caiso.com/Documents/UsingRenewablesToOperateLow-CarbonGrid.pdf

11
PV Power Plant Description • Thin-film Cd-Te PV modules • 4 MVA PV inverters • 9 x 40 MVA blocks • 34.5 kV collector system • Two 170 MVA transformers • Tie with 230 kV transmission line • PMUs collecting data on 230 kV side

12
• Remote testing from First Solar operations center in Tempe, AZ: o Supervision of testing activities o Tracking plant performance o Making changes in set points and plant control parameters
Testing Process
Tempe, AZ
San Bernardino County, CA

13
• 4-sec AGC signal provided to PPC
• 30 MW headroom • Tests were conducted at
three resource intensity conditions (20 minutes at each condition): o Sunrise o Middle of the day o Sunset
• 1-sec data collected by plant PPC
AGC Participation Tests
Morning
Midday

14
AGC Test Data Animation
30 MW
Afternoon AGC Test
AGC set point Measured

15
Typical Regulation-Up Accuracy of CAISO Conventional Generation
AGC Participation Tests- Summary
Time Frame Solar PV Plant Test Results
Sunrise 93.7%
Middle of the day 87.1%
Sunset 87.4%
Combined Cycle
Gas Turbine
Hydro Limited Energy Battery Resource
Pump Storage Turbine
Steam Turbine
Regulation- Up
Accuracy
46.88% 63.08% 46.67% 61.35% 45.31% 40%
Measured Regulation Accuracy by 300 MW PV Plant

16
Low Generation Reactive Power Control Test
• Plant was curtailed down to 5 MW output level
• Ability of the plant to produce or absorb VARs (±100 MVAR) was demonstrated
• True night VAR support will be demonstrated in future

17
• Advancements in smart inverter technology combined with advanced plant controls allow solar PV resources to provide regulation, voltage support, and frequency response during various modes of operations.
Conclusion

18
References
www.nrel.gov/electricity/transmission/western_wind.html “Western Wind and Solar Integration Study,” NREL report # SR-550-47434. “Western Wind and Solar Integration Study: Executive Summary,” NREL report # SR-550-47781. “Western Wind and Solar Integration Study Phase 2,” NREL Report # TP-5500-55588. “Western Wind and Solar Integration Study Phase 2: Executive Summary,” NREL report # TP-5500-58798. “Western Wind and Solar Integration Study Phase 3- Frequency Response and Transient Stability,” NREL report # SR-5D00-62906. “Western Wind and Solar Integration Study Phase 3- Frequency Response and Transient Stability: Executive Summary,” NREL report # SR-5D00-62906-ES. “WWSIS-3: Technical Overview” NREL fact sheet # FS-5D00-65410.