Embed Size (px)
Citation preview
Westminster, Colorado
June 12, 2012
2012 API Cooperative Testing Preliminary Report on Compressive
Strength
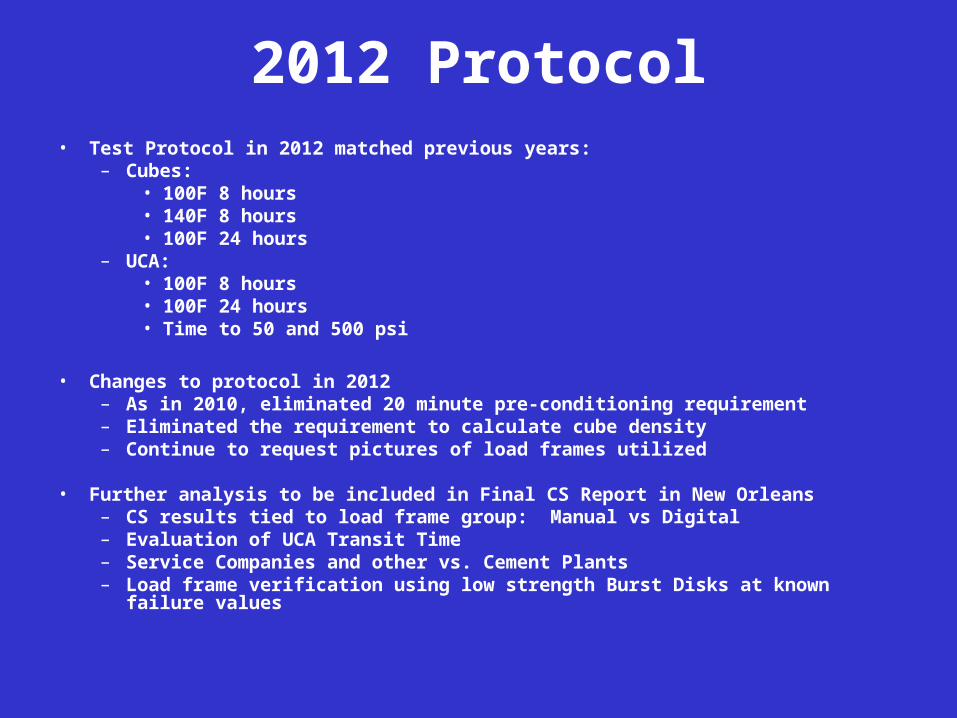
2012 Protocol• Test Protocol in 2012 matched previous years:
– Cubes:• 100F 8 hours• 140F 8 hours• 100F 24 hours
– UCA:• 100F 8 hours• 100F 24 hours• Time to 50 and 500 psi
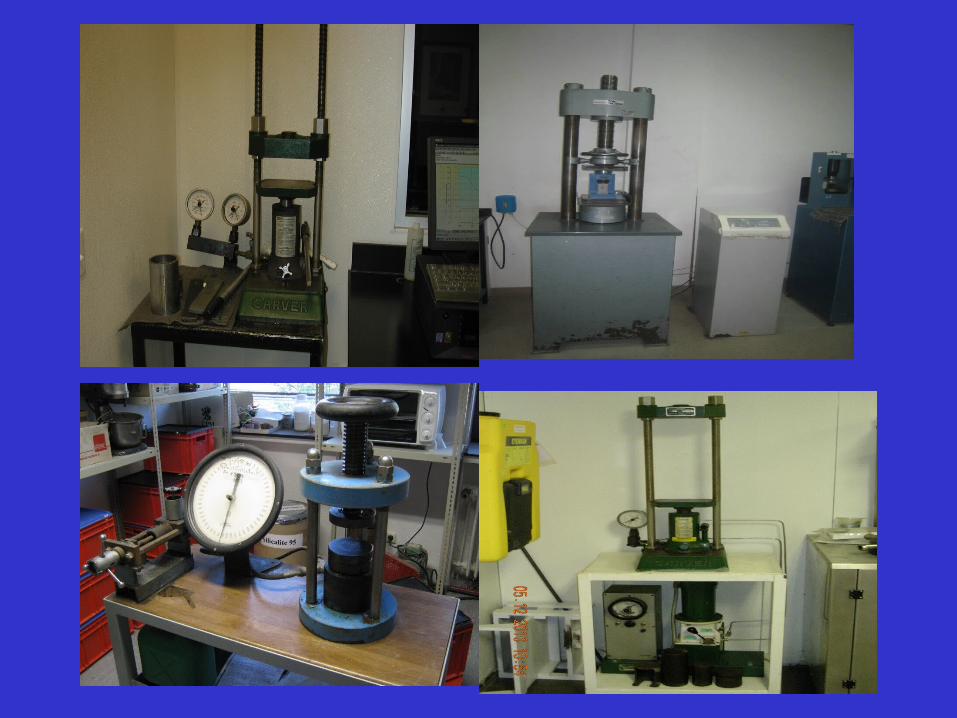
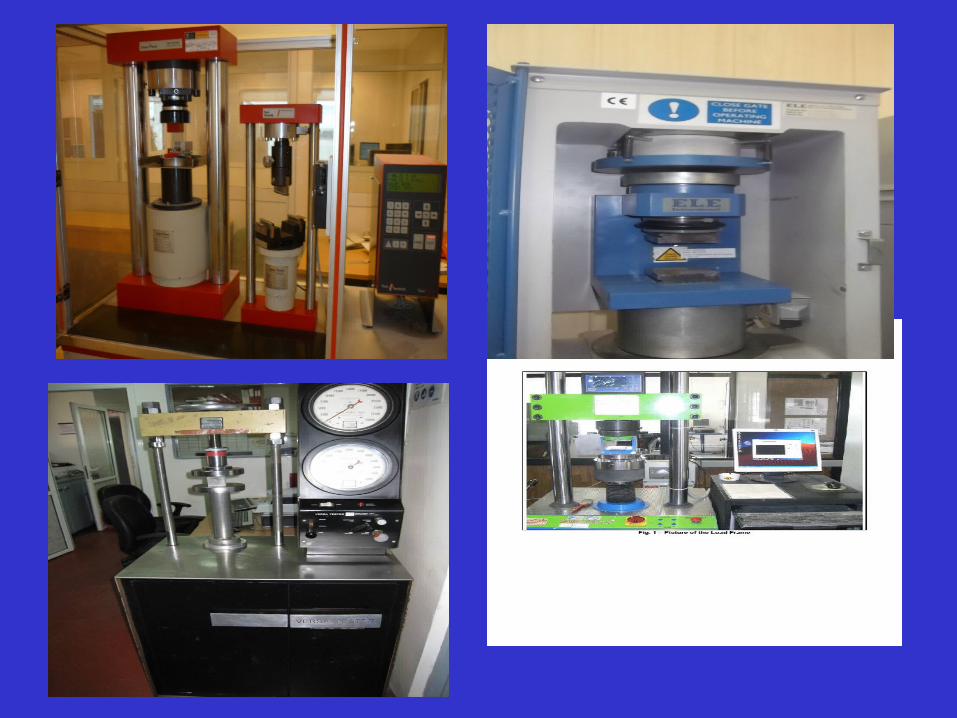
• Changes to protocol in 2012 – As in 2010, eliminated 20 minute pre-conditioning requirement– Eliminated the requirement to calculate cube density– Continue to request pictures of load frames utilized
• Further analysis to be included in Final CS Report in New Orleans – CS results tied to load frame group: Manual vs Digital– Evaluation of UCA Transit Time– Service Companies and other vs. Cement Plants– Load frame verification using low strength Burst Disks at known failure values
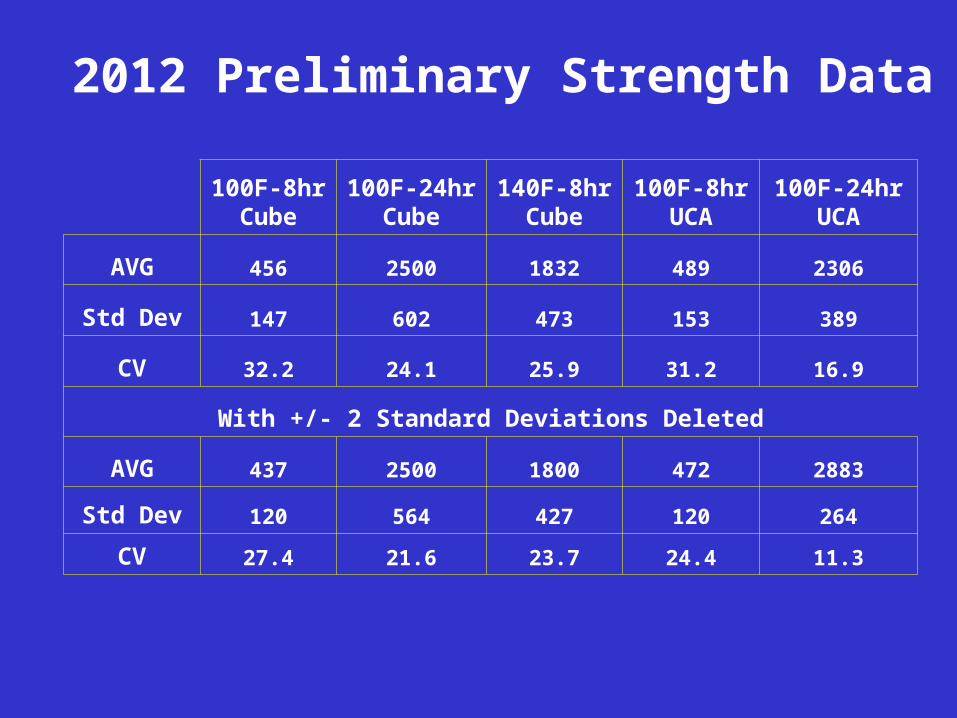
100F-8hr Cube
100F-24hr Cube
140F-8hr Cube
100F-8hr UCA
100F-24hr UCA
AVG 456 2500 1832 489 2306
Std Dev 147 602 473 153 389
CV 32.2 24.1 25.9 31.2 16.9
With +/- 2 Standard Deviations Deleted
AVG 437 2500 1800 472 2883
Std Dev 120 564 427 120 264
CV 27.4 21.6 23.7 24.4 11.3
2012 Preliminary Strength Data
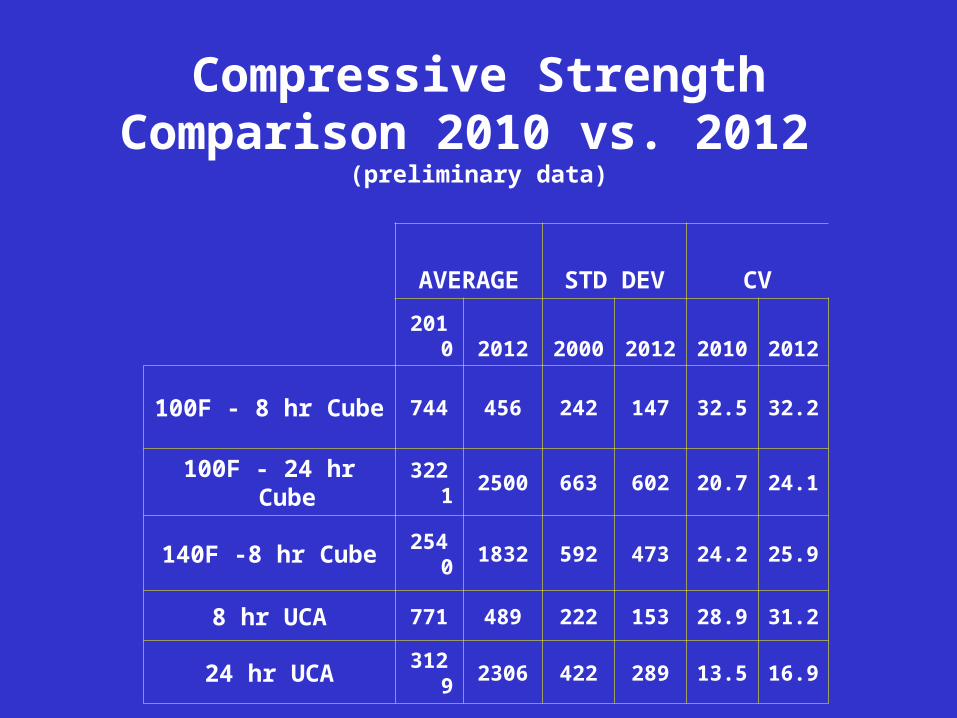
AVERAGE STD DEV CV
2010 2012 2000 2012 2010 2012
100F - 8 hr Cube 744 456 242 147 32.5 32.2
100F - 24 hr Cube 3221 2500 663 602 20.7 24.1
140F -8 hr Cube 2540 1832 592 473 24.2 25.9
8 hr UCA 771 489 222 153 28.9 31.2
24 hr UCA 3129 2306 422 289 13.5 16.9
Compressive Strength Comparison 2010 vs. 2012
(preliminary data)
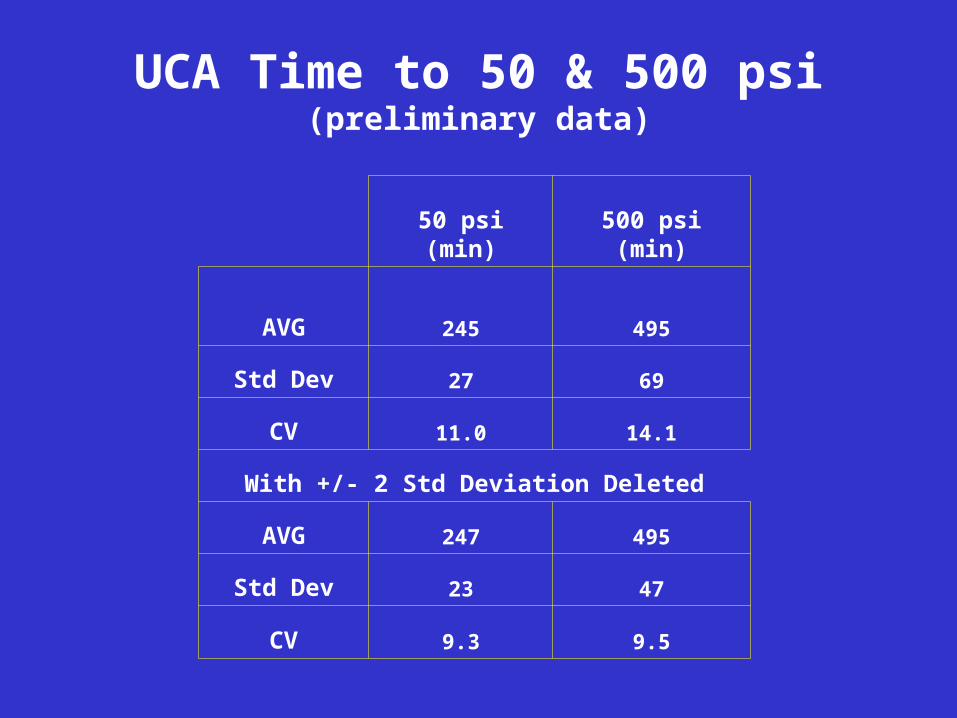
UCA Time to 50 & 500 psi(preliminary data)
50 psi(min)
500 psi(min)
AVG 245 495
Std Dev 27 69
CV 11.0 14.1
With +/- 2 Std Deviation Deleted
AVG 247 495
Std Dev 23 47
CV 9.3 9.5
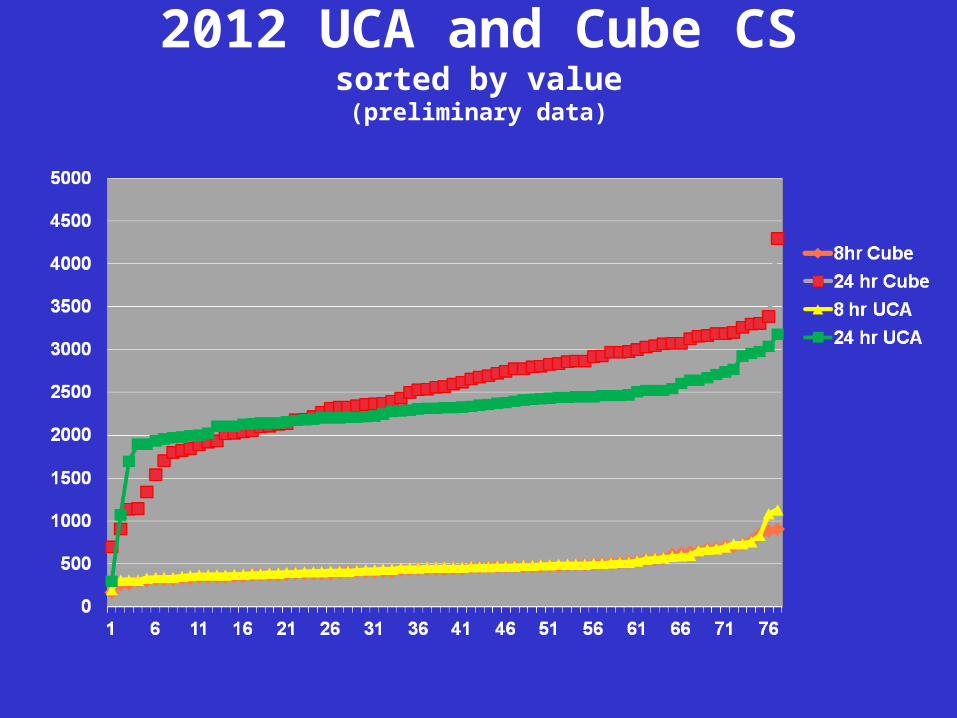
2012 UCA and Cube CSsorted by value
(preliminary data)
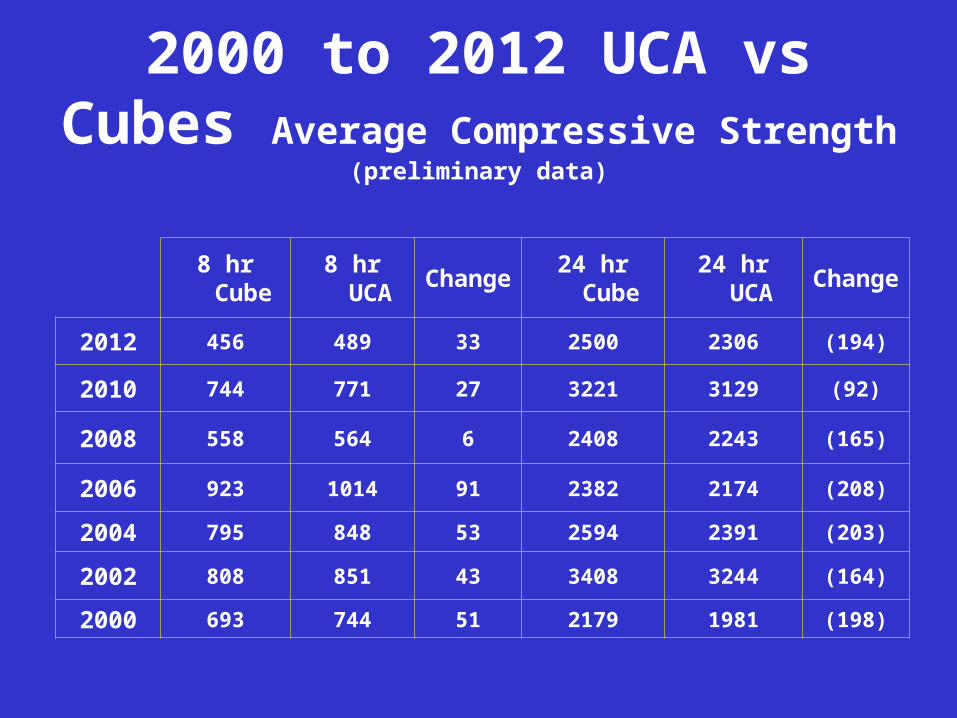
8 hr Cube 8 hr UCA Change 24 hr Cube 24 hr UCA Change
2012 456 489 33 2500 2306 (194)
2010 744 771 27 3221 3129 (92)
2008 558 564 6 2408 2243 (165)
2006 923 1014 91 2382 2174 (208)
2004 795 848 53 2594 2391 (203)
2002 808 851 43 3408 3244 (164)
2000 693 744 51 2179 1981 (198)
2000 to 2012 UCA vs Cubes Average Compressive Strength
(preliminary data)
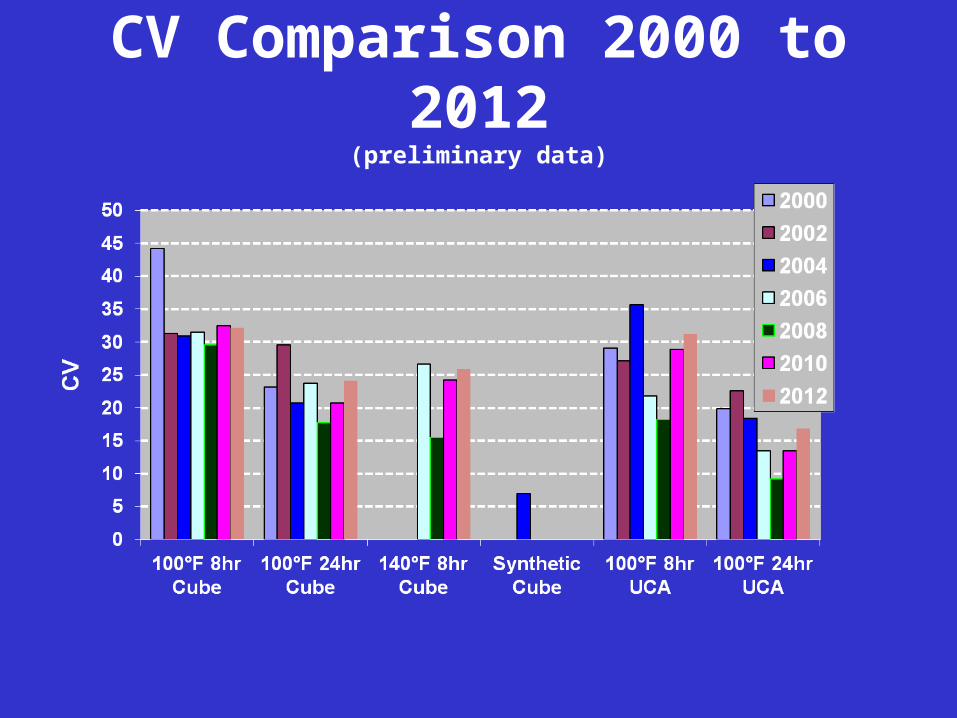
CV Comparison 2000 to 2012(preliminary data)
2012 Preliminary Conclusions
• High variability continues with 8 hr cube test.
• Initial CVs for all test categories continues to creep up.
• Historical relationships between cubes and UCA holds true.
• Good response to request for load frame pictures will permit further analysis.
• Let’s see what full data set reveals after more in depth analysis.

Thank you!
Comments and Questions?