Embed Size (px)
Citation preview
WET-NZ Multi-Mode Wave Energy Converter Advancement Project
DOE Award #: DE-EE0003642
Name of Recipient: Northwest Energy Innovations, LLC
Project Director/Principle Investigator:
Justin Klure [email protected] Steven Kopf [email protected]
Final Scientific Technical Report
Final Scientific Technical Report DE-EE0003642
2 | P a g e
CONTENTS 1. Executive Summary ............................................................................................................................... 3
2. Project Activities, Goals & Accomplishments ....................................................................................... 4
2.1. Wave Tank Testing to Characterize Hydrodynamic Characteristics ............................................. 5
New Float Design Confirmed ................................................................................................................ 5 Survival of 100 Year Storm Demonstrated ........................................................................................... 6
2.2. Open-Ocean Testing of a New 1:2 Scale Experimental Model ..................................................... 6
Performance Analysis ........................................................................................................................... 6 Regulatory Strategy .............................................................................................................................. 7
2.3. Synthesis and Analysis to Demonstrate and Confirm TRL 5/6 Status ........................................... 9
Design Evolution ................................................................................................................................... 9 Device Reliability ................................................................................................................................. 10 Deployment Protocols ........................................................................................................................ 11 Operations & Maintenance Protocols ................................................................................................ 12 Decommissioning Protocols ................................................................................................................ 13 TRL 5/6 Status Report ......................................................................................................................... 14 TRL 7/8 Program ................................................................................................................................. 15 Cost of Energy ..................................................................................................................................... 15
2.4. Market Impact & Competitor Analysis, Business Plan and Commercialization Strategy ........... 16
Product Strategy ................................................................................................................................. 17 Environmental Monitoring & Mitigation ............................................................................................ 17 Market Analysis ................................................................................................................................... 18 Competitive Analysis ........................................................................................................................... 20 Communications Plan ......................................................................................................................... 22
3. Products .............................................................................................................................................. 22
Networks or Collaborations ................................................................................................................ 22 Technologies ....................................................................................................................................... 22 Inventions, Patent Applications, and License Agreements................................................................. 22 Computer Modeling ............................................................................................................................ 22
GLOSSARY OF TERMS & ACRONYMS .......................................................................................................... 23
APPENDIX A – CONFERENCE PRESENTATION ............................................................................................. 29
APPENDIX B – NUMERICAL MODELING ...................................................................................................... 30
APPENDIX C – REGULATORY ROADMAP ..................................................................................................... 31
APPENDIX D – ADDITIONAL TECHNICAL INFORMATION ............................................................................ 32
APPENDIX E – PERFORMANCE SUMMARY .................................................................................................. 33
APPENDIX F – WAVE TANK TEST REPORT ................................................................................................... 34
Final Scientific Technical Report DE-EE0003642
3 | P a g e
Float PowerPod
Hull
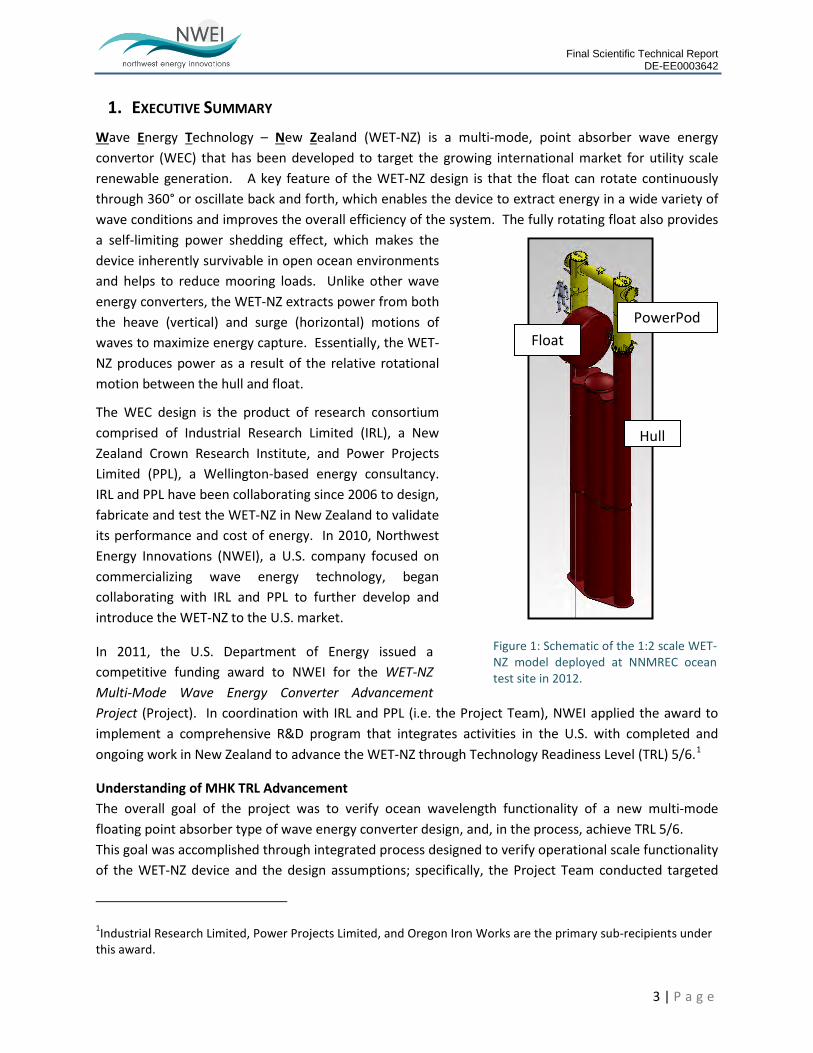
1. EXECUTIVE SUMMARY Wave Energy Technology – New Zealand (WET-NZ) is a multi-mode, point absorber wave energy convertor (WEC) that has been developed to target the growing international market for utility scale renewable generation. A key feature of the WET-NZ design is that the float can rotate continuously through 360° or oscillate back and forth, which enables the device to extract energy in a wide variety of wave conditions and improves the overall efficiency of the system. The fully rotating float also provides a self-limiting power shedding effect, which makes the device inherently survivable in open ocean environments and helps to reduce mooring loads. Unlike other wave energy converters, the WET-NZ extracts power from both the heave (vertical) and surge (horizontal) motions of waves to maximize energy capture. Essentially, the WET-NZ produces power as a result of the relative rotational motion between the hull and float.
The WEC design is the product of research consortium comprised of Industrial Research Limited (IRL), a New Zealand Crown Research Institute, and Power Projects Limited (PPL), a Wellington-based energy consultancy. IRL and PPL have been collaborating since 2006 to design, fabricate and test the WET-NZ in New Zealand to validate its performance and cost of energy. In 2010, Northwest Energy Innovations (NWEI), a U.S. company focused on commercializing wave energy technology, began collaborating with IRL and PPL to further develop and introduce the WET-NZ to the U.S. market.
In 2011, the U.S. Department of Energy issued a competitive funding award to NWEI for the WET-NZ Multi-Mode Wave Energy Converter Advancement Project (Project). In coordination with IRL and PPL (i.e. the Project Team), NWEI applied the award to implement a comprehensive R&D program that integrates activities in the U.S. with completed and ongoing work in New Zealand to advance the WET-NZ through Technology Readiness Level (TRL) 5/6.1
Understanding of MHK TRL Advancement The overall goal of the project was to verify ocean wavelength functionality of a new multi-mode floating point absorber type of wave energy converter design, and, in the process, achieve TRL 5/6. This goal was accomplished through integrated process designed to verify operational scale functionality of the WET-NZ device and the design assumptions; specifically, the Project Team conducted targeted
1Industrial Research Limited, Power Projects Limited, and Oregon Iron Works are the primary sub-recipients under this award.
Figure 1: Schematic of the 1:2 scale WET-NZ model deployed at NNMREC ocean test site in 2012.

Final Scientific Technical Report DE-EE0003642
4 | P a g e
hydrodynamic testing at wave tank scale and a controlled, open ocean deployment of a 2nd generation, ½ (1:2) scale experimental prototype. Experience gained from both the wave tank and open ocean testing has been and continues to be used to increase power output, reduce costs, and improve the durability and survivability of this innovative technology. In particular, this project provided energy capture performance data for improved Cost of Energy (COE) calculations and an improved understanding of the wave impedance matching ability of the WET-NZ design. Further, a thorough understanding of costs for competitive technologies and a strategy for commercial development of the WET-NZ technology in the US was developed.
Technical and Economic Methodology The technical effectiveness and economic feasibility of the project methods resulted in a successful open ocean deployment and subsequent cost of energy model inputs, and included precise methods of pre-design, tank testing, final assembly and deployment. Early planning, staying focused on critical performance attributes, and bringing in outside expertise are just a few of the key project takeaways that contributed to its success. The project relied on previous experience from other ocean projects and local supply chain providers to reduce cost and keep the project affordable.
Benefit to the Public The WET-NZ deployment was the first technology deployed at the Northwest National Marine Renewable Energy’s ocean test berth of the coast of Newport, OR. This project represents a major milestone for the U.S. Department of Energy and the industry as a whole. The public benefited from this program by its demonstration of a new technology that has the potential to develop clean, reliable electricity from a renewable energy resource. Specific benefits include: technology advancement and demonstration, 2) greater understanding of key performance variables and 3) development of best practices related to ocean deployment. The technology is now better positioned to attract funding for development of a full-scale pre-commercial prototype device.
Despite budget and schedule challenges associated with fabrication, permitting and deployment; these challenges did not impact the final project results as the project did not depart from the original planned methodology. By increasing the overall understanding of the marine and hydrokinetic (MHK) industry by progressing the WET-NZ design to TRL 5/6 status and a validating a numerical modeling tool to support scale-up of the design to commercial levels, the WET-NZ Multi-Mode Wave Energy Converter Advancement Project represents a major milestone for the MHK industry in the U.S. Ultimately, this project has helped advance MHK development and support the U.S. Department of Energy’s mission and objective to accelerate development of clean, affordable energy generation that is economically viable and environmentally responsible.
2. PROJECT ACTIVITIES, GOALS & ACCOMPLISHMENTS The overall objective of the project was to verify the ocean wavelength functionality of the WET-NZ through targeted hydrodynamic testing at wave tank scale and controlled open sea deployment of a 1/2 scale (1:2) experimental device. This objective was accomplished through a series of tasks designed to achieve four specific goals:
Final Scientific Technical Report DE-EE0003642
5 | P a g e
Wave Tank Testing to Characterize Hydrodynamic Characteristics Open-Sea Testing of a New 1:2 Scale Experimental Model Synthesis and Analysis to Demonstrate and Confirm TRL5/6 Status Market Impact & Competitor Analysis, Business Plan and Commercialization Strategy
The sections that follow summarize the activities performed in conjunction with each of the overall project goals. Each section describes the tasks performed to achieve each of these goals, results and key outcomes, and compares actual accomplishments with the project objectives. Budget and schedule issues were encountered in association with fabrication, permitting and deployment; however, they did not impact the final project results the project, nor force depart from original planned methodology.
2.1. WAVE TANK TESTING TO CHARACTERIZE HYDRODYNAMIC CHARACTERISTICS
To further verify ocean wavelength performance for the WET-NZ device, NWEI partnered with Northwest National Marine Renewable Energy Center (NNMREC) at Oregon State University (OSU) to conduct a series of wave tank tests at the OSU Tsunami Wave Basin, the largest wave tank in North America. In fall 2011, the Project Team designed and fabricated a 1:30 scale model of the WET-NZ device, and targeted hydrodynamic tests were successfully performed in the Tsunami Basin wave tank. The specific objectives of the wave tank testing were to:
Improve the understanding of the interaction between the coupled bodies; Determine the impedance matching ability (active and reactive) of the design over the
normal range of ocean wavelengths; Assess directional performance and impact of the planned mooring restraints; Finalize design shapes (mass distribution and ratios, surface profiles); and Test the proposed mooring and foundation designs; and determine the design efficiency.
These objectives were met successfully, and the results and data analysis focused on the characterizing and optimizing the hydrodynamic attributes of the WET-NZ. Key outcomes of the wave tank testing, including the goals and objectives listed above, are described below.
New Float Design Confirmed
As part of the Performance Analysis component of the Project (Task 2.15), wave tank tests were conducted on a 1:30 scale model of the WET-NZ to improve the understanding of the interaction between the coupled bodies (i.e., hull and float). To maximize the torque arm, the original float had evolved to a wedge shape; however, a wedge is not a very smooth hydrodynamic shape. Although no hydrodynamic measurements had been made to evaluate this aspect prior to this Project, observations from early deployments in New Zealand showed that there was a lot of turbulence and splash associated with the wedge float motion. Results of the wave tank testing showed power output improvements from a cylindrical design in various wave conditions. Based on these results, an eccentric drum shape was developed as an alternative for the 2nd generation, 1:2 scale device, with the aim to evaluate whether an increased volume/weight and improved hydrodynamics provided an overall net benefit at this scale. By providing the information needed to finalize the design shapes (mass
Final Scientific Technical Report DE-EE0003642
6 | P a g e
distribution and ratios, surface profiles), results and analysis of the wave tank tests enabled the Project Team to confirm the new float shape and optimize the device for the ocean testing at NNMREC.
Further detail is provided in Section 1 of Appendix D and in Appendix E.
Survival of 100 Year Storm Demonstrated
In addition to demonstrating the survivability and confirming the float design, the main outcome of this testing was an improved understanding of the wave impedance matching ability of the WET-NZ technology. In particular, these tests enabled the Project Team to determine the impedance matching ability (active and reactive) of the design over the normal range of ocean wavelengths, assess directional performance and impact of the planned mooring restraints, test the preliminary mooring and foundation designs, and demonstrate survival of a 100 year storm.
Further detail is provided in Section 20 of Appendix E.
2.2. OPEN-OCEAN TESTING OF A NEW 1:2 SCALE EXPERIMENTAL MODEL
Open ocean testing of a 1:2 (half) scale device was successfully carried out at the NNMREC test site off the Oregon coast from August - October 2012. The specific objectives of this deployment were to:
Obtain performance data in a range of sea states (both in and out of band), in relation to both the PTO and hydrodynamic efficiency;
Test the effectiveness of the mooring design; Determine the design efficiency and impedance matching of the current (un-optimized)
experimental model shape; Demonstrate controllability and efficiency of the PTO drive train in irregular sea states; and Test latching and other control algorithms designed to improve the energy capture.
All goals and objectives for the open ocean testing were met, including: fabrication of the 2nd generation, 1:2 scale device; final assembly; permits/authorizations secured; device deployed in open-ocean; and successful retrieval and decommissioning of the device. Key outcomes of the open ocean testing, including the objectives listed above, are described below. Final reports providing detailed analysis and discussion of each task summarized here have been prepared and submitted to DOE.
Appendix D provides more detail on each of the main tasks associated with design, fabrication, deployment, and testing of the WET-NZ.
Performance Analysis
The first WEC to be deployed at NNMREC’s ocean test site off the coast of Newport, Oregon, the WET-NZ device was successfully tested off the coast of Oregon from August – October 2012. The device was operational continuously throughout the deployment, during which time it was connected to NNMREC’s Ocean Sentinel instrumentation buoy for performance monitoring and power dissipation. The 1:2 scale device was operational continuously over the six week deployment duration, and the general performance of the device under varying sea conditions was very close to expectations. On board
Final Scientific Technical Report DE-EE0003642
7 | P a g e
sensor data was collected at a 10 Hz data rate for 50 days, and retrieved after removal and decommissioning. Over 20 GB of performance data was collected, and this high resolution operational information is being used to further characterize the WET-NZ design.
The general operation of the device under varying sea conditions was very close to expectations. Some issues associated with the engineering solutions chosen for device operation at 1:2-scale were discovered during the deployment, which provided valuable information for addressing those design and engineering issues in future stages of development. Detailed results from the ocean deployment, including a summary of deployment activities, device performance, and wave conditions under which the ocean testing was conducted have been documented. Overall, the project team was very satisfied with the results and successful accomplishment of the project objectives. In particular, the ocean deployment successfully demonstrated that the WET-NZ device is capable of continuous electricity generation and confirmed that the design can survive relatively heavy seas. Performance data from this deployment will continue to be analyzed and used to inform the next stage of the WET-NZ design.
Regulatory Strategy
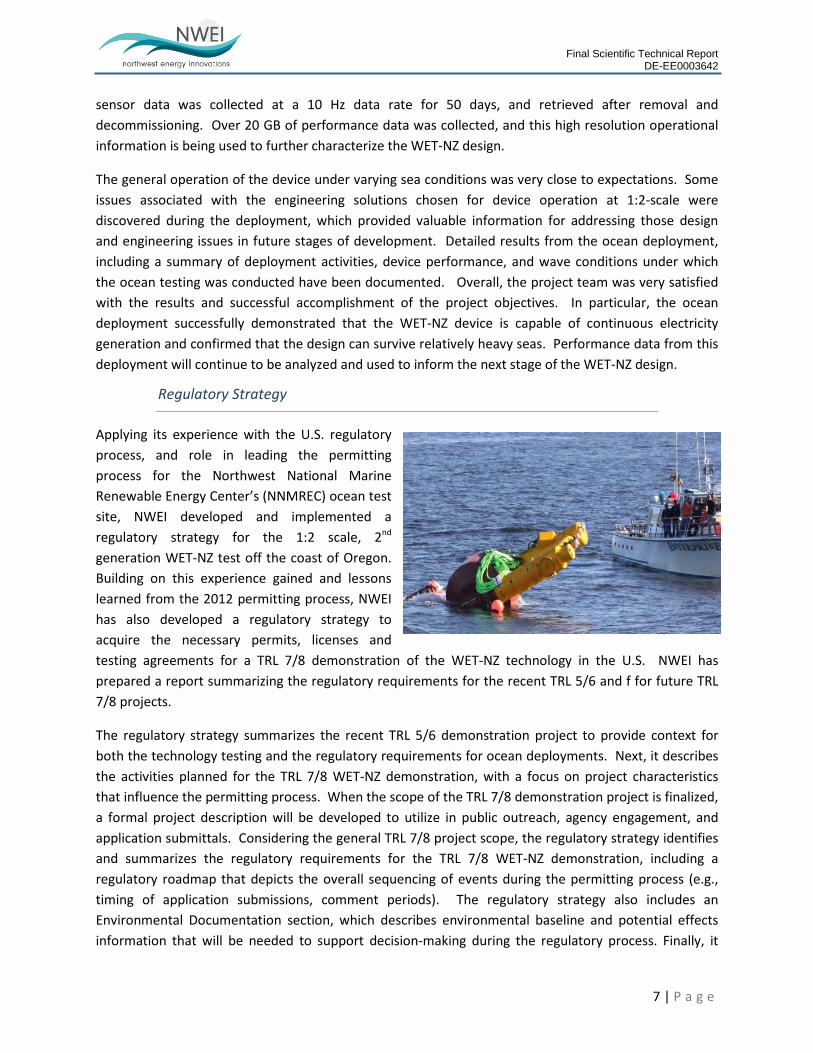
Applying its experience with the U.S. regulatory process, and role in leading the permitting process for the Northwest National Marine Renewable Energy Center’s (NNMREC) ocean test site, NWEI developed and implemented a regulatory strategy for the 1:2 scale, 2nd generation WET-NZ test off the coast of Oregon. Building on this experience gained and lessons learned from the 2012 permitting process, NWEI has also developed a regulatory strategy to acquire the necessary permits, licenses and testing agreements for a TRL 7/8 demonstration of the WET-NZ technology in the U.S. NWEI has prepared a report summarizing the regulatory requirements for the recent TRL 5/6 and f for future TRL 7/8 projects.
The regulatory strategy summarizes the recent TRL 5/6 demonstration project to provide context for both the technology testing and the regulatory requirements for ocean deployments. Next, it describes the activities planned for the TRL 7/8 WET-NZ demonstration, with a focus on project characteristics that influence the permitting process. When the scope of the TRL 7/8 demonstration project is finalized, a formal project description will be developed to utilize in public outreach, agency engagement, and application submittals. Considering the general TRL 7/8 project scope, the regulatory strategy identifies and summarizes the regulatory requirements for the TRL 7/8 WET-NZ demonstration, including a regulatory roadmap that depicts the overall sequencing of events during the permitting process (e.g., timing of application submissions, comment periods). The regulatory strategy also includes an Environmental Documentation section, which describes environmental baseline and potential effects information that will be needed to support decision-making during the regulatory process. Finally, it

Final Scientific Technical Report DE-EE0003642
8 | P a g e
provides an Outreach Plan for the TRL 7/8 demonstration project, including public outreach and agency engagement.
The ½ scale WET-NZ was the first device to be deployed at the NNMREC ocean test site, and part of the U.S. Department of Energy (DOE) funding for the 10-year test center was used to support the 2012 testing. Therefore, the WET-NZ deployment was considered part of the DOE “proposed action” for which compliance with the National Environmental Policy Act (NEPA) was required. In addition, deployment of both the WET-NZ device and NNMREC’s Ocean Sentinel instrumentation buoy required the same state and federal authorizations. As such, the scope of the regulatory process included the deployment of both the WET-NZ and the Ocean Sentinel at the NNMREC ocean test site. A list of authorizations obtained in the regulatory process is shown in the table below, along with the agencies involved in the review and approval of the project.
Table 1 1: Authorizations for TRL 5/6 Demonstration
Authorization Agency
National Environmental Policy Act Documentation U.S. Department of Energy
Nationwide Permit #5 U.S. Army Corps of Engineers
Endangered Species Act Consultation U.S. Fish and Wildlife Service
National Marine Fisheries Service Marine Mammal Protection Act Consultation
Essential Fish Habitat Assessment
Removal/Fill Permit – No State Permit Needed Letter Oregon Department of State Lands
Temporary Use Authorization
National Historic Preservation Act Compliance State Historic Preservation Office – Oregon Parks & Recreation Department
Coastal Zone Management Act Consistency Determination
Oregon Department of Land Conservation and Development
Water Quality Certification Oregon Department of Environmental Quality
Private Aids to Navigation Permit U. S. Coast Guard
Local Land Use Compatibility Statement Lincoln County Planning Commission
Final Scientific Technical Report DE-EE0003642
9 | P a g e
In addition to the NEPA environmental documentation and analysis for the project, NWEI worked closely with the agencies to develop monitoring and adaptive management plans to detect and mitigate any potential effects. NWEI and the agencies collaborated to develop both an Adaptive Mitigation Plan (AMP) for the 2012 WET-NZ/Ocean Sentinel test and an Adaptive Management Framework (AMF) for the test center as a whole.2 Prior to the August 2012 deployment, researchers at Oregon State University conducted baseline studies at the NNMREC ocean test site to understand and measure the existing environmental conditions. Once the WET-NZ and Ocean Sentinel were installed, the researchers conducted post-deployment monitoring to detect and measure any potential impacts of the project. The monitoring studies focused on benthic habitat, acoustics, electromagnetic fields (EMF), entangled or injured species, and derelict gear. In accordance with the AMP, scientists at NNMREC reviewed the post-installation monitoring results to ensure effect thresholds were not exceeded.
2.3. SYNTHESIS AND ANALYSIS TO DEMONSTRATE AND CONFIRM TRL 5/6 STATUS
The primary goal of the synthesis and analysis is to demonstrate and confirm TRL 5/6 status; specific objectives include the following:
Demonstrate a mature and well-understood design concept.
Quantify system reliability and survivability to minimize mean time between failures (MTBF).
Develop deployment equipment, strategies and protocols to facilitate deployment/recovery and minimize mean time to repair (MTTR).
Quantify the technical and economic viability of the system.
Key outcomes of the synthesis and analysis for TRL 5/6 status demonstration, including the objectives listed above, are described below. The final reports prepared under these tasks and submitted to DOE provide detailed analysis and discussion of all the topic areas summarized here.
Design Evolution
The design evolution analysis provides documentation of the WET-NZ design evolution from initial concept in 2004 to TRL 5/6 in 2012, including the R&D activities conducted under this project. Specifically, it documents the progression of the WET-NZ design from initial concept in 2004 to present status, linking the early development activities to the results of this project. The WET-NZ Consortium initiated the wave energy converter R&D program in July 2004. Numerical models were initially based on small-scale experiments with the coupled two body device concept at approximately 1:100 scale, in conjunction with a mathematical analysis of the mechanical concept operating in a free surface wave environment. These initial computer models were used to develop the design of a larger experimental model (the “goal post” design) that could be moved by truck and would deliver measurable power from an engineered Power Take Off (PTO) system. This goal post model was estimated at the time to be
2 The Adaptive Management Framework and Adaptive Mitigation Plan are included as Appendix D to the EA, available at http://energy.gov/sites/prod/files/EA-1917-FEA-Appendix%20D_AMF-2012.pdf
Final Scientific Technical Report DE-EE0003642
10 | P a g e
approximately 1:5-scale, and it was intended for short-term deployments in a near-shore ocean wave environment.
A number of different floats were evaluated in the 1:5 model tests. This approach proved to be very effective, and the bodies were robust enough to survive multiple deployments. The PTO system also progressed, advancing from simple hydraulic flow restrictors to a small direct drive hydraulic motor (DC generator system). Results of the experimental model testing were progressively applied to refine and extend the computer model as well. The 1:5-scale experimental platform proved successful in demonstrating the operating principle; after the device broke apart during a series of storms, a slightly larger (1:4 scale), more robust test unit that could be deployed for longer periods of time as constructed. Instrumentation and data loggers, as well as data communication systems, were installed in the 1:4 scale model, known as the Pre Seed Accelerator Fund (PSAF) device (named after the funding mechanism which was used in its construction). The PSAF prototype was an aluminum device constructed for more permanent moored near-shore experimental research. Because it was slightly larger than the Goalpost structure, it was more responsive to short fetch waves (with Tz up to 6 seconds) created by coastal winds.
The first generation 1:2 scale WET-NZ device, named after the Marine Energy Deployment Fund (MEDF) award that was used to support the project, was constructed in 2010. The MEDF device was first deployed for ocean testing in off the coast of Canterbury NZ in 2011, followed by another ocean deployment off the coast of Wellington, NZ in 2012. Results and analysis of these deployments, as well as the previous experimental tests and computer modeling, were used to develop the R&D program implemented under this project. A primary objective was to verify ocean wavelength functionality of the WET-NZ design. To that end, the first major activity conducted under this project was wave tank testing of a 1:30 scale WET-NZ model at Oregon State University’s (OSU) Tsunami Wave Basin in fall 2011. Two float shapes were evaluated in the tank tests; although they provided similar performance, the cylindrical shape was chosen for ocean testing.
In conjunction with the wave tank testing, this project also involved designing the second generation 1:2 scale WET-NZ device to be tested in the U.S. Results of the wave tank tests, along with findings from the MEDF ocean deployments in NZ, were utilized to optimize the construction and design of the 2nd generation, 1:2 scale WET-NZ device. In addition to demonstrating the survivability of the design, the main outcome of this testing was an improved understanding of the wave impedance matching ability of the WET-NZ technology. Results and analysis from these activities are now being utilized to address specific areas for design revision and further development. Overall, the project was successful in demonstrating that the WET-NZ is capable of continuous electricity generation and able to survive relatively heavy seas. The WET-NZ design has achieved or exceeded Technology Readiness Level (TRL) 5/6 and is well positioned to complete its progression to commercial scale.
Device Reliability
Device reliability, including performance output, risk identification, and strategies to increase reliability and reduce O&M costs. The scope of this task was primarily focused on device design (i.e., hull,
Final Scientific Technical Report DE-EE0003642
11 | P a g e
powerpod and float); as such, it does not directly consider design of related equipment, such as moorings systems or umbilical cable, which will be developed as part of wave farm design, involving arrays of devices. As part of this task, the Project Team reviewed and analyzed the outcomes of the Det Norske Veritas (DNV) design feasibility process conducted for the 1:2 WET-NZ design, as well as experience gathered from the NZ and US 1:2 scale device deployments.
As part of the DNV managed design feasibility process, technology assessment, failure mode identification and risk ranking analysis was performed for the 1:2 scale design, and a Statement of Design Feasibility (SoDF) was awarded for the WET-NZ in November 2010. While it is unusual for a design certification process to be undertaken on a scale model at pre-TRL 5/6 status, the configuration of the PTO design was unlikely to change and there was a requirement for at least a one year deployment at the 1:2 scale; therefore, it was considered to be worthwhile to conduct design feasibility at that stage. Results of the DNV design feasibility process have been fully documented and will be utilized to provide insight for the design certification process to be conducted for commercial scale WET-NZ device. Three key documents were created under the SoDF process to characterize the 1:2 scale WET-NZ device:
I. WEC Definition of Certification Basis – Operating Specification
II. WEC Components and Functions - Block Diagram
III. Phases and Activities - Product Development Processes
In the technology assessment portion of the SoDF process, every technology component is classified as either proven or new, and the main challenges and uncertainties related to the new technology are identified. The next step in the process is to select qualification methods that adequately address the identified failure modes of concern with respect to reducing uncertainties. The qualification methods, in most cases, include technical analyses, testing or combinations of the two where the purpose of the testing is to reduce uncertainty in the analysis model or calibrate it.
A risk identification and effects analysis register for the TRL 5/6 (1:2 scale) WET-NZ device was also compiled. This register uses DNV’s Failure Mode Effects Analysis (FMEA) guidelines to identify potential risks associated with the 1:2 scale design. Risks that may be experienced were also forecast, along with a strategy aimed at reducing the cost in commercialization of the technology.
Deployment Protocols
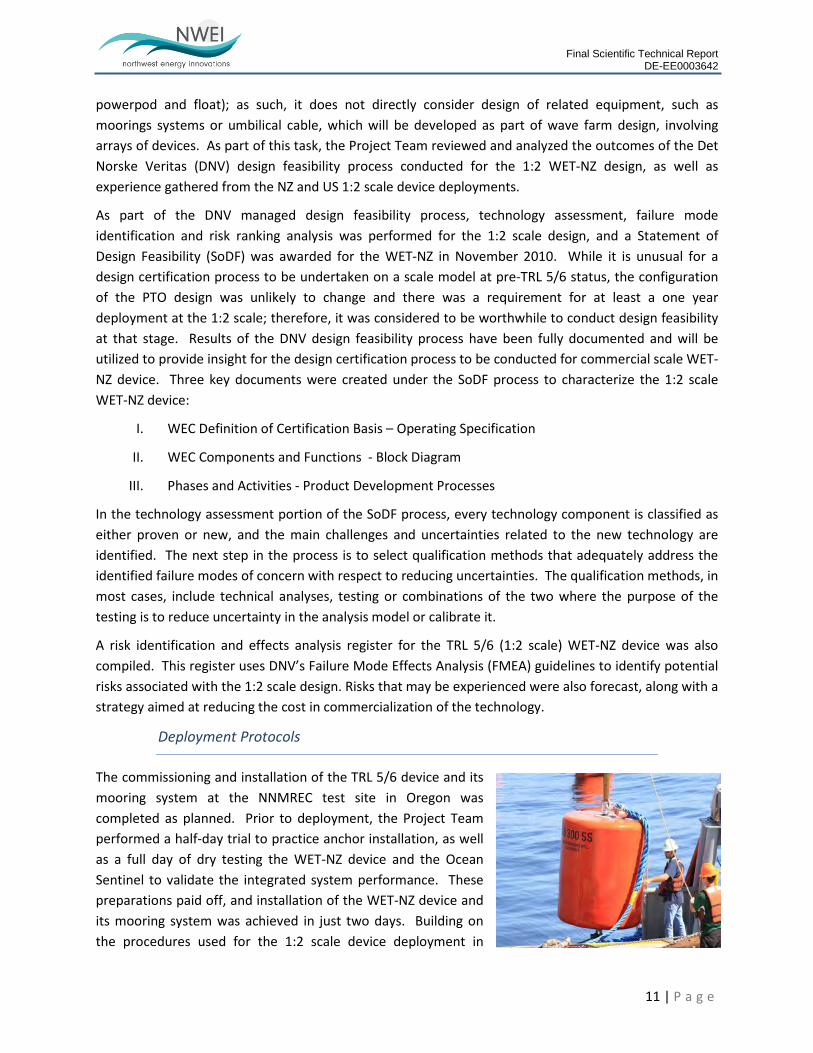
The commissioning and installation of the TRL 5/6 device and its mooring system at the NNMREC test site in Oregon was completed as planned. Prior to deployment, the Project Team performed a half-day trial to practice anchor installation, as well as a full day of dry testing the WET-NZ device and the Ocean Sentinel to validate the integrated system performance. These preparations paid off, and installation of the WET-NZ device and its mooring system was achieved in just two days. Building on the procedures used for the 1:2 scale device deployment in
Final Scientific Technical Report DE-EE0003642
12 | P a g e
Oregon while considering the obvious scaling up of operations, the Project Team developed draft protocols for the deployment of a single TRL 7/8 device. These protocols identify and describe the main factors in deployment, including:
Pre-deployment tests (pre-assembly, dry dock and dockside testing) Installation of Aids to Navigation Installation of upstream anchors and moorings Transport of device to site Connection of device to upstream moorings and tensioning of lines Ballasting of device Connection of downstream mooring lines to device Installation of downstream anchors and moorings and tensioning of lines Connection of electrical export Systems testing
A Risk Register was also developed to identify potential risks to the successful performance, safety, budget and scheduling of deployment activities, as well as ways these risks can be mitigated. Like the draft deployment protocols, the Risk Register draws heavily on the experience gained from the 2nd generations, 1:2 scale WET-NZ deployment in Oregon, and it will also be expanded following the availability of further technology design information and test site details. This risk register identifies the following factors as having the potential to negatively impact deployment activities:
Project Planning Weather and Metocean Conditions Vessel Suitability and Availability Pre-Deployment Testing Mooring and Ballast System Design Anchor Positioning and Specification
Operations & Maintenance Protocols
As with the deployment protocols, the Project Team developed draft protocols to serve as the foundation for operation and maintenance procedures for a single, pre-commercial (TRL 7/8) WET-NZ device and its associated equipment. These draft protocols are based upon experience gained from ocean testing of the 1:5, 1:4 and 1:2 scale devices in New Zealand and the 1:2 device in Oregon, as well as the preliminary TRL 7/8 device design. The final protocols will be dependent on the TRL 7/8 project objectives, the detailed design of the TRL 7/8 device, and the test site location. On the provision of all of these details, a final Operations and Maintenance Plan can be developed, which will include:
A description of the test site, the onshore facilities and the equipment that will be installed A description of the parties involved with operating and maintaining the equipment, what
their roles and responsibilities are and their relevant qualifications and certifications Method statements for the procedures associated with the ongoing operation and
maintenance of all equipment to be installed Risk Assessments
Final Scientific Technical Report DE-EE0003642
13 | P a g e
Reference to the Health and Safety Plan (HSE Plan) Reference to the Emergency Response Plan (ERP) Reference to the Environmental Monitoring Plan (EMP) A schedule of inspections, their frequency and duration, with reference to the EMP. A maintenance schedule outlining planned maintenance work to be carried out during the
deployment A description of documentary control and record keeping. This includes all maintenance
records and review of the OMP itself
Detailed design work is required to carry out a Failure Mode Effect Analysis (FMEA) of the TRL 7/8 device, which will provide a clear understanding of failure sensitive components, criticality of the failure of specific components and known frequencies of failure. The results of the FMEA will then be used to identify maintenance tasks required for each component, necessary resources, methods and techniques that should be used, frequency of maintenance required and what working conditions are required. Maintenance requirements will be considered when establishing the frequency of site inspections.
Decommissioning Protocols
Experience gained from the deployments of the 1st and 2nd generation 1:2-scale WET-NZ devices in New Zealand and Oregon, respectively, will inform the eventual deployment of a full-scale WET-NZ device (i.e., at TRL 7/8 level) and, in due course, commercial deployments. To that end, the Project Team prepared Decommissioning Protocols, which are based upon the deployment of the 1:2 scale WET-NZ device at the NNMREC test site off the coast of Oregon, as well as similar deployment and decommissioning experience with the 1st generation, 1:2 scale device off the coast of Wellington. In particular, the Decommissioning Plan developed and implemented for the ocean testing at NNMREC was used to inform the Deployment Protocols.
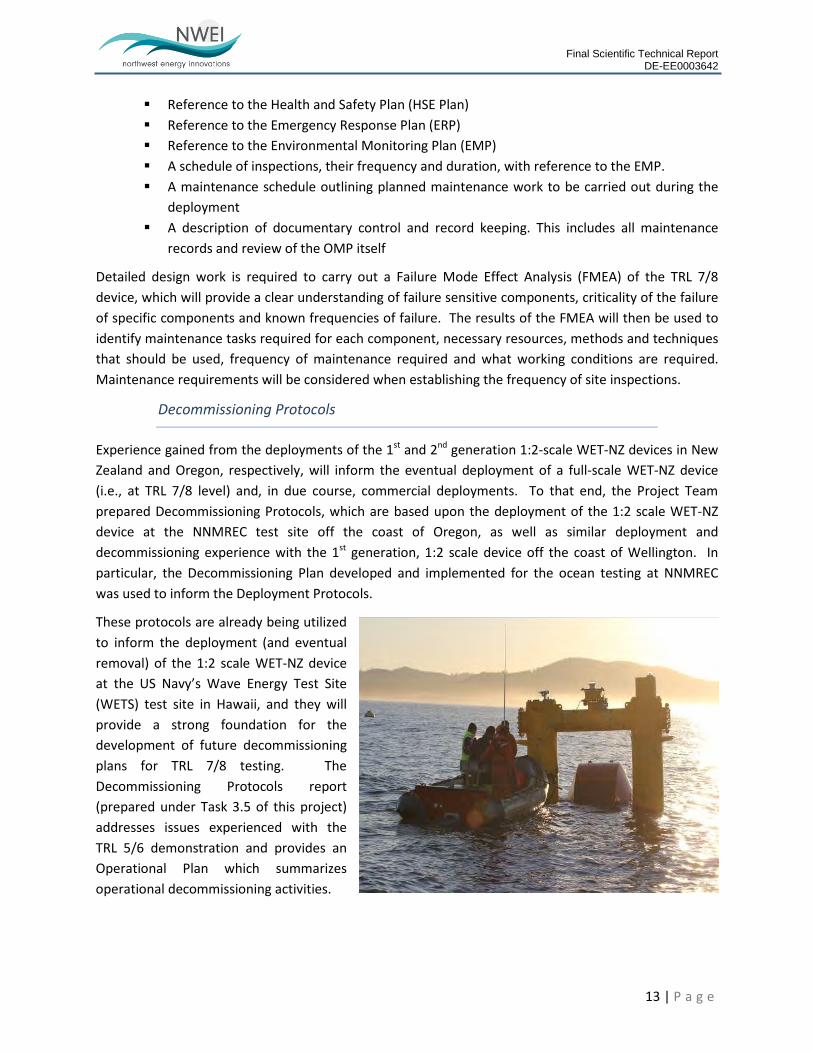
These protocols are already being utilized to inform the deployment (and eventual removal) of the 1:2 scale WET-NZ device at the US Navy’s Wave Energy Test Site (WETS) test site in Hawaii, and they will provide a strong foundation for the development of future decommissioning plans for TRL 7/8 testing. The Decommissioning Protocols report (prepared under Task 3.5 of this project) addresses issues experienced with the TRL 5/6 demonstration and provides an Operational Plan which summarizes operational decommissioning activities.
Final Scientific Technical Report DE-EE0003642
14 | P a g e
Finally, the Decommissioning Protocols include recommendations for decommissioning a full-scale WET-NZ device in the future, with identification of current gaps. Collectively, these protocols will be used to develop specific decommissioning plans for the full-scale device (i.e., a TRL 7/8 deployment).
TRL 5/6 Status Report
Before submitting a proposal for the 2010 FOA from DOE, NWEI, in coordination with PPL and IRL, determined that the WET-NZ design had achieved TRL 4 status and some aspects of TRL 5. The development of WEC devices of increasing scale and size, as well as longer deployment periods, provided encouragement for continued R&D. Funding was therefore sought to advance the WET-NZ to TRL levels 5 and 6 through this DOE-funded project. The project proposal entailed tank testing 1:30-scale model devices and the building and deployment of a 1:2 scale device (similar to one already built and operating in New Zealand).
A TRL 5/6 Status report summarizes the work undertaken between September 2010, when NWEI was notified of the successful award of funding, and the end of 2012, including the 45-day deployment of the 1:2 scale device at the NNMREC test site off the coast of Oregon. Prior to the ocean testing, wave tank testing was undertaken at the O.H. Hinsdale facility at Oregon State University in Corvallis, Oregon. This work was overdue but could not have been undertaken in New Zealand, which lacks any significant tank testing facilities. The tank testing program was carefully designed and undertaken over a 9-day period. The modeling work was undertaken to quantify assumptions in numerical simulations already undertaken by WET-NZ, provide insight into the dynamic response of the device in real sea states, and examine 3D interactions with complex wave fields and different modeled sea states.
A wide range of tests were undertaken and experiments were conducted with new float designs, which could not easily have been undertaken at full scale and modifications to the hull shape. The final tests on survivability of the device model were encouraging. The testing results confirmed that the WET-NZ device performed to expectations across a wide range of sea states, numerical model inputs and assumptions were verified and some potential device design modifications were identified.
Open sea testing at the NNMREC test site was undertaken for 45 days from 22 August to 5 October 2012. The 2nd generation, 1:2 scale device tested in Oregon differed from the 1st generation 1:2 scale device tested in New Zealand because it had a significantly modified float design, upgraded measurement and monitoring capabilities and a 3-point mooring system that used different materials from the 4-point NZ mooring system. Most importantly, the Oregon device was connected to OSU’s Ocean Sentinel, which provided a load bank to dissipate power and instrumentation to record device performance and environmental data.
Collectively, the tank testing and the open sea testing data confirmed the performance of a 1:2 scale prototype WET-NZ device in a relevant ocean environment. Deployment, decommissioning and recovery were all successfully carried out. The device survived all sea states during this period, including Hsig waves up to 3.75 m with a Te of 13 seconds. Key outcomes included an understanding of the critical position of the float axis relative to the mean water level, which has implications for the mooring
Final Scientific Technical Report DE-EE0003642
15 | P a g e
design, particularly in the latter’s ability to track diurnal tidal variations. Overall, the testing conducted under this project has successfully advanced the WET-NZ to TRL 5/6 status.
TRL 7/8 Program
Several experimental models of the WET-NZ device have been deployed over the past five years; only the most recent 1:2 scale device deployed as part of this project contained a practical PTO system and generated appreciable power. The Oregon deployment demonstrated that the PTO technology is functionally viable. In addition to offshore deployments of WET-NZ prototypes, a computer model has been developed to simulate the WET-NZ device in the ocean environment. This computer model has been progressively refined as the experimental prototypes have been developed and tested, and it was used to help design and predict the performance of the TRL 5/6 wave tank and ocean test devices. This refinement process is ongoing and will continue through commercial scale development and beyond.
Further analysis of the TRL 5/6 performance data will be conducted to inform detailed projections for the TRL 7/8 design. Specifically, further performance data analysis will be performed to update the hydrodynamic characteristics and coefficients and include a more accurate representation of the PTO transfer function behavior in the computer model.
In addition to the initial projections that led to the evolvement of this shape and scale, PTO upgrades necessary to deliver improved device performance have been identified. The various options on PTO system configuration will be evaluated during the detailed TRL 7/8 design process, with reference to the device reliability criteria.
The Project Team has also developed a projected performance for the commercial scale WET-NZ, based on recognized industry guidelines used to produce a power output matrix for the full range of wave conditions. To account for uncertainty in experimental data obtained to date, both conservative and optimistic power matrices were derived from the results of TRL 5/6 deployment, including both the 1:30 scale wave tank tests and the 1:2 scale open ocean deployment. The annual energy yield for specific deployment sites can be derived from these matrices. Along with estimates of the projected capital and infrastructure costs, bounds on a range for the projected commercial cost of energy (COE) can be established as well.
To achieve TRL 7 status, prototype scale components and subsystems for the commercial scale design will be fabricated and integrated to establish and verify subsystem and system level functionality and prepare for testing in an open water environment. Specifically, this work will be undertaken to verify expected operation and fine tune the design prior to deployment of a fully operational commercial scale device. To demonstrate TRL 8 status, the fully operational prototype in its final form (at or near full scale) will be tested and qualified in an open ocean environment under all expected operating conditions to demonstrate readiness for commercial deployment.
Cost of Energy
The Project team developed and applied a Cost of Energy (COE) model for the WET-NZ. The COE for the WET-NZ was calculated using a methodology similar to that described in the DOE Funding Opportunity

Final Scientific Technical Report DE-EE0003642
16 | P a g e
Announcement for Offshore Wind Technology Development and DOE’s Standardizing Cost and Performance Reporting for Wave Technologies.3 The approach was also evaluated with that proposed in a recent DOE funded project completed by ReVision.4
This COE model provides a merit criteria integrating both cost and performance and reflects an approach based on previous work conducted by NREL on low wind speed wind turbine technologies and adapted here for wave energy converters.5 The primary figure-of-merit is the levelized COE, which is provided in constant, January 2012 dollars. COE was calculated for the WET-NZ, with an expected operating life of 20 years. The values in the model are Design to Cost (DTC) objectives, using the following inputs:
Discount Rate Insurance, Warranty and Fees Initial Capital Cost Levelized Replacement Cost Operations and Maintenance Costs Net Annual Energy Production
The final COE report describes the methodology used to develop the COE model and summarizes the COE model itself. Finally, the report summarizes the COE model results, including a sensitivity analysis. It is important to note that the COE model developed under this project has not yet been populated with details of a commercial scale project.
2.4. MARKET IMPACT & COMPETITOR ANALYSIS, BUSINESS PLAN AND COMMERCIALIZATION STRATEGY
Primary components of the market impact, competitor analysis, business plan, and commercialization strategy developed for the WET-NZ under this project include:
An assessment of a range of different devices for different applications (multi-unit utility-scale arrays, small off-grid arrays for island/remote community applications, combined electricity/drinking water generation applications).
An approach to monitor, quantify and minimize environmental impacts of device deployments.
A market analysis which identifies potential US and international markets.
An analysis of competitive technologies including cost and performance benchmarking.
3 This report was prepared utilizing the draft methodology available at the time, which was received from DOE on 10/26/2012. Revisions to this methodology are underway, which will be accounted for and applied in future COE calculations for the WET-NZ. 4 Previsic, M.; Epler, J.; Heimiller, D.; Short, W.; Eurek, K. (2012) The Future Potential of Wave Power in the United States, 110 pp. 5 Schreck, S.; Laxson, A. (2005). Low Wind Speed Technologies Annual Turbine Technology Update (ATTU) Process for Land-Based, Utility-Class Technologies. 29 pp.; NREL Report No. TP-500-37505.
Final Scientific Technical Report DE-EE0003642
17 | P a g e
A plan for procurement and cost reduction strategies, including modular construction, off-the-shelf component purchasing and outsourcing component manufacture.
A communications plan, including dedicated website development and ongoing conference presentations and papers.
A summary of the activities and key outcomes of the goals and objectives listed above are described in the sections below.
Product Strategy
This project involved identifying the various product strategies available to WET-NZ, depending on its future ownership and availability of financing. The base assumption is that the primary target market for the WET-NZ is utility scale electricity markets with good wave energy resources. In order to meet this market, the WET-NZ needs to go through the following development stages:
Development of a full scale device for testing and certification Testing of 3-5 devices in an array at an ocean test center such as NNMREC’s PMEC facility or
Wave Hub Development and testing of associated ancillary equipment Development of wave farm sites Scale up to commercial production of WET-NZ devices for sale to wave farm developers or for
deployment at own wave farm sites
Once these core stages have been completed there are a number of future product strategies available to WET-NZ, including:
Enhancement – on-going efficiency, cost and reliability improvements to the commercial device to increase its market competitiveness
Expansion – developing devices optimized for lower wave energy resource utility markets, and increasing the scale of the device
Evolution – developing devices for non-utility markets such as small off grid communities or autonomous markets, desalination or hybrid devices
Environmental Monitoring & Mitigation
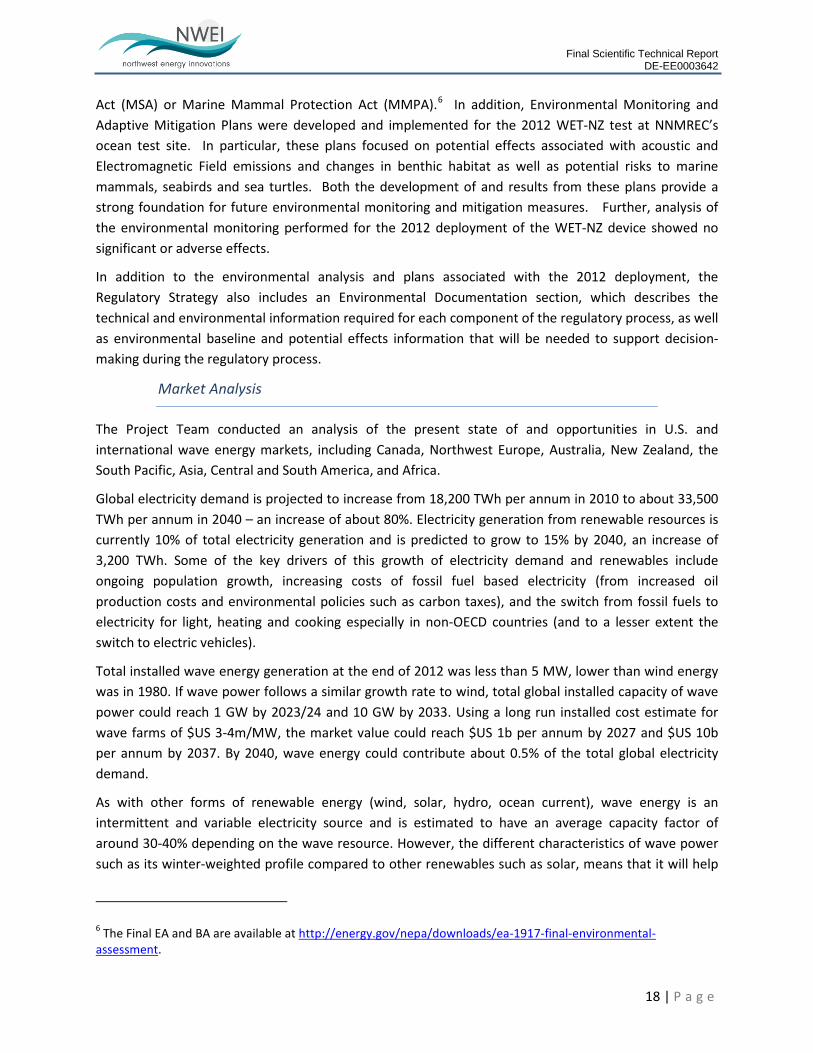
As part of the permitting process for the 2012 deployment at NNMREC’s ocean test site, the U.S. Department of Energy prepared an Environmental Assessment in 2012 for its funding of the project, which resulted in a Finding of No Signification Impact (FONSI). Similarly, a Biological Assessment (BA) prepared for the project concluded that the project was “Not Likely to Adversely Affect” any species or habitat protected under the ESA, Magnuson Stevens
Final Scientific Technical Report DE-EE0003642
18 | P a g e
Act (MSA) or Marine Mammal Protection Act (MMPA).6 In addition, Environmental Monitoring and Adaptive Mitigation Plans were developed and implemented for the 2012 WET-NZ test at NNMREC’s ocean test site. In particular, these plans focused on potential effects associated with acoustic and Electromagnetic Field emissions and changes in benthic habitat as well as potential risks to marine mammals, seabirds and sea turtles. Both the development of and results from these plans provide a strong foundation for future environmental monitoring and mitigation measures. Further, analysis of the environmental monitoring performed for the 2012 deployment of the WET-NZ device showed no significant or adverse effects.
In addition to the environmental analysis and plans associated with the 2012 deployment, the Regulatory Strategy also includes an Environmental Documentation section, which describes the technical and environmental information required for each component of the regulatory process, as well as environmental baseline and potential effects information that will be needed to support decision-making during the regulatory process.
Market Analysis
The Project Team conducted an analysis of the present state of and opportunities in U.S. and international wave energy markets, including Canada, Northwest Europe, Australia, New Zealand, the South Pacific, Asia, Central and South America, and Africa.
Global electricity demand is projected to increase from 18,200 TWh per annum in 2010 to about 33,500 TWh per annum in 2040 – an increase of about 80%. Electricity generation from renewable resources is currently 10% of total electricity generation and is predicted to grow to 15% by 2040, an increase of 3,200 TWh. Some of the key drivers of this growth of electricity demand and renewables include ongoing population growth, increasing costs of fossil fuel based electricity (from increased oil production costs and environmental policies such as carbon taxes), and the switch from fossil fuels to electricity for light, heating and cooking especially in non-OECD countries (and to a lesser extent the switch to electric vehicles).
Total installed wave energy generation at the end of 2012 was less than 5 MW, lower than wind energy was in 1980. If wave power follows a similar growth rate to wind, total global installed capacity of wave power could reach 1 GW by 2023/24 and 10 GW by 2033. Using a long run installed cost estimate for wave farms of $US 3-4m/MW, the market value could reach $US 1b per annum by 2027 and $US 10b per annum by 2037. By 2040, wave energy could contribute about 0.5% of the total global electricity demand.
As with other forms of renewable energy (wind, solar, hydro, ocean current), wave energy is an intermittent and variable electricity source and is estimated to have an average capacity factor of around 30-40% depending on the wave resource. However, the different characteristics of wave power such as its winter-weighted profile compared to other renewables such as solar, means that it will help
6 The Final EA and BA are available at http://energy.gov/nepa/downloads/ea-1917-final-environmental-assessment.
Final Scientific Technical Report DE-EE0003642
19 | P a g e
to diversify the overall power system generation profile where it is installed. As is the case with other renewable technologies, spatial diversity of wave farms, the longer term predictability of the wave resource and not relying on only one power generation technology to supply electricity will reduce overall power system risks and ensure grid stability.
For wave energy to be commercially viable, the levelized cost of energy (LCOE) for wave farms will need to be competitive with the LCOEs of alternative forms of electricity generation in the markets where the wave farms are located. The LCOE for a given wave energy technology will be specific to the country where it is located as it is affected by the quality of the wave energy resource, and macroeconomic factors such as depreciation, interest rates and renewable energy support mechanisms and incentives.
Studies undertaken by the Carbon Trust in the UK in 2010 estimated that the LCOE of the first wave farms would be between US 60 c/kWh and 76 c/kWh. The studies concluded that under an innovation-led scenario, the LCOE for wave farms could drop to around US 28 c/kWh at around 300 MW of installed capacity and US 23 c/kWh by 2025 – equivalent to the cost of offshore wind. The long run cost could drop below US 15 c/kWh by the time 14 GW of wave power has been deployed globally, which is competitive with a number of alternative renewables.
In order for the wave energy market to grow in the near term, significant R&D funding is required to support the development, deployment and commercialization of wave energy devices and generous incentives to enable the commercial development of wave farms. It also requires the active cooperation and collaboration of governments, research institutions, industry associations and major utilities to support the device developers.
The past decade has seen significant growth in public and private investment in research, development and deployment of wave energy conversion devices, as well as other forms of marine renewables. This has been driven by a number of factors including climate change, energy security and rising oil prices. Some of the key trends that have occurred in the wave energy sector over the last decade include:
Private investors have entered the industry which was previously predominantly the domain of academia, and large well known manufacturers are taking investment positions in the leading device developers
The development of a number of grid connected ocean testing facilities for single devices and arrays of devices in the UK and US to complement onshore scale wave tank testing facilities
A significant number of devices have gone beyond small scale tank testing and have been built at half or full scale, deployed in the ocean and in some cases connected to the grid
For advanced device developers the focus is now on improving efficiency, reducing cost and establishing production facilities, with devices up to the 2nd or 3rd iteration of full scale product
Multiple device development companies and major utilities are beginning to lease sea space and prepare environmental impact assessments for future large scale wave farms
Much of the focus has been on utility scale power generation – however a number of developers are including water desalination as primary or secondary function of their devices. A smaller number are also focusing on smaller scale autonomous power markets
There is still a lack of technology convergence in wave energy devices and no clear technology leader
Final Scientific Technical Report DE-EE0003642
20 | P a g e
As part of this market analysis, a high level quantitative assessment of the attractiveness of each of the countries with modest to good wave energy potential was performed to give an indication of which markets WET-NZ should prioritize for long term growth. This assessment was based on a 1-5 scale for each of the key areas that are considered important drivers to facilitate the introduction of wave power– in particular a good wave resource and financial incentives both for device development and deployment.
Competitive Analysis
The Project Team prepared and documented a competitive assessment of the WET-NZ against the most advanced of the competing WEC technologies. The WET-NZ device is classified as a type of point absorber device. At full scale, however, the WET-NZ it is not strictly a point absorber since its width along the wave-front potentially extends beyond the distance that point absorber action occurs. It therefore also has terminator-like characteristics. A high level assessment of the relative complexity, benefits and disadvantages of devices’ methods of extracting wave energy relative to WET-NZ’s was also provided. The purpose of this review was to undertake a competitive assessment of the WET-NZ technology against the most advanced of the competing wave energy technologies.
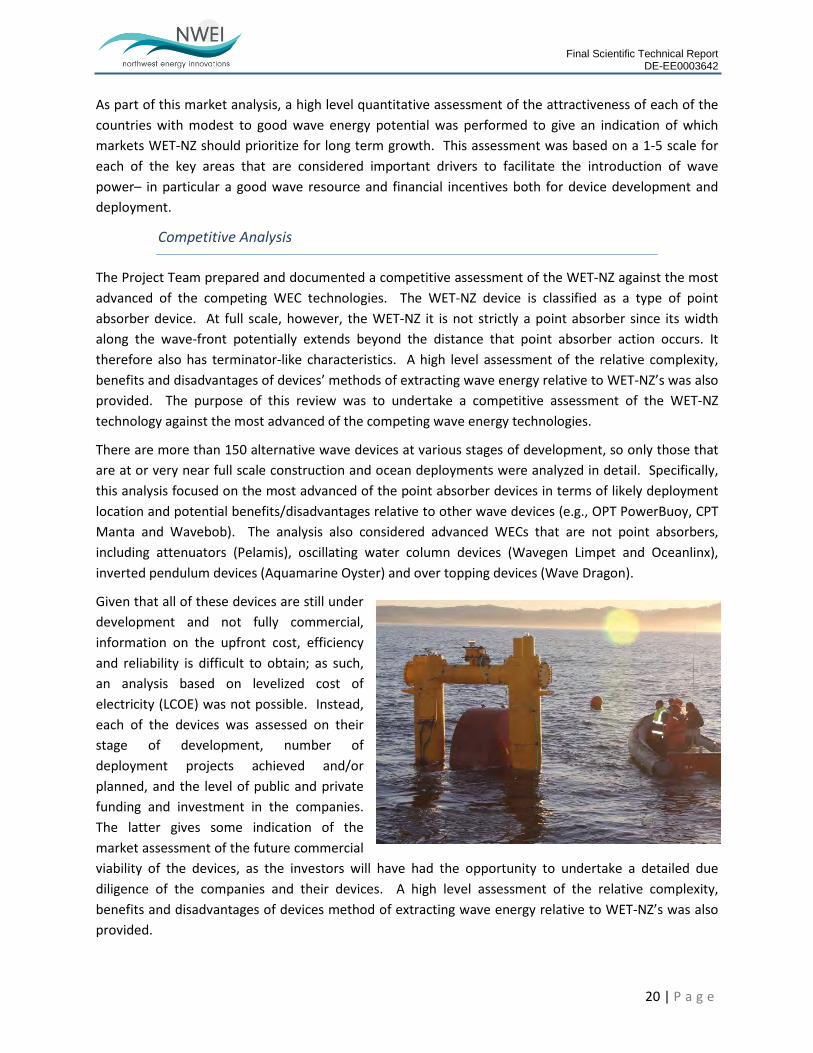
There are more than 150 alternative wave devices at various stages of development, so only those that are at or very near full scale construction and ocean deployments were analyzed in detail. Specifically, this analysis focused on the most advanced of the point absorber devices in terms of likely deployment location and potential benefits/disadvantages relative to other wave devices (e.g., OPT PowerBuoy, CPT Manta and Wavebob). The analysis also considered advanced WECs that are not point absorbers, including attenuators (Pelamis), oscillating water column devices (Wavegen Limpet and Oceanlinx), inverted pendulum devices (Aquamarine Oyster) and over topping devices (Wave Dragon).
Given that all of these devices are still under development and not fully commercial, information on the upfront cost, efficiency and reliability is difficult to obtain; as such, an analysis based on levelized cost of electricity (LCOE) was not possible. Instead, each of the devices was assessed on their stage of development, number of deployment projects achieved and/or planned, and the level of public and private funding and investment in the companies. The latter gives some indication of the market assessment of the future commercial viability of the devices, as the investors will have had the opportunity to undertake a detailed due diligence of the companies and their devices. A high level assessment of the relative complexity, benefits and disadvantages of devices method of extracting wave energy relative to WET-NZ’s was also provided.
Final Scientific Technical Report DE-EE0003642
21 | P a g e
LEADING WECS
The most advanced wave energy converters were identified, including the type of device, stage of development, the current device rating (in kilowatts), funding to date and the key competitive advantages and disadvantages of the device. The advanced point absorber devices considered are likely to be the greatest competitors to the WET-NZ in the deep water wave energy market. Some are further ahead in terms of funding, grid connected deployments and TRL level, and each has a unique method for extracting energy from the waves.
EMERGING COMPETITORS
WECs at the stage of deploying near full scale prototypes in the water, either at grid connected UK test centers such as EMEC and WaveHub or offshore European waters, were also considered. They could potentially emerge to be competitors to WET-NZ (particularly the point absorbers); however, they do not yet have a significant track record in the water and in many cases little information is currently available on their performance and potential cost.
OVERALL CONCLUSIONS
The key advantages of the WET-NZ device relative to the competitor devices considered include:
It can extract energy from all three sources of wave motion – the models of the WET-NZ design show that it should be able to extract about 30% more energy than devices that extract energy from heave alone.
There are no end-stops restricting float motion and the active float can rotate through 360° in either direction. Electricity can be generated whenever the float is moving relative to the hull so, on top of increasing the survivability of the device, this design also increases the amount of energy that can be harnessed since it will still generate in storm conditions when other devices must shut down for survival.
Its modular, floating, simple design for survivability and for operations should result in lower capital and maintenance costs than other wave energy converters and enable smaller packing density for arrays (reducing lease costs and spatial constraints)
Its mooring system is based on slack mooring, similar to ship mooring so that the device can rise and fall with tidal variation, minimizing vertical forces imposed on the system
Its key disadvantages relative to the leading competitor wave devices are its level of funding support and it has yet to be grid connected (although this will occur in 2013). Opportunities to improve its competitiveness include simplification of the power take off system to increase its efficiency and reduction of hull costs through use of lower cost structures. These will be addressed in future stages of development. Based on this analysis, the WET-NZ will be competitive with the devices identified in this analysis, in terms of yield, operation, reliability and survivability. To achieve this, sufficient funding will be required to develop a full scale WET-NZ device to demonstrate TRL 7-8 status and incorporate improvements to the overall design and efficiency of the power off take system.
Final Scientific Technical Report DE-EE0003642
22 | P a g e
Communications Plan
A communications plan, including dedicated website development and ongoing conference presentations and papers, was developed as part of several tasks performed under this project. The project website (www.nwenergyinnovations.com) was utilized to communicate general project information, as well as ongoing updates. A primary presentation was developed and presented, which is provided in Appendix B. In addition, the Regulatory Strategy provides an Outreach Plan for the TRL 7/8 demonstration project, including public outreach and agency engagement for future projects.
3. PRODUCTS In addition to the materials described in this report and noted below, the Project Team prepared a series of technical reports documenting the activities conducted under the award; each of the technical reports, along with data and analysis of project activities, were provided to DOE as part of the project task deliverables. Additional information developed under this project is noted in communications plan above, and conference presentations are provided in Appendix A.
Networks or Collaborations
Continued and important collaborations were fostered with the National Northwest Marine Renewable Energy Center (NNMREC) at Oregon State University (OSU) and the Oregon Wave Energy Trust. Both parties were integral to program success and contributed both technical and financial support to the project. Additionally, the relationships developed with manufacturing and marine service contractors under this project will pave the way for future collaboration in the ocean renewable energy industry.
Technologies
While no new technologies were developed under this project, the WET-NZ technology made significant progress towards commercial demonstration under this program. In particular, the technological advances made under this project enabled the WET-NZ to achieve TRL 5/6 status.
Inventions, Patent Applications, and License Agreements
NWEI was granted a research license from the Intellectual Property owners to complete the required program activities. No inventions or patents were part of this project.
Computer Modeling
Appendix B (Le-Ngoc et al) describes in detail the description of the numerical model used as part of this project and offers a general description, key assumptions, and overall intended use. Furthermore, this paper discusses the performance criteria and how it is applied to ocean testing and the overall theory behind the model. Justifications and references to various techniques used are also given in the paper.
Final Scientific Technical Report DE-EE0003642
23 | P a g e
GLOSSARY OF TERMS & ACRONYMS 1:2 scale The ½ (“half”) scale WET-NZ device, constructed and deployed at the NNMREC ocean
test site in 2012 under the TRL 5/6 program. Also used to describe the first generation, 1:2 scale WET-NZ device tested in New Zealand under the MEDF program.
1.5:1 scale The currently projected size of a commercial scale WET-NZ device and the recommended scale of a TRL7/8 pre-commercial device.
1:4 scale ¼ scale model, tested in near shore ocean conditions
1:5 scale 1/5th scale model, tested in a dive tank and near shore ocean conditions
1:30 scale 1/30th scale model, tested in a deep wave tank
1:100 scale 1/100th scale model, tested in a shallow wave tank
AC Alternating Current
ACHP Advisory Council on Historic Preservation
ADCP Acoustic Doppler Current Profiler
Active float (or float)
The surface floating body component of the WET-NZ, which is pivoted via a PTO shaft
AEP Annual Energy Production
ALP Alternative Licensing Process, a type of licensing process used by FERC
APE Area of Potential Effect
BA Biological Assessment
BO Biological Opinion
BOEM Bureau of Ocean Energy Management
COE Cost of Energy ($/kW)
CWA Clean Water Act
CZMA Coastal Zone Management Act
DAS Data Acquisition System
DC Direct Current
DECC Department of Energy and Climate Change (UK)
DEQ Oregon Department of Environmental Quality
DLCD Oregon Department of Land Conservation and Development
Final Scientific Technical Report DE-EE0003642
24 | P a g e
DNV Det Norske Veritas, an independent foundation that provides services in risk management for marine technologies, including third party certification for wave energy converters
DOD U.S. Department of Defense
DOE U.S. Department of Energy
DOI U.S. Department of Interior
DSL Oregon Department of State Lands
EA Environmental Assessment
EECA Energy Efficiency and Conservation Authority
EFH Essential Fish Habitat
EMEC European Marine Energy Center – a grid-connected open sea testing facility for wave and ocean current devices in the Orkney Islands, Scotland
EIS Environmental Impact Statement
EMF Electromagnetic Field
ENSO El Niño-Southern Oscillation
EquiMAR A research program, funded by the European Commission, on the Equitable Testing and Evaluation of Marine Energy Extraction Devices in terms of Performance, Cost and Environmental Impact
ESA Endangered Species Act
EU European Union
fa Fathom
FAD Fish Attraction Device
FE Finite Element; FE analysis will be conducted as part of the detailed design process for the TRL 7/8 WET-NZ to reduce materials costs
FERC Federal Energy Regulatory Commission, the U.S. government entity responsible for licensing hydroelectric and marine hydrokinetic projects
FMEA Failure Mode Effects Analysis, a systematic analysis of systems and sub-systems to a level of detail that identifies all potential failure modes down to the appropriate sub-system level and their consequences
FOA Funding Opportunity Announcement, U.S. Federal government funding notice
FONSI Finding of No Significant Impact, a determination made in the NEPA process
FPA Federal Power Act

Final Scientific Technical Report DE-EE0003642
25 | P a g e
FR Federal Register
FWCA Fish and Wildlife Coordination Act
Full Scale Device
Reference dimensional scaling (defining linear dimension s=1) used by the project team to represent a projected WET-NZ device that will perform in the full ocean wave environment, with nominal Hs up to 5m and Te up to 15 seconds. A power rating for a commercial-scale device based on a specific sea state (Hs, Te and spectrum), has not yet been developed, but will be below the peak power output of the device, likely between 250 kW and 1 MW.
GWh Gigawatt hour, unit of energy equal to the energy converted or consumed at the rate of 1 x 10⁹ Watts in one hour
half-scale Refers to the “half-scale” terminology used to define scale in the WET-NZ development, which is based on an early estimate of a nominal full-scale device with a Power Take Off peak power output of approximately 200 kW, in a Hs = 5 m sea. Subsequent analysis of wave tank model testing and computer simulations suggest that a commercial-scale point absorber-like device can be larger, with a float area approaching 60 m2 and a weight in the order of 130 tons or more. See also “1:2 scale”
HSEQ Health, Safety, Environment & Quality
Hull (or reactive body)
The largely immersed vertical body of the WET-NZ device which provides the pivot-bearing support and reaction forces for the PTO
IEA International Energy Agency
IHA Incidental Harassment Authorization, a permit issued by the National Marine Fisheries Service under the MMPA allowing harassment to marine mammals from short-term activities. An IHA is generally issued if the potential impacts are negligible, or if the potential for serious injury or mortality can be negated through mitigation.
ILP Integrated Licensing Process, the default licensing process used by FERC
IRL Industrial Research Limited, a New Zealand Crown Research Institute and co-founder of the WET-NZ consortium
kW Kilowatt, unit of power equivalent to 1 x 10³ Watts
LCOE Levelized Cost of Energy, the price at which electricity must be generated from a specific source to break even over the lifetime of the project; usually expressed in terms of dollars per kilowatt hour.
LOA Letter of Authorization
MEDF Marine Energy Deployment Fund, a competitive funding award of the New Zealand Government; also refers to the first generation, 1:2 scale WET-NZ device tested in New Zealand
Final Scientific Technical Report DE-EE0003642
26 | P a g e
MHK Marine and Hydrokinetic (i.e., ocean wave, tidal current and current technologies)
MMPA Marine Mammal Protection Act
MOA Memorandum of Agreement
MOISyt Modular Offshore Instrumentation System
MW Megawatt, unit of power equivalent to 1 x 10⁶ Watts
MWh Megawatt hour, unit of energy equal to the energy converted or consumed at the rate of 1 x 10⁶ Watts in one hour
NEPA National Environmental Protection Act
NHPA National Historic Preservation Act
NMFS National Marine Fisheries Service
NNMREC Northwest National Marine Renewable Energy Center, a standardized test center at OSU for wave energy technologies. The center’s facilities include an open ocean test site and one of the largest and most sophisticated laboratories for education, research, and testing in coastal and ocean and sciences in the U.S.
NREL National Renewable Energy Laboratory, a U.S. DOE Laboratory
NWEI Northwest Energy Innovations, a wholly-owned subsidiary of Pacific Energy Ventures formed for the specific purpose of advancing the WET-NZ design in the U.S.
OAR Oregon Administrative Rules
OCMP Oregon Coastal Management Plan
OCS Outer Continental Shelf, includes all submerged lands, subsoil, and seabed from the seaward extent of state waters (typically 3 nautical miles offshore) to the seaward extent of U.S. jurisdiction (approximately 200 nautical miles offshore)
OES Ocean Energy Systems, the OES Implementing Agreement is an intergovernmental collaboration between nations, which operates under a framework established by the International Energy Agency in Paris
ORS Oregon Revised Statutes
OSU Oregon State University
OWC Oscillating Water Column
OWET Oregon Wave Energy Trust – a nonprofit public-private partnership funded by Oregon Innovation Council to support the responsible development of wave energy in Oregon
PA Programmatic Agreement
PDO Pacific Decadal Oscillation
Final Scientific Technical Report DE-EE0003642
27 | P a g e
PEV Pacific Energy Ventures, a consulting and business development firm specializing in strategic marketing, project management, and governmental affairs in the renewable energy sector
PoC Proof-of-Concept
PPA Power Purchase Agreement
PPL Power Projects Limited, a New Zealand-based marine energy consultancy and co-founder of the WET-NZ consortium
Project Team
The team consisting of NWEI (award recipient), IRL (sub-recipient) and PPL (sub-recipient), which are the primary organizations responsible for completing DOE Award #EE0003642.
PSAF Pre-Seed Accelerator Fund, a New Zealand Government research fund, internally administered by IRL. Also the name of the 1:4-scale WET-NZ prototype.
PTO Power Take Off, the system for converting mechanical energy to electrical energy
RECs (also ROCs)
Renewable energy certificates / credits– a mechanism for tracking the amount of renewable energy being sold as part of RPS programs. Also known as Renewable Obligation Certificates in UK.
RFI Request for Information, a notice issued by the U.S. Bureau of Ocean Energy Management when offering leases on the OCS. Parties interested in obtaining a lease in the RFI area should respond with an indication of interest.
RO, SWRO (Sea Water) Reverse Osmosis desalination plant
RPS (also RES, MRET and RO)
Renewable Portfolio Standard – a regulation that requires increased production of energy from renewable energy sources, generally by placing an obligation on electricity supply companies or utilities to purchase a specified fraction of the electricity from renewable resources or pay a financial penalty; also referred to as Renewable Electricity Standards (RES) and/or Renewables Obligation (RO) in the UK and Mandatory Renewable Energy Target (MRET) in Australia.
SAP Site Assessment Plan, a document submitted to BOEM during the leasing process that describes the overall project, the existing environment, activities the applicant plans to perform for the Site Characterization Phase of its lease, and results of any physical characterization and baseline environmental surveys
SCADA System Control and Data Acquisition, a component of the WET-NZ system. There are two on the 1:2 scale WET-NZ device, referred to as the "Orange" and "Black" boxes.
Final Scientific Technical Report DE-EE0003642
28 | P a g e
SoDF Statement of Design Feasibility, a document issued by DNV affirming that, at the time of assessment, it has been found beyond reasonable doubt that the concept is considered conceptually feasible, that the risks identified can be acceptably managed using the methods defined in the certification plan, and the concept is suited for further development and certification according to the principles outlined in OSS-312. DNV awarded a SoDF for the 1:2 scale WET-NZ design in November 2010.
TC 114 Technical Committee 114, the International Electrotechnical Commission’s Technical Committee responsible for International Standards for marine energy conversion systems
TLP Traditional Licensing Process, a type of licensing process used by FERC
TRL Technology Readiness Level, a scale utilized by the public and private sector to track technology development phases. The scale begins at the concept level (TRL 1) and progresses to successful operation of actual equipment in the full operation environment (TRL 9).
TSP Territorial Sea Plan, a detailed, management-oriented guide adopted Oregon in 1994 for evaluating uses of the state's territorial waters. It was amended in 2013 to incorporate a new section (Part Five) for development of renewable energy facilities in state waters.
TWh Terawatt hour, unit of energy equal to the energy converted or consumed at the rate of 1 x 10¹² Watts in one hour
USACE U.S. Army Corp of Engineers
USCG U.S. Coast Guard
USFWS U.S. Fish and Wildlife Service
WEC wave energy converter
WET-NZ Wave Energy Technology - New Zealand, the wave energy converter technology under development
WET-NZ Consortium
A research consortium founded by IRL and PPL, which has been collaborating since 2006 to design, fabricate and test the WET-NZ technology in New Zealand to validate its performance and cost of energy.
WRD Oregon Water Resources Department
WWPP U.S. Department of Energy’s Wind and Water Power Program

Final Scientific Technical Report DE-EE0003642
29 | P a g e
APPENDIX A – CONFERENCE PRESENTATION

Northwest MHK Leadership Justin A. Klure, Program Manager
GMREC VI April 11, 2013
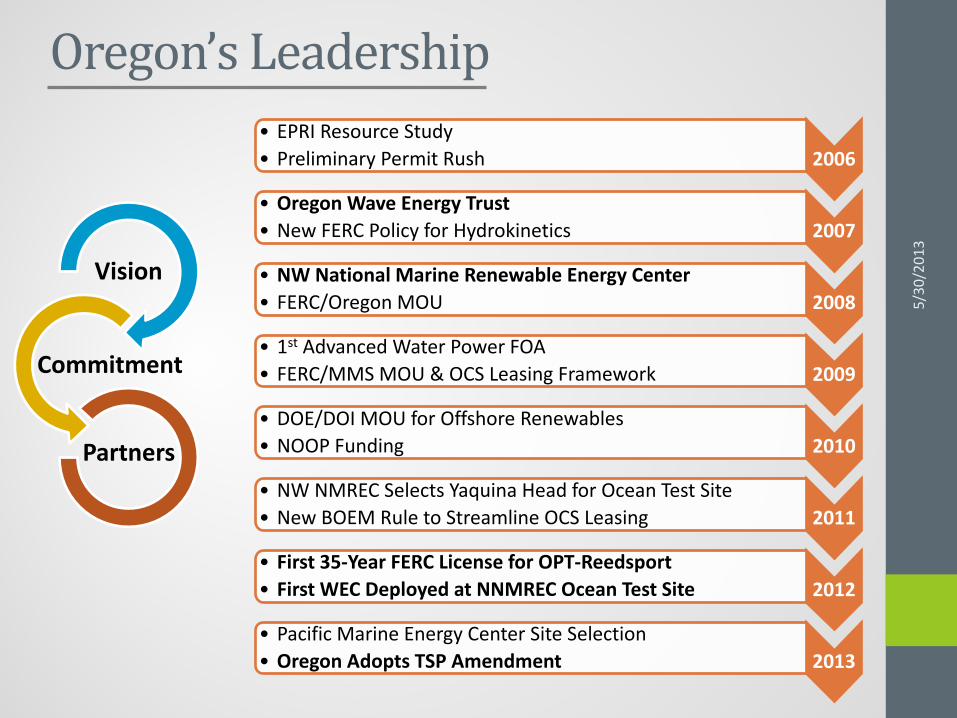
Oregon’s Leadership
Vision
Commitment
Partners
2006 • EPRI Resource Study • Preliminary Permit Rush
2007 • Oregon Wave Energy Trust • New FERC Policy for Hydrokinetics
2008 • NW National Marine Renewable Energy Center • FERC/Oregon MOU
2009 • 1st Advanced Water Power FOA • FERC/MMS MOU & OCS Leasing Framework
2010 • DOE/DOI MOU for Offshore Renewables • NOOP Funding
2011 • NW NMREC Selects Yaquina Head for Ocean Test Site • New BOEM Rule to Streamline OCS Leasing
2012 • First 35-Year FERC License for OPT-Reedsport • First WEC Deployed at NNMREC Ocean Test Site
2013 • Pacific Marine Energy Center Site Selection • Oregon Adopts TSP Amendment
5/30
/201
3
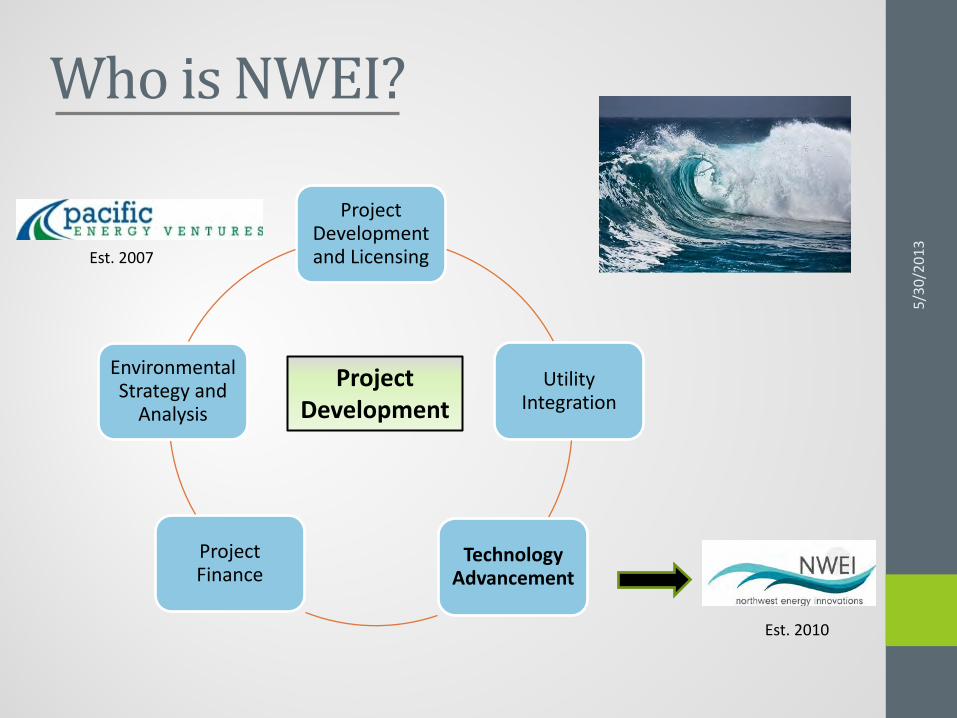
Who is NWEI?
Project Development and Licensing
Utility Integration
Technology Advancement
Project Finance
Environmental Strategy and
Analysis
Project Development
Est. 2007
Est. 2010
5/30
/201
3
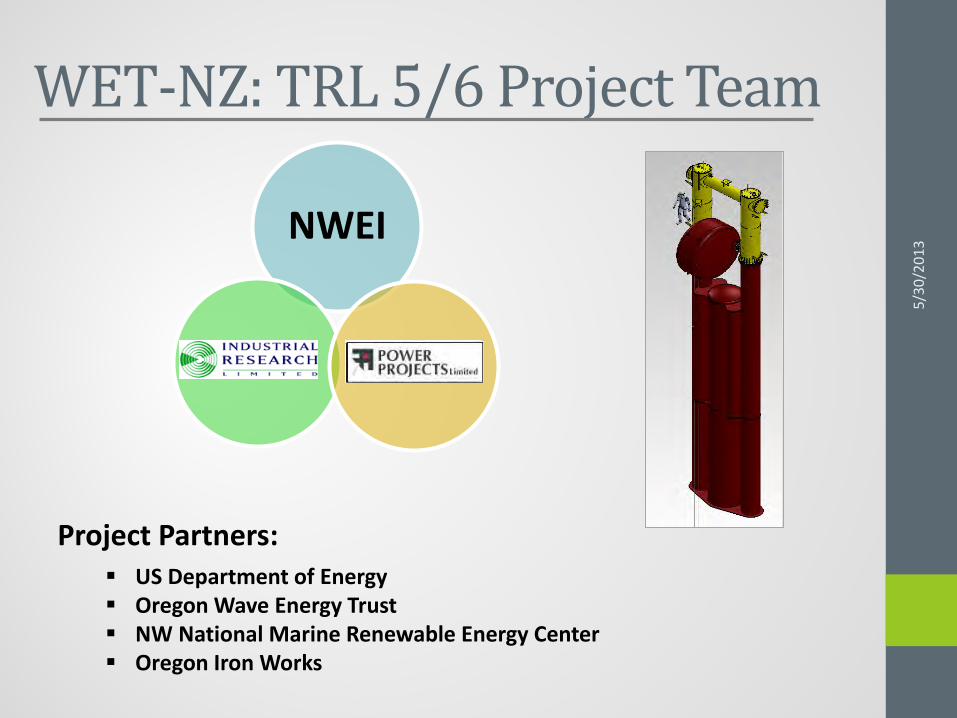
WET-NZ: TRL 5/6 Project Team
NWEI
Project Partners: US Department of Energy Oregon Wave Energy Trust NW National Marine Renewable Energy Center Oregon Iron Works
5/30
/201
3
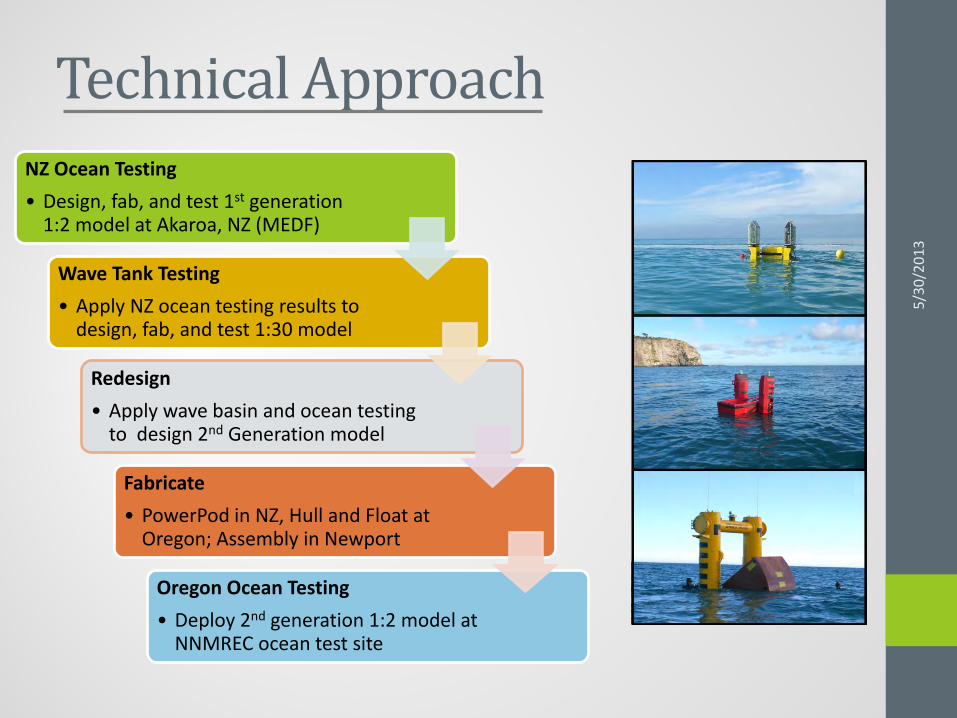
Technical Approach NZ Ocean Testing • Design, fab, and test 1st generation
1:2 model at Akaroa, NZ (MEDF)
Wave Tank Testing • Apply NZ ocean testing results to
design, fab, and test 1:30 model
Redesign • Apply wave basin and ocean testing
to design 2nd Generation model
Fabricate • PowerPod in NZ, Hull and Float at
Oregon; Assembly in Newport
Oregon Ocean Testing • Deploy 2nd generation 1:2 model at
NNMREC ocean test site
5/30
/201
3
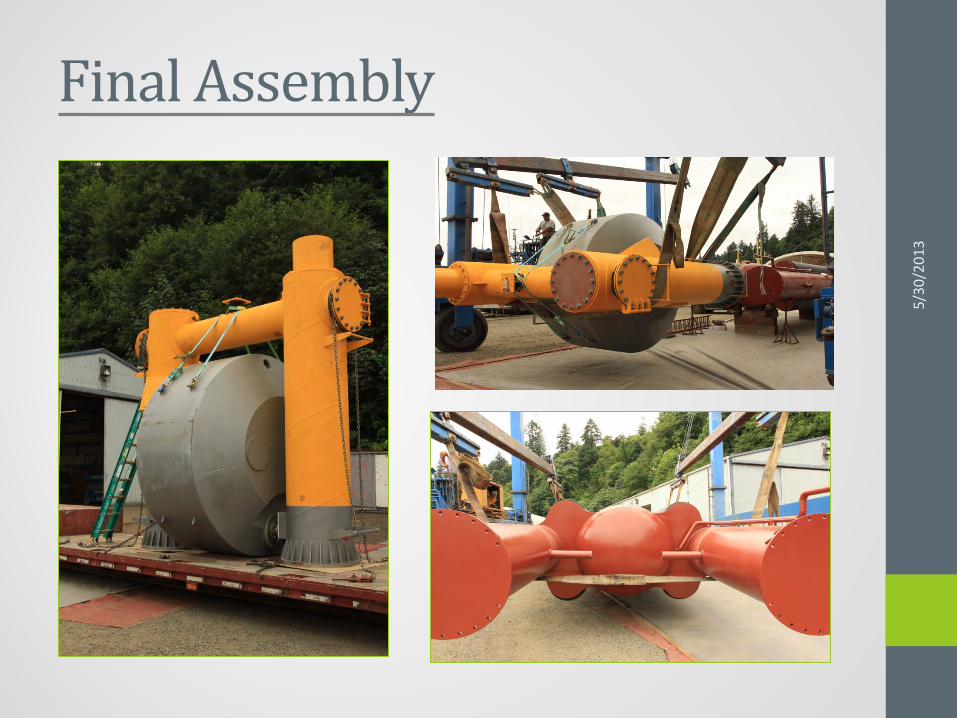
Final Assembly
5/30
/201
3
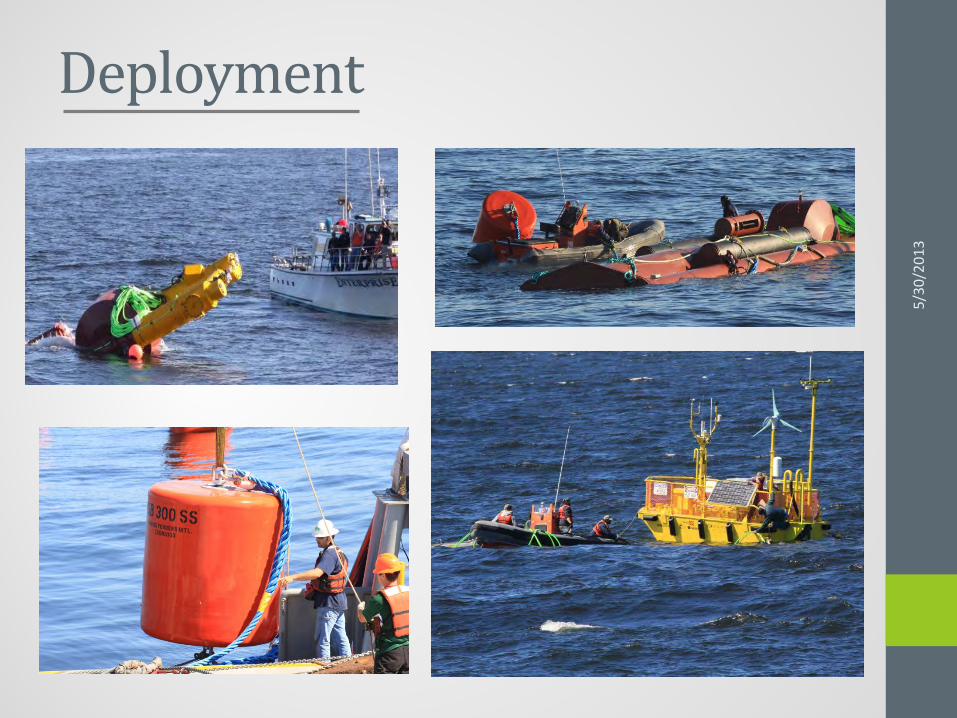
Deployment
5/30
/201
3
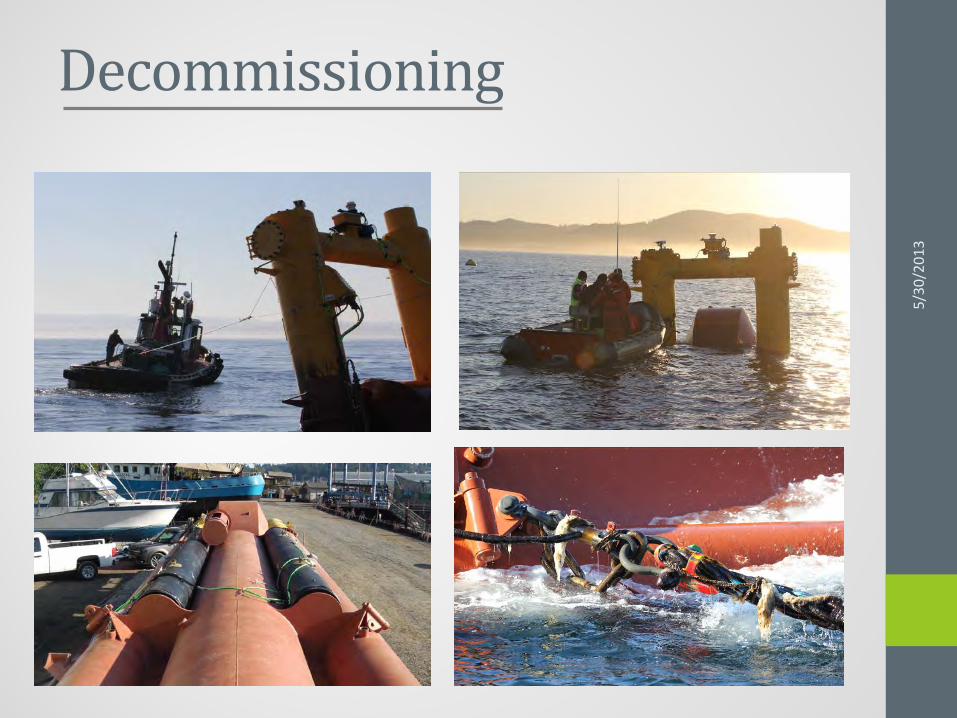
Decommissioning
5/30
/201
3
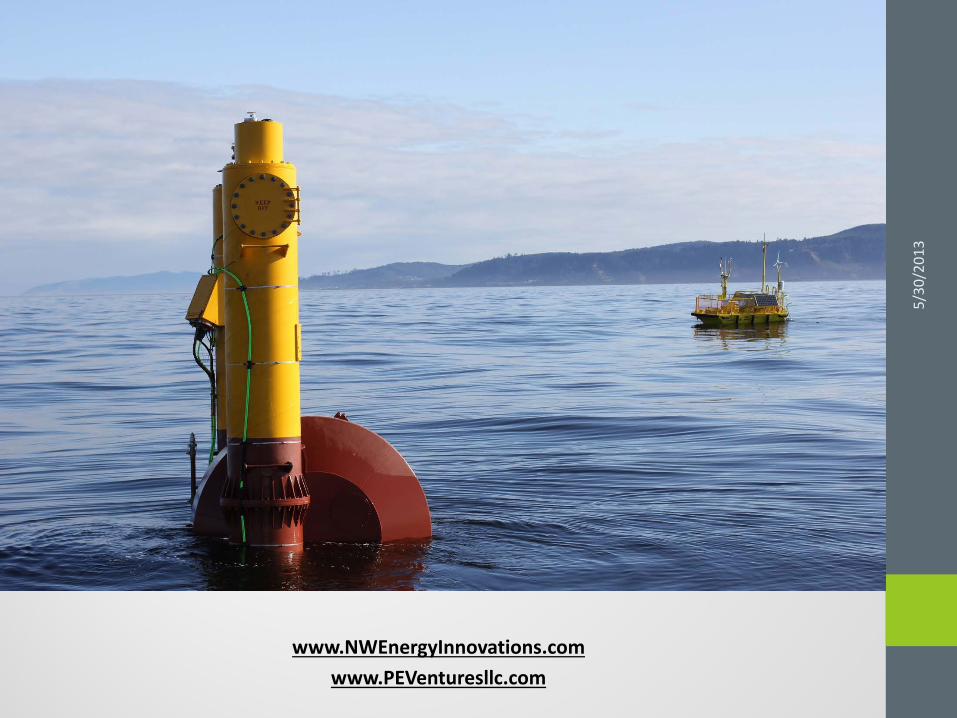
www.NWEnergyInnovations.com
www.PEVenturesllc.com
5/30
/201
3

Final Scientific Technical Report DE-EE0003642
30 | P a g e
APPENDIX B – NUMERICAL MODELING
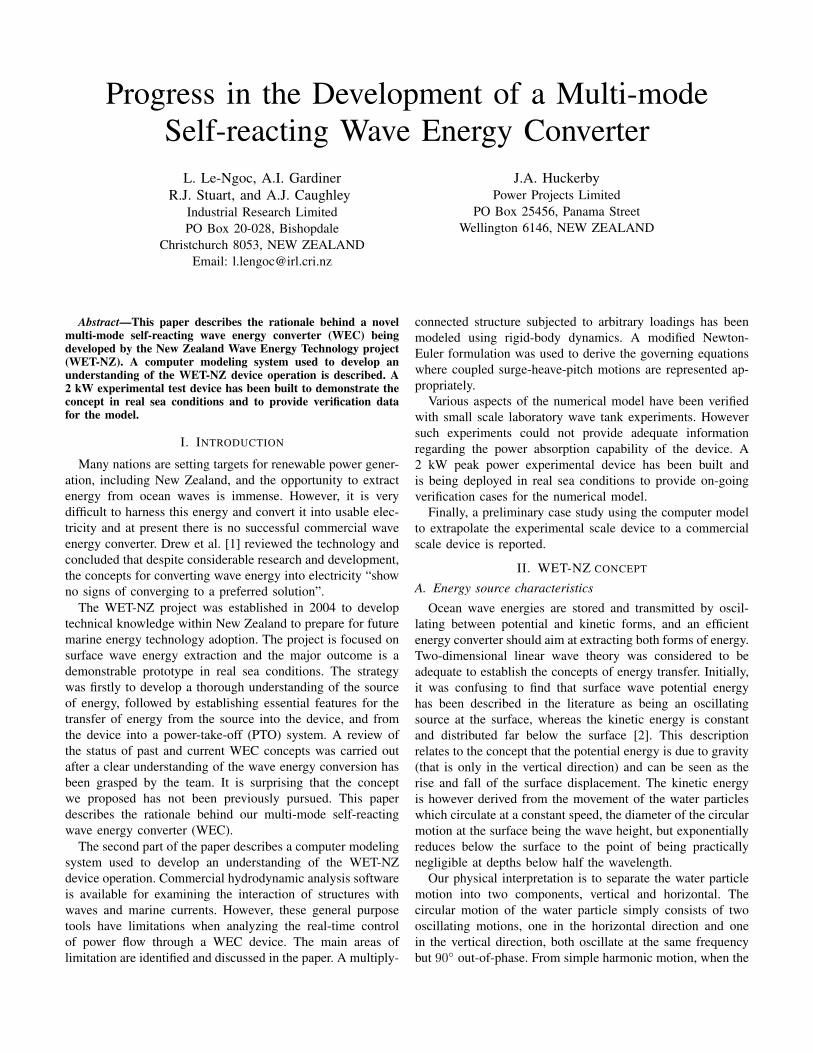
Progress in the Development of a Multi-modeSelf-reacting Wave Energy Converter
L. Le-Ngoc, A.I. GardinerR.J. Stuart, and A.J. Caughley
Industrial Research LimitedPO Box 20-028, Bishopdale
Christchurch 8053, NEW ZEALANDEmail: [email protected]
J.A. HuckerbyPower Projects Limited
PO Box 25456, Panama StreetWellington 6146, NEW ZEALAND
Abstract—This paper describes the rationale behind a novelmulti-mode self-reacting wave energy converter (WEC) beingdeveloped by the New Zealand Wave Energy Technology project(WET-NZ). A computer modeling system used to develop anunderstanding of the WET-NZ device operation is described. A2 kW experimental test device has been built to demonstrate theconcept in real sea conditions and to provide verification datafor the model.
I. INTRODUCTION
Many nations are setting targets for renewable power gener-ation, including New Zealand, and the opportunity to extractenergy from ocean waves is immense. However, it is verydifficult to harness this energy and convert it into usable elec-tricity and at present there is no successful commercial waveenergy converter. Drew et al. [1] reviewed the technology andconcluded that despite considerable research and development,the concepts for converting wave energy into electricity “showno signs of converging to a preferred solution”.
The WET-NZ project was established in 2004 to developtechnical knowledge within New Zealand to prepare for futuremarine energy technology adoption. The project is focused onsurface wave energy extraction and the major outcome is ademonstrable prototype in real sea conditions. The strategywas firstly to develop a thorough understanding of the sourceof energy, followed by establishing essential features for thetransfer of energy from the source into the device, and fromthe device into a power-take-off (PTO) system. A review ofthe status of past and current WEC concepts was carried outafter a clear understanding of the wave energy conversion hasbeen grasped by the team. It is surprising that the conceptwe proposed has not been previously pursued. This paperdescribes the rationale behind our multi-mode self-reactingwave energy converter (WEC).
The second part of the paper describes a computer modelingsystem used to develop an understanding of the WET-NZdevice operation. Commercial hydrodynamic analysis softwareis available for examining the interaction of structures withwaves and marine currents. However, these general purposetools have limitations when analyzing the real-time controlof power flow through a WEC device. The main areas oflimitation are identified and discussed in the paper. A multiply-
connected structure subjected to arbitrary loadings has beenmodeled using rigid-body dynamics. A modified Newton-Euler formulation was used to derive the governing equationswhere coupled surge-heave-pitch motions are represented ap-propriately.
Various aspects of the numerical model have been verifiedwith small scale laboratory wave tank experiments. Howeversuch experiments could not provide adequate informationregarding the power absorption capability of the device. A2 kW peak power experimental device has been built andis being deployed in real sea conditions to provide on-goingverification cases for the numerical model.
Finally, a preliminary case study using the computer modelto extrapolate the experimental scale device to a commercialscale device is reported.
II. WET-NZ CONCEPT
A. Energy source characteristics
Ocean wave energies are stored and transmitted by oscil-lating between potential and kinetic forms, and an efficientenergy converter should aim at extracting both forms of energy.Two-dimensional linear wave theory was considered to beadequate to establish the concepts of energy transfer. Initially,it was confusing to find that surface wave potential energyhas been described in the literature as being an oscillatingsource at the surface, whereas the kinetic energy is constantand distributed far below the surface [2]. This descriptionrelates to the concept that the potential energy is due to gravity(that is only in the vertical direction) and can be seen as therise and fall of the surface displacement. The kinetic energyis however derived from the movement of the water particleswhich circulate at a constant speed, the diameter of the circularmotion at the surface being the wave height, but exponentiallyreduces below the surface to the point of being practicallynegligible at depths below half the wavelength.
Our physical interpretation is to separate the water particlemotion into two components, vertical and horizontal. Thecircular motion of the water particle simply consists of twooscillating motions, one in the horizontal direction and onein the vertical direction, both oscillate at the same frequencybut 90◦ out-of-phase. From simple harmonic motion, when the
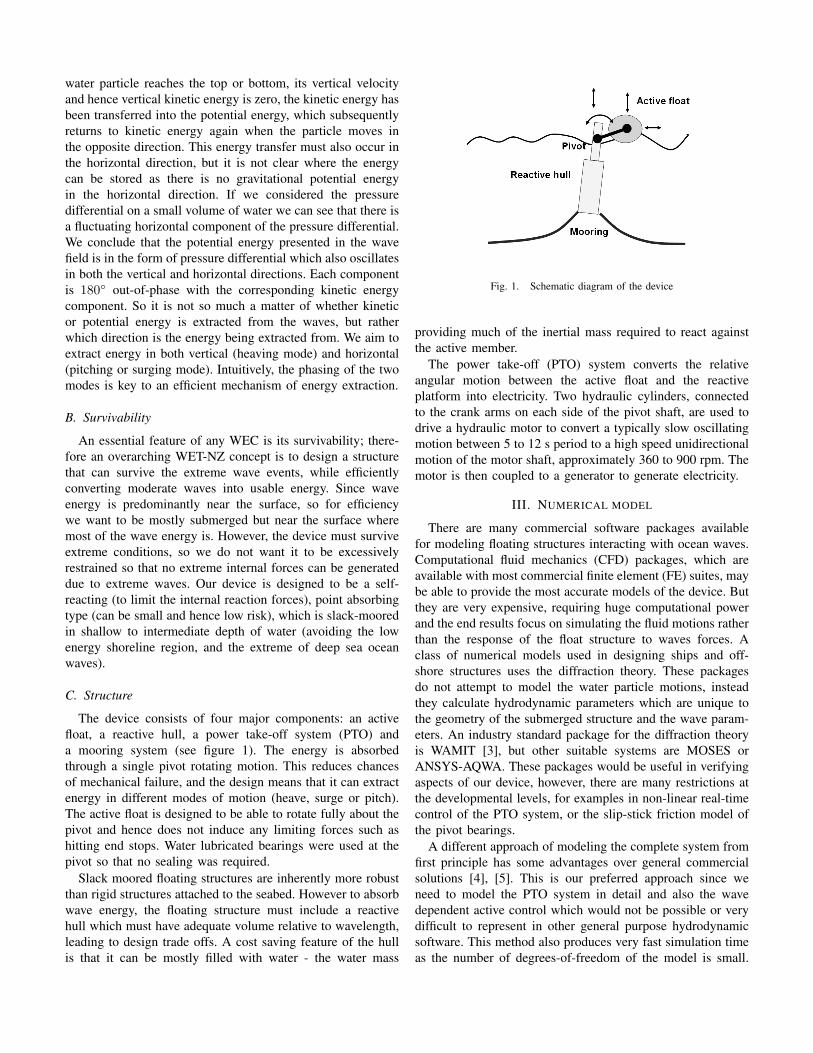
water particle reaches the top or bottom, its vertical velocityand hence vertical kinetic energy is zero, the kinetic energy hasbeen transferred into the potential energy, which subsequentlyreturns to kinetic energy again when the particle moves inthe opposite direction. This energy transfer must also occur inthe horizontal direction, but it is not clear where the energycan be stored as there is no gravitational potential energyin the horizontal direction. If we considered the pressuredifferential on a small volume of water we can see that there isa fluctuating horizontal component of the pressure differential.We conclude that the potential energy presented in the wavefield is in the form of pressure differential which also oscillatesin both the vertical and horizontal directions. Each componentis 180◦ out-of-phase with the corresponding kinetic energycomponent. So it is not so much a matter of whether kineticor potential energy is extracted from the waves, but ratherwhich direction is the energy being extracted from. We aim toextract energy in both vertical (heaving mode) and horizontal(pitching or surging mode). Intuitively, the phasing of the twomodes is key to an efficient mechanism of energy extraction.
B. Survivability
An essential feature of any WEC is its survivability; there-fore an overarching WET-NZ concept is to design a structurethat can survive the extreme wave events, while efficientlyconverting moderate waves into usable energy. Since waveenergy is predominantly near the surface, so for efficiencywe want to be mostly submerged but near the surface wheremost of the wave energy is. However, the device must surviveextreme conditions, so we do not want it to be excessivelyrestrained so that no extreme internal forces can be generateddue to extreme waves. Our device is designed to be a self-reacting (to limit the internal reaction forces), point absorbingtype (can be small and hence low risk), which is slack-mooredin shallow to intermediate depth of water (avoiding the lowenergy shoreline region, and the extreme of deep sea oceanwaves).
C. Structure
The device consists of four major components: an activefloat, a reactive hull, a power take-off system (PTO) anda mooring system (see figure 1). The energy is absorbedthrough a single pivot rotating motion. This reduces chancesof mechanical failure, and the design means that it can extractenergy in different modes of motion (heave, surge or pitch).The active float is designed to be able to rotate fully about thepivot and hence does not induce any limiting forces such ashitting end stops. Water lubricated bearings were used at thepivot so that no sealing was required.
Slack moored floating structures are inherently more robustthan rigid structures attached to the seabed. However to absorbwave energy, the floating structure must include a reactivehull which must have adequate volume relative to wavelength,leading to design trade offs. A cost saving feature of the hullis that it can be mostly filled with water - the water mass
Fig. 1. Schematic diagram of the device
providing much of the inertial mass required to react againstthe active member.
The power take-off (PTO) system converts the relativeangular motion between the active float and the reactiveplatform into electricity. Two hydraulic cylinders, connectedto the crank arms on each side of the pivot shaft, are used todrive a hydraulic motor to convert a typically slow oscillatingmotion between 5 to 12 s period to a high speed unidirectionalmotion of the motor shaft, approximately 360 to 900 rpm. Themotor is then coupled to a generator to generate electricity.
III. NUMERICAL MODEL
There are many commercial software packages availablefor modeling floating structures interacting with ocean waves.Computational fluid mechanics (CFD) packages, which areavailable with most commercial finite element (FE) suites, maybe able to provide the most accurate models of the device. Butthey are very expensive, requiring huge computational powerand the end results focus on simulating the fluid motions ratherthan the response of the float structure to waves forces. Aclass of numerical models used in designing ships and off-shore structures uses the diffraction theory. These packagesdo not attempt to model the water particle motions, insteadthey calculate hydrodynamic parameters which are unique tothe geometry of the submerged structure and the wave param-eters. An industry standard package for the diffraction theoryis WAMIT [3], but other suitable systems are MOSES orANSYS-AQWA. These packages would be useful in verifyingaspects of our device, however, there are many restrictions atthe developmental levels, for examples in non-linear real-timecontrol of the PTO system, or the slip-stick friction model ofthe pivot bearings.
A different approach of modeling the complete system fromfirst principle has some advantages over general commercialsolutions [4], [5]. This is our preferred approach since weneed to model the PTO system in detail and also the wavedependent active control which would not be possible or verydifficult to represent in other general purpose hydrodynamicsoftware. This method also produces very fast simulation timeas the number of degrees-of-freedom of the model is small.
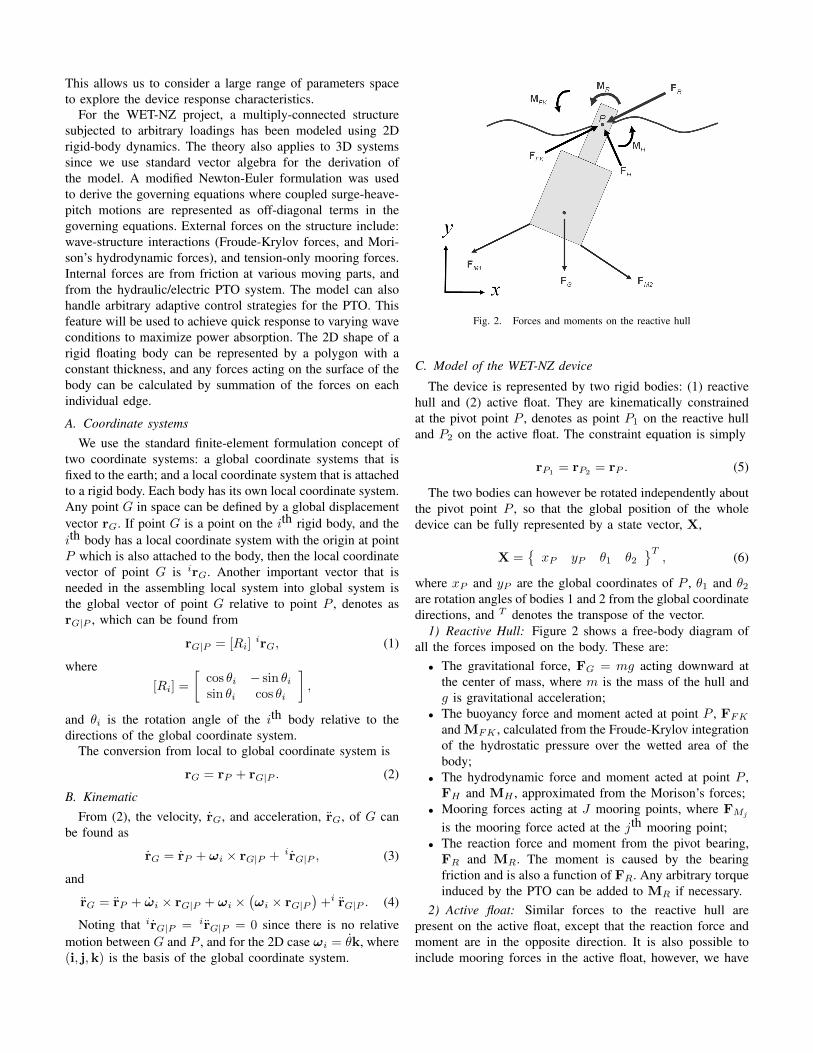
This allows us to consider a large range of parameters spaceto explore the device response characteristics.
For the WET-NZ project, a multiply-connected structuresubjected to arbitrary loadings has been modeled using 2Drigid-body dynamics. The theory also applies to 3D systemssince we use standard vector algebra for the derivation ofthe model. A modified Newton-Euler formulation was usedto derive the governing equations where coupled surge-heave-pitch motions are represented as off-diagonal terms in thegoverning equations. External forces on the structure include:wave-structure interactions (Froude-Krylov forces, and Mori-son’s hydrodynamic forces), and tension-only mooring forces.Internal forces are from friction at various moving parts, andfrom the hydraulic/electric PTO system. The model can alsohandle arbitrary adaptive control strategies for the PTO. Thisfeature will be used to achieve quick response to varying waveconditions to maximize power absorption. The 2D shape of arigid floating body can be represented by a polygon with aconstant thickness, and any forces acting on the surface of thebody can be calculated by summation of the forces on eachindividual edge.
A. Coordinate systemsWe use the standard finite-element formulation concept of
two coordinate systems: a global coordinate systems that isfixed to the earth; and a local coordinate system that is attachedto a rigid body. Each body has its own local coordinate system.Any point G in space can be defined by a global displacementvector rG. If point G is a point on the ith rigid body, and theith body has a local coordinate system with the origin at pointP which is also attached to the body, then the local coordinatevector of point G is irG. Another important vector that isneeded in the assembling local system into global system isthe global vector of point G relative to point P , denotes asrG|P , which can be found from
rG|P = [Ri]irG, (1)
where[Ri] =
[cos θi − sin θisin θi cos θi
],
and θi is the rotation angle of the ith body relative to thedirections of the global coordinate system.
The conversion from local to global coordinate system is
rG = rP + rG|P . (2)
B. KinematicFrom (2), the velocity, rG, and acceleration, rG, of G can
be found as
rG = rP + ωi × rG|P + irG|P , (3)
and
rG = rP + ωi × rG|P + ωi ×(ωi × rG|P
)+i rG|P . (4)
Noting that irG|P = irG|P = 0 since there is no relativemotion between G and P , and for the 2D case ωi = θk, where(i, j,k) is the basis of the global coordinate system.
Fig. 2. Forces and moments on the reactive hull
C. Model of the WET-NZ device
The device is represented by two rigid bodies: (1) reactivehull and (2) active float. They are kinematically constrainedat the pivot point P , denotes as point P1 on the reactive hulland P2 on the active float. The constraint equation is simply
rP1= rP2
= rP . (5)
The two bodies can however be rotated independently aboutthe pivot point P , so that the global position of the wholedevice can be fully represented by a state vector, X,
X ={xP yP θ1 θ2
}T, (6)
where xP and yP are the global coordinates of P , θ1 and θ2are rotation angles of bodies 1 and 2 from the global coordinatedirections, and T denotes the transpose of the vector.
1) Reactive Hull: Figure 2 shows a free-body diagram ofall the forces imposed on the body. These are:• The gravitational force, FG = mg acting downward at
the center of mass, where m is the mass of the hull andg is gravitational acceleration;
• The buoyancy force and moment acted at point P , FFK
and MFK , calculated from the Froude-Krylov integrationof the hydrostatic pressure over the wetted area of thebody;
• The hydrodynamic force and moment acted at point P ,FH and MH , approximated from the Morison’s forces;
• Mooring forces acting at J mooring points, where FMj
is the mooring force acted at the jth mooring point;• The reaction force and moment from the pivot bearing,
FR and MR. The moment is caused by the bearingfriction and is also a function of FR. Any arbitrary torqueinduced by the PTO can be added to MR if necessary.
2) Active float: Similar forces to the reactive hull arepresent on the active float, except that the reaction force andmoment are in the opposite direction. It is also possible toinclude mooring forces in the active float, however, we have
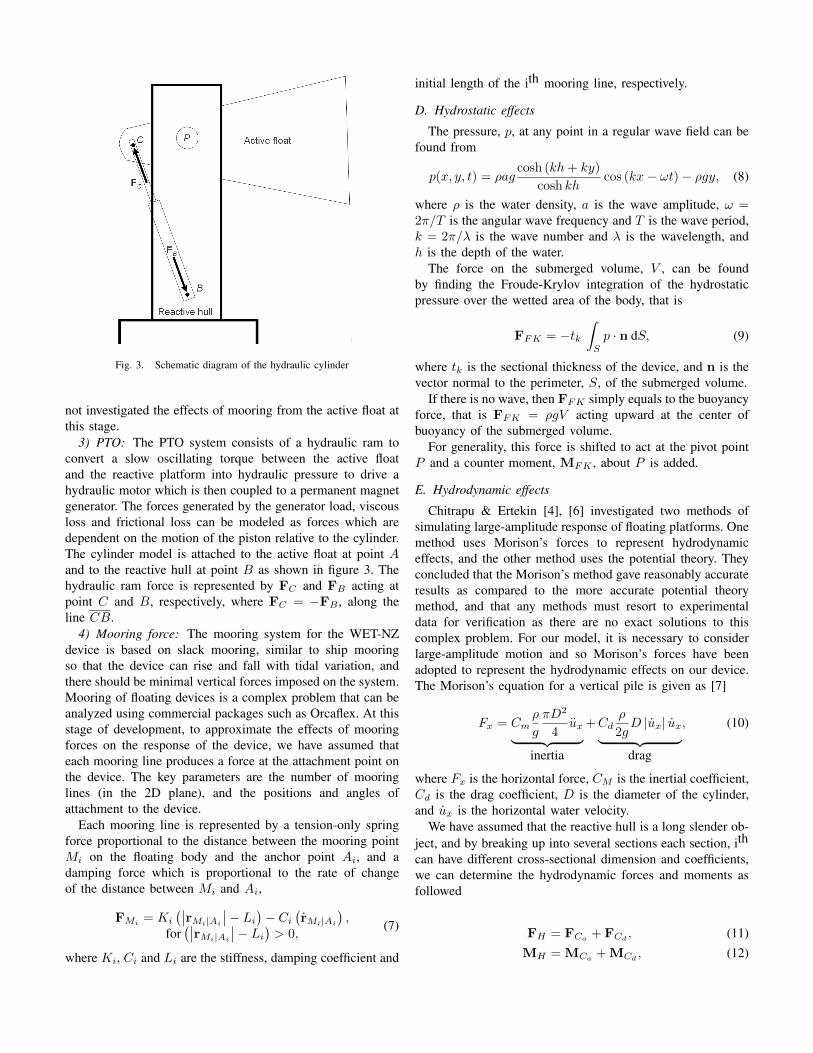
Fig. 3. Schematic diagram of the hydraulic cylinder
not investigated the effects of mooring from the active float atthis stage.
3) PTO: The PTO system consists of a hydraulic ram toconvert a slow oscillating torque between the active floatand the reactive platform into hydraulic pressure to drive ahydraulic motor which is then coupled to a permanent magnetgenerator. The forces generated by the generator load, viscousloss and frictional loss can be modeled as forces which aredependent on the motion of the piston relative to the cylinder.The cylinder model is attached to the active float at point Aand to the reactive hull at point B as shown in figure 3. Thehydraulic ram force is represented by FC and FB acting atpoint C and B, respectively, where FC = −FB , along theline CB.
4) Mooring force: The mooring system for the WET-NZdevice is based on slack mooring, similar to ship mooringso that the device can rise and fall with tidal variation, andthere should be minimal vertical forces imposed on the system.Mooring of floating devices is a complex problem that can beanalyzed using commercial packages such as Orcaflex. At thisstage of development, to approximate the effects of mooringforces on the response of the device, we have assumed thateach mooring line produces a force at the attachment point onthe device. The key parameters are the number of mooringlines (in the 2D plane), and the positions and angles ofattachment to the device.
Each mooring line is represented by a tension-only springforce proportional to the distance between the mooring pointMi on the floating body and the anchor point Ai, and adamping force which is proportional to the rate of changeof the distance between Mi and Ai,
FMi= Ki
(∣∣rMi|Ai
∣∣− Li
)− Ci
(rMi|Ai
),
for(∣∣rMi|Ai
∣∣− Li
)> 0,
(7)
where Ki, Ci and Li are the stiffness, damping coefficient and
initial length of the ith mooring line, respectively.
D. Hydrostatic effects
The pressure, p, at any point in a regular wave field can befound from
p(x, y, t) = ρagcosh (kh+ ky)
cosh khcos (kx− ωt)− ρgy, (8)
where ρ is the water density, a is the wave amplitude, ω =2π/T is the angular wave frequency and T is the wave period,k = 2π/λ is the wave number and λ is the wavelength, andh is the depth of the water.
The force on the submerged volume, V , can be foundby finding the Froude-Krylov integration of the hydrostaticpressure over the wetted area of the body, that is
FFK = −tk∫S
p · n dS, (9)
where tk is the sectional thickness of the device, and n is thevector normal to the perimeter, S, of the submerged volume.
If there is no wave, then FFK simply equals to the buoyancyforce, that is FFK = ρgV acting upward at the center ofbuoyancy of the submerged volume.
For generality, this force is shifted to act at the pivot pointP and a counter moment, MFK , about P is added.
E. Hydrodynamic effects
Chitrapu & Ertekin [4], [6] investigated two methods ofsimulating large-amplitude response of floating platforms. Onemethod uses Morison’s forces to represent hydrodynamiceffects, and the other method uses the potential theory. Theyconcluded that the Morison’s method gave reasonably accurateresults as compared to the more accurate potential theorymethod, and that any methods must resort to experimentaldata for verification as there are no exact solutions to thiscomplex problem. For our model, it is necessary to considerlarge-amplitude motion and so Morison’s forces have beenadopted to represent the hydrodynamic effects on our device.The Morison’s equation for a vertical pile is given as [7]
Fx = Cmρ
g
πD2
4ux︸ ︷︷ ︸
inertia
+Cdρ
2gD |ux| ux︸ ︷︷ ︸drag
, (10)
where Fx is the horizontal force, CM is the inertial coefficient,Cd is the drag coefficient, D is the diameter of the cylinder,and ux is the horizontal water velocity.
We have assumed that the reactive hull is a long slender ob-ject, and by breaking up into several sections each section, ith
can have different cross-sectional dimension and coefficients,we can determine the hydrodynamic forces and moments asfollowed
FH = FCa+ FCd
, (11)MH = MCa
+MCd, (12)
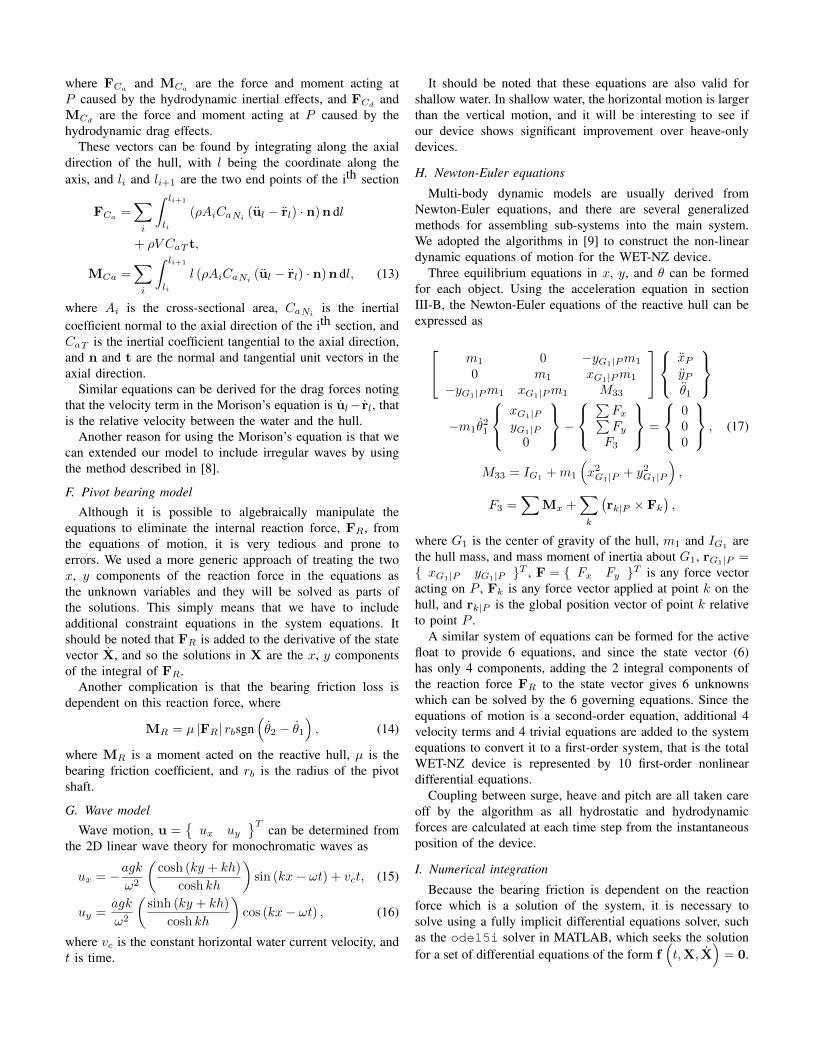
where FCaand MCa
are the force and moment acting atP caused by the hydrodynamic inertial effects, and FCd
andMCd
are the force and moment acting at P caused by thehydrodynamic drag effects.
These vectors can be found by integrating along the axialdirection of the hull, with l being the coordinate along theaxis, and li and li+1 are the two end points of the ith section
FCa=∑i
∫ li+1
li
(ρAiCaNi(ul − rl) · n)n dl
+ ρV CaT t,
MCa =∑i
∫ li+1
li
l (ρAiCaNi(ul − rl) · n)n dl, (13)
where Ai is the cross-sectional area, CaNiis the inertial
coefficient normal to the axial direction of the ith section, andCaT is the inertial coefficient tangential to the axial direction,and n and t are the normal and tangential unit vectors in theaxial direction.
Similar equations can be derived for the drag forces notingthat the velocity term in the Morison’s equation is ul− rl, thatis the relative velocity between the water and the hull.
Another reason for using the Morison’s equation is that wecan extended our model to include irregular waves by usingthe method described in [8].
F. Pivot bearing model
Although it is possible to algebraically manipulate theequations to eliminate the internal reaction force, FR, fromthe equations of motion, it is very tedious and prone toerrors. We used a more generic approach of treating the twox, y components of the reaction force in the equations asthe unknown variables and they will be solved as parts ofthe solutions. This simply means that we have to includeadditional constraint equations in the system equations. Itshould be noted that FR is added to the derivative of the statevector X, and so the solutions in X are the x, y componentsof the integral of FR.
Another complication is that the bearing friction loss isdependent on this reaction force, where
MR = µ |FR| rbsgn(θ2 − θ1
), (14)
where MR is a moment acted on the reactive hull, µ is thebearing friction coefficient, and rb is the radius of the pivotshaft.
G. Wave model
Wave motion, u ={ux uy
}Tcan be determined from
the 2D linear wave theory for monochromatic waves as
ux = −agkω2
(cosh (ky + kh)
cosh kh
)sin (kx− ωt) + vct, (15)
uy =agk
ω2
(sinh (ky + kh)
cosh kh
)cos (kx− ωt) , (16)
where vc is the constant horizontal water current velocity, andt is time.
It should be noted that these equations are also valid forshallow water. In shallow water, the horizontal motion is largerthan the vertical motion, and it will be interesting to see ifour device shows significant improvement over heave-onlydevices.
H. Newton-Euler equations
Multi-body dynamic models are usually derived fromNewton-Euler equations, and there are several generalizedmethods for assembling sub-systems into the main system.We adopted the algorithms in [9] to construct the non-lineardynamic equations of motion for the WET-NZ device.
Three equilibrium equations in x, y, and θ can be formedfor each object. Using the acceleration equation in sectionIII-B, the Newton-Euler equations of the reactive hull can beexpressed as
m1 0 −yG1|Pm1
0 m1 xG1|Pm1
−yG1|Pm1 xG1|Pm1 M33
xPyPθ1
−m1θ
21
xG1|PyG1|P0
−∑Fx∑Fy
F3
=
000
, (17)
M33 = IG1+m1
(x2G1|P + y2G1|P
),
F3 =∑
Mx +∑k
(rk|P × Fk
),
where G1 is the center of gravity of the hull, m1 and IG1 arethe hull mass, and mass moment of inertia about G1, rG1|P ={ xG1|P yG1|P }T , F = { Fx Fy }T is any force vectoracting on P , Fk is any force vector applied at point k on thehull, and rk|P is the global position vector of point k relativeto point P .
A similar system of equations can be formed for the activefloat to provide 6 equations, and since the state vector (6)has only 4 components, adding the 2 integral components ofthe reaction force FR to the state vector gives 6 unknownswhich can be solved by the 6 governing equations. Since theequations of motion is a second-order equation, additional 4velocity terms and 4 trivial equations are added to the systemequations to convert it to a first-order system, that is the totalWET-NZ device is represented by 10 first-order nonlineardifferential equations.
Coupling between surge, heave and pitch are all taken careoff by the algorithm as all hydrostatic and hydrodynamicforces are calculated at each time step from the instantaneousposition of the device.
I. Numerical integration
Because the bearing friction is dependent on the reactionforce which is a solution of the system, it is necessary tosolve using a fully implicit differential equations solver, suchas the ode15i solver in MATLAB, which seeks the solutionfor a set of differential equations of the form f
(t,X, X
)= 0.
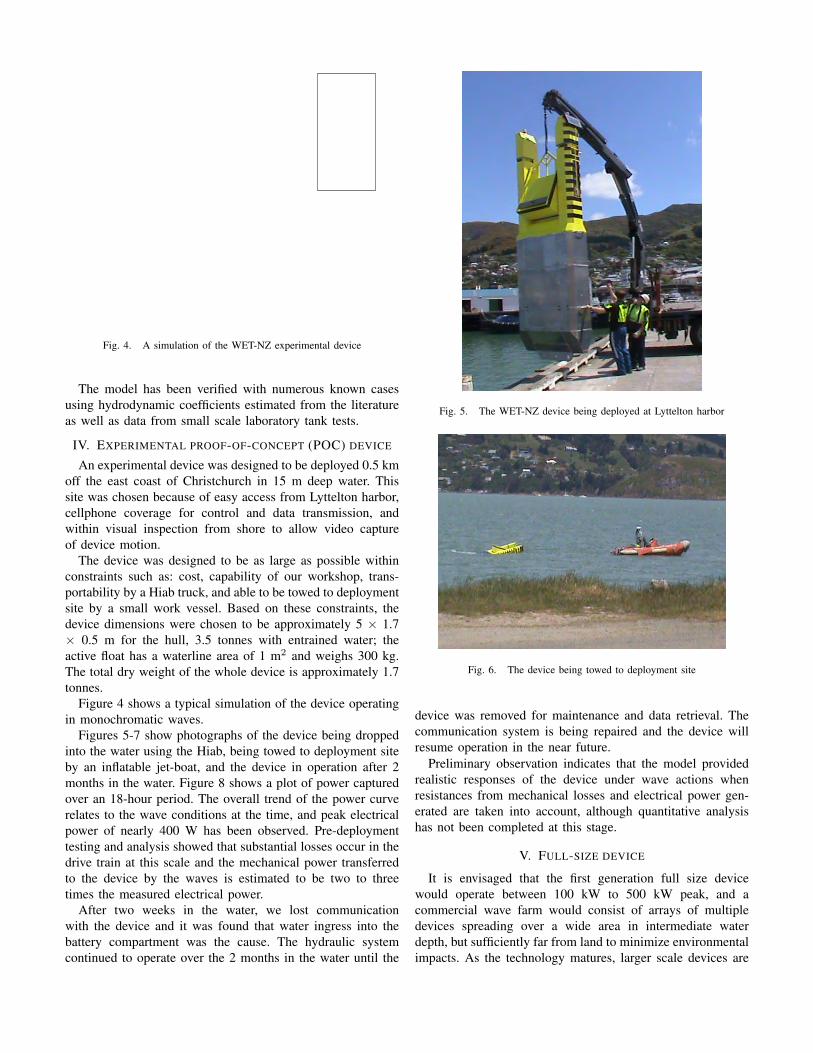
Fig. 4. A simulation of the WET-NZ experimental device
The model has been verified with numerous known casesusing hydrodynamic coefficients estimated from the literatureas well as data from small scale laboratory tank tests.
IV. EXPERIMENTAL PROOF-OF-CONCEPT (POC) DEVICE
An experimental device was designed to be deployed 0.5 kmoff the east coast of Christchurch in 15 m deep water. Thissite was chosen because of easy access from Lyttelton harbor,cellphone coverage for control and data transmission, andwithin visual inspection from shore to allow video captureof device motion.
The device was designed to be as large as possible withinconstraints such as: cost, capability of our workshop, trans-portability by a Hiab truck, and able to be towed to deploymentsite by a small work vessel. Based on these constraints, thedevice dimensions were chosen to be approximately 5 × 1.7× 0.5 m for the hull, 3.5 tonnes with entrained water; theactive float has a waterline area of 1 m2 and weighs 300 kg.The total dry weight of the whole device is approximately 1.7tonnes.
Figure 4 shows a typical simulation of the device operatingin monochromatic waves.
Figures 5-7 show photographs of the device being droppedinto the water using the Hiab, being towed to deployment siteby an inflatable jet-boat, and the device in operation after 2months in the water. Figure 8 shows a plot of power capturedover an 18-hour period. The overall trend of the power curverelates to the wave conditions at the time, and peak electricalpower of nearly 400 W has been observed. Pre-deploymenttesting and analysis showed that substantial losses occur in thedrive train at this scale and the mechanical power transferredto the device by the waves is estimated to be two to threetimes the measured electrical power.
After two weeks in the water, we lost communicationwith the device and it was found that water ingress into thebattery compartment was the cause. The hydraulic systemcontinued to operate over the 2 months in the water until the
Fig. 5. The WET-NZ device being deployed at Lyttelton harbor
Fig. 6. The device being towed to deployment site
device was removed for maintenance and data retrieval. Thecommunication system is being repaired and the device willresume operation in the near future.
Preliminary observation indicates that the model providedrealistic responses of the device under wave actions whenresistances from mechanical losses and electrical power gen-erated are taken into account, although quantitative analysishas not been completed at this stage.
V. FULL-SIZE DEVICE
It is envisaged that the first generation full size devicewould operate between 100 kW to 500 kW peak, and acommercial wave farm would consist of arrays of multipledevices spreading over a wide area in intermediate waterdepth, but sufficiently far from land to minimize environmentalimpacts. As the technology matures, larger scale devices are
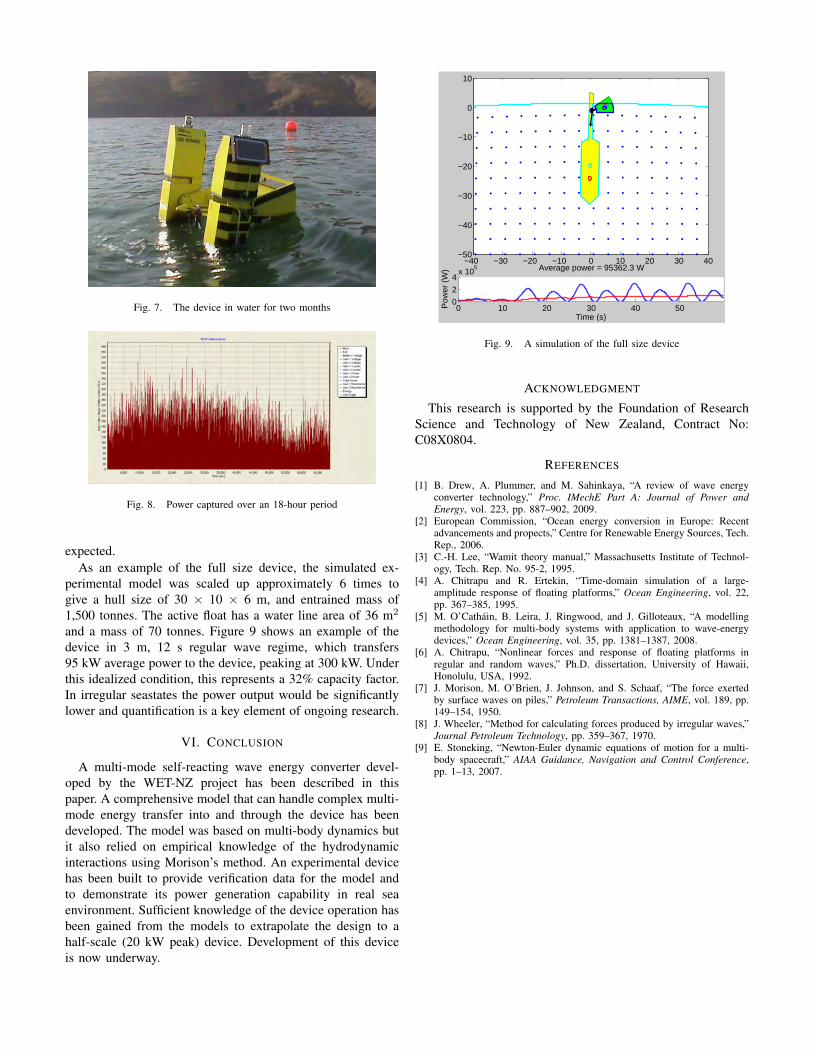
Fig. 7. The device in water for two months
Fig. 8. Power captured over an 18-hour period
expected.As an example of the full size device, the simulated ex-
perimental model was scaled up approximately 6 times togive a hull size of 30 × 10 × 6 m, and entrained mass of1,500 tonnes. The active float has a water line area of 36 m2
and a mass of 70 tonnes. Figure 9 shows an example of thedevice in 3 m, 12 s regular wave regime, which transfers95 kW average power to the device, peaking at 300 kW. Underthis idealized condition, this represents a 32% capacity factor.In irregular seastates the power output would be significantlylower and quantification is a key element of ongoing research.
VI. CONCLUSION
A multi-mode self-reacting wave energy converter devel-oped by the WET-NZ project has been described in thispaper. A comprehensive model that can handle complex multi-mode energy transfer into and through the device has beendeveloped. The model was based on multi-body dynamics butit also relied on empirical knowledge of the hydrodynamicinteractions using Morison’s method. An experimental devicehas been built to provide verification data for the model andto demonstrate its power generation capability in real seaenvironment. Sufficient knowledge of the device operation hasbeen gained from the models to extrapolate the design to ahalf-scale (20 kW peak) device. Development of this deviceis now underway.
−40 −30 −20 −10 0 10 20 30 40−50
−40
−30
−20
−10
0
10
0 10 20 30 40 500
2
4x 10
5 Average power = 95362.3 W
Pow
er
(W)
Time (s)
Fig. 9. A simulation of the full size device
ACKNOWLEDGMENT
This research is supported by the Foundation of ResearchScience and Technology of New Zealand, Contract No:C08X0804.
REFERENCES
[1] B. Drew, A. Plummer, and M. Sahinkaya, “A review of wave energyconverter technology,” Proc. IMechE Part A: Journal of Power andEnergy, vol. 223, pp. 887–902, 2009.
[2] European Commission, “Ocean energy conversion in Europe: Recentadvancements and propects,” Centre for Renewable Energy Sources, Tech.Rep., 2006.
[3] C.-H. Lee, “Wamit theory manual,” Massachusetts Institute of Technol-ogy, Tech. Rep. No. 95-2, 1995.
[4] A. Chitrapu and R. Ertekin, “Time-domain simulation of a large-amplitude response of floating platforms,” Ocean Engineering, vol. 22,pp. 367–385, 1995.
[5] M. O’Cathain, B. Leira, J. Ringwood, and J. Gilloteaux, “A modellingmethodology for multi-body systems with application to wave-energydevices,” Ocean Engineering, vol. 35, pp. 1381–1387, 2008.
[6] A. Chitrapu, “Nonlinear forces and response of floating platforms inregular and random waves,” Ph.D. dissertation, University of Hawaii,Honolulu, USA, 1992.
[7] J. Morison, M. O’Brien, J. Johnson, and S. Schaaf, “The force exertedby surface waves on piles,” Petroleum Transactions, AIME, vol. 189, pp.149–154, 1950.
[8] J. Wheeler, “Method for calculating forces produced by irregular waves,”Journal Petroleum Technology, pp. 359–367, 1970.
[9] E. Stoneking, “Newton-Euler dynamic equations of motion for a multi-body spacecraft,” AIAA Guidance, Navigation and Control Conference,pp. 1–13, 2007.

Final Scientific Technical Report DE-EE0003642
31 | P a g e
APPENDIX C – REGULATORY ROADMAP
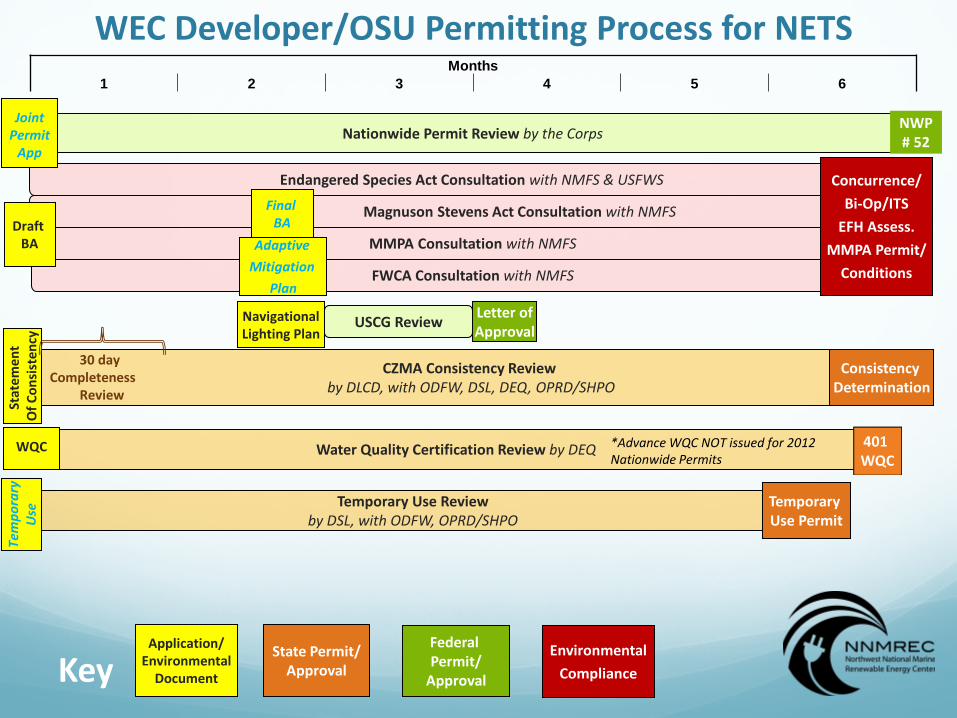
Endangered Species Act Consultation with NMFS & USFWS
Magnuson Stevens Act Consultation with NMFS
MMPA Consultation with NMFS
FWCA Consultation with NMFS
WEC Developer/OSU Permitting Process for NETS
CZMA Consistency Review by DLCD, with ODFW, DSL, DEQ, OPRD/SHPO
Water Quality Certification Review by DEQ
USCG Review
Temporary Use Review by DSL, with ODFW, OPRD/SHPO
Months 1 2 3 4 5 6
Nationwide Permit Review by the Corps NWP # 52
Stat
emen
t O
f Con
sist
ency
30 day Completeness Review
Consistency Determination
401 WQC
Letter of Approval
Temporary Use Permit
Tem
pora
ry
Use
Draft BA
Concurrence/ Bi-Op/ITS
EFH Assess. MMPA Permit/
Conditions
WQC
Final BA
State Permit/ Approval
Federal Permit/
Approval
Environmental Compliance Key
Joint Permit
App
Application/ Environmental
Document
Adaptive Mitigation
Plan
Navigational Lighting Plan
*Advance WQC NOT issued for 2012 Nationwide Permits

Final Scientific Technical Report DE-EE0003642
32 | P a g e
APPENDIX D – ADDITIONAL TECHNICAL INFORMATION
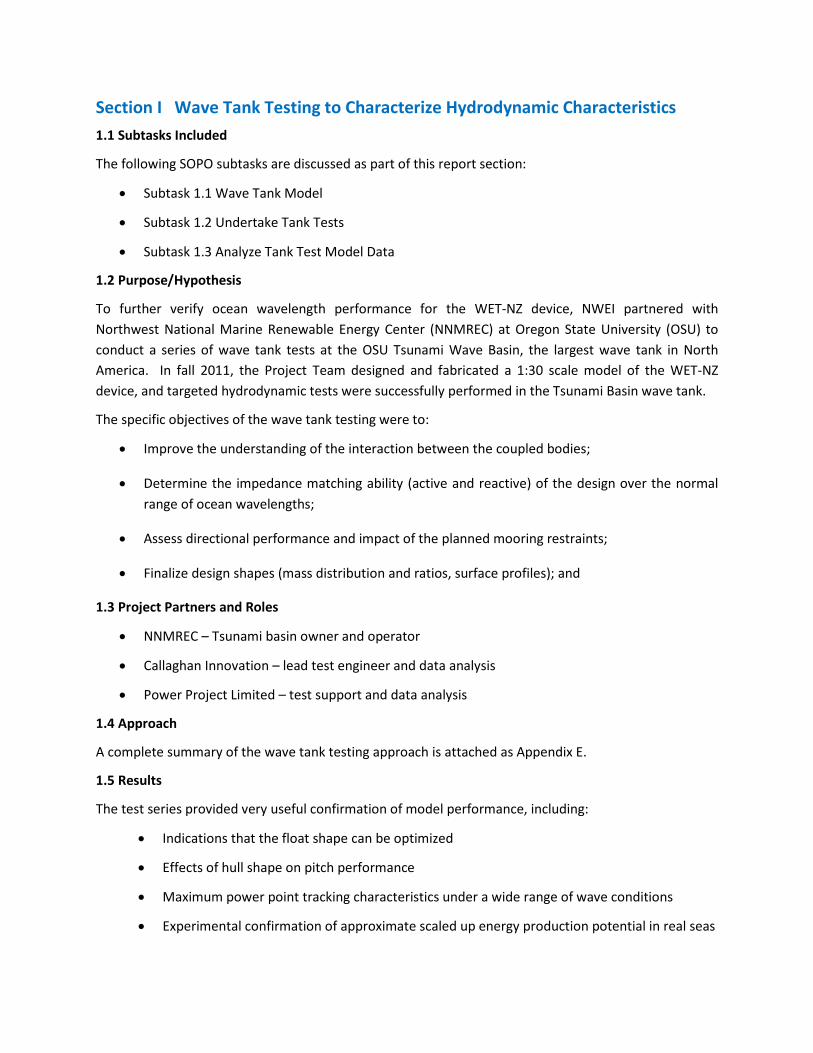
Section I Wave Tank Testing to Characterize Hydrodynamic Characteristics 1.1 Subtasks Included
The following SOPO subtasks are discussed as part of this report section:
• Subtask 1.1 Wave Tank Model
• Subtask 1.2 Undertake Tank Tests
• Subtask 1.3 Analyze Tank Test Model Data
1.2 Purpose/Hypothesis
To further verify ocean wavelength performance for the WET-NZ device, NWEI partnered with Northwest National Marine Renewable Energy Center (NNMREC) at Oregon State University (OSU) to conduct a series of wave tank tests at the OSU Tsunami Wave Basin, the largest wave tank in North America. In fall 2011, the Project Team designed and fabricated a 1:30 scale model of the WET-NZ device, and targeted hydrodynamic tests were successfully performed in the Tsunami Basin wave tank.
The specific objectives of the wave tank testing were to:
• Improve the understanding of the interaction between the coupled bodies;
• Determine the impedance matching ability (active and reactive) of the design over the normal range of ocean wavelengths;
• Assess directional performance and impact of the planned mooring restraints;
• Finalize design shapes (mass distribution and ratios, surface profiles); and
1.3 Project Partners and Roles
• NNMREC – Tsunami basin owner and operator
• Callaghan Innovation – lead test engineer and data analysis
• Power Project Limited – test support and data analysis
1.4 Approach
A complete summary of the wave tank testing approach is attached as Appendix E.
1.5 Results
The test series provided very useful confirmation of model performance, including:
• Indications that the float shape can be optimized
• Effects of hull shape on pitch performance
• Maximum power point tracking characteristics under a wide range of wave conditions
• Experimental confirmation of approximate scaled up energy production potential in real seas

• Scaled experimental confirmation of the survivability of the physical design
• Station keeping and orientation performance in a wide range of sea conditions
A complete summary of the qualitative results is attached as Appendix E.
1.6 Problems Encountered
The largest problem encountered was scheduling the OSU wave basin. This particular wave tank is used extensively for Tsunami research and is generally booked a year in advance. Originally, we had planned two rounds of testing. However, due to the schedule limitations of the tank, we were only able to do one round of testing. Further, the testing was conducted much later than desired, as the facility was not available. As a result, there was no time to analyze the data prior to designing the 1:2 scale device. Only qualitative observations were utilized to inform the design process.

Section 2 Device Design
2.1 Subtasks Included
The following SOPO subtasks are discussed as part of this report section:
• Subtask 2.1 Design PowerPod
• Subtask 2.2 Design Hull and Float
• Subtask 2.3 Design and Fabricate PTO Test Fixture
• Subtask 2.4 Redesign PowerPod
• Subtask 2.5 Redesign Hull and Float
2.2 Purpose/Hypothesis
The purpose of the tasks described above was to design a WET-NZ prototype for testing in Oregon. The design was based on previous prototypes developed by Callaghan Innovation and PPL in New Zealand. The Oregon design also leveraged the wave tank testing which was completed at OSU (see Section 1.0)
2.3 Project Partners and Roles
• Callaghan Innovation – Hull and PowerPod design and fabrication
• Oregon Iron Works – Hull design for ease of fabrication
2.4 Approach
2.4.1 WET-NZ Design Evolution
The WET-NZ wave energy converter R&D program was initiated in July 2004. The table below outlines the evolution of the WET-NZ technology as at the time of the DOE TRL 5/6 project award..
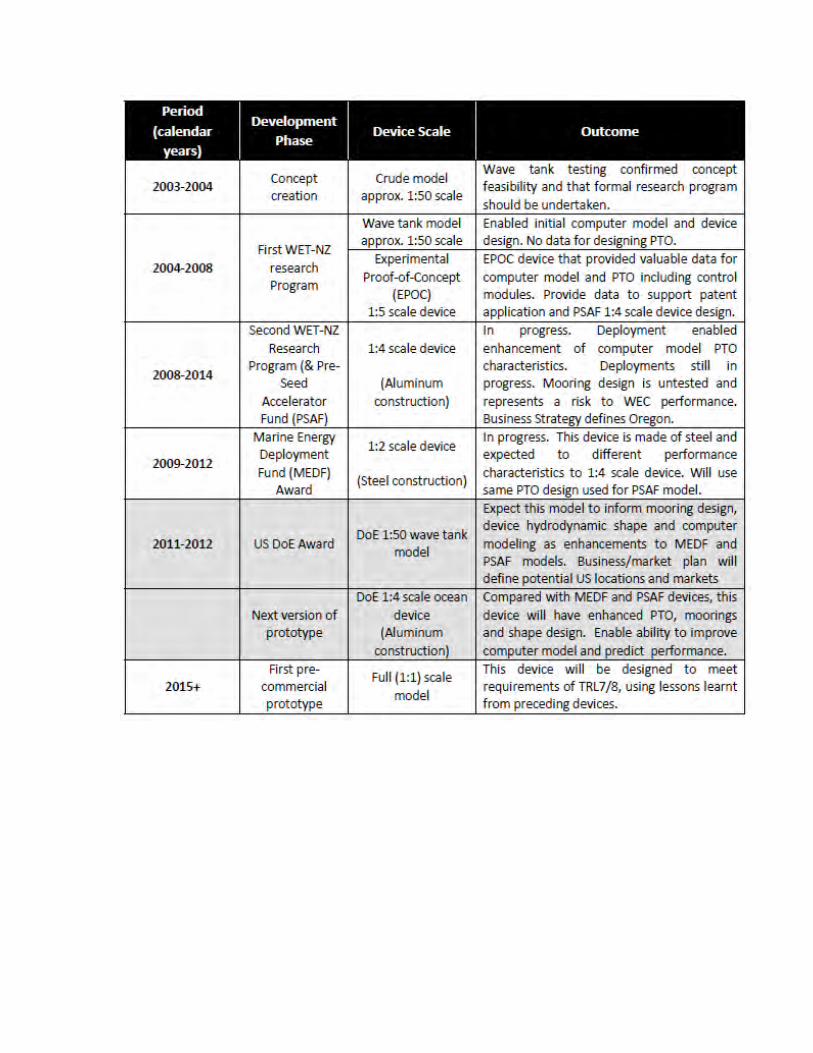
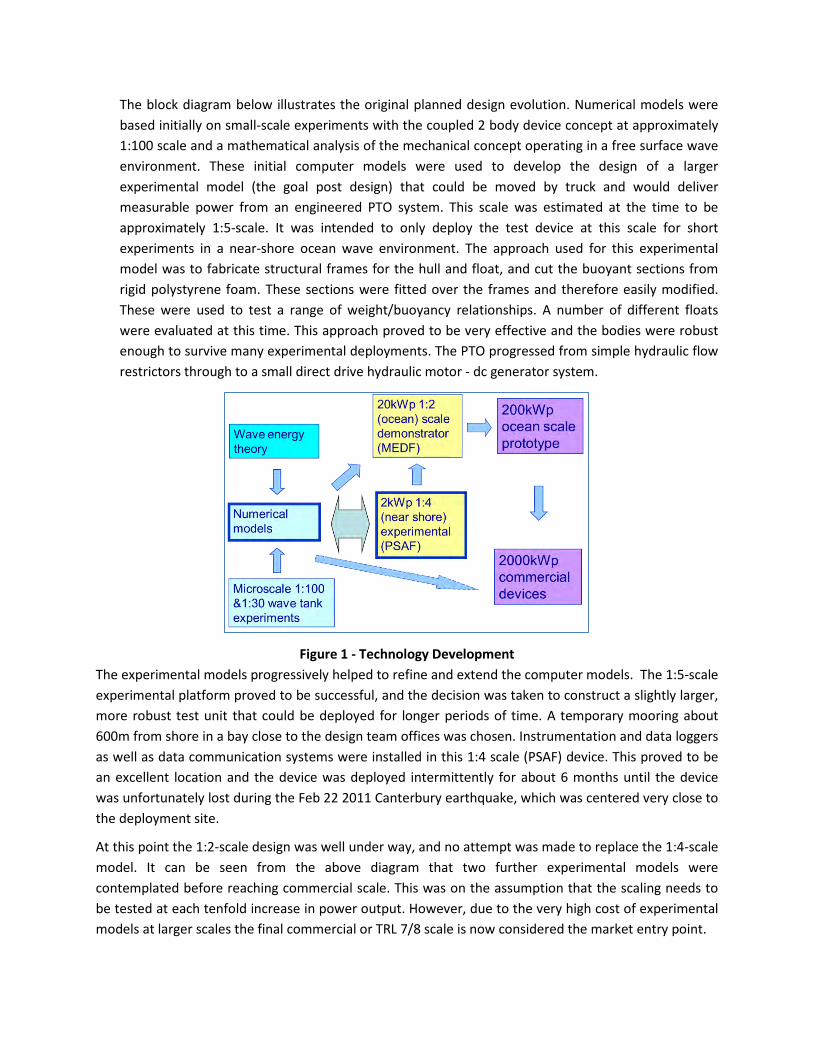
The block diagram below illustrates the original planned design evolution. Numerical models were based initially on small-scale experiments with the coupled 2 body device concept at approximately 1:100 scale and a mathematical analysis of the mechanical concept operating in a free surface wave environment. These initial computer models were used to develop the design of a larger experimental model (the goal post design) that could be moved by truck and would deliver measurable power from an engineered PTO system. This scale was estimated at the time to be approximately 1:5-scale. It was intended to only deploy the test device at this scale for short experiments in a near-shore ocean wave environment. The approach used for this experimental model was to fabricate structural frames for the hull and float, and cut the buoyant sections from rigid polystyrene foam. These sections were fitted over the frames and therefore easily modified. These were used to test a range of weight/buoyancy relationships. A number of different floats were evaluated at this time. This approach proved to be very effective and the bodies were robust enough to survive many experimental deployments. The PTO progressed from simple hydraulic flow restrictors through to a small direct drive hydraulic motor - dc generator system.
Figure 1 - Technology Development The experimental models progressively helped to refine and extend the computer models. The 1:5-scale experimental platform proved to be successful, and the decision was taken to construct a slightly larger, more robust test unit that could be deployed for longer periods of time. A temporary mooring about 600m from shore in a bay close to the design team offices was chosen. Instrumentation and data loggers as well as data communication systems were installed in this 1:4 scale (PSAF) device. This proved to be an excellent location and the device was deployed intermittently for about 6 months until the device was unfortunately lost during the Feb 22 2011 Canterbury earthquake, which was centered very close to the deployment site.
At this point the 1:2-scale design was well under way, and no attempt was made to replace the 1:4-scale model. It can be seen from the above diagram that two further experimental models were contemplated before reaching commercial scale. This was on the assumption that the scaling needs to be tested at each tenfold increase in power output. However, due to the very high cost of experimental models at larger scales the final commercial or TRL 7/8 scale is now considered the market entry point.
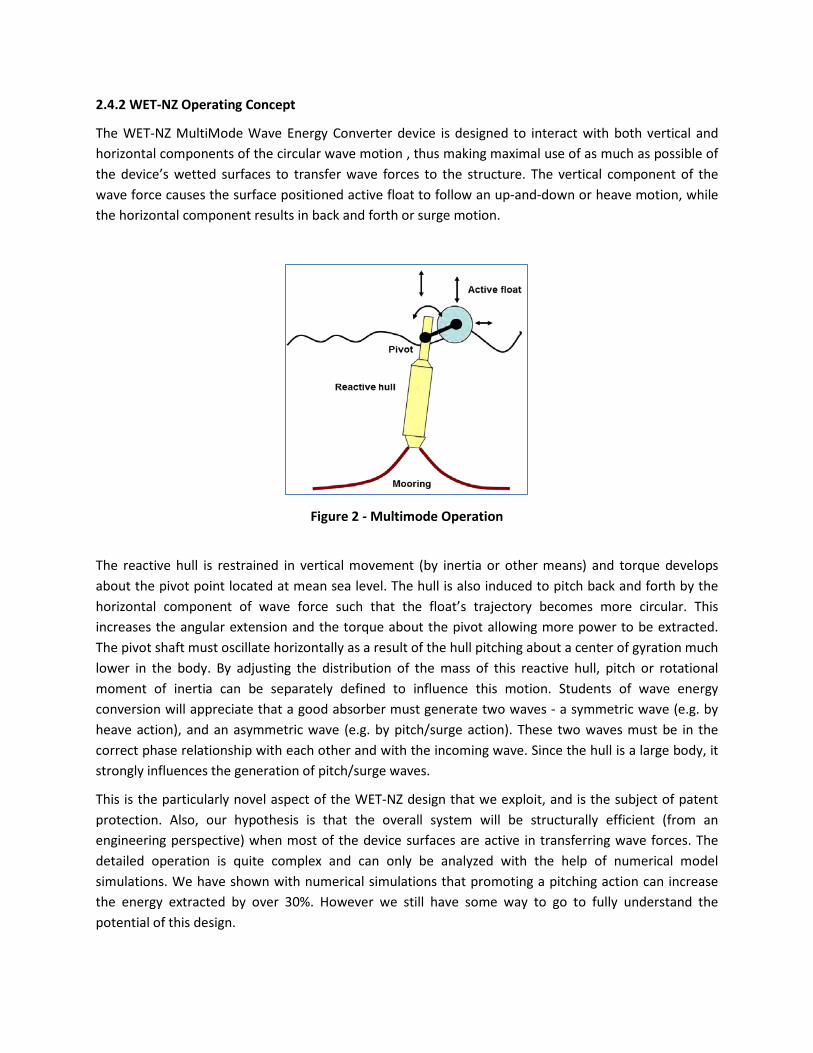
2.4.2 WET-NZ Operating Concept
The WET-NZ MultiMode Wave Energy Converter device is designed to interact with both vertical and horizontal components of the circular wave motion , thus making maximal use of as much as possible of the device’s wetted surfaces to transfer wave forces to the structure. The vertical component of the wave force causes the surface positioned active float to follow an up-and-down or heave motion, while the horizontal component results in back and forth or surge motion.
Figure 2 - Multimode Operation
The reactive hull is restrained in vertical movement (by inertia or other means) and torque develops about the pivot point located at mean sea level. The hull is also induced to pitch back and forth by the horizontal component of wave force such that the float’s trajectory becomes more circular. This increases the angular extension and the torque about the pivot allowing more power to be extracted. The pivot shaft must oscillate horizontally as a result of the hull pitching about a center of gyration much lower in the body. By adjusting the distribution of the mass of this reactive hull, pitch or rotational moment of inertia can be separately defined to influence this motion. Students of wave energy conversion will appreciate that a good absorber must generate two waves - a symmetric wave (e.g. by heave action), and an asymmetric wave (e.g. by pitch/surge action). These two waves must be in the correct phase relationship with each other and with the incoming wave. Since the hull is a large body, it strongly influences the generation of pitch/surge waves.
This is the particularly novel aspect of the WET-NZ design that we exploit, and is the subject of patent protection. Also, our hypothesis is that the overall system will be structurally efficient (from an engineering perspective) when most of the device surfaces are active in transferring wave forces. The detailed operation is quite complex and can only be analyzed with the help of numerical model simulations. We have shown with numerical simulations that promoting a pitching action can increase the energy extracted by over 30%. However we still have some way to go to fully understand the potential of this design.
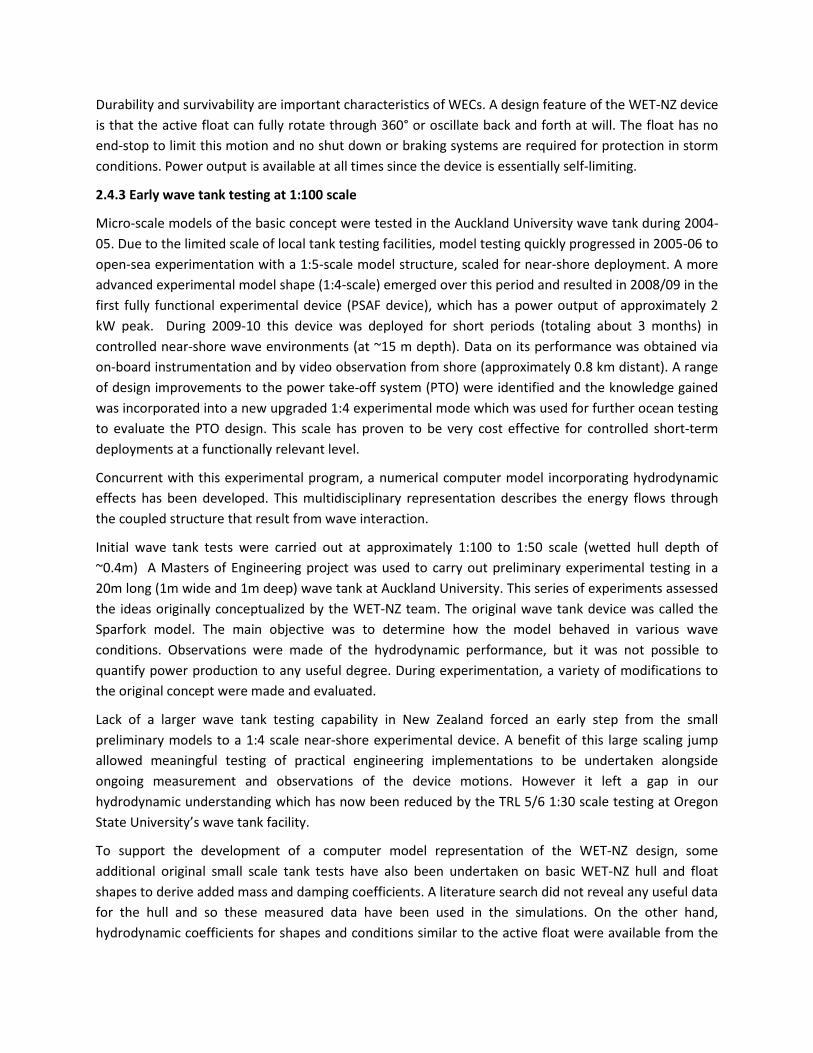
Durability and survivability are important characteristics of WECs. A design feature of the WET-NZ device is that the active float can fully rotate through 360° or oscillate back and forth at will. The float has no end-stop to limit this motion and no shut down or braking systems are required for protection in storm conditions. Power output is available at all times since the device is essentially self-limiting.
2.4.3 Early wave tank testing at 1:100 scale
Micro-scale models of the basic concept were tested in the Auckland University wave tank during 2004-05. Due to the limited scale of local tank testing facilities, model testing quickly progressed in 2005-06 to open-sea experimentation with a 1:5-scale model structure, scaled for near-shore deployment. A more advanced experimental model shape (1:4-scale) emerged over this period and resulted in 2008/09 in the first fully functional experimental device (PSAF device), which has a power output of approximately 2 kW peak. During 2009-10 this device was deployed for short periods (totaling about 3 months) in controlled near-shore wave environments (at ~15 m depth). Data on its performance was obtained via on-board instrumentation and by video observation from shore (approximately 0.8 km distant). A range of design improvements to the power take-off system (PTO) were identified and the knowledge gained was incorporated into a new upgraded 1:4 experimental mode which was used for further ocean testing to evaluate the PTO design. This scale has proven to be very cost effective for controlled short-term deployments at a functionally relevant level.
Concurrent with this experimental program, a numerical computer model incorporating hydrodynamic effects has been developed. This multidisciplinary representation describes the energy flows through the coupled structure that result from wave interaction.
Initial wave tank tests were carried out at approximately 1:100 to 1:50 scale (wetted hull depth of ~0.4m) A Masters of Engineering project was used to carry out preliminary experimental testing in a 20m long (1m wide and 1m deep) wave tank at Auckland University. This series of experiments assessed the ideas originally conceptualized by the WET-NZ team. The original wave tank device was called the Sparfork model. The main objective was to determine how the model behaved in various wave conditions. Observations were made of the hydrodynamic performance, but it was not possible to quantify power production to any useful degree. During experimentation, a variety of modifications to the original concept were made and evaluated.
Lack of a larger wave tank testing capability in New Zealand forced an early step from the small preliminary models to a 1:4 scale near-shore experimental device. A benefit of this large scaling jump allowed meaningful testing of practical engineering implementations to be undertaken alongside ongoing measurement and observations of the device motions. However it left a gap in our hydrodynamic understanding which has now been reduced by the TRL 5/6 1:30 scale testing at Oregon State University’s wave tank facility.
To support the development of a computer model representation of the WET-NZ design, some additional original small scale tank tests have also been undertaken on basic WET-NZ hull and float shapes to derive added mass and damping coefficients. A literature search did not reveal any useful data for the hull and so these measured data have been used in the simulations. On the other hand, hydrodynamic coefficients for shapes and conditions similar to the active float were available from the
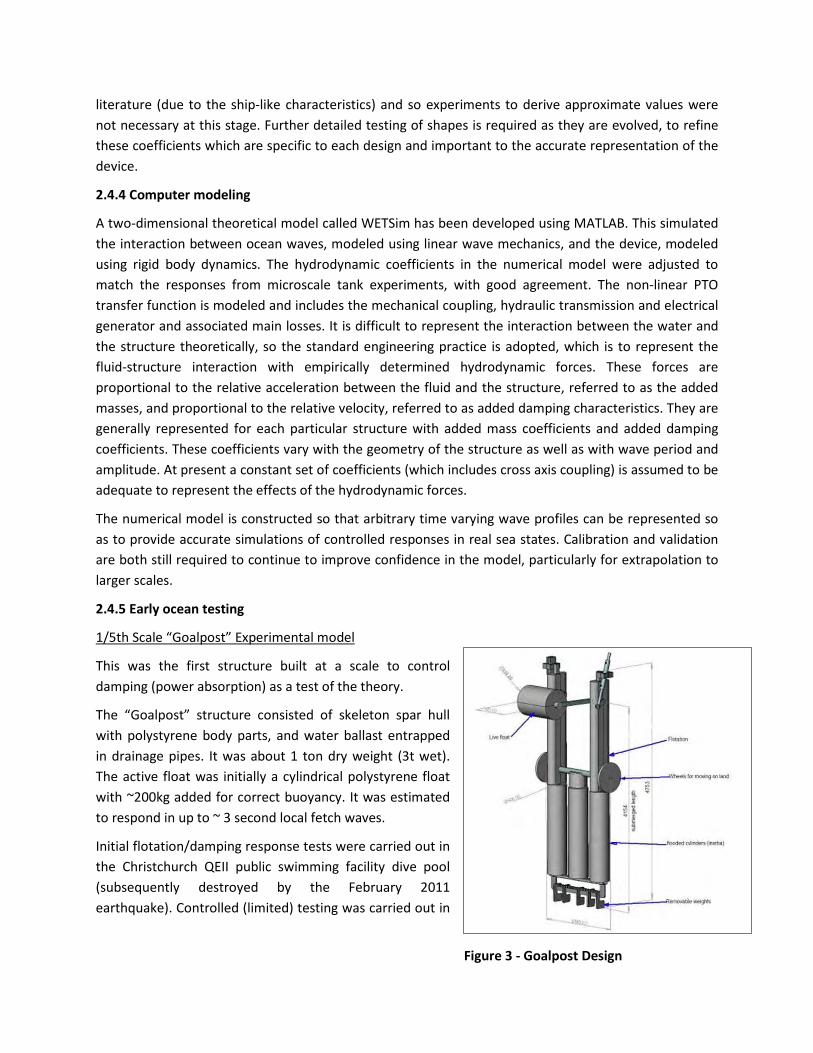
literature (due to the ship-like characteristics) and so experiments to derive approximate values were not necessary at this stage. Further detailed testing of shapes is required as they are evolved, to refine these coefficients which are specific to each design and important to the accurate representation of the device.
2.4.4 Computer modeling
A two-dimensional theoretical model called WETSim has been developed using MATLAB. This simulated the interaction between ocean waves, modeled using linear wave mechanics, and the device, modeled using rigid body dynamics. The hydrodynamic coefficients in the numerical model were adjusted to match the responses from microscale tank experiments, with good agreement. The non-linear PTO transfer function is modeled and includes the mechanical coupling, hydraulic transmission and electrical generator and associated main losses. It is difficult to represent the interaction between the water and the structure theoretically, so the standard engineering practice is adopted, which is to represent the fluid-structure interaction with empirically determined hydrodynamic forces. These forces are proportional to the relative acceleration between the fluid and the structure, referred to as the added masses, and proportional to the relative velocity, referred to as added damping characteristics. They are generally represented for each particular structure with added mass coefficients and added damping coefficients. These coefficients vary with the geometry of the structure as well as with wave period and amplitude. At present a constant set of coefficients (which includes cross axis coupling) is assumed to be adequate to represent the effects of the hydrodynamic forces.
The numerical model is constructed so that arbitrary time varying wave profiles can be represented so as to provide accurate simulations of controlled responses in real sea states. Calibration and validation are both still required to continue to improve confidence in the model, particularly for extrapolation to larger scales.
2.4.5 Early ocean testing
1/5th Scale “Goalpost” Experimental model
This was the first structure built at a scale to control damping (power absorption) as a test of the theory.
The “Goalpost” structure consisted of skeleton spar hull with polystyrene body parts, and water ballast entrapped in drainage pipes. It was about 1 ton dry weight (3t wet). The active float was initially a cylindrical polystyrene float with ~200kg added for correct buoyancy. It was estimated to respond in up to ~ 3 second local fetch waves.
Initial flotation/damping response tests were carried out in the Christchurch QEII public swimming facility dive pool (subsequently destroyed by the February 2011 earthquake). Controlled (limited) testing was carried out in
Figure 3 - Goalpost Design
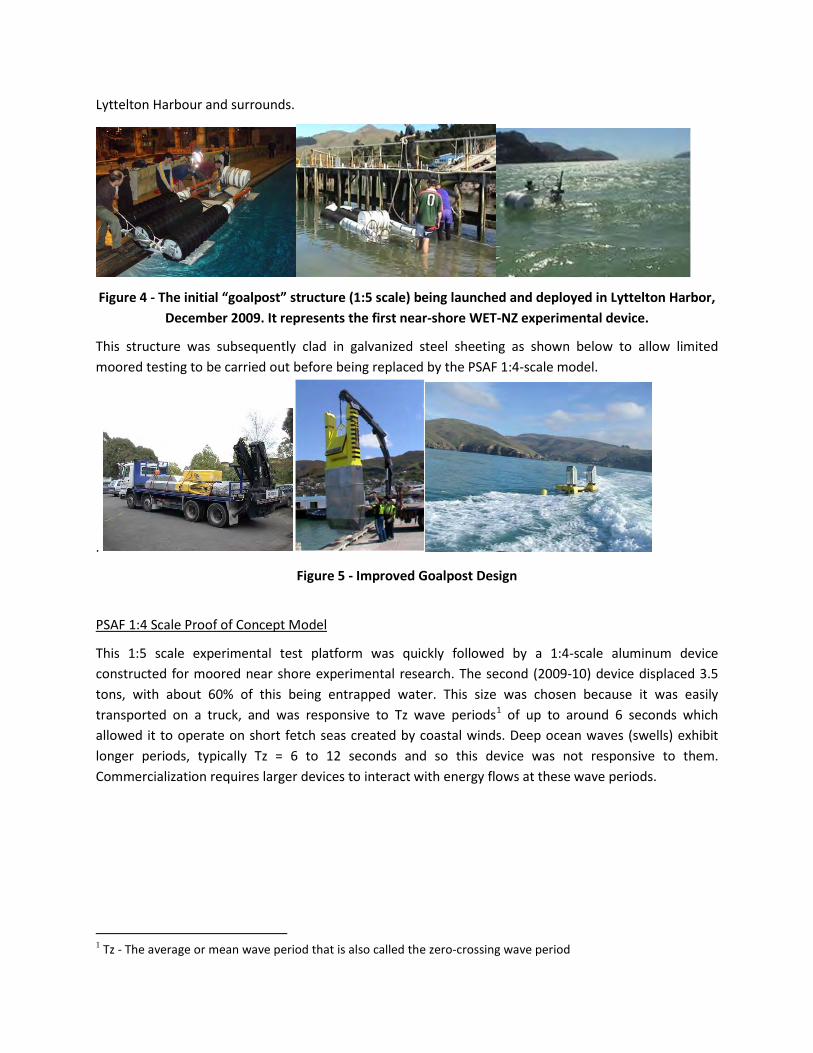
Lyttelton Harbour and surrounds.
Figure 4 - The initial “goalpost” structure (1:5 scale) being launched and deployed in Lyttelton Harbor, December 2009. It represents the first near-shore WET-NZ experimental device.
This structure was subsequently clad in galvanized steel sheeting as shown below to allow limited moored testing to be carried out before being replaced by the PSAF 1:4-scale model.
.
Figure 5 - Improved Goalpost Design
PSAF 1:4 Scale Proof of Concept Model
This 1:5 scale experimental test platform was quickly followed by a 1:4-scale aluminum device constructed for moored near shore experimental research. The second (2009-10) device displaced 3.5 tons, with about 60% of this being entrapped water. This size was chosen because it was easily transported on a truck, and was responsive to Tz wave periods1 of up to around 6 seconds which allowed it to operate on short fetch seas created by coastal winds. Deep ocean waves (swells) exhibit longer periods, typically Tz = 6 to 12 seconds and so this device was not responsive to them. Commercialization requires larger devices to interact with energy flows at these wave periods.
1 Tz - The average or mean wave period that is also called the zero-crossing wave period
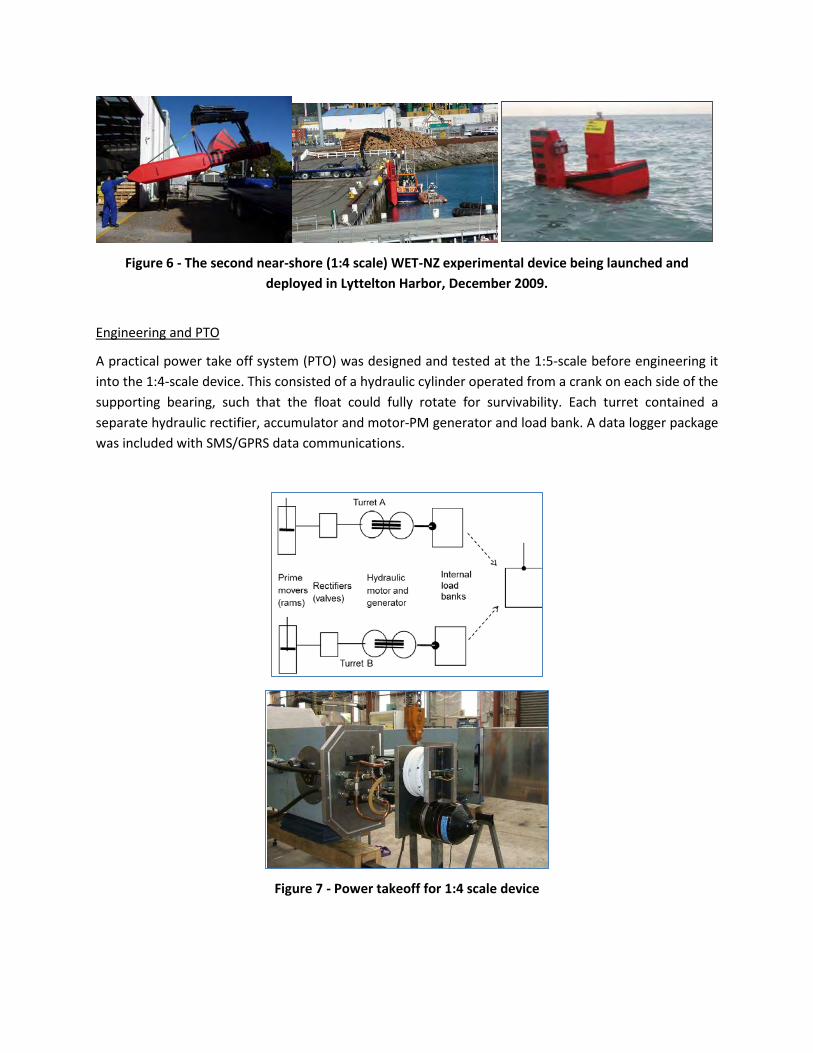
Figure 6 - The second near-shore (1:4 scale) WET-NZ experimental device being launched and deployed in Lyttelton Harbor, December 2009.
Engineering and PTO
A practical power take off system (PTO) was designed and tested at the 1:5-scale before engineering it into the 1:4-scale device. This consisted of a hydraulic cylinder operated from a crank on each side of the supporting bearing, such that the float could fully rotate for survivability. Each turret contained a separate hydraulic rectifier, accumulator and motor-PM generator and load bank. A data logger package was included with SMS/GPRS data communications.
Figure 7 - Power takeoff for 1:4 scale device
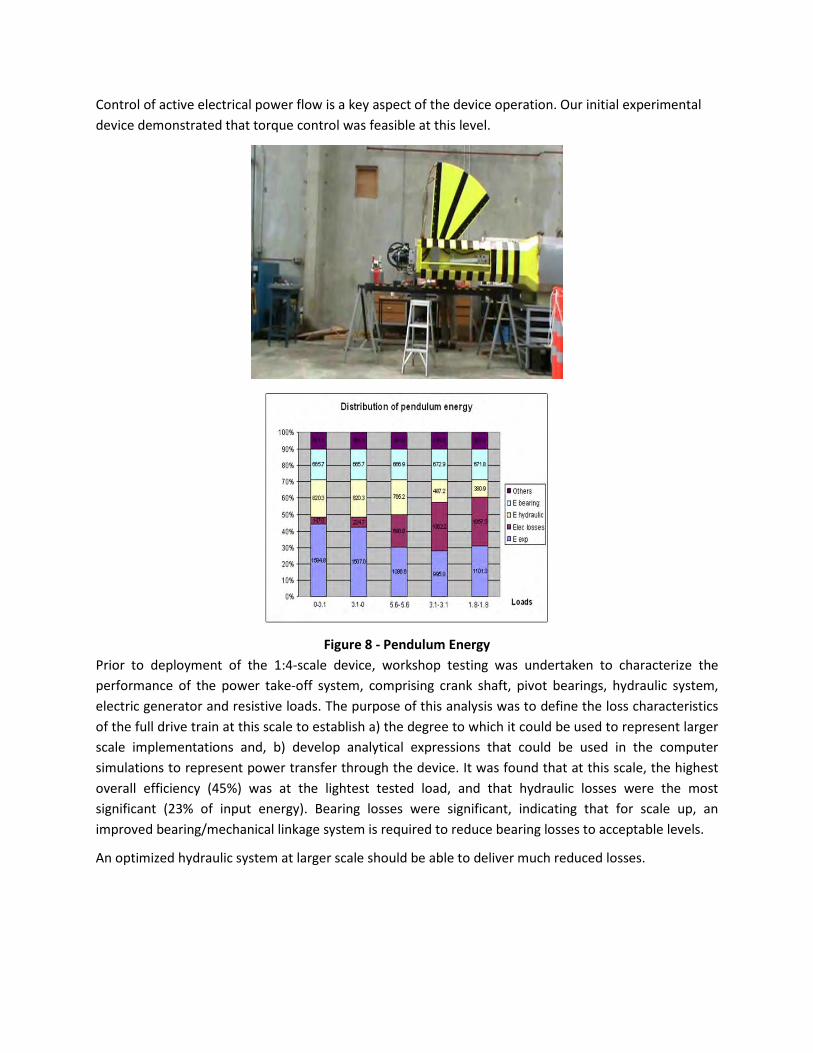
Control of active electrical power flow is a key aspect of the device operation. Our initial experimental device demonstrated that torque control was feasible at this level.
Figure 8 - Pendulum Energy Prior to deployment of the 1:4-scale device, workshop testing was undertaken to characterize the performance of the power take-off system, comprising crank shaft, pivot bearings, hydraulic system, electric generator and resistive loads. The purpose of this analysis was to define the loss characteristics of the full drive train at this scale to establish a) the degree to which it could be used to represent larger scale implementations and, b) develop analytical expressions that could be used in the computer simulations to represent power transfer through the device. It was found that at this scale, the highest overall efficiency (45%) was at the lightest tested load, and that hydraulic losses were the most significant (23% of input energy). Bearing losses were significant, indicating that for scale up, an improved bearing/mechanical linkage system is required to reduce bearing losses to acceptable levels.
An optimized hydraulic system at larger scale should be able to deliver much reduced losses.
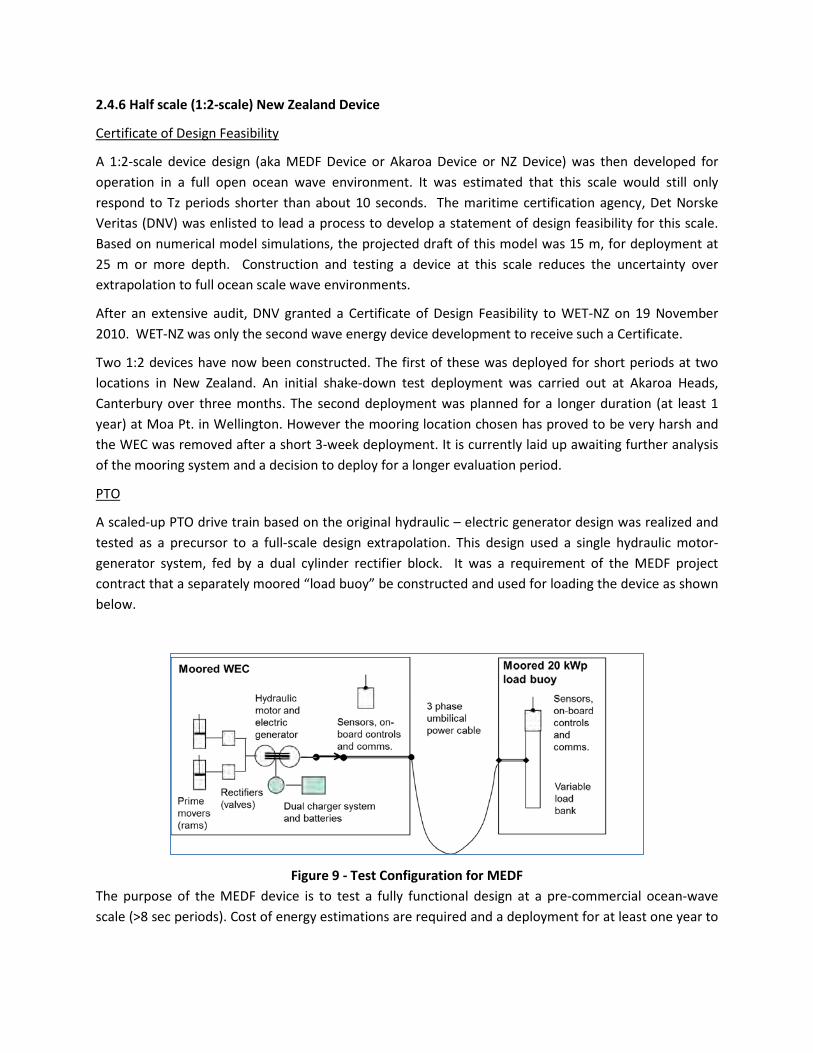
2.4.6 Half scale (1:2-scale) New Zealand Device
Certificate of Design Feasibility
A 1:2-scale device design (aka MEDF Device or Akaroa Device or NZ Device) was then developed for operation in a full open ocean wave environment. It was estimated that this scale would still only respond to Tz periods shorter than about 10 seconds. The maritime certification agency, Det Norske Veritas (DNV) was enlisted to lead a process to develop a statement of design feasibility for this scale. Based on numerical model simulations, the projected draft of this model was 15 m, for deployment at 25 m or more depth. Construction and testing a device at this scale reduces the uncertainty over extrapolation to full ocean scale wave environments.
After an extensive audit, DNV granted a Certificate of Design Feasibility to WET-NZ on 19 November 2010. WET-NZ was only the second wave energy device development to receive such a Certificate.
Two 1:2 devices have now been constructed. The first of these was deployed for short periods at two locations in New Zealand. An initial shake-down test deployment was carried out at Akaroa Heads, Canterbury over three months. The second deployment was planned for a longer duration (at least 1 year) at Moa Pt. in Wellington. However the mooring location chosen has proved to be very harsh and the WEC was removed after a short 3-week deployment. It is currently laid up awaiting further analysis of the mooring system and a decision to deploy for a longer evaluation period.
PTO
A scaled-up PTO drive train based on the original hydraulic – electric generator design was realized and tested as a precursor to a full-scale design extrapolation. This design used a single hydraulic motor-generator system, fed by a dual cylinder rectifier block. It was a requirement of the MEDF project contract that a separately moored “load buoy” be constructed and used for loading the device as shown below.
Figure 9 - Test Configuration for MEDF The purpose of the MEDF device is to test a fully functional design at a pre-commercial ocean-wave scale (>8 sec periods). Cost of energy estimations are required and a deployment for at least one year to
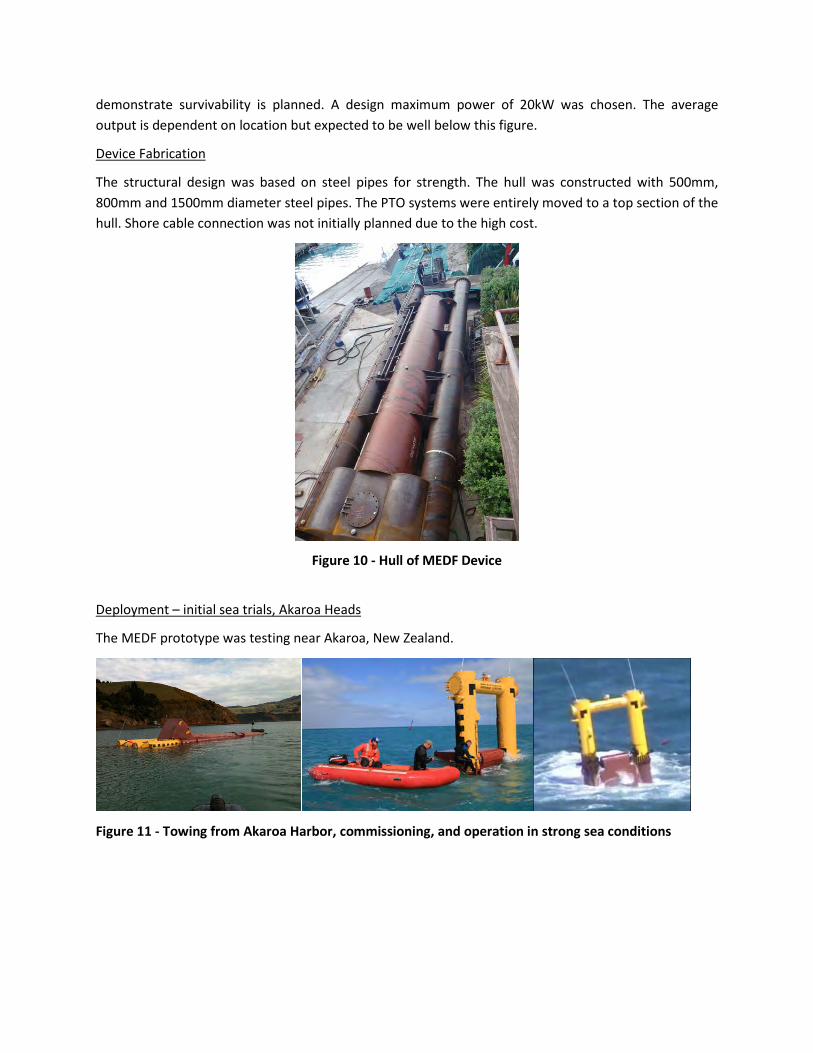
demonstrate survivability is planned. A design maximum power of 20kW was chosen. The average output is dependent on location but expected to be well below this figure.
Device Fabrication
The structural design was based on steel pipes for strength. The hull was constructed with 500mm, 800mm and 1500mm diameter steel pipes. The PTO systems were entirely moved to a top section of the hull. Shore cable connection was not initially planned due to the high cost.
Figure 10 - Hull of MEDF Device
Deployment – initial sea trials, Akaroa Heads
The MEDF prototype was testing near Akaroa, New Zealand.
Figure 11 - Towing from Akaroa Harbor, commissioning, and operation in strong sea conditions

2.4.7 Oregon Device Design
The design of the Oregon device leveraged the previous design and testing of devices in New Zealand as well as the wave tank testing completed at OSU at the beginning of the project.
Design features of the Oregon device include:
• Hull designed to utilize stock shapes available in the US,
• Mooring attachment points improved over NZ design,
• Load bank included in design as a ‘hedge’ against completion of Ocean Sentinel,
• Dry box design improved and enlarged to allow connection of umbilical cable and NREL MOISyt instrumentation,
• A cylindrical float shape was selected based on wave tank testing,
• Mooring system changed from 4-point to 3-point to reduce cost and improve performance,
• Addition of battery charging circuit to avoid dead batteries,
• Improvements to control system to allow testing of latching and declutching control techniques.
2.5 Results
The WET-NZ design which was developed under this project for the Oregon testing weighs about 44,000 lbs. and is approximately 12'-0" in diameter and 47'-0" in overall length with a height above water of approximately 14'-0". A key feature of the device is that the float can rotate continuously through 360 degrees or oscillate back and forth, enabling the device to extract energy in a wide variety of wave conditions. The fully rotating float also provides a self-limiting power shedding effect, which makes the device inherently survivable in open ocean environments and helps to reduce mooring loads. As passing waves force the hull to surge and the float to rotate, the eccentric crankshaft drives two hydraulic pistons and hydraulic pressure is accumulated. This hydraulic pressure drives a hydraulic motor connected to the generator and produces power. The primary components of the NWEI Device are the PowerPod, hull and float. The watertight PowerPod contains the hydraulic motor, generator, and controls. The NWEI Device schematic and the layout of the PowerPod are shown in Figure 12, Figure 13, and Figure 14.
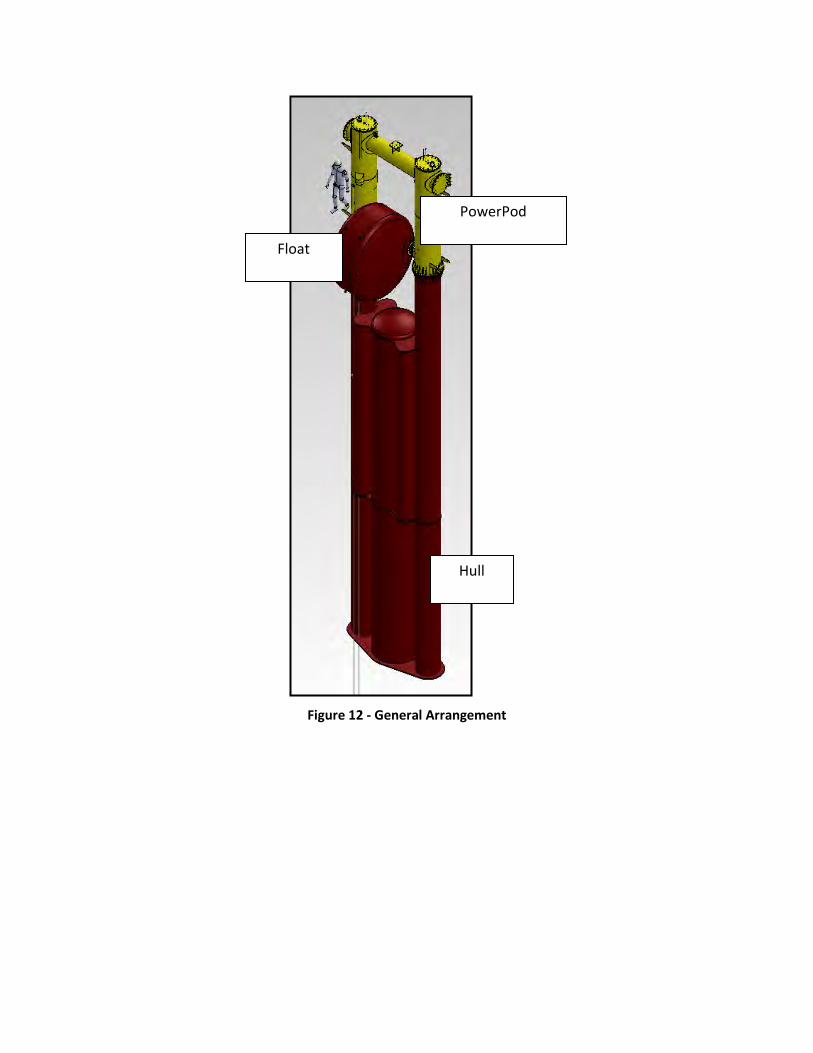
Figure 12 - General Arrangement
Float
PowerPod
Hull
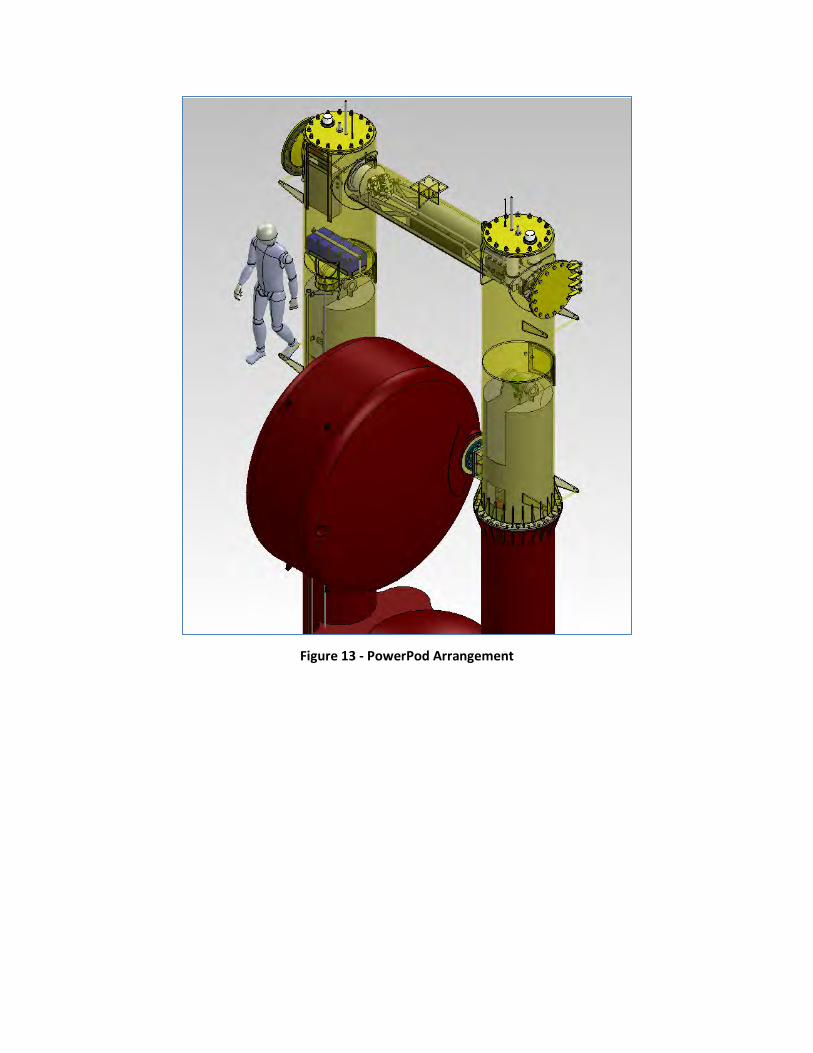
Figure 13 - PowerPod Arrangement
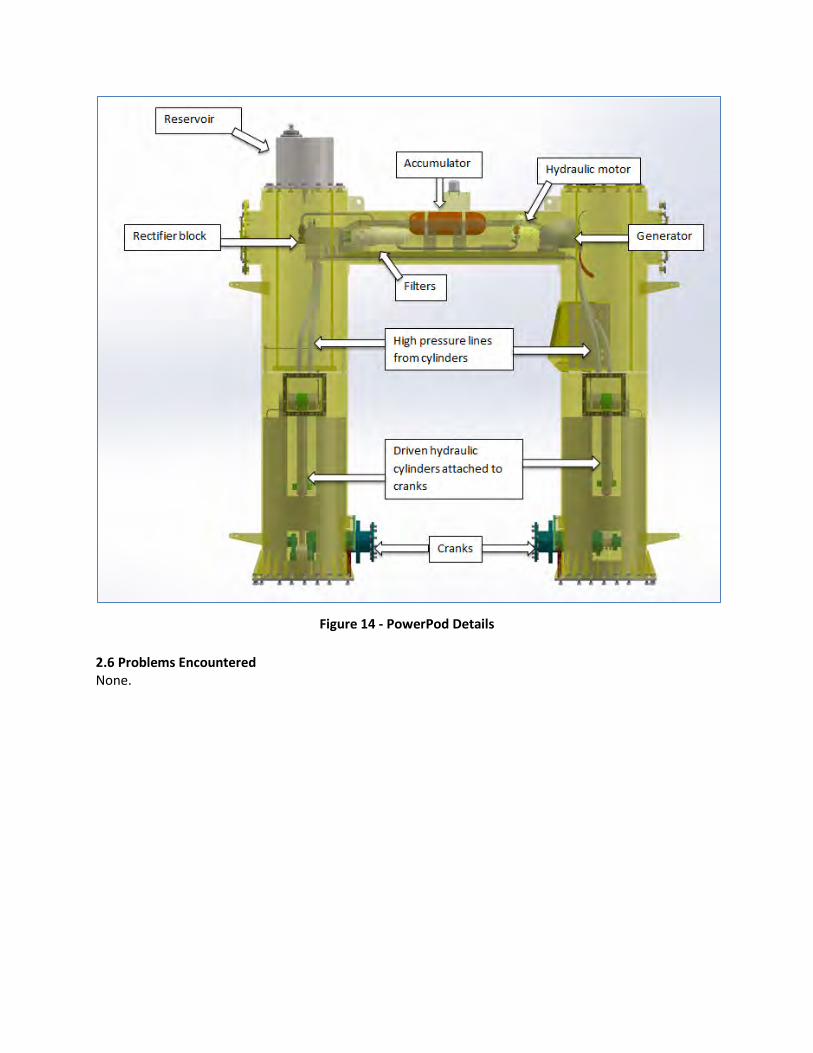
Figure 14 - PowerPod Details 2.6 Problems Encountered None.

Section 3 Mooring Design
3.1 Subtasks Included
The following SOPO subtasks are discussed as part of this report section:
• Subtask 2.6 Mooring System Design and Procurement
3.2 Purpose/Hypothesis
The purpose of this task was to develop a mooring design for the WET-NZ 1:2 scale prototype for the NNMREC project site.
Key goals are to keep the total demonstration cost down (i.e. materials, deployment and removal), which maintaining good system performance parameters with reasonable high mooring factors of safety.
The design approach was to keep the size of the components relatively modest to reduce initial costs and enable system handling, installation and removal to be performed with marine equipment available in the Newport area.
3.3 Project Partners and Roles
The following project partners participated in the mooring design:
• Callaghan Innovation – design requirements
• Sound and Sea Technologies – mooring analysis
3.4 Approach
An ANYSIS AQWA six degree-of-freedom numerical model was used to analyze a preliminary mooring design. Table 1 below provides a summary of the design input. Table 2 below provides a summary of the environmental input.
Table 1. Design Criteria
(a) General Item Value Notes
Test period July - Sep Test system must be recovered prior to October; 6 weeks data desirable
Scale 1 / 2 Test unit is a ½ Froude scale
Installation site NNMREC Oregon ~3 n.m. offshore
Orientation Into waves Angle not very critical
Water depth 45-50 m Will be refined in final design; the ‘worst case’ of 45m is assumed here
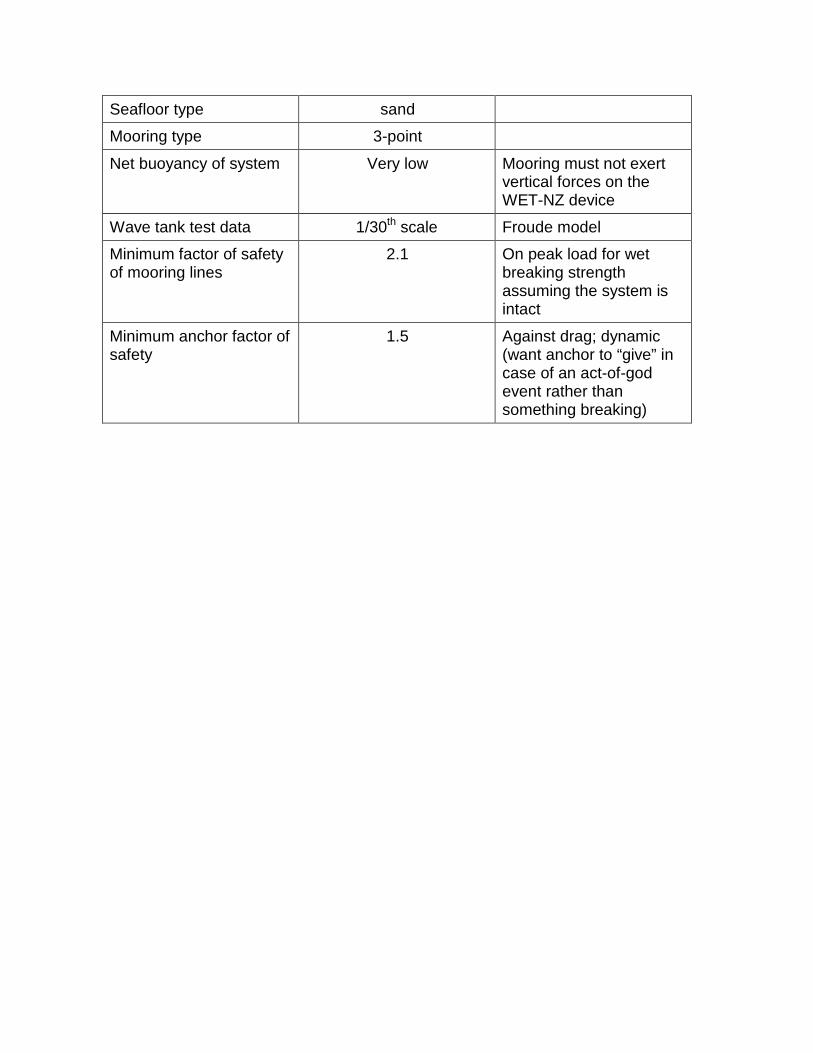
Seafloor type sand
Mooring type 3-point
Net buoyancy of system Very low Mooring must not exert vertical forces on the WET-NZ device
Wave tank test data 1/30th scale Froude model
Minimum factor of safety of mooring lines
2.1 On peak load for wet breaking strength assuming the system is intact
Minimum anchor factor of safety
1.5 Against drag; dynamic (want anchor to “give” in case of an act-of-god event rather than something breaking)
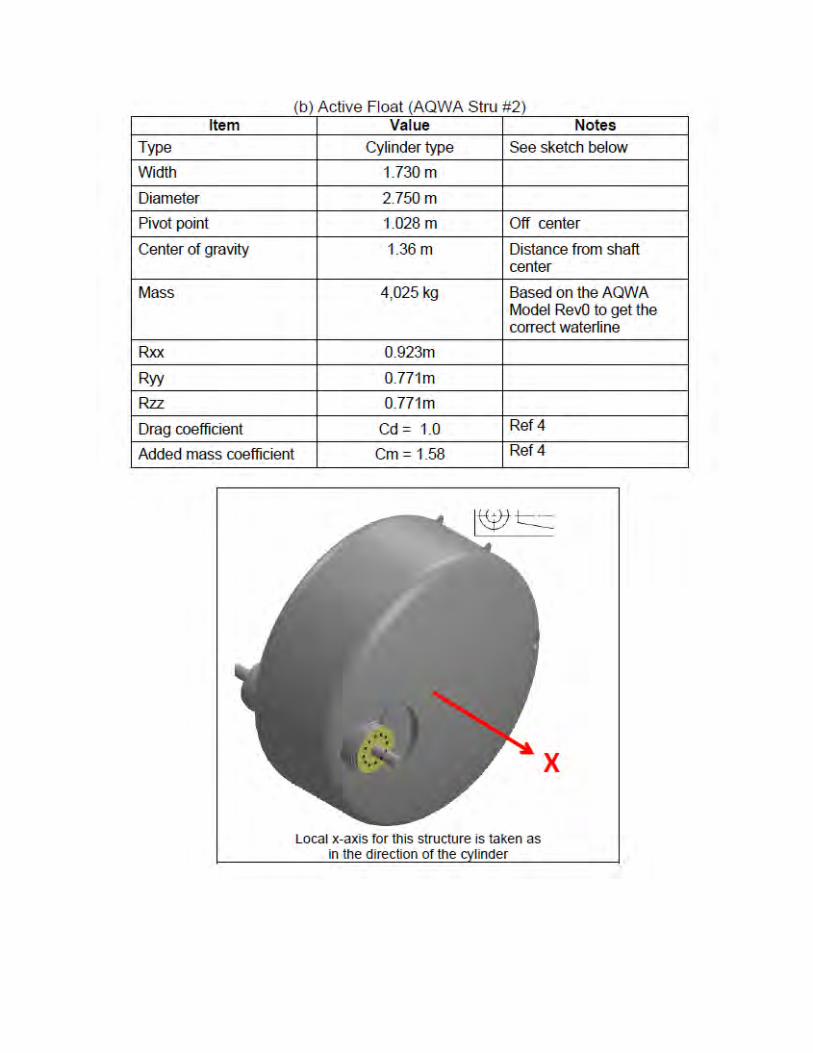
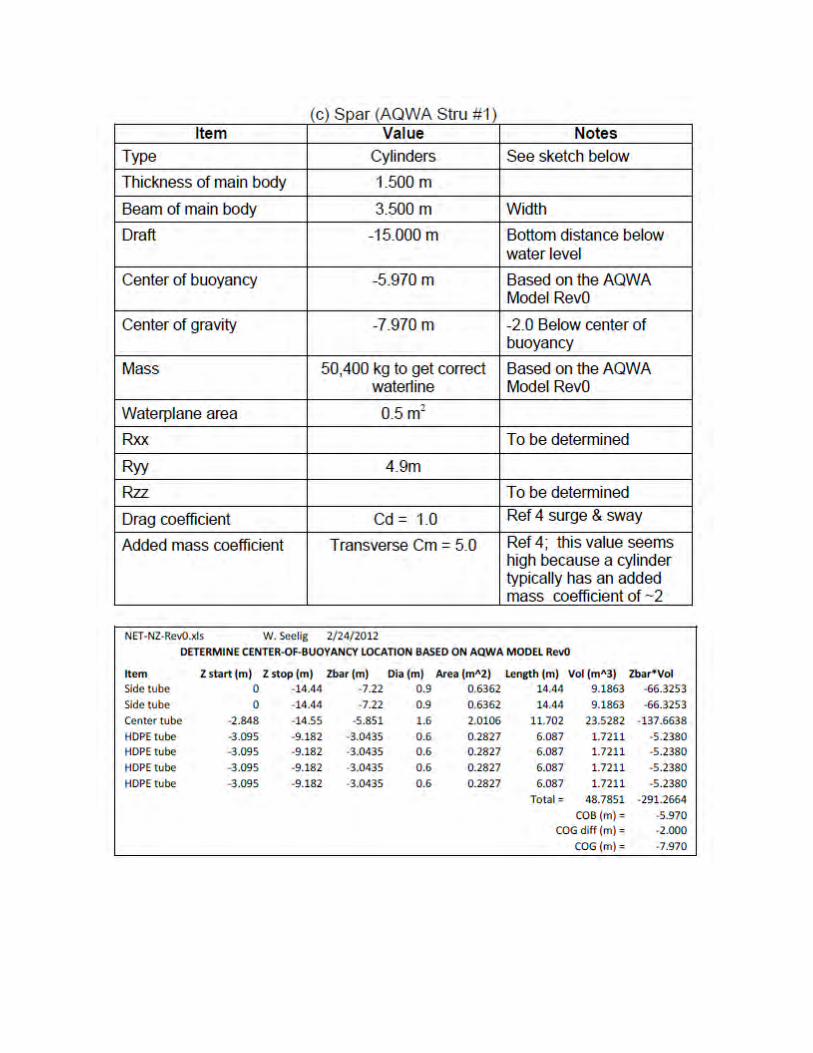
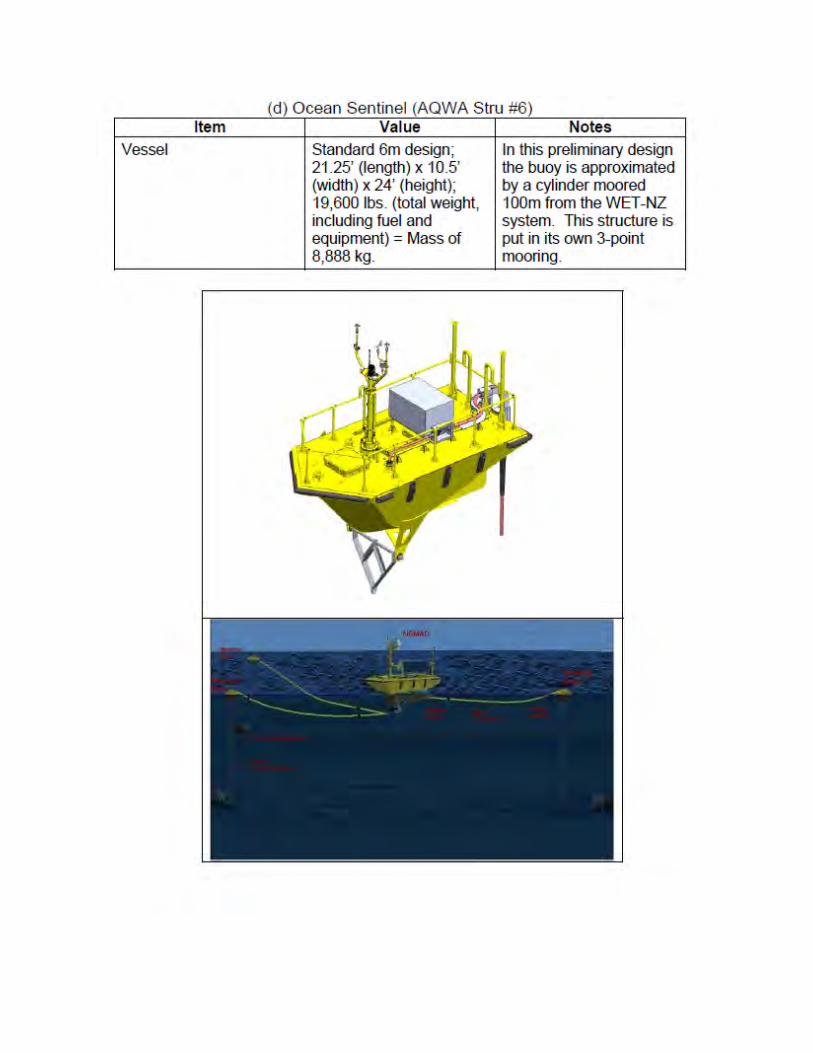

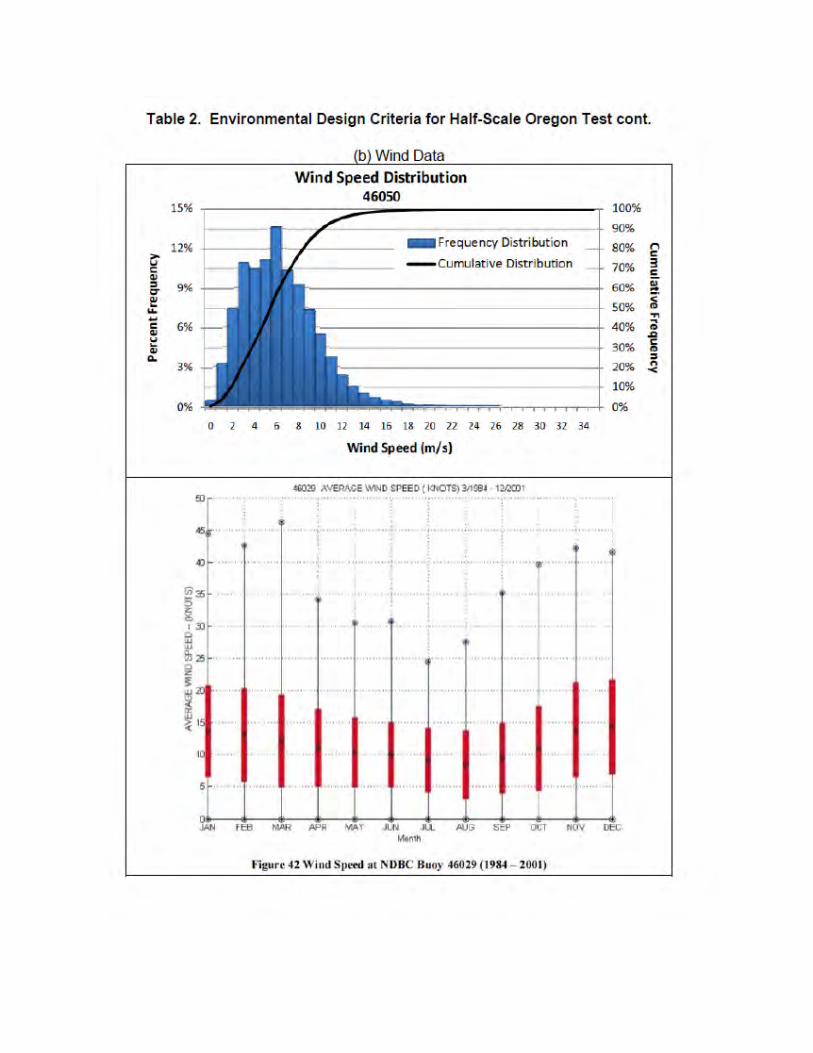
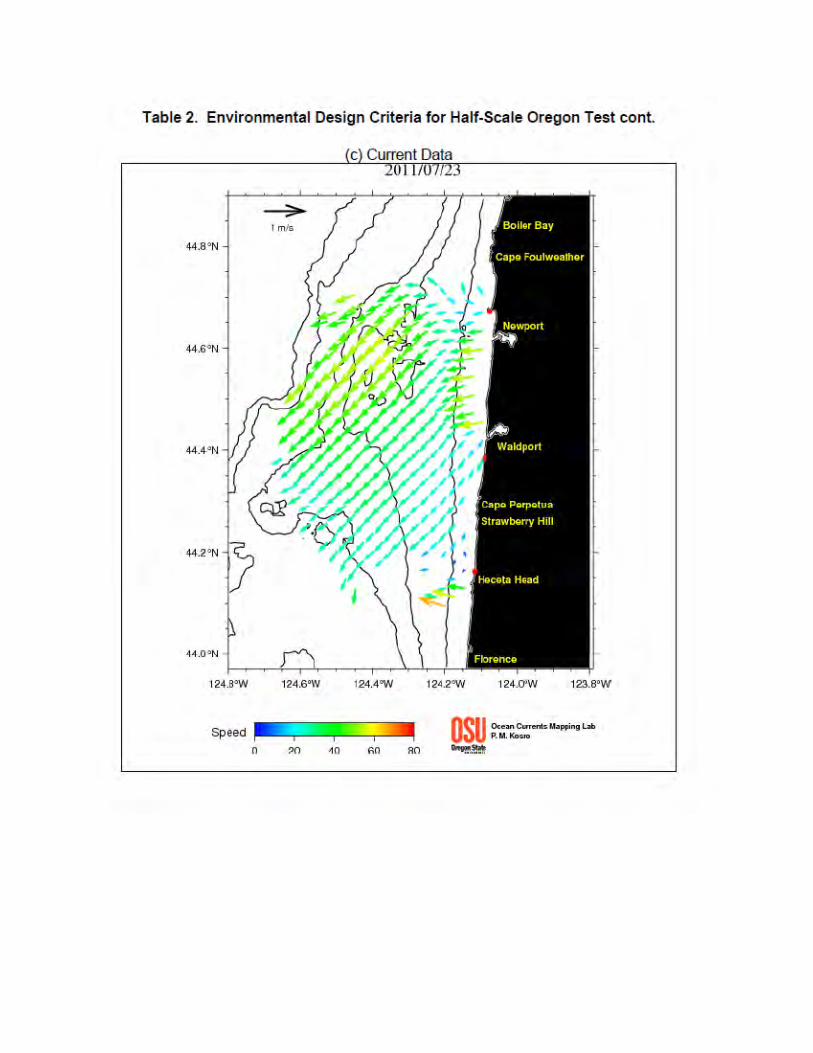
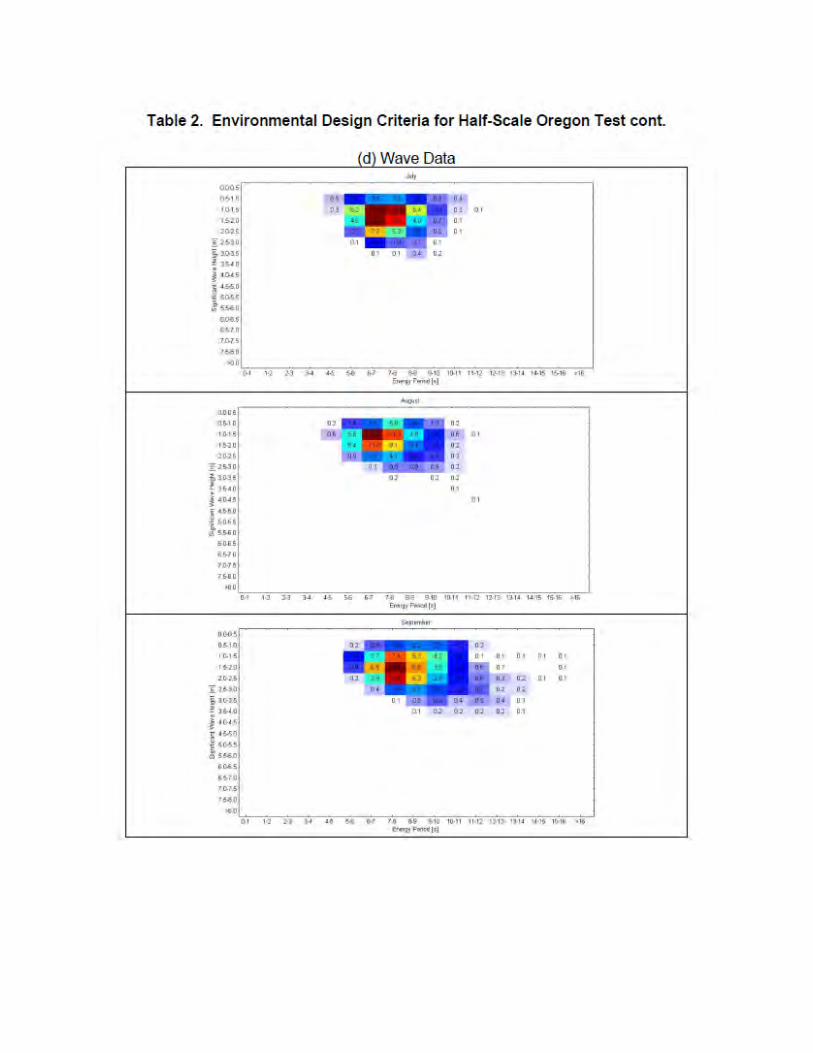
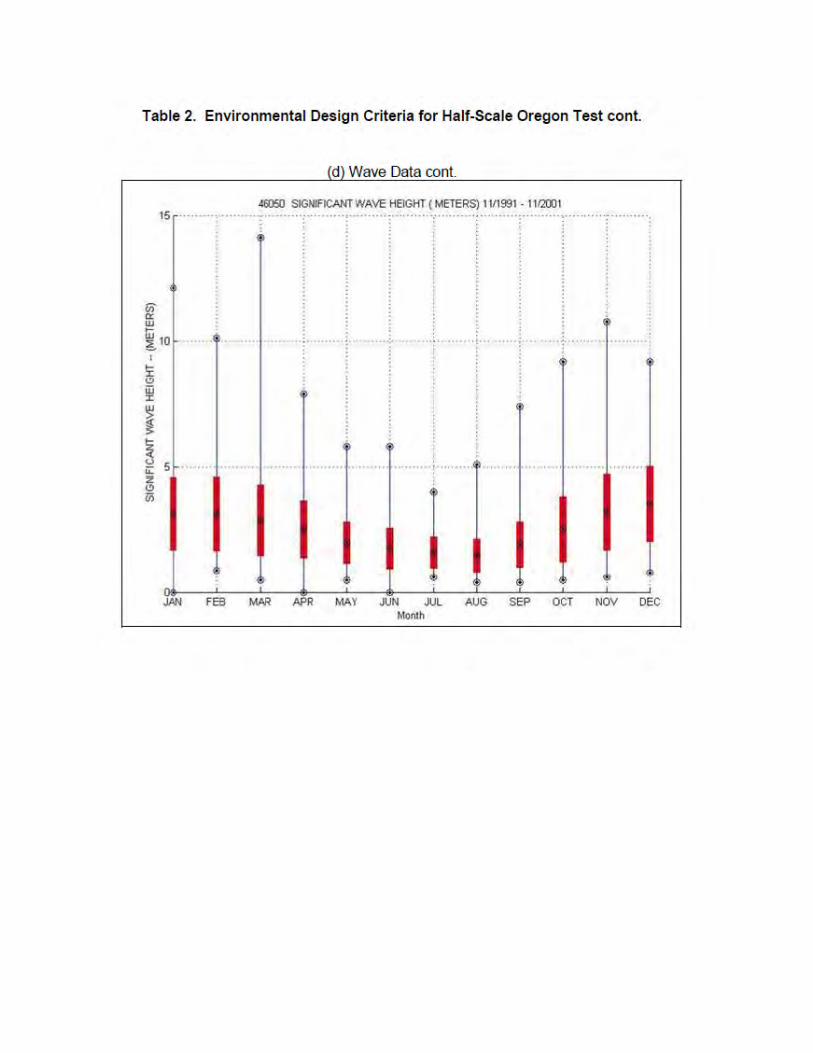
3.5 Results
Preliminary calculations show that Ocean Sentinel and the power cable do not have much influence on the WET-NZ mooring design, therefore all final analysis was conducted with those components removed to reduce computing time.
Analyses show the system is very well behaved. Typical waves at the test site are predicted to cause the active float to move a great deal. Meanwhile, the unique combination of design details is such that spar motions are minimized, especially translational motions of the spar at the mooring connection points. This ideal situation results in very low dynamic loads in the mooring for July through September waves expected at the Oregon test site.
Figure 15 shows an isometric view of the mooring system design. The WET-NZ device is connected to the subsurface floats with nylon hawsers. These nylon hawsers keep the natural periods of the moored system relatively long and thereby reducing peak dynamic loads. The resulting design reduced wave, current and dynamic loading so that the smaller size system still has acceptably high factors of safety for temporary mooring.
The subsurface floats, which provide tension to the mooring system, are connected to the clump anchors with wire rope. The clump anchors, which provide resistance to uplift, are connected to the Eells anchors, which are an embedment type anchor and provide lateral resistance.
As shown in Figure 16 and Figure 17, the half-scale WET-NZ test mooring includes three mooring legs with 120-degree spreads – this approach provides good system performance with the minimum number of mooring legs. Each mooring leg consists of a drag anchor, 52m (164 ft) of 38mm (1.5-inch) diameter high strength wire rope, a sinker, a 48m wire rope riser with a ~45 up-angle, a sub-sea foam buoy 1.7m (5.6 ft) in both height and diameter and a 20m (66 ft) long 63.5mm (2.5-inch) diameter nylon hawser connected to the WET-NZ half-scale device.
As shown in Figure 18 the clump weights were specified as 6,000 lb Navy stockless type anchors. The Eells anchors were 8,000 lb each.
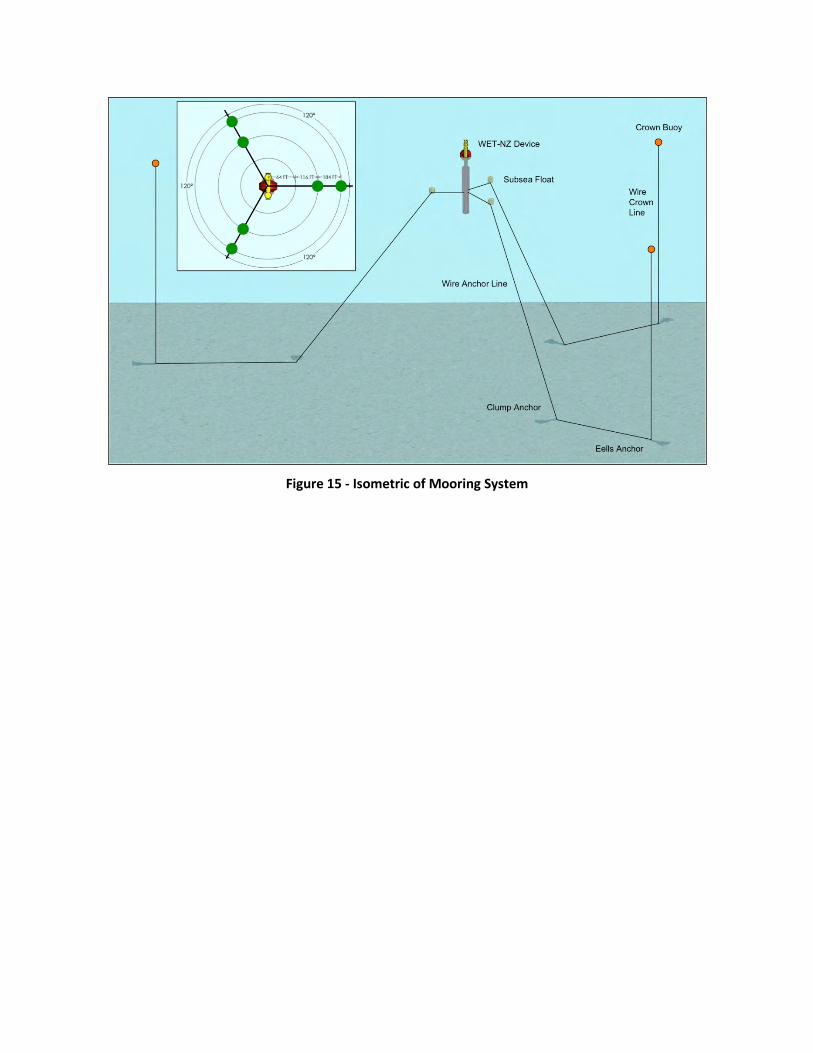
Figure 15 - Isometric of Mooring System
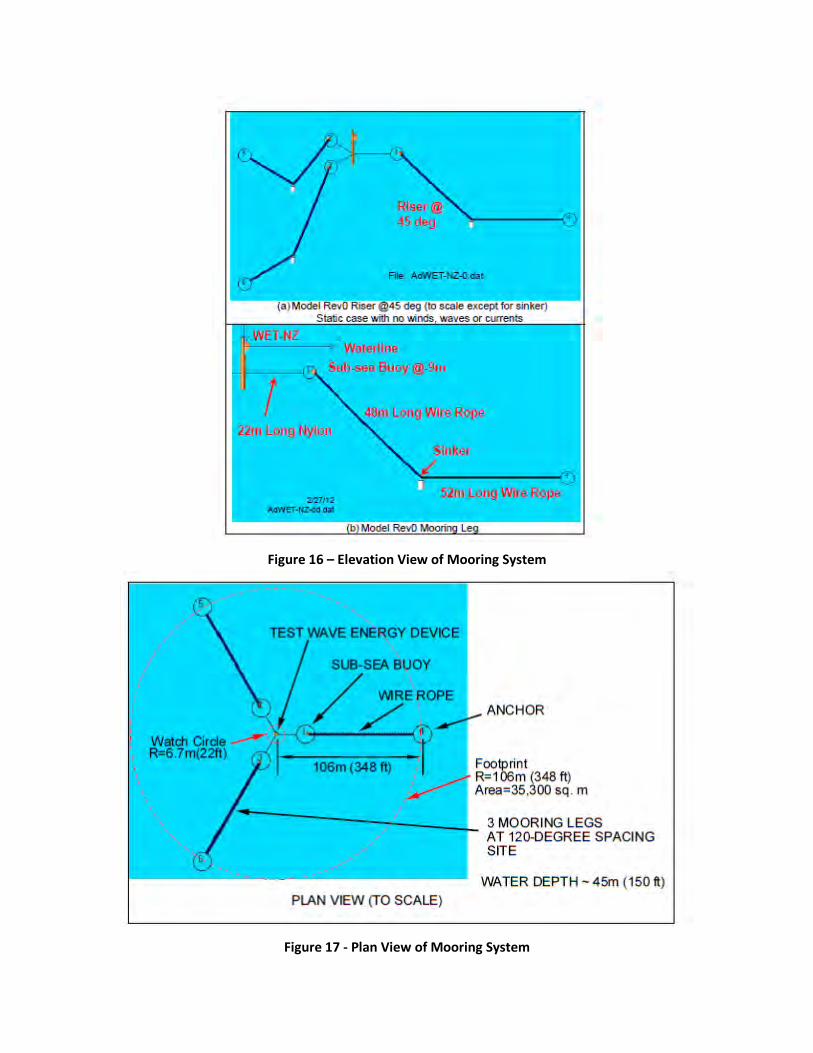
Figure 16 – Elevation View of Mooring System
Figure 17 - Plan View of Mooring System
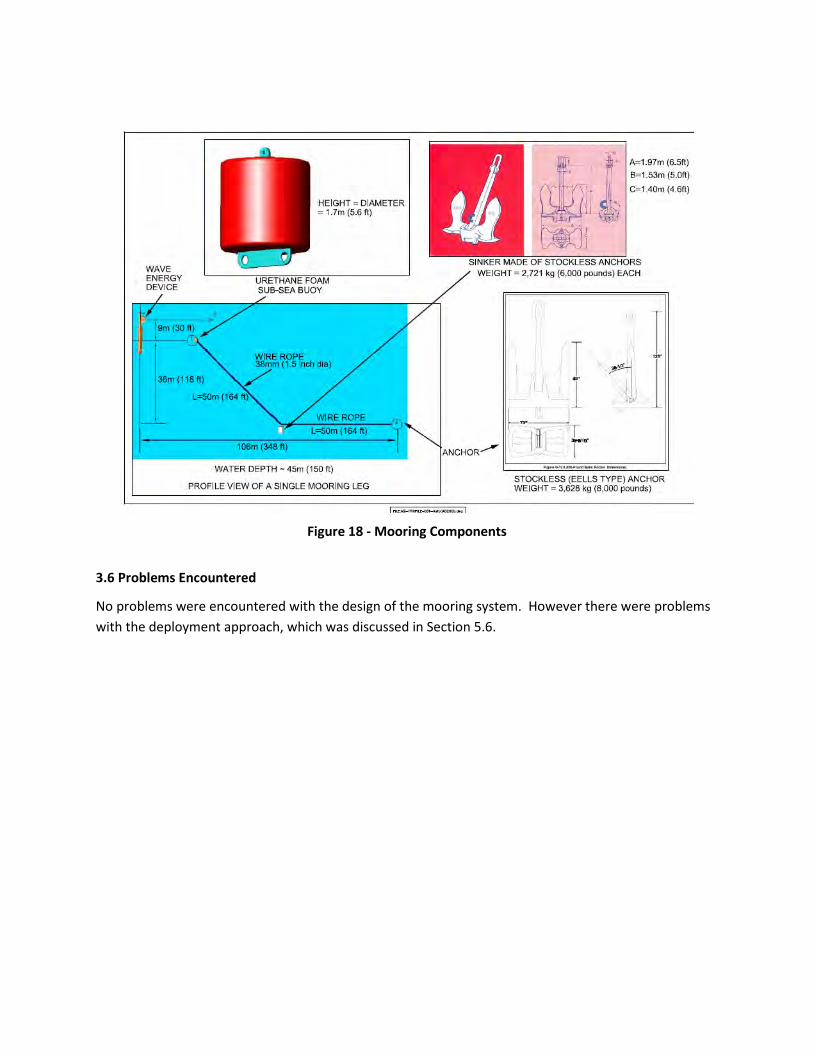
Figure 18 - Mooring Components
3.6 Problems Encountered
No problems were encountered with the design of the mooring system. However there were problems with the deployment approach, which was discussed in Section 5.6.

Section 4 Fabrication
4.1 Subtasks Included
The following SOPO subtasks are discussed as part of this report section:
• Subtask 2.8 PowerPod Fabrication
• Subtask 2.9 Fabricate Hull
• Subtask 2.10 Integrate Hull and PowerPod
• Subtask 2.11 Factory Acceptance Test
4.2 Purpose
The purpose of this task was to fabricate device in accordance with the design described in section 2.0. The PowerPod was fabricated by Callaghan Innovation in New Zealand. The hull was fabricated by Oregon Iron works in Portland, Oregon. The hull and PowerPod were assembled in Toledo Oregon.
4.3 Project Partners and Roles
• Callaghan Innovation – fabricated PowerPod
• Oregon Iron Works – fabricated Hull
• Port of Toledo Boatyard – assembled Hull and PowerPod, launched device
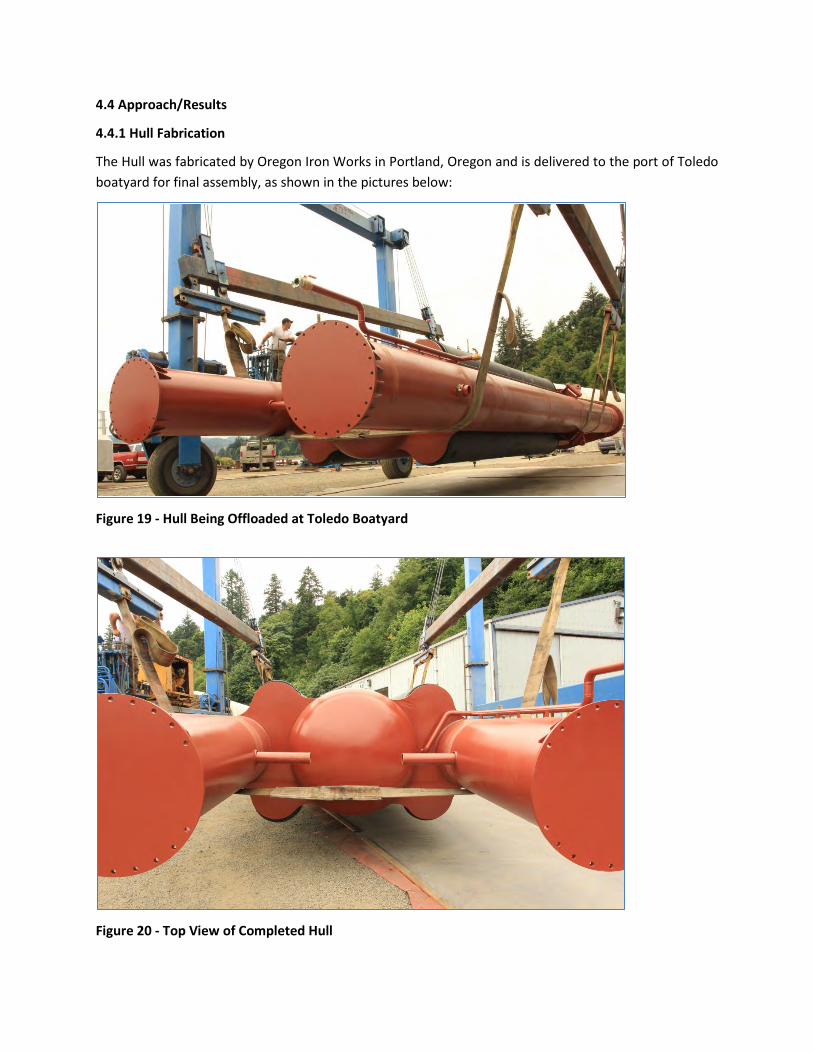
4.4 Approach/Results
4.4.1 Hull Fabrication
The Hull was fabricated by Oregon Iron Works in Portland, Oregon and is delivered to the port of Toledo boatyard for final assembly, as shown in the pictures below:
Figure 19 - Hull Being Offloaded at Toledo Boatyard
Figure 20 - Top View of Completed Hull
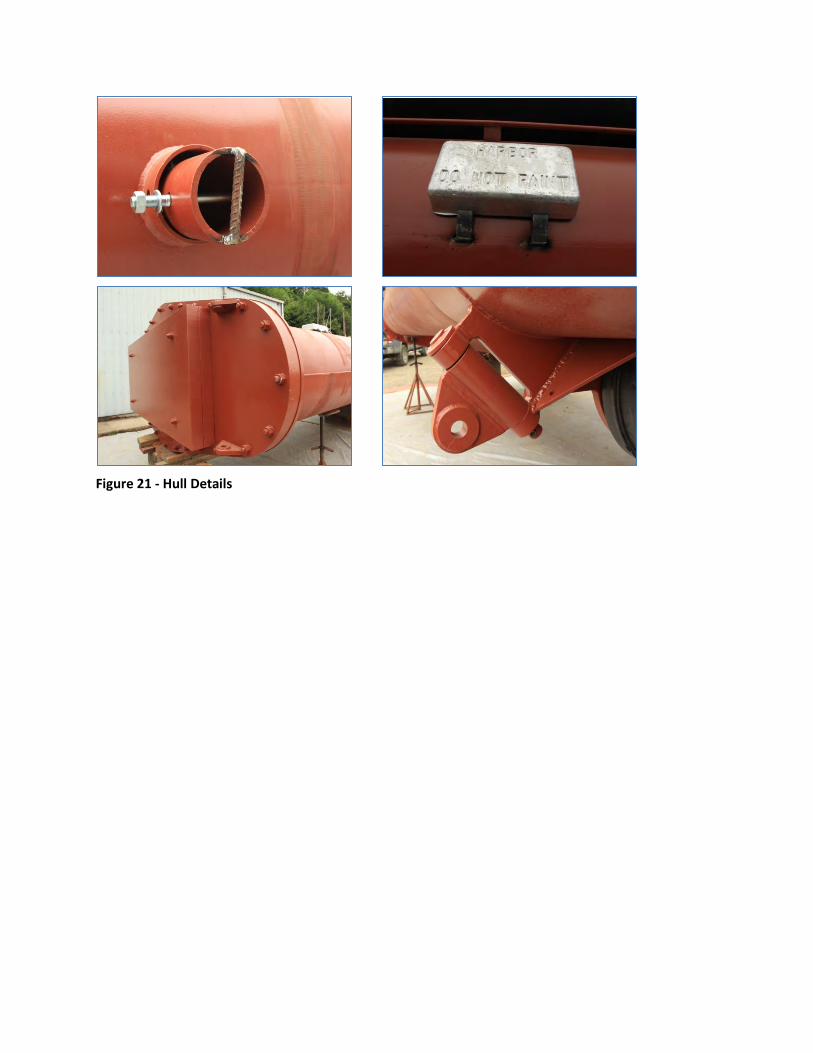
Figure 21 - Hull Details
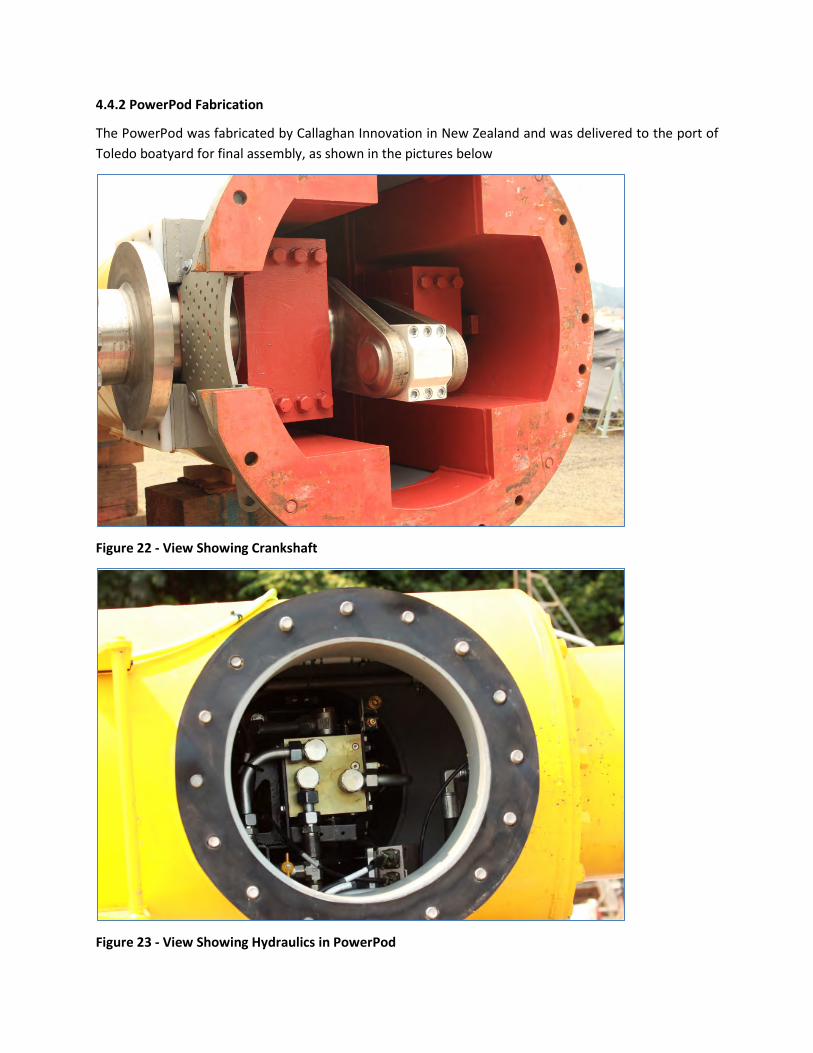
4.4.2 PowerPod Fabrication
The PowerPod was fabricated by Callaghan Innovation in New Zealand and was delivered to the port of Toledo boatyard for final assembly, as shown in the pictures below
Figure 22 - View Showing Crankshaft
Figure 23 - View Showing Hydraulics in PowerPod
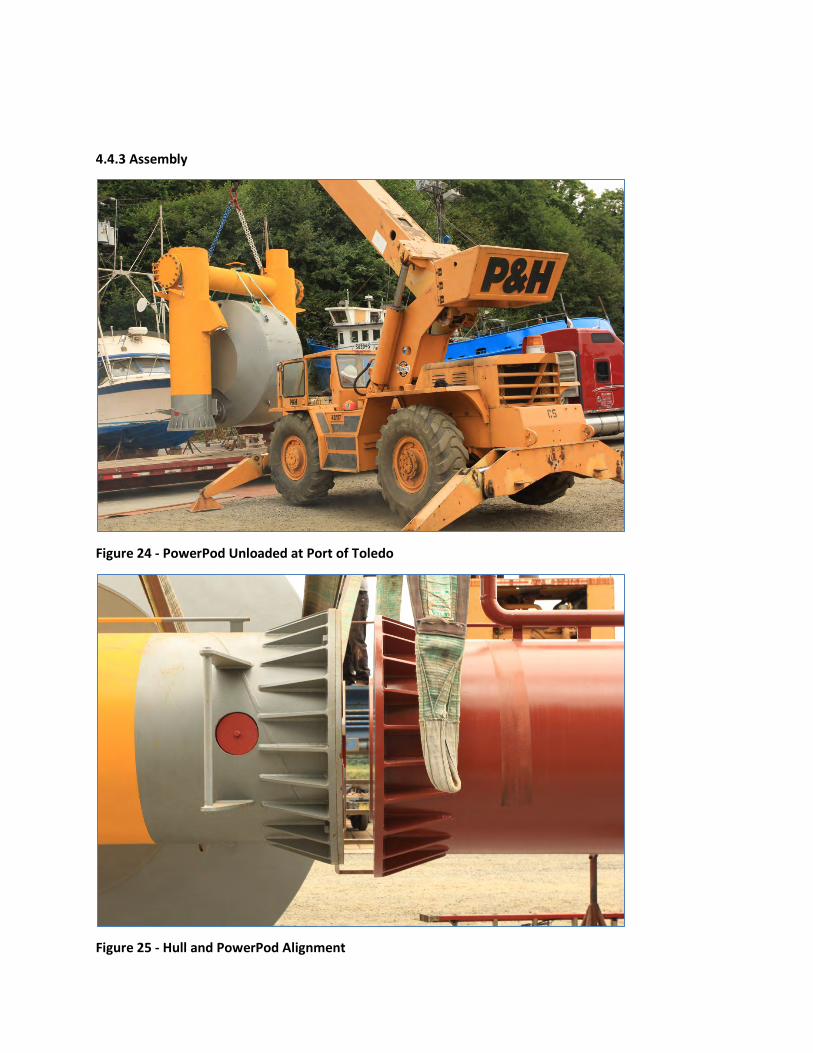
4.4.3 Assembly
Figure 24 - PowerPod Unloaded at Port of Toledo
Figure 25 - Hull and PowerPod Alignment
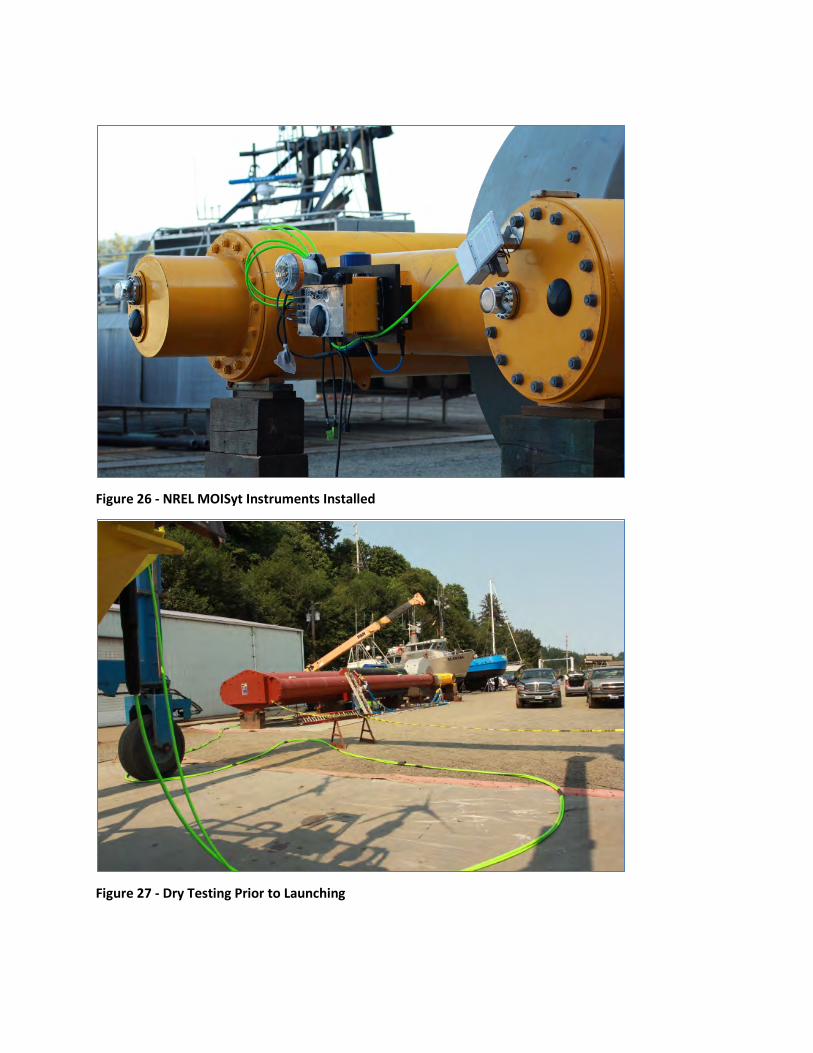
Figure 26 - NREL MOISyt Instruments Installed
Figure 27 - Dry Testing Prior to Launching

4.5 Problems Encountered
During the assembly of the Hull and PowerPod, there appeared to be about 1-inch of misalignment ( See Figure 25) between the respective bolting circles. The assembly team was able to use jacks and winches to squeeze the upper legs of the Hull to allow proper alignment. However, later during test, it was observed that the Float was very stiff. One hypothesis is that this misalignment causes the main shaft bearings to become tight, resulting in improper float movement. The net result was likely a reduction in power output. Inspection after decommissioning revealed misalignment of the bearings within their races. We are not sure if the misalignment was due to the misalignment of the Hull and PowerPod or if the bearings shifted during transport from NZ to Oregon.

Section 5 Deployment/Retrieval
5.1 Subtasks Included
The following SOPO subtasks are discussed as part of this report section:
• 2.12 Ocean Deployment
• 2.14 Decommission
5.2 Purpose/Hypothesis
The purpose of this task was to deploy the device for testing at the project site. As discussed in Section 3, the objective was to use locally available vessels in order to minimize cost. The deployment methodology was based on the use of the NRC quest, a small tug, and R I B support.
5.3 Project Partners and Roles
• Callaghan Innovation – onsite support
• NRC Quest – anchor installation vessel
• Wiggins Tug – device towing
• NNMREC – RIB support
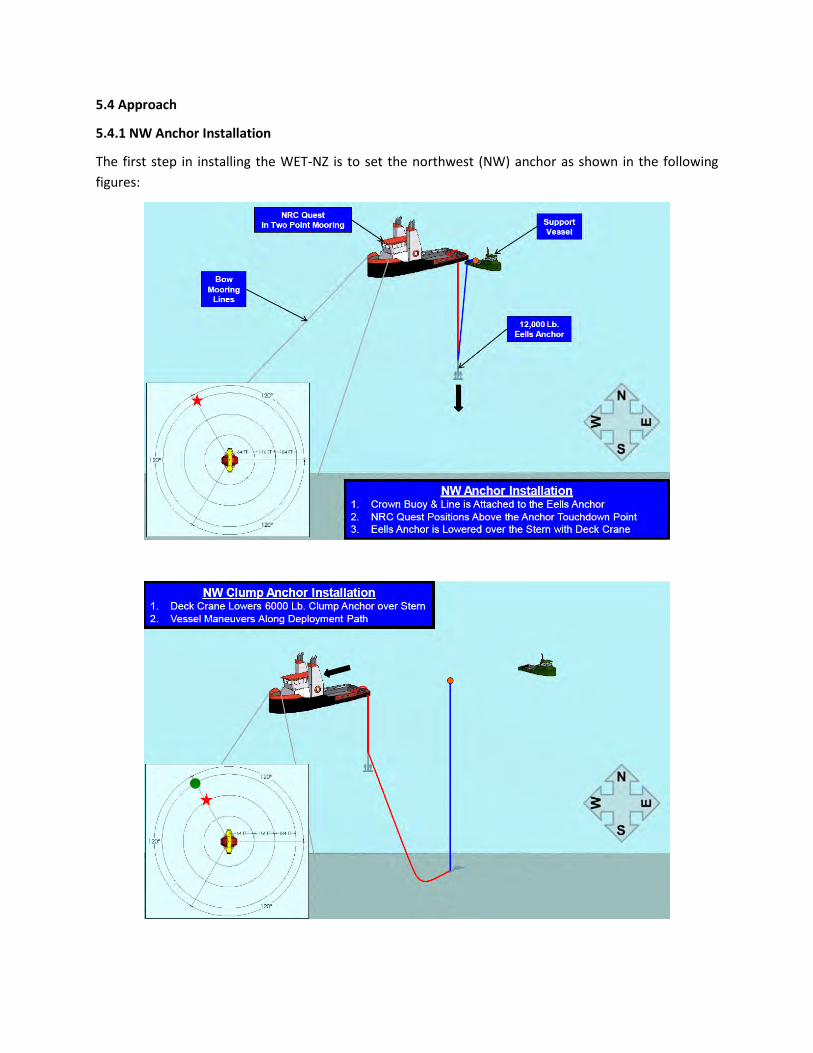
5.4 Approach
5.4.1 NW Anchor Installation
The first step in installing the WET-NZ is to set the northwest (NW) anchor as shown in the following figures:
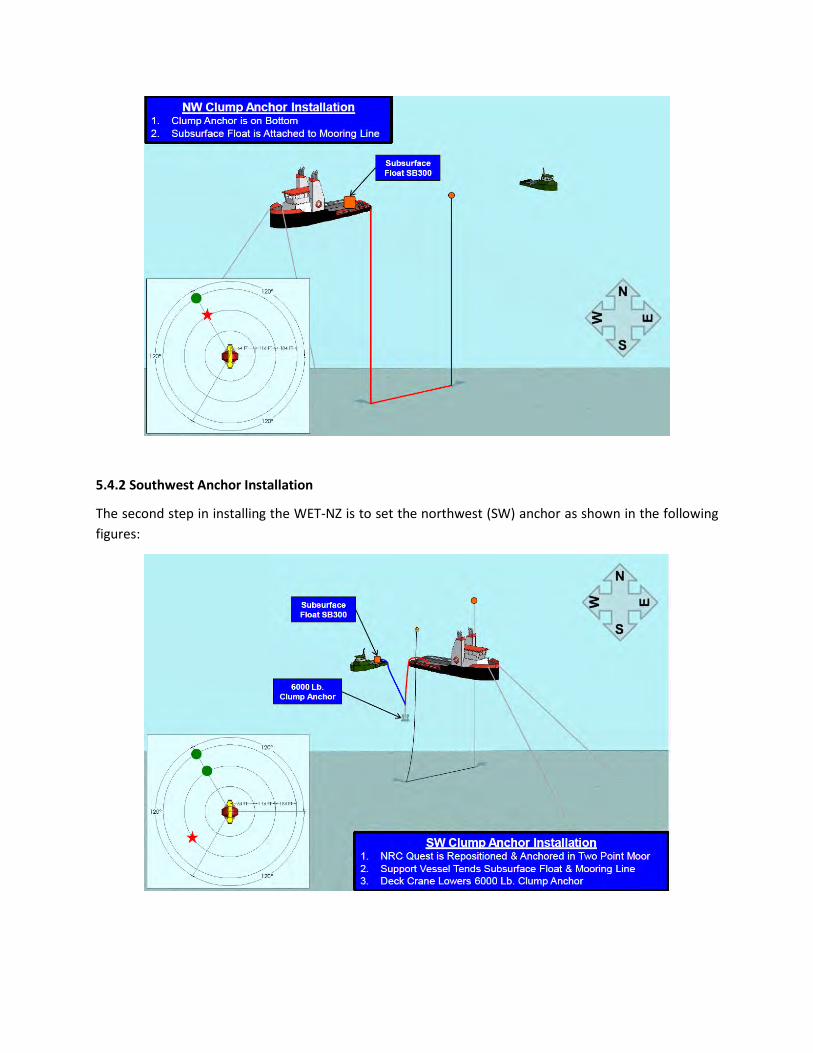
5.4.2 Southwest Anchor Installation
The second step in installing the WET-NZ is to set the northwest (SW) anchor as shown in the following figures:
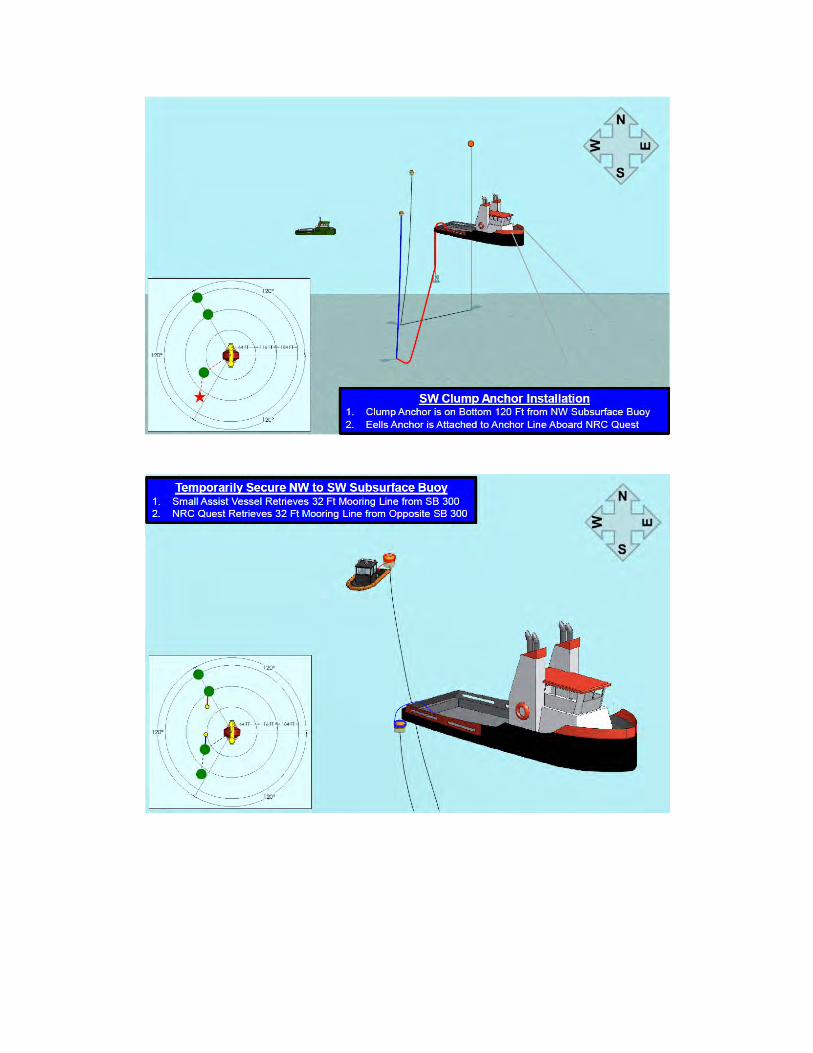
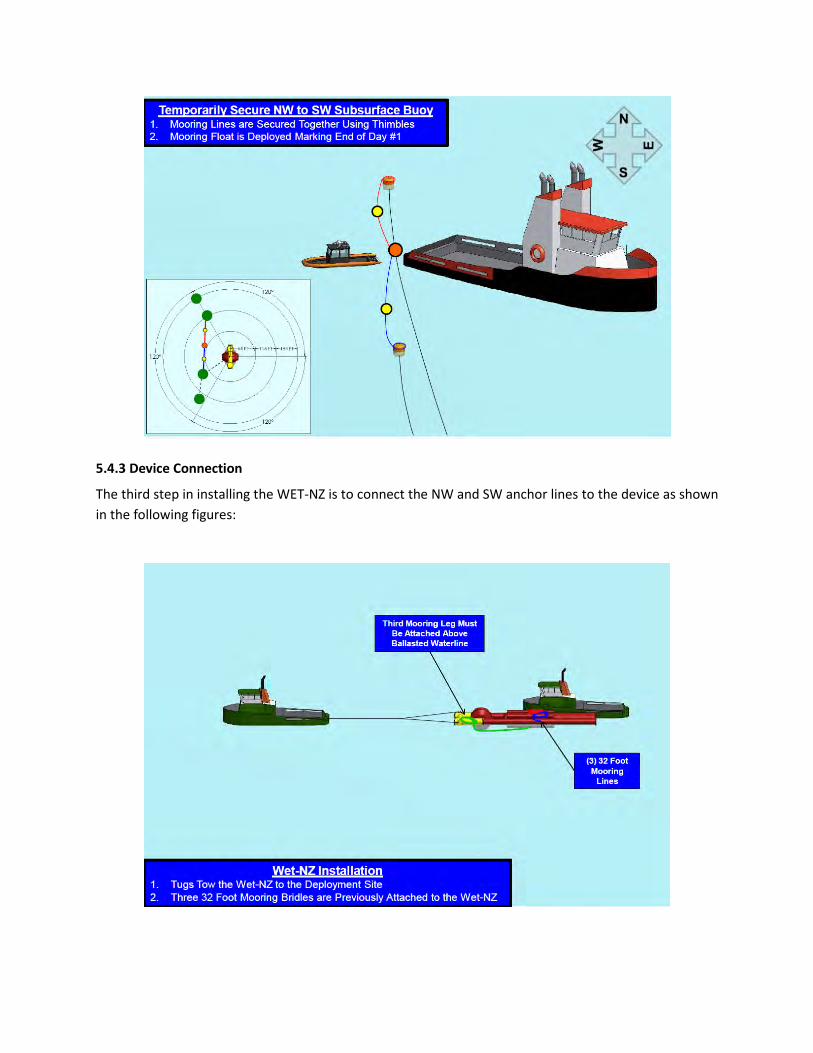
5.4.3 Device Connection
The third step in installing the WET-NZ is to connect the NW and SW anchor lines to the device as shown in the following figures:
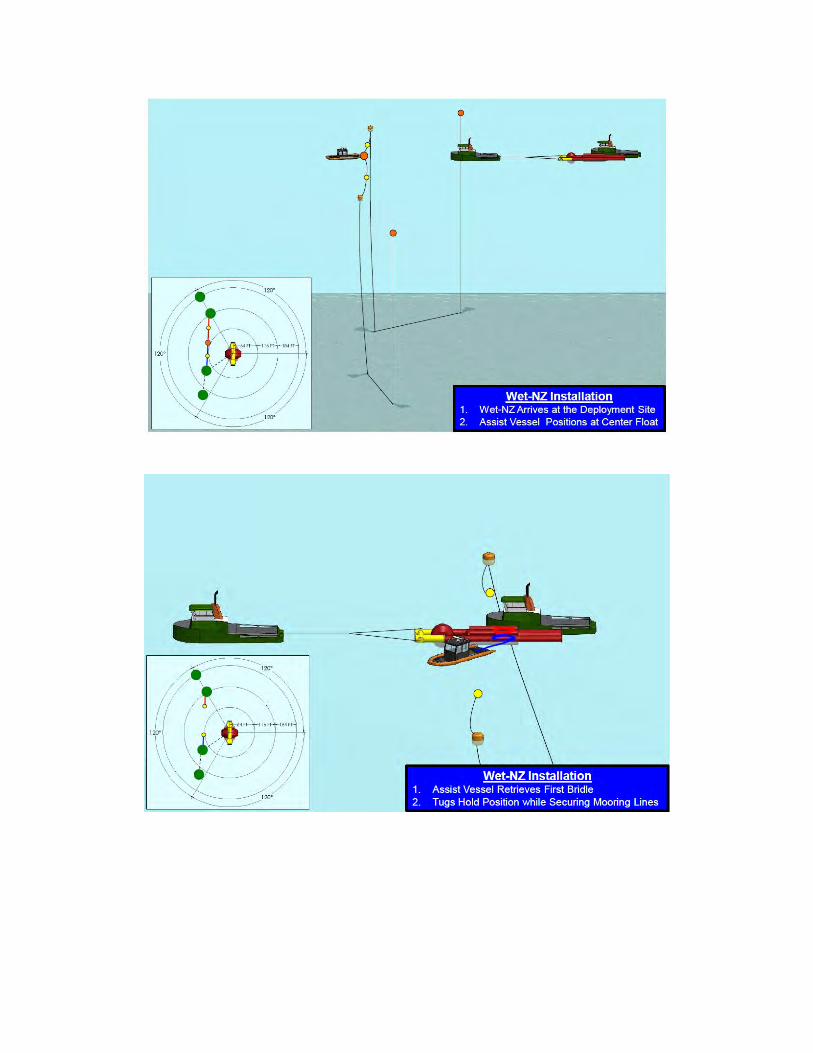
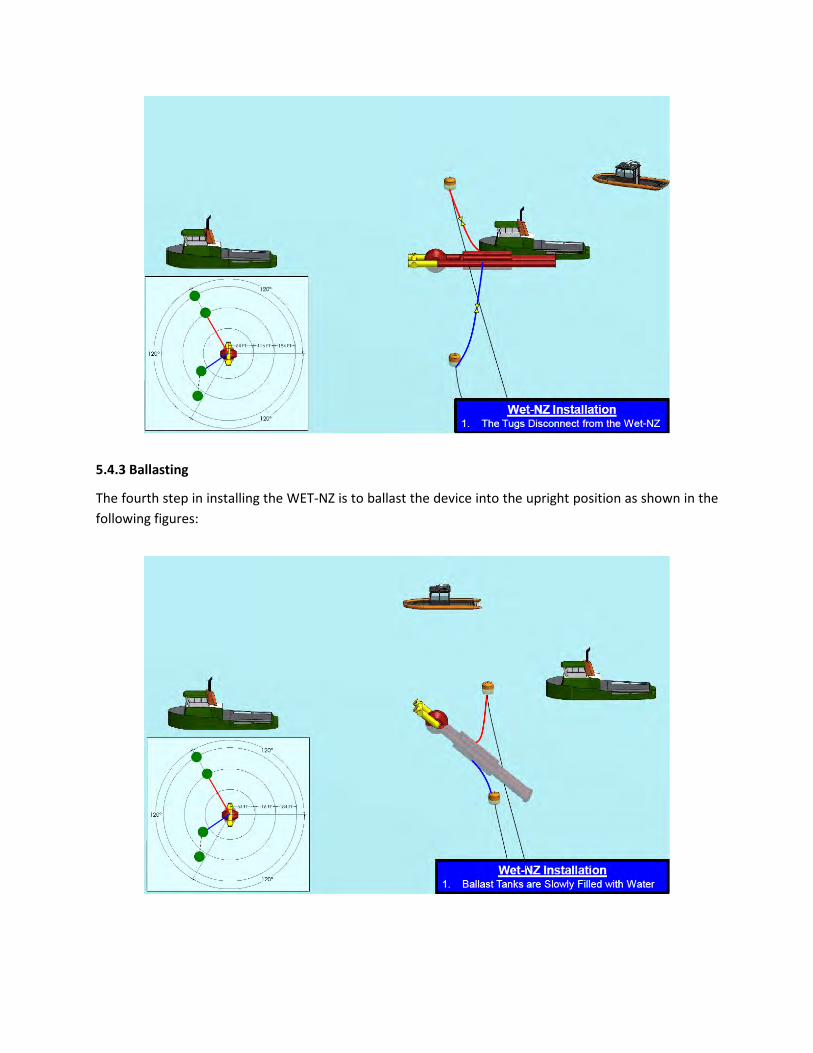
5.4.3 Ballasting
The fourth step in installing the WET-NZ is to ballast the device into the upright position as shown in the following figures:
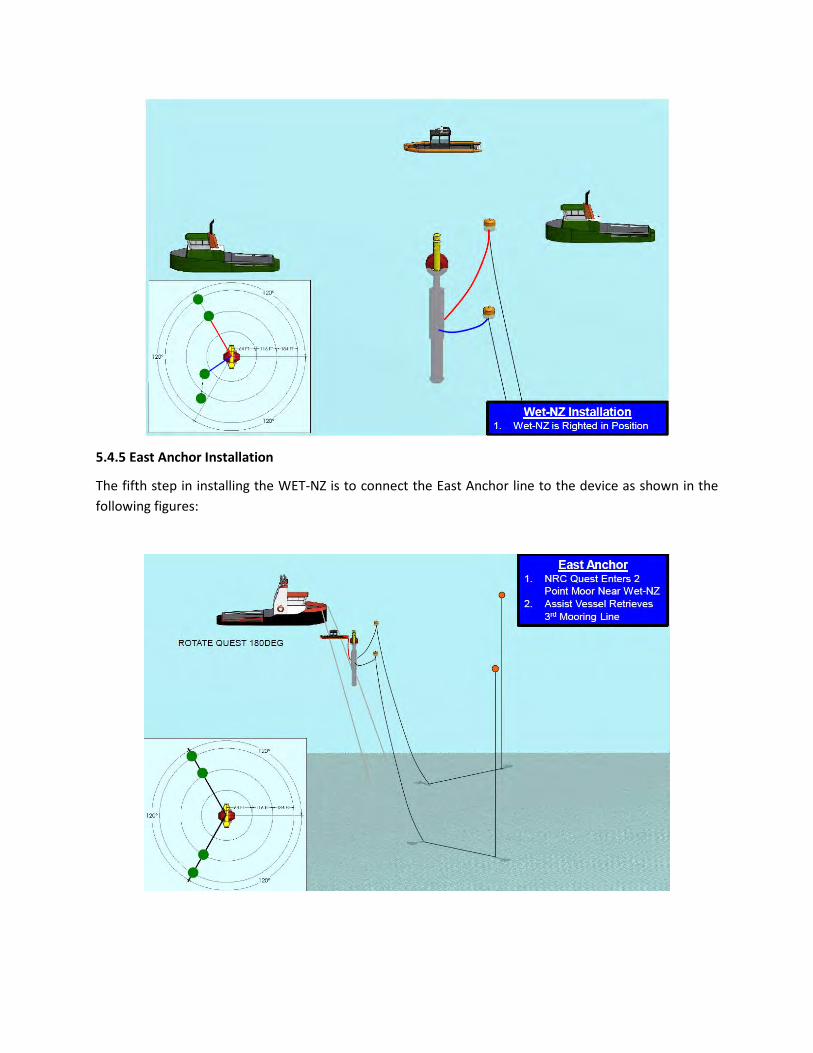
5.4.5 East Anchor Installation
The fifth step in installing the WET-NZ is to connect the East Anchor line to the device as shown in the following figures:
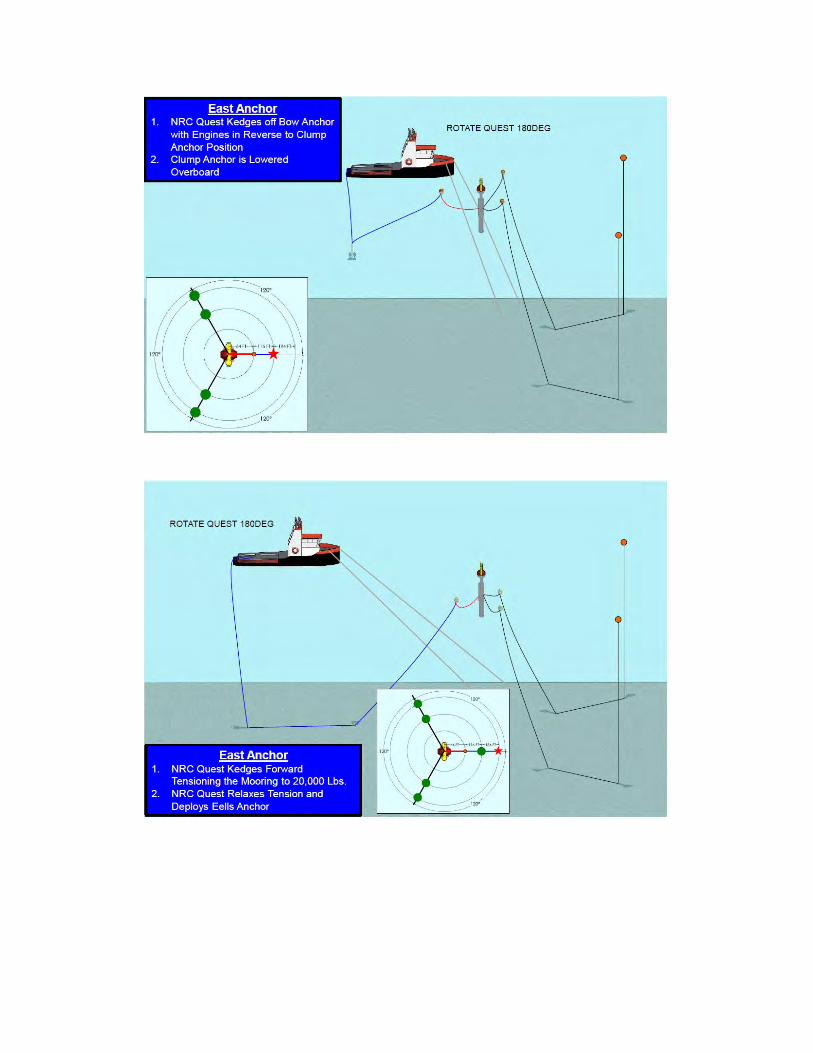
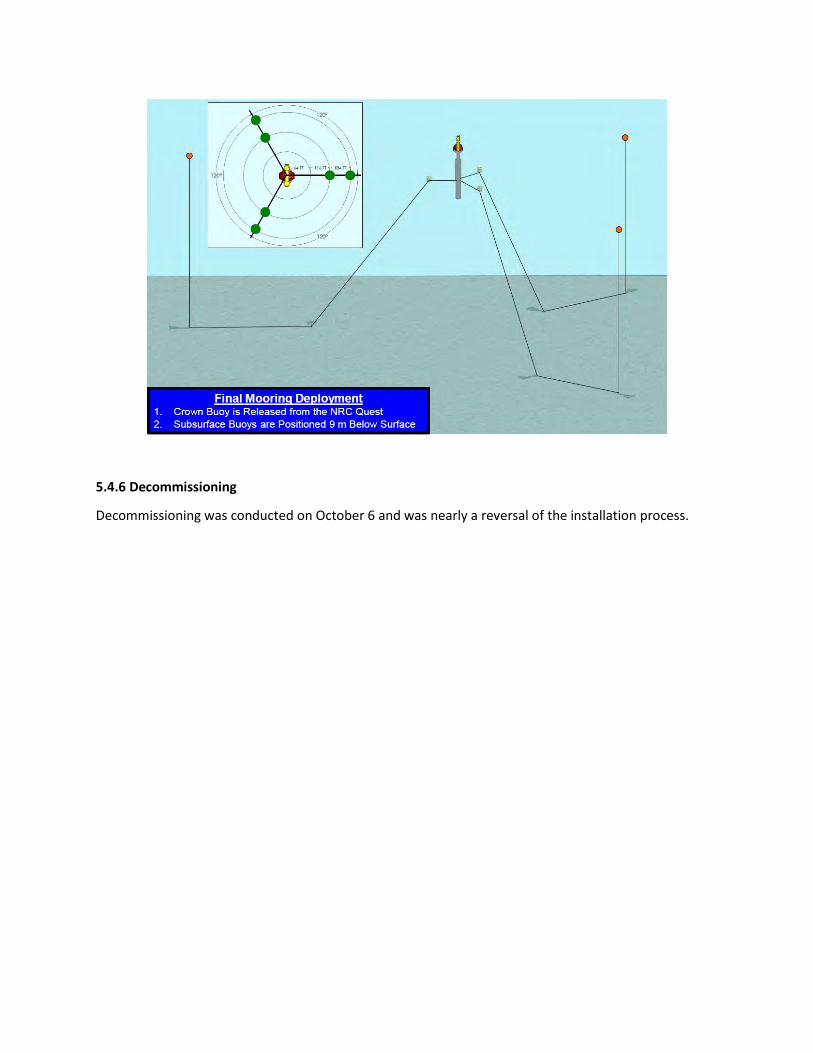
5.4.6 Decommissioning
Decommissioning was conducted on October 6 and was nearly a reversal of the installation process.
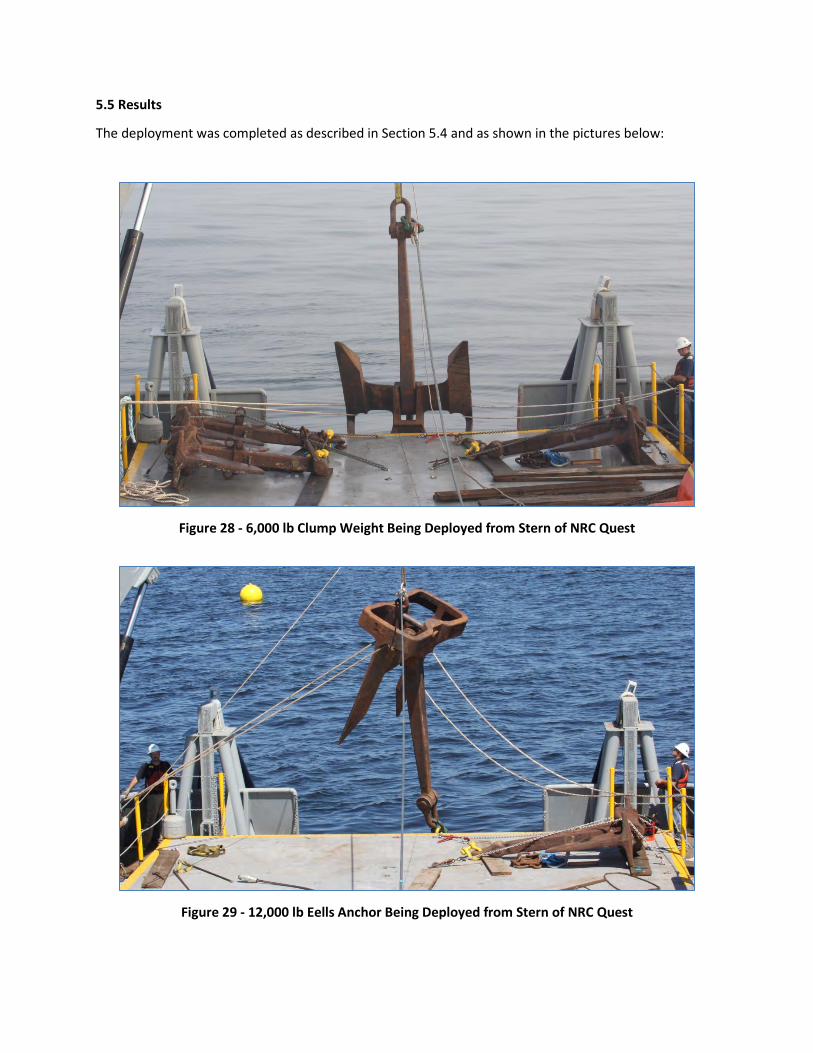
5.5 Results
The deployment was completed as described in Section 5.4 and as shown in the pictures below:
Figure 28 - 6,000 lb Clump Weight Being Deployed from Stern of NRC Quest
Figure 29 - 12,000 lb Eells Anchor Being Deployed from Stern of NRC Quest
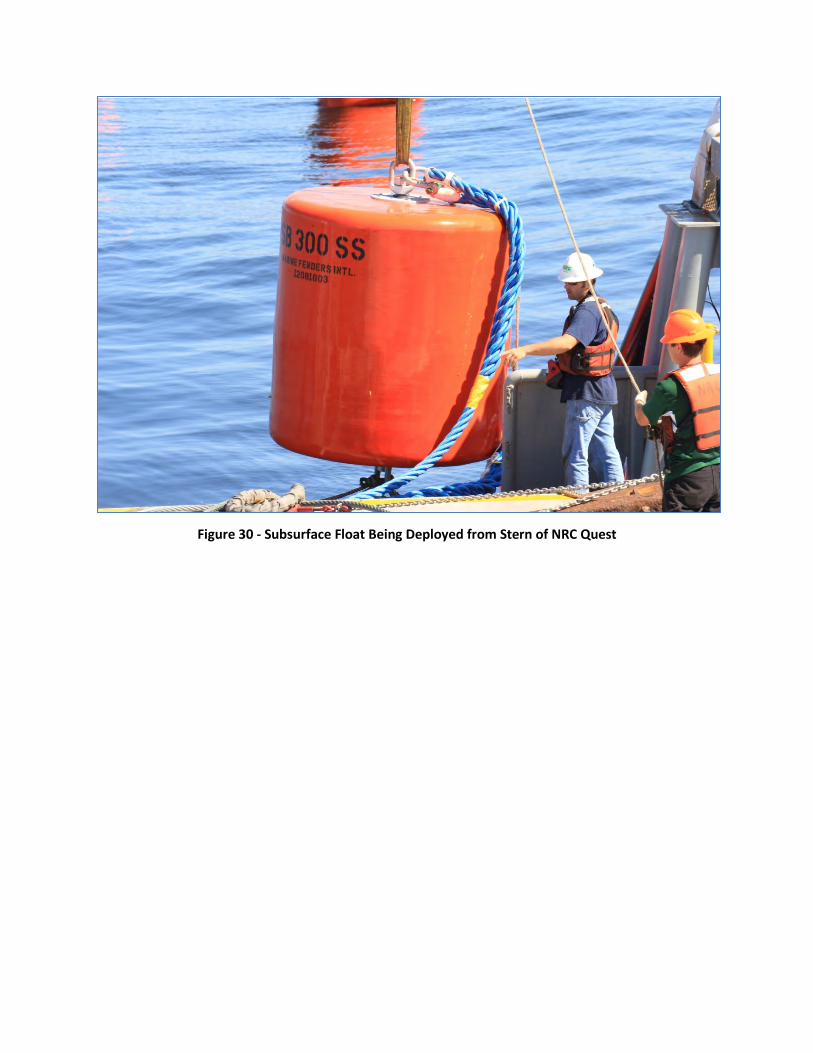
Figure 30 - Subsurface Float Being Deployed from Stern of NRC Quest
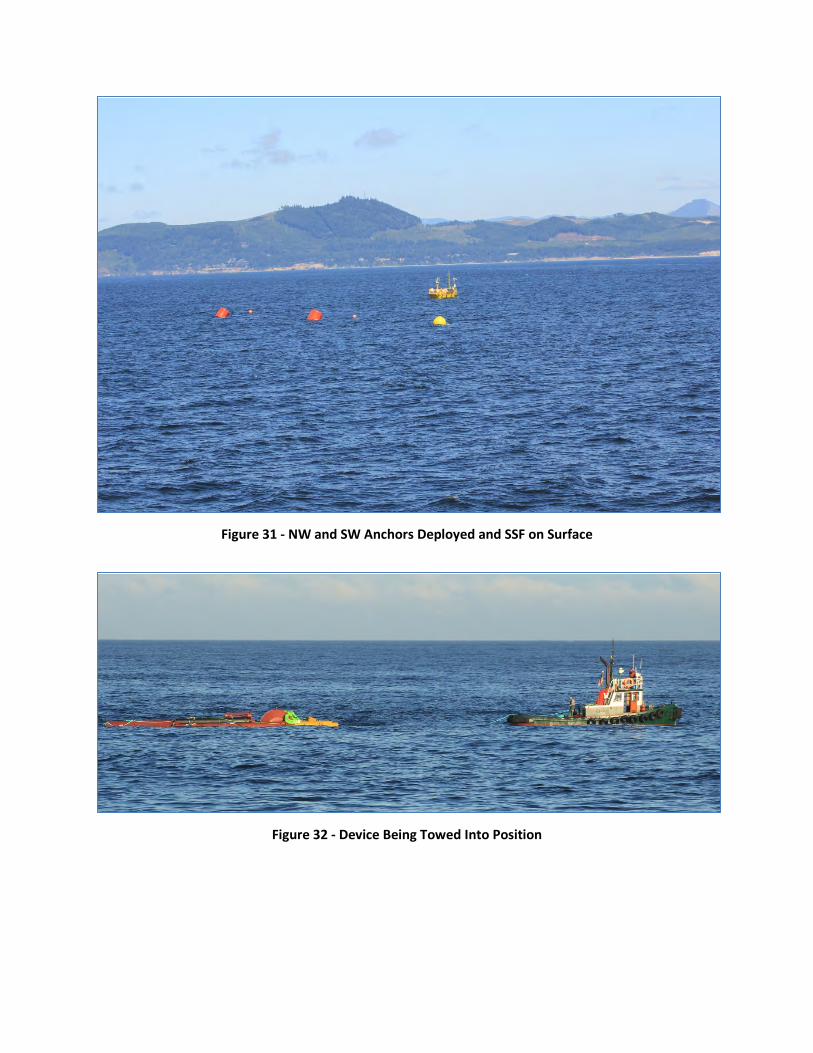
Figure 31 - NW and SW Anchors Deployed and SSF on Surface
Figure 32 - Device Being Towed Into Position
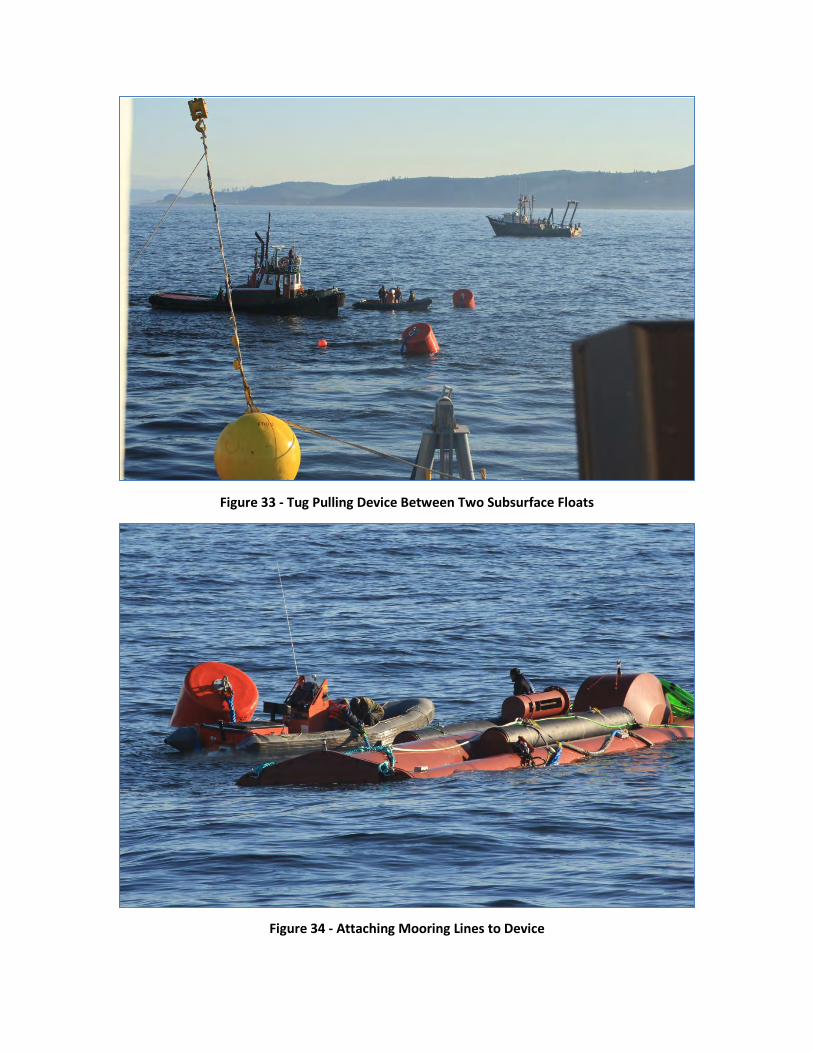
Figure 33 - Tug Pulling Device Between Two Subsurface Floats
Figure 34 - Attaching Mooring Lines to Device
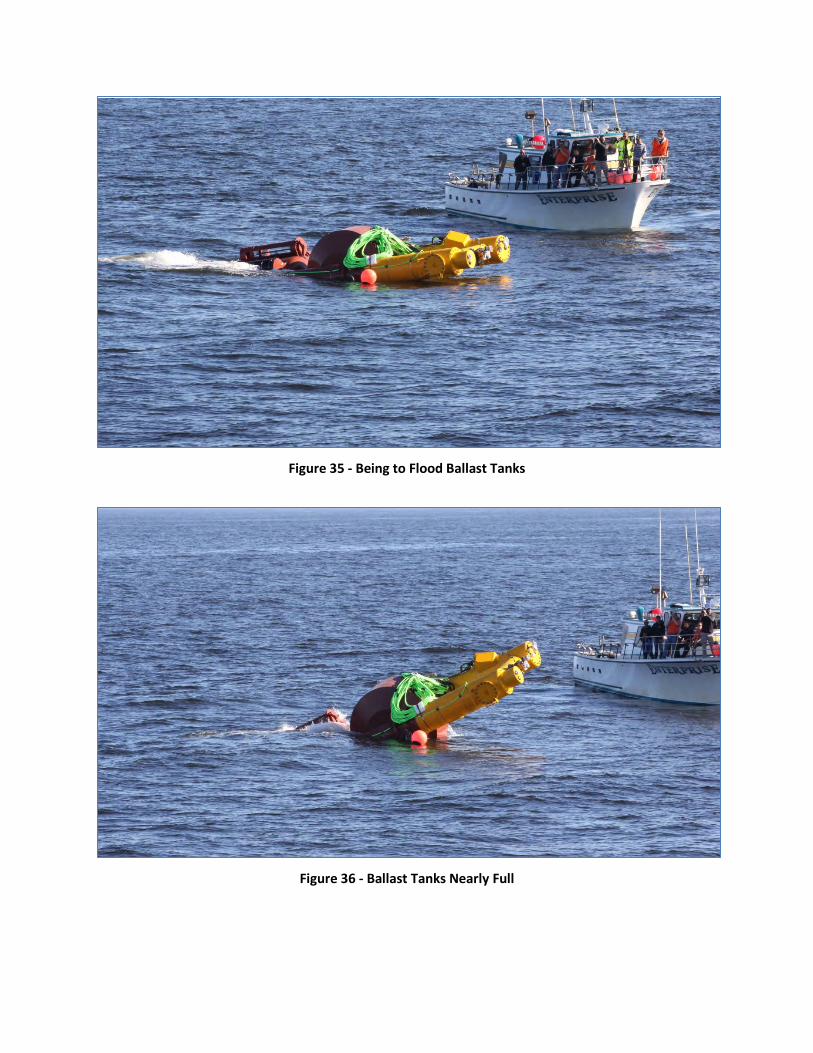
Figure 35 - Being to Flood Ballast Tanks
Figure 36 - Ballast Tanks Nearly Full
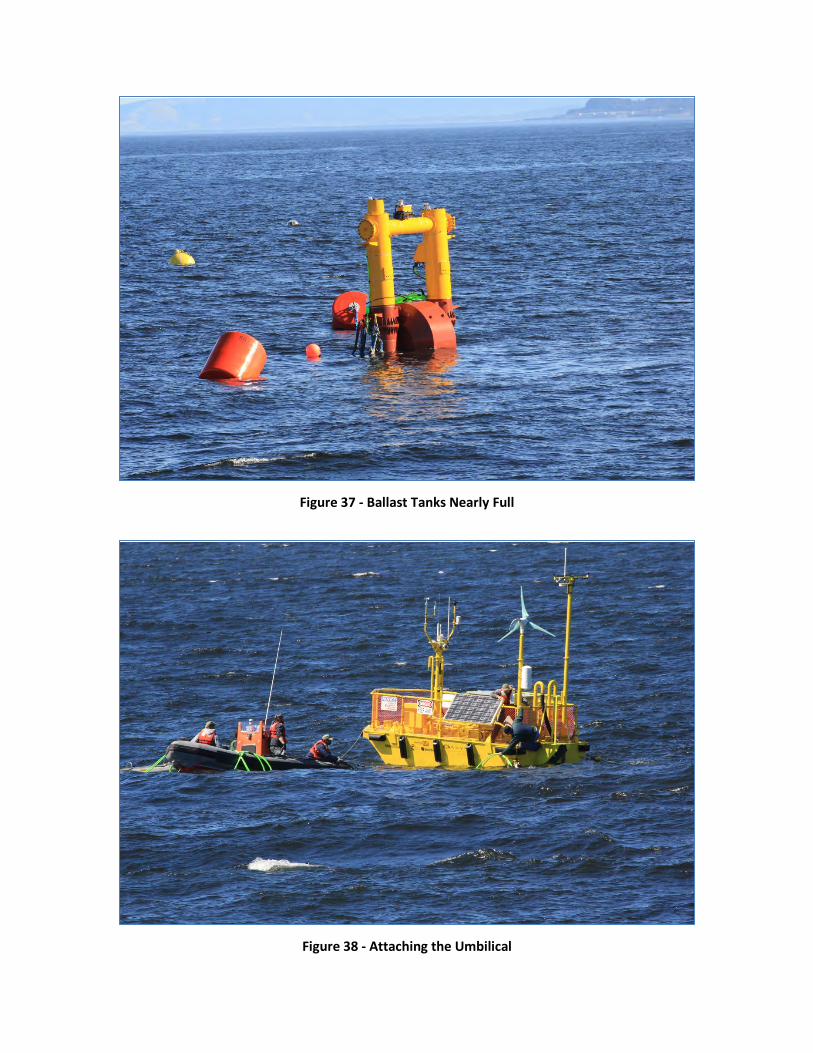
Figure 37 - Ballast Tanks Nearly Full
Figure 38 - Attaching the Umbilical
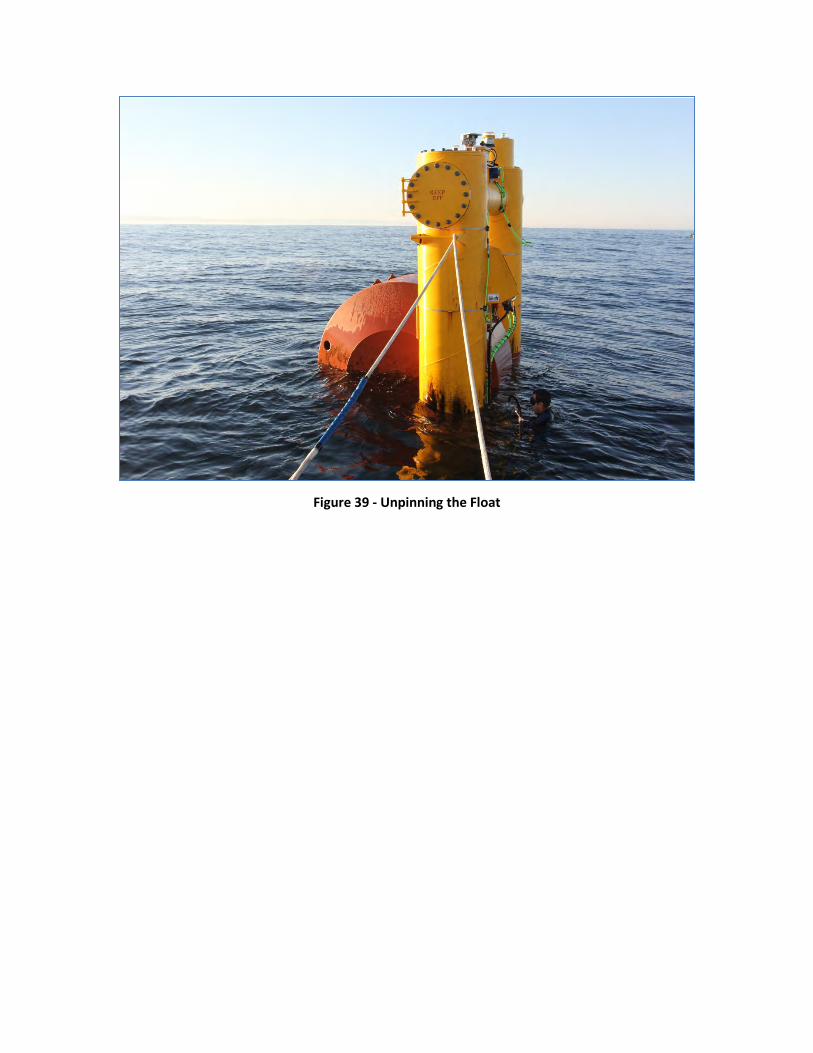
Figure 39 - Unpinning the Float
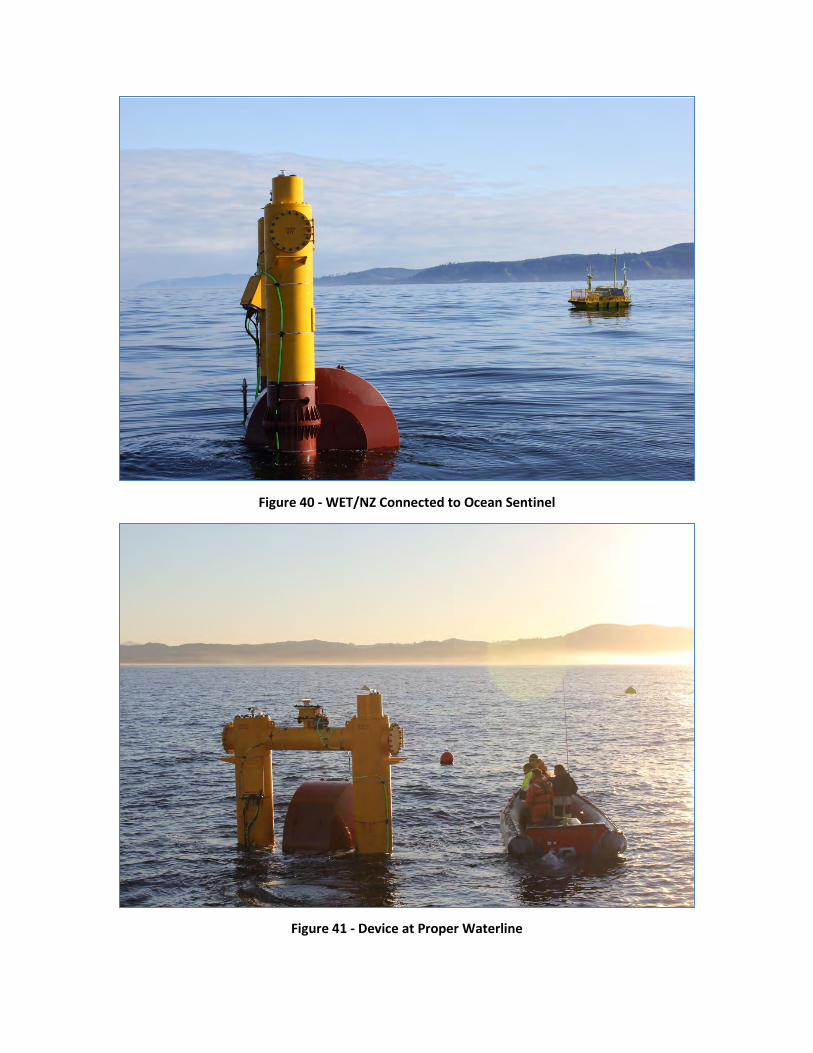
Figure 40 - WET/NZ Connected to Ocean Sentinel
Figure 41 - Device at Proper Waterline
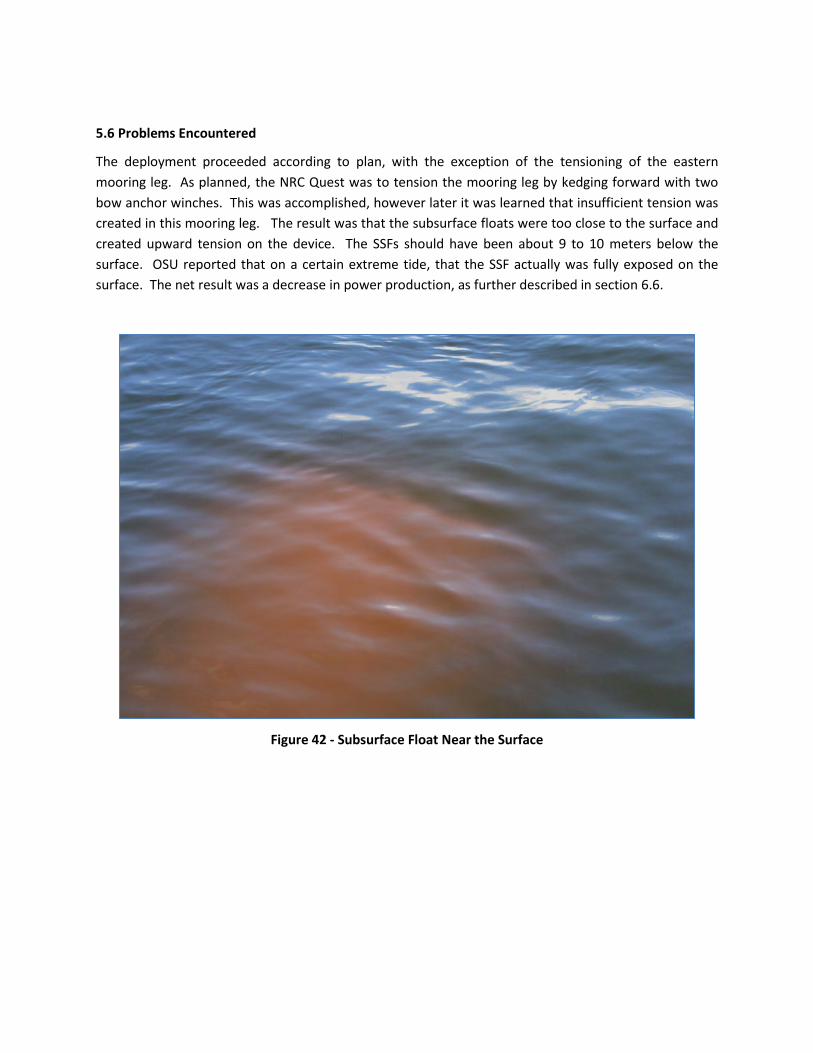
5.6 Problems Encountered
The deployment proceeded according to plan, with the exception of the tensioning of the eastern mooring leg. As planned, the NRC Quest was to tension the mooring leg by kedging forward with two bow anchor winches. This was accomplished, however later it was learned that insufficient tension was created in this mooring leg. The result was that the subsurface floats were too close to the surface and created upward tension on the device. The SSFs should have been about 9 to 10 meters below the surface. OSU reported that on a certain extreme tide, that the SSF actually was fully exposed on the surface. The net result was a decrease in power production, as further described in section 6.6.
Figure 42 - Subsurface Float Near the Surface
Section 6 Testing and Data Analysis 6.1 Subtasks Included
The following SOPO subtasks are discussed as part of this report section:
• 2.13 Ocean Testing
6.2 Purpose
The scope of this work includes:
• Characterizing the seaworthiness and sea keeping of the WET-NZ WEC in various sea states via direction motion measurements
• Assessing deployment, operation, servicing and recovery methods and procedures in real sea conditions of both the WET-NZ WEC and the NNMREC wave sentinel buoy via deployment and testing at the NNMREC test site off of the Oregon coast.
• Characterizing the WET-NZ WEC power take-off (PTO) function and performance over a range of sea conditions via direct power, sea condition and PTO mechanical measurements
• Assessing and turning the measurement and communication capabilities of MOISyt
• Assessing the WET-NZ WEC mooring configuration, its stiffness, its loads and its self-alignment tendency using motion measurements and mooring line tensions
• Collecting data to validate dynamics models, power generation predictions and tune control algorithms
6.3 Project Partners and Roles
• OSU/NNMREC – Ocean Sentinel Operation and data collection and reduction
• Callaghan Innovation – data analysis
6.4 Approach
6.4.1 Test Setup
As shown in Figure 43, the test setup includes the flowing components:
• WET-NZ,
• Ocean Sentinel,
• MOISyt instrumentation system, and the
• TRIAXYS wave buoy.
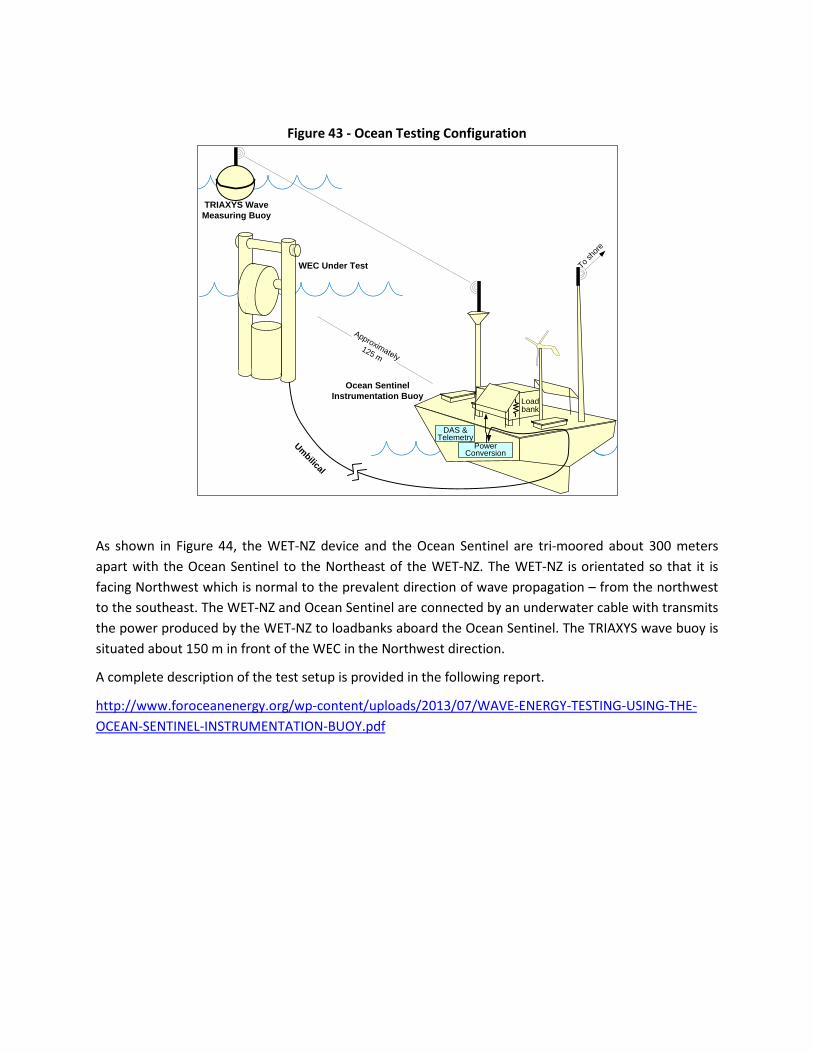
Figure 43 - Ocean Testing Configuration
As shown in Figure 44, the WET-NZ device and the Ocean Sentinel are tri-moored about 300 meters apart with the Ocean Sentinel to the Northeast of the WET-NZ. The WET-NZ is orientated so that it is facing Northwest which is normal to the prevalent direction of wave propagation – from the northwest to the southeast. The WET-NZ and Ocean Sentinel are connected by an underwater cable with transmits the power produced by the WET-NZ to loadbanks aboard the Ocean Sentinel. The TRIAXYS wave buoy is situated about 150 m in front of the WEC in the Northwest direction.
A complete description of the test setup is provided in the following report.
http://www.foroceanenergy.org/wp-content/uploads/2013/07/WAVE-ENERGY-TESTING-USING-THE-OCEAN-SENTINEL-INSTRUMENTATION-BUOY.pdf
WEC Under Test To sho
re
Approximately125 m
Umbilical
Power Conversion
TRIAXYS Wave Measuring Buoy
Loadbank
Ocean SentinelInstrumentation Buoy
DAS & Telemetry
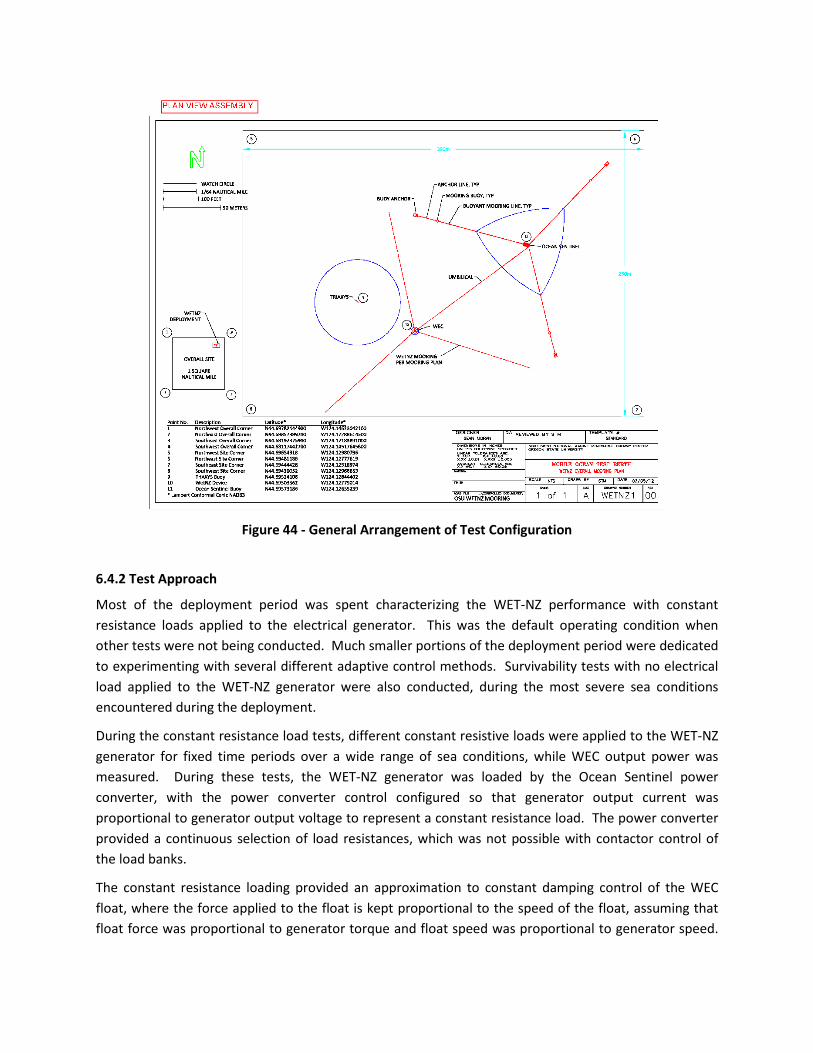
Figure 44 - General Arrangement of Test Configuration
6.4.2 Test Approach
Most of the deployment period was spent characterizing the WET-NZ performance with constant resistance loads applied to the electrical generator. This was the default operating condition when other tests were not being conducted. Much smaller portions of the deployment period were dedicated to experimenting with several different adaptive control methods. Survivability tests with no electrical load applied to the WET-NZ generator were also conducted, during the most severe sea conditions encountered during the deployment.
During the constant resistance load tests, different constant resistive loads were applied to the WET-NZ generator for fixed time periods over a wide range of sea conditions, while WEC output power was measured. During these tests, the WET-NZ generator was loaded by the Ocean Sentinel power converter, with the power converter control configured so that generator output current was proportional to generator output voltage to represent a constant resistance load. The power converter provided a continuous selection of load resistances, which was not possible with contactor control of the load banks.
The constant resistance loading provided an approximation to constant damping control of the WEC float, where the force applied to the float is kept proportional to the speed of the float, assuming that float force was proportional to generator torque and float speed was proportional to generator speed.
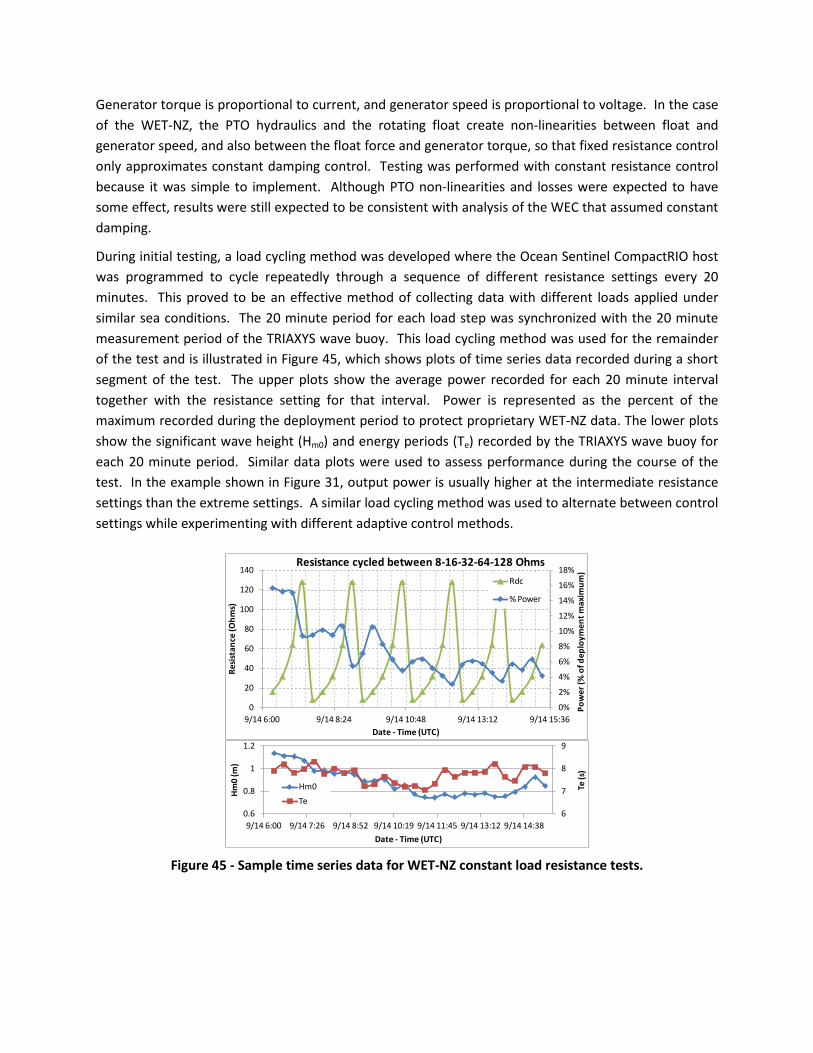
Generator torque is proportional to current, and generator speed is proportional to voltage. In the case of the WET-NZ, the PTO hydraulics and the rotating float create non-linearities between float and generator speed, and also between the float force and generator torque, so that fixed resistance control only approximates constant damping control. Testing was performed with constant resistance control because it was simple to implement. Although PTO non-linearities and losses were expected to have some effect, results were still expected to be consistent with analysis of the WEC that assumed constant damping.
During initial testing, a load cycling method was developed where the Ocean Sentinel CompactRIO host was programmed to cycle repeatedly through a sequence of different resistance settings every 20 minutes. This proved to be an effective method of collecting data with different loads applied under similar sea conditions. The 20 minute period for each load step was synchronized with the 20 minute measurement period of the TRIAXYS wave buoy. This load cycling method was used for the remainder of the test and is illustrated in Figure 45, which shows plots of time series data recorded during a short segment of the test. The upper plots show the average power recorded for each 20 minute interval together with the resistance setting for that interval. Power is represented as the percent of the maximum recorded during the deployment period to protect proprietary WET-NZ data. The lower plots show the significant wave height (Hm0) and energy periods (Te) recorded by the TRIAXYS wave buoy for each 20 minute period. Similar data plots were used to assess performance during the course of the test. In the example shown in Figure 31, output power is usually higher at the intermediate resistance settings than the extreme settings. A similar load cycling method was used to alternate between control settings while experimenting with different adaptive control methods.
Figure 45 - Sample time series data for WET-NZ constant load resistance tests.
0%
2%
4%
6%
8%
10%
12%
14%
16%
18%
0
20
40
60
80
100
120
140
9/14 6:00 9/14 8:24 9/14 10:48 9/14 13:12 9/14 15:36
Pow
er (%
of d
eplo
ymen
t max
imum
)
Resis
tanc
e (O
hms)
Date - Time (UTC)
Resistance cycled between 8-16-32-64-128 Ohms Rdc
% Power
6
7
8
9
0.6
0.8
1
1.2
9/14 6:00 9/14 7:26 9/14 8:52 9/14 10:19 9/14 11:45 9/14 13:12 9/14 14:38
Te (s
)
Hm0
(m)
Date - Time (UTC)
Hm0Te
6.4.3 Sea Conditions
A large set of 20 minute data samples was collected during the deployment for constant resistance operation under a variety of sea conditions. A histogram of the 20 minute sample counts for each one-half meter wide Hm0 and one second wide Te bin is shown in Figure 46 that includes data for all resistance settings used. Hm0 and Te are calculated from zero and first negative moments (m0 and m-1) of the wave spectra recorded by the TRIAXYS wave buoy, per equations (1) and (2).
𝐻𝑚0 = 4�𝑚0 (1)
𝑇𝑒 =𝑚−1
𝑚0 (2)
Figure 46 - Histogram of sample counts for constant load resistance data.
The half-scale WET-NZ device was not expected to produce significant power from portions of the wave spectra with periods greater than approximately 9 seconds. More test time was therefore desired in conditions with lower Te, especially in the 6 to 8 second range, than occurred during the deployment. Much of the testing was carried out in longer period seas, where the WET-NZ responded more to the shorter wind waves in the spectra than to the ocean swell.
10
7
1
59
166
34
39
168
108
138
11
59
159
71
118
40
16
44
49
89
57
30
4
24
16
31
24
23
4
11
1
14
19
11
1
4
7
7
2
3
1
Te Bin Center (s)
Hm0
Bin
Cent
er (m
)
Sample Count (20 min sample periods)Aug 27 - Oct 5, constant Rdc operating data
6.5 7.5 8.5 9.5 10.5 11.5 12.5 13.5 14.5
0.75
1.25
1.75
2.25
2.75
3.25
3.75
6.5 Results
The following tests were performed during the WET-NZ deployment:
1. Constant resistance load characterization
2. Voltage threshold switched resistance load characterization for two modes:
• Latching (lower resistance below a voltage threshold)
• Declutching (higher resistance below a voltage threshold)
3. Maximum Power Point Tracking (MPPT) using two algorithms:
• Perturb and observe
• Cycling
4. Survivability tests with no load applied.
After the deployment period, data collected on board the Ocean Sentinel was analyzed by NNMREC. Most of the analysis focused on characterizing the WET-NZ performance while constant resistance loads were applied under different sea conditions. Data included average power, load resistance, and both ocean wave statistics and spectra for each 20 minute sample period. Data collected while the WET-NZ was controlled using other methods was also assessed. Callaghan Innovation independently analyzed data that was collected on board the WET-NZ using a separate data acquisition system. Some of the results of the half-scale WET-NZ tests were as follows:
1. An optimum in the device power output with respect to the constant resistance load applied to the generator was observed and characterized.
2. The low response of the half-scale WET-NZ to wave periods greater than 9 seconds that was predicted by Callaghan Innovation simulations was verified.
3. Controlled external resistance loading via the Ocean Sentinel allowed essential data to be collected on board the WET-NZ, from which the PTO operation was characterized in detail by Callaghan Innovation under a wide range of sea conditions.
4. The CompactRIO control on the Ocean Sentinel was effectively used to experiment with different adaptive control methods. Some of these methods have potential to improve WEC output power, although insufficient data was collected to fully characterize device performance
5. No issues were observed during no-load survivability testing of the WET-NZ, carried out under the most severe sea conditions that occurred during the deployment.
A complete description of results is shown in Appendix E.2
2 T. Lettenmaier, “Testing of Wave Energy Converters using the Ocean Sentinel Instrumentation Buoy,” Ph.D. Thesis, Oregon State University, 2013.
6.6 Problems Encountered
6.6.1 Device Performance
From computer simulations, power output in medium wave conditions of around 3 kW average was anticipated. In fact, only about 0.5 kW average was measured.
Whilst a large power output was not expected from this deployment, the measured electrical power was substantially below expectations. This was evidenced mechanically by the immediately obvious “stiffness of the float in response to wave motion, which affected travel of the float irrespective of the magnitude of electrical load applied to the PTO generator.
To summarize, high power output was not expected for the following reasons:
• The 1:2 scale device WET-NZ device cannot respond effectively to full scale wave characteristics (period, height).
• An auxiliary hydraulic alternator system for battery charging was fitted to the Oregon device. This was known to be inefficient, but considered a priority load because of battery issues experiences in the initial New Zealand deployments. Its loss characteristics in variable low-power operation hydraulic transmission were unknown.
• The overpressure accumulator was set to a very low preload level. This was known to impact significantly on performance but a conservative view that survivability was more important than performance prevailed.
• The float shape was not optimized, and some design compromises were made in scaling it from the 1:30 model. The effect of these changes was at that time unknown, other than the generically positive indications from the OSU wave tank testing.
• The hydraulic motor-electric generator combination was known to not be well matched for the expected speed-power ranges, and these components are greatly oversized for the anticipated power flows. This was expected to introduce losses that could not have been quantified without specific testing of these components.
• The peak power transfer was deliberately limited to 20kW to manage component temperatures in both the hydraulic and electric circuits. This placed restrictions on the hydraulic system power operating window due to the highly variable nature of wave energy flow. These were undetermined until this analysis.
In summary, low power output resulted from a combination of several design decisions:
• The cylindrical float not providing sufficient torque (an unexpected experimental result),
• Higher than expected main bearing resistance (due to the factors below and also possibly some shaft binding resulting from manufacture and assembly tolerances),

• Use of 4” instead of 3” cylinders increased seal losses and increased transmission damping losses,
• Battery charging load (use of a high load hydraulic alternator charging circuit which was set to continuously dump the full charging load, even when the battery was fully charged),
• Setting of the overpressure accumulator to an unnecessarily conservative pressure of ~60 bar such that the operating pressure mostly averaged only 35 bar even in high waves and never reached higher than ~120 bar (full design range is 300bar),
• All of the above effects combined to create sufficient mechanical and hydraulic damping such that the device was over-damped at all times and the optimum damping (load impedance) could not be established. This also meant that a further component of wave energy that should have been absorbed was deflected.
6.6.2 MOISyt System Failure
The NREL MOISyt instrumentation failed and as such no device position, acceleration, or mooring load data was collected.

Final Scientific Technical Report DE-EE0003642
33 | P a g e
APPENDIX E – PERFORMANCE SUMMARY
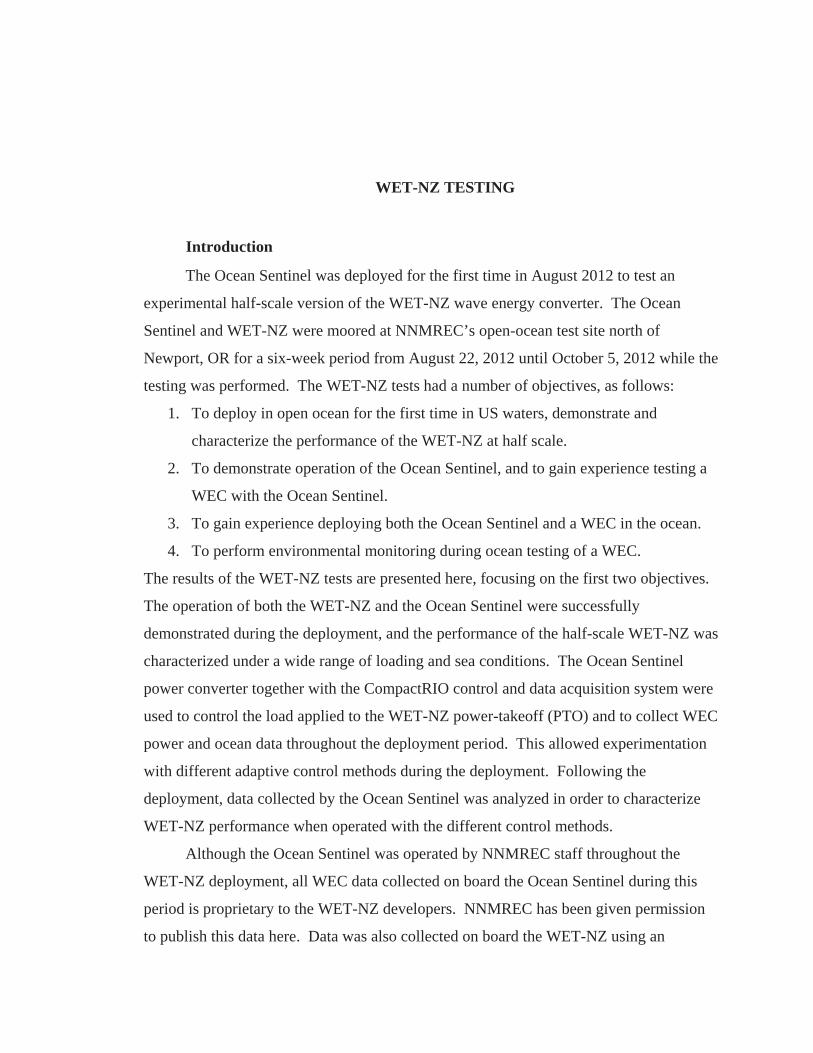
60
4 WET-NZ TESTING
4.1 Introduction
The Ocean Sentinel was deployed for the first time in August 2012 to test an
experimental half-scale version of the WET-NZ wave energy converter. The Ocean
Sentinel and WET-NZ were moored at NNMREC’s open-ocean test site north of
Newport, OR for a six-week period from August 22, 2012 until October 5, 2012 while the
testing was performed. The WET-NZ tests had a number of objectives, as follows:
1. To deploy in open ocean for the first time in US waters, demonstrate and
characterize the performance of the WET-NZ at half scale.
2. To demonstrate operation of the Ocean Sentinel, and to gain experience testing a
WEC with the Ocean Sentinel.
3. To gain experience deploying both the Ocean Sentinel and a WEC in the ocean.
4. To perform environmental monitoring during ocean testing of a WEC.
The results of the WET-NZ tests are presented here, focusing on the first two objectives.
The operation of both the WET-NZ and the Ocean Sentinel were successfully
demonstrated during the deployment, and the performance of the half-scale WET-NZ was
characterized under a wide range of loading and sea conditions. The Ocean Sentinel
power converter together with the CompactRIO control and data acquisition system were
used to control the load applied to the WET-NZ power-takeoff (PTO) and to collect WEC
power and ocean data throughout the deployment period. This allowed experimentation
with different adaptive control methods during the deployment. Following the
deployment, data collected by the Ocean Sentinel was analyzed in order to characterize
WET-NZ performance when operated with the different control methods.
Although the Ocean Sentinel was operated by NNMREC staff throughout the
WET-NZ deployment, all WEC data collected on board the Ocean Sentinel during this
period is proprietary to the WET-NZ developers. NNMREC has been given permission
to publish this data here. Data was also collected on board the WET-NZ using an

61
independent data acquisition system; that data is not presented here, although reference is
made to analysis of this data to support interpretation of the NNMREC results.
4.2 Description of the WET-NZ
A sketch of the half-scale WET-NZ and a photo of it at sea with the Ocean
Sentinel is shown in Figure 4-1. Characteristics of the device are listed in Table 4-1. The
WET-NZ is the product of a research consortium between Callaghan Innovation, a New
Zealand Crown Entity, and Power Projects Limited (PPL), a Wellington, New Zealand
private company. The Oregon deployment was project managed by Northwest Energy
Innovations (NWEI), a Portland, OR firm. The device tested in 2012 was half-scale by
length; output power scaling per the Froude similitude criteria was 1/11 relative to a
nominal full scale device [4]. The WET-NZ consists of a long submerged hull, with a
power pod mounted on top that includes a cylindrical float and the power take-off
system. The hull of the half-scale WET-NZ tested with the Ocean Sentinel was
fabricated at Oregon Iron Works in Portland, OR, and the power pod was fabricated and
assembled in New Zealand.
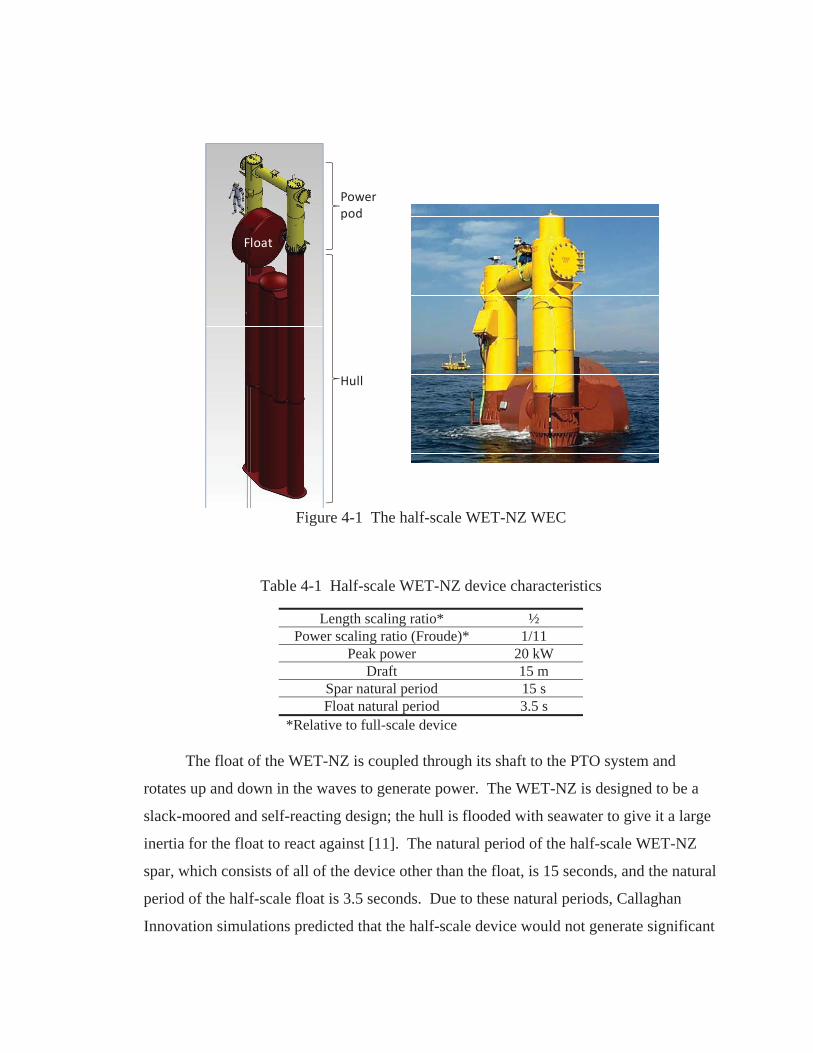
62
Figure 4-1 The half-scale WET-NZ WEC
Table 4-1 Half-scale WET-NZ device characteristics
Length scaling ratio* ½ Power scaling ratio (Froude)* 1/11
Peak power 20 kW Draft 15 m
Spar natural period 15 s Float natural period 3.5 s
*Relative to full-scale device
The float of the WET-NZ is coupled through its shaft to the PTO system and
rotates up and down in the waves to generate power. The WET-NZ is designed to be a
slack-moored and self-reacting design; the hull is flooded with seawater to give it a large
inertia for the float to react against [11]. The natural period of the half-scale WET-NZ
spar, which consists of all of the device other than the float, is 15 seconds, and the natural
period of the half-scale float is 3.5 seconds. Due to these natural periods, Callaghan
Innovation simulations predicted that the half-scale device would not generate significant
Powerpod
Hull
Float
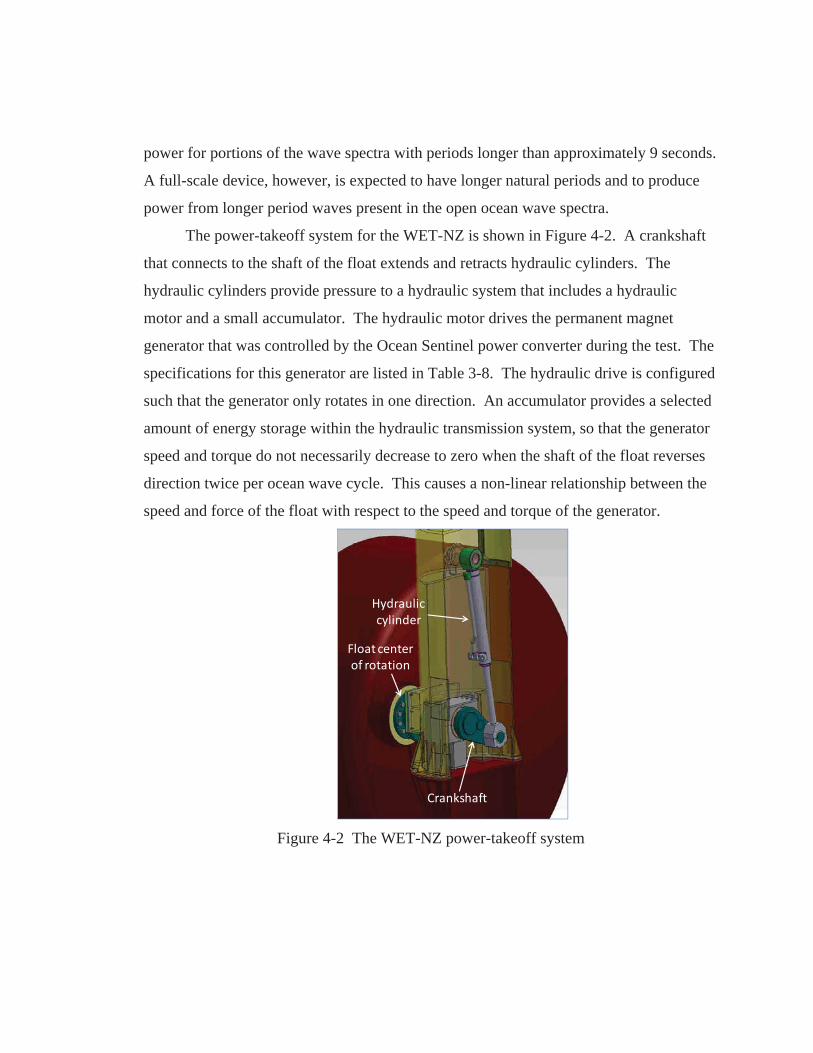
63
power for portions of the wave spectra with periods longer than approximately 9 seconds.
A full-scale device, however, is expected to have longer natural periods and to produce
power from longer period waves present in the open ocean wave spectra.
The power-takeoff system for the WET-NZ is shown in Figure 4-2. A crankshaft
that connects to the shaft of the float extends and retracts hydraulic cylinders. The
hydraulic cylinders provide pressure to a hydraulic system that includes a hydraulic
motor and a small accumulator. The hydraulic motor drives the permanent magnet
generator that was controlled by the Ocean Sentinel power converter during the test. The
specifications for this generator are listed in Table 3-8. The hydraulic drive is configured
such that the generator only rotates in one direction. An accumulator provides a selected
amount of energy storage within the hydraulic transmission system, so that the generator
speed and torque do not necessarily decrease to zero when the shaft of the float reverses
direction twice per ocean wave cycle. This causes a non-linear relationship between the
speed and force of the float with respect to the speed and torque of the generator.
Figure 4-2 The WET-NZ power-takeoff system
Crankshaft
Hydrauliccylinder
Float centerof rotation
64
It should be noted that the WET-NZ device contained on-board batteries,
generator, load bank and control system as backup in the event that the umbilical
connection to the Ocean Sentinel was lost. This charging system created a substantial
continuous load on the WEC PTO, irrespective of the power supply provided from the
umbilical. The Ocean Sentinel instrumentation was unable to measure this load. The
backup systems were not required at any stage during the deployment.
4.3 Test Setup
The WET-NZ, the Ocean Sentinel, and the TRIAXYS wave buoy were deployed
at the NNMREC scaled test site with the layout shown in Figure 4-3. Refer to Figure 1-3
for a map showing the location of the test site. Three-point mooring systems were used
for both the WET-NZ and Ocean Sentinel. The TRIAXYS wave buoy was moored to the
north side of the test site where it was more protected from pleasure and fishing vessel
traffic. The four corners of the 350 meter by 250 meter test area were marked by corner
buoys, per US Coast Guard requirements. Ocean swell is typically from the west-
northwest at the test site in August and September, with winds typically from the
northwest.
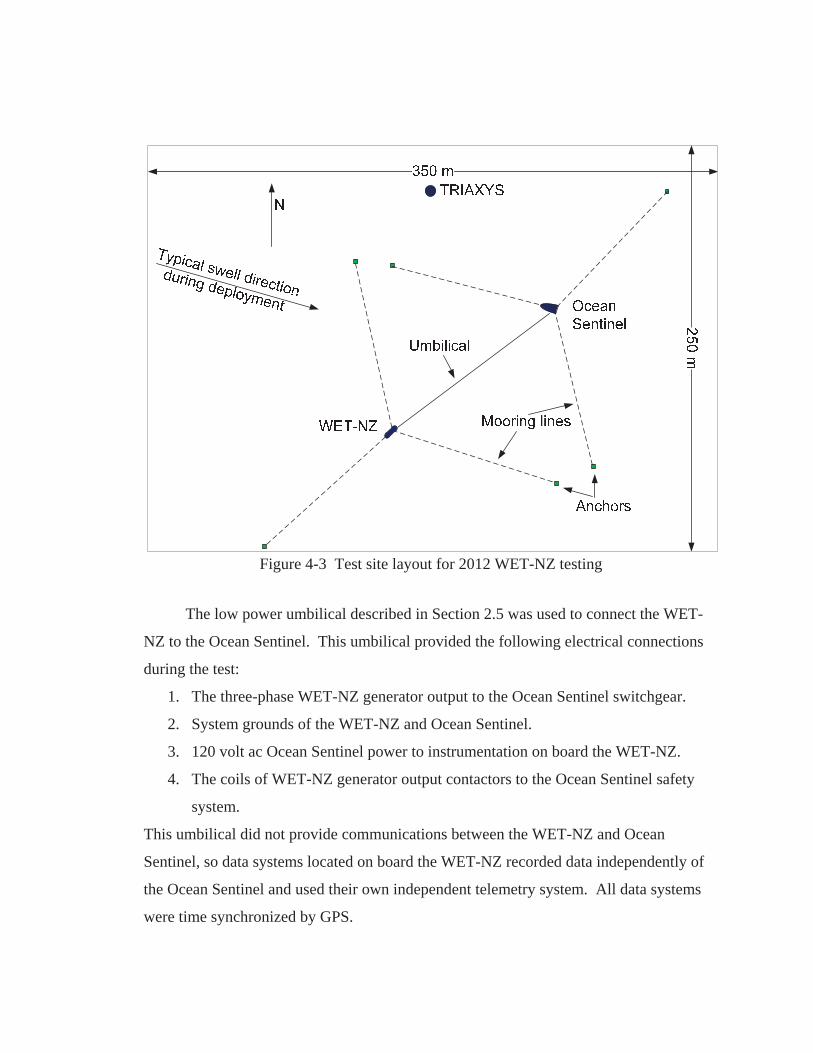
65
Figure 4-3 Test site layout for 2012 WET-NZ testing
The low power umbilical described in Section 2.5 was used to connect the WET-
NZ to the Ocean Sentinel. This umbilical provided the following electrical connections
during the test:
1. The three-phase WET-NZ generator output to the Ocean Sentinel switchgear.
2. System grounds of the WET-NZ and Ocean Sentinel.
3. 120 volt ac Ocean Sentinel power to instrumentation on board the WET-NZ.
4. The coils of WET-NZ generator output contactors to the Ocean Sentinel safety
system.
This umbilical did not provide communications between the WET-NZ and Ocean
Sentinel, so data systems located on board the WET-NZ recorded data independently of
the Ocean Sentinel and used their own independent telemetry system. All data systems
were time synchronized by GPS.
66
The WET-NZ generator was controlled by the Ocean Sentinel power conversion
equipment and the CompactRIO data acquisition and control system that is described in
detail in Chapter 3 throughout the test. The specific configuration used for the WET-NZ
tests were as follows:
The Ocean Sentinel power converter was used alone to provide the WET-NZ
generator load. The two additional 25 kW contactor controlled load banks that
are also available on the Ocean Sentinel were not used.
The load for the Ocean Sentinel power converter was provided by the 50 kW load
bank, with the individual elements wired in series-parallel for a load bank
resistance of 4.2 .
4.4 Test Sequence
The following tests were performed during the WET-NZ deployment:
1. Constant resistance load characterization
2. Voltage threshold switched resistance load characterization for two modes:
Latching (lower resistance below a voltage threshold)
Declutching (higher resistance below a voltage threshold)
3. Maximum Power Point Tracking (MPPT) using two algorithms:
Perturb and observe
Cycling
4. Survivability tests with no load applied.
The cumulative operating hours spent performing each of these tests during the
six-week deployment period are listed in Table 4-2. In order to conduct each test under a
wide range of sea conditions, each test was performed in short segments that were
interspersed throughout the deployment period. The greatest portion of the deployment
period was spent collecting constant resistance load data. This was the default operating
condition when other tests were not being conducted. Much smaller portions of the
deployment period were dedicated to the voltage threshold switching and the MPPT tests.
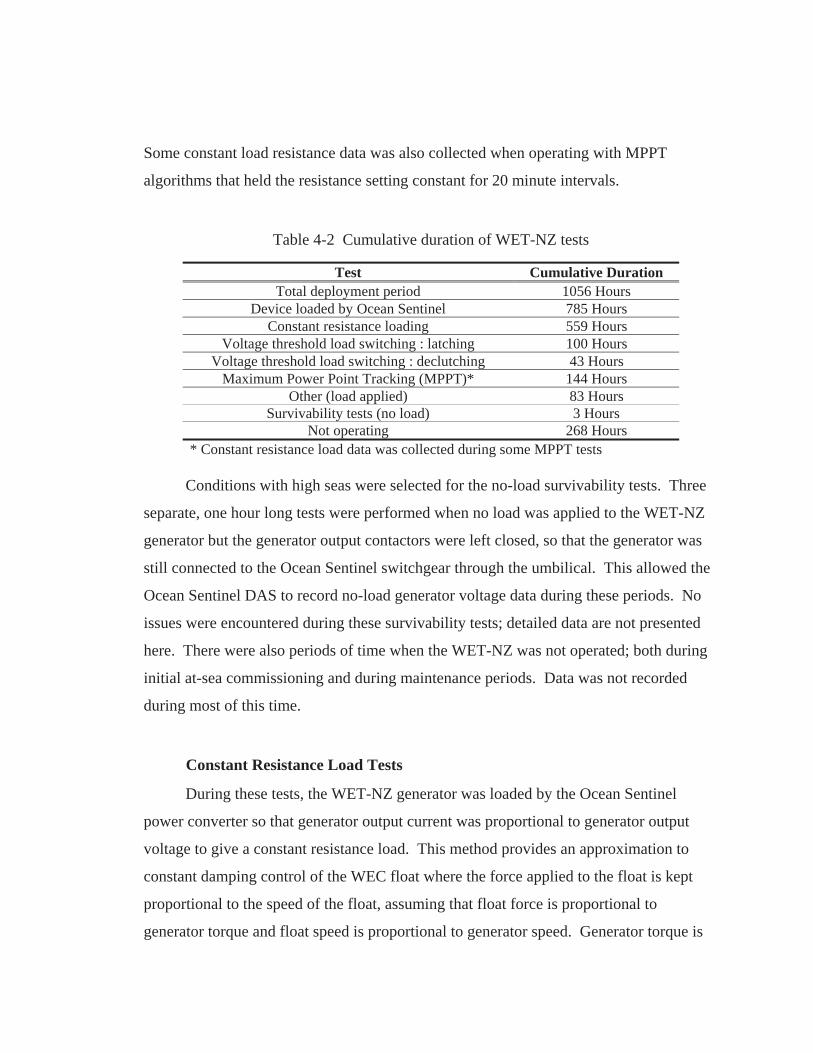
67
Some constant load resistance data was also collected when operating with MPPT
algorithms that held the resistance setting constant for 20 minute intervals.
Table 4-2 Cumulative duration of WET-NZ tests
Test Cumulative Duration Total deployment period 1056 Hours
Device loaded by Ocean Sentinel 785 Hours Constant resistance loading 559 Hours
Voltage threshold load switching : latching 100 Hours Voltage threshold load switching : declutching 43 Hours
Maximum Power Point Tracking (MPPT)* 144 Hours Other (load applied) 83 Hours
Survivability tests (no load) 3 Hours Not operating 268 Hours
* Constant resistance load data was collected during some MPPT tests
Conditions with high seas were selected for the no-load survivability tests. Three
separate, one hour long tests were performed when no load was applied to the WET-NZ
generator but the generator output contactors were left closed, so that the generator was
still connected to the Ocean Sentinel switchgear through the umbilical. This allowed the
Ocean Sentinel DAS to record no-load generator voltage data during these periods. No
issues were encountered during these survivability tests; detailed data are not presented
here. There were also periods of time when the WET-NZ was not operated; both during
initial at-sea commissioning and during maintenance periods. Data was not recorded
during most of this time.
4.5 Constant Resistance Load Tests
During these tests, the WET-NZ generator was loaded by the Ocean Sentinel
power converter so that generator output current was proportional to generator output
voltage to give a constant resistance load. This method provides an approximation to
constant damping control of the WEC float where the force applied to the float is kept
proportional to the speed of the float, assuming that float force is proportional to
generator torque and float speed is proportional to generator speed. Generator torque is

68
proportional to current, and generator speed is proportional to voltage. In the case of the
WET-NZ, however, the PTO hydraulics and the rotating float create non-linearities
between float and generator speed, and also between the float force and generator torque,
so that fixed resistance control only approximates constant damping control. Testing was
performed with constant resistance control because it was simple to implement.
Although PTO non-linearities were expected to have some effect, results were still
expected to be consistent with analysis of the WEC that assumed constant damping.
The constant resistance control of the Ocean Sentinel power converter was
implemented in the CompactRIO, as described in Section 3.5.8 and shown in Figure
3-16. The dc bus current in the converter was controlled to be proportional to the dc bus
voltage, rather than directly regulating the ac output of the generator. To avoid
confusion, all results and analysis are presented in terms of the control quantity Rdc,
which is the commanded resistance at the converter dc bus shown in Figure 3-16; Rdc is
referred to as the “load resistance”. Due to the three-phase rectification, the effective
three-phase wye resistance applied to the generator is lower than Rdc by a factor of
approximately 0.55 at high load. The relationship is non-linear, however, due to higher
relative losses in the converter at low load (high resistance); see Figure 3-26.
69
4.5.1 Test Method
During initial testing, a load cycling method was developed where the Ocean
Sentinel CompactRIO host was programmed to cycle repeatedly through a sequence of
different Rdc settings every 20 minutes, in order to collect data with different fixed loads
applied under similar sea conditions. The 20 minute period for each load step was
synchronized with the 20 minute measurement period of the TRIAXYS wave buoy. This
load cycling method was used for the remainder of the test, and is illustrated in Figure
4-4, which shows plots of time series data recorded during a short segment of the test. In
this example, the Rdc sequence 8-16-32-64-128 was used. The upper plots show the
average power recorded for each 20 minute interval together with the Rdc setting for that
interval. The lower plots show the significant wave height (Hm0) and energy periods (Te)
recorded by the TRIAXYS wave buoy for each 20 minute period. Similar data plots were
used to assess performance during the course of the test. In this example output power is
usually higher at the intermediate Rdc values than at 8 or 128 . Most testing was
performed with the Rdc sequence 8-16-32-64-128 although during some periods a 4
step was added. In addition to data collected using the load cycling technique, a small
amount of constant resistance load data was also collected during the MPPT tests.
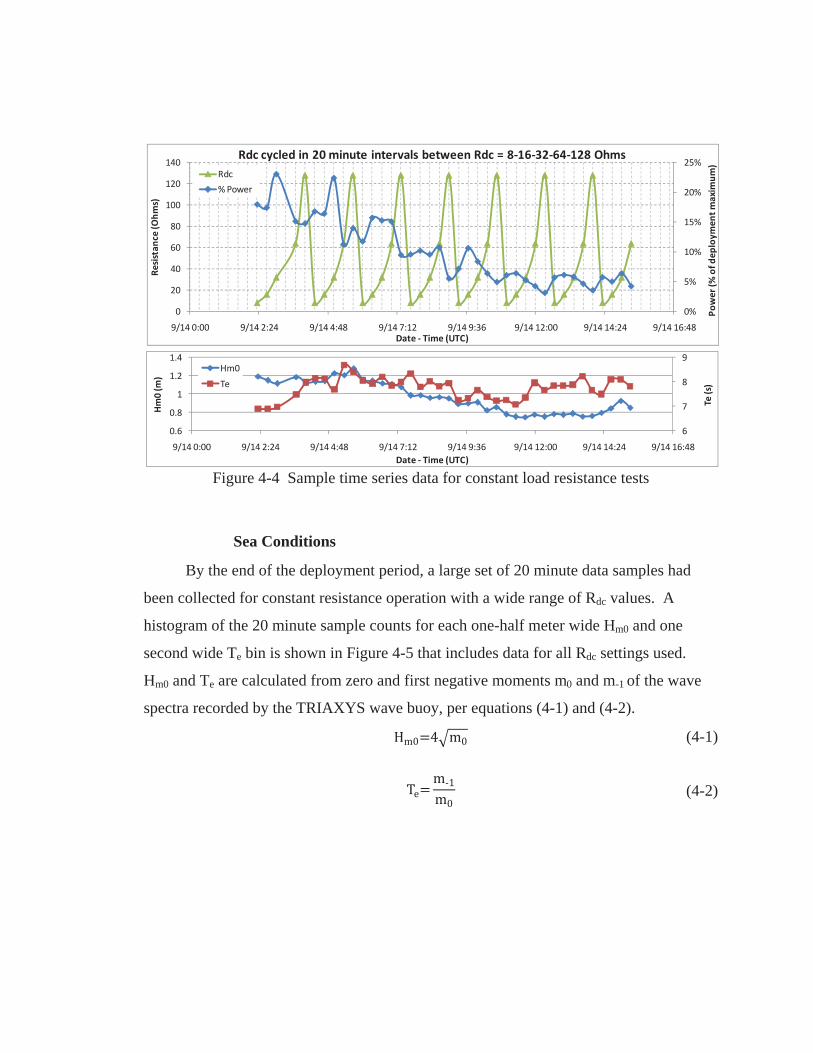
70
Figure 4-4 Sample time series data for constant load resistance tests
4.5.2 Sea Conditions
By the end of the deployment period, a large set of 20 minute data samples had
been collected for constant resistance operation with a wide range of Rdc values. A
histogram of the 20 minute sample counts for each one-half meter wide Hm0 and one
second wide Te bin is shown in Figure 4-5 that includes data for all Rdc settings used.
Hm0 and Te are calculated from zero and first negative moments m0 and m-1 of the wave
spectra recorded by the TRIAXYS wave buoy, per equations (4-1) and (4-2).
(4-1)
(4-2)
0%
5%
10%
15%
20%
25%
0
20
40
60
80
100
120
140
9/14 0:00 9/14 2:24 9/14 4:48 9/14 7:12 9/14 9:36 9/14 12:00 9/14 14:24 9/14 16:48
Power
(%of
deploy
men
tmaxim
um)
Resistan
ce(Ohm
s)
Date Time (UTC)
Rdc cycled in 20 minute intervals between Rdc = 8 16 32 64 128 OhmsRdc
%Power
6
7
8
9
0.6
0.8
1
1.2
1.4
9/14 0:00 9/14 2:24 9/14 4:48 9/14 7:12 9/14 9:36 9/14 12:00 9/14 14:24 9/14 16:48
Te(s)
Hm0(m
)
Date Time (UTC)
Hm0
Te
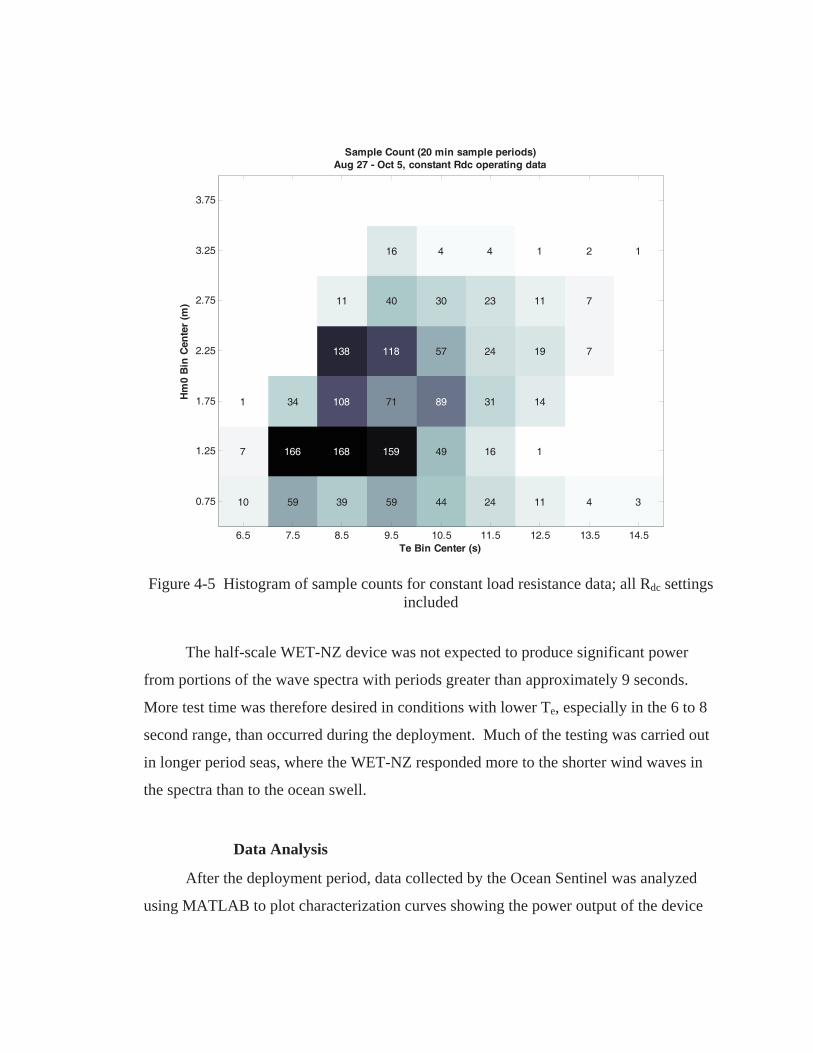
71
Figure 4-5 Histogram of sample counts for constant load resistance data; all Rdc settings
included
The half-scale WET-NZ device was not expected to produce significant power
from portions of the wave spectra with periods greater than approximately 9 seconds.
More test time was therefore desired in conditions with lower Te, especially in the 6 to 8
second range, than occurred during the deployment. Much of the testing was carried out
in longer period seas, where the WET-NZ responded more to the shorter wind waves in
the spectra than to the ocean swell.
4.5.3 Data Analysis
After the deployment period, data collected by the Ocean Sentinel was analyzed
using MATLAB to plot characterization curves showing the power output of the device
10
7
1
59
166
34
39
168
108
138
11
59
159
71
118
40
16
44
49
89
57
30
4
24
16
31
24
23
4
11
1
14
19
11
1
4
7
7
2
3
1
Te Bin Center (s)
Hm
0 B
in C
ente
r (m
)
Sample Count (20 min sample periods)Aug 27 - Oct 5, constant Rdc operating data
6.5 7.5 8.5 9.5 10.5 11.5 12.5 13.5 14.5
0.75
1.25
1.75
2.25
2.75
3.25
3.75

72
with respect to the Rdc settings under different sea conditions. Data included average
power, Rdc, and both ocean wave statistics and spectra for each 20 minute sample period.
The simplest method of presenting power output with respect to Rdc under different
sea conditions is shown in Figure 4-6, where the data is binned by Hm0 and Te and
individual plots are presented for each bin. WET-NZ output power is shown as the
percent of maximum WET-NZ output power measured during the deployment period to
protect IRL proprietary data. For the most part the Figure 4-6 plots do not show distinct
trends in output power with respect to Rdc. This is partly due to the large variation in
wave spectra that occurred within the same Hm0-Te bins and the variation in WEC output
power that resulted. This effect is illustrated in Figure 4-7, where the wave spectra for
two different 20 minute data periods are plotted that both have the same Te (9.1 seconds),
but significantly different spectral shapes. The upper spectrum has a single peak at 0.11
Hz (9.1 seconds), while the lower spectrum has two peaks, one at 0.1 Hz (10 seconds)
and another at 0.17 Hz (5.9 seconds). The second peak in the lower spectra is due to the
presence of locally generated, shorter period wind waves in addition to longer period
ocean swell. The half-scale WET-NZ was not expected to produce significant power for
portions of the wave spectra with periods greater than 9 seconds (frequencies below 0.11
Hz). The device was therefore expected to produce higher power from seas with the
lower spectrum in Figure 4-7, which has more energy content above 0.11 Hz, than from
the lower spectrum when the same Rdc settings were used, even though both data samples
are included in the same Te bin in Figure 4-6.
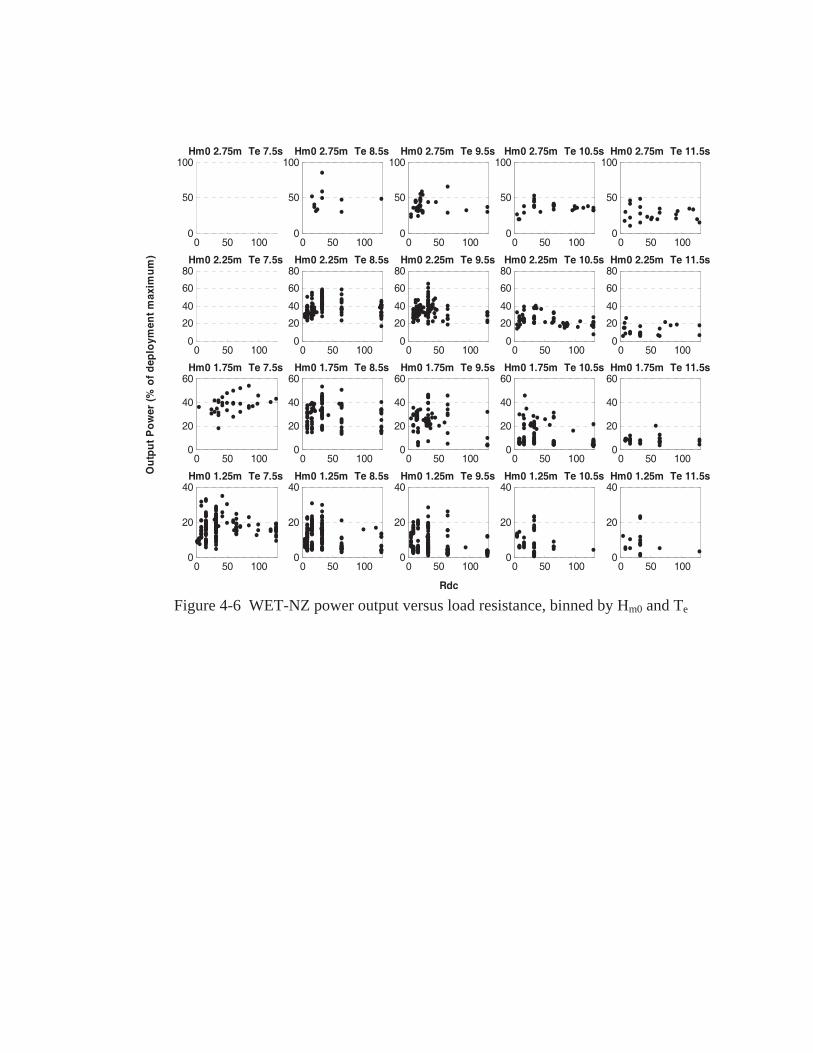
73
Figure 4-6 WET-NZ power output versus load resistance, binned by Hm0 and Te
Rdc
Ou
tpu
t P
ow
er (
% o
f d
eplo
ymen
t m
axim
um
)
0 50 1000
20
40Hm0 1.25m Te 7.5s
0 50 1000
20
40Hm0 1.25m Te 8.5s
0 50 1000
20
40Hm0 1.25m Te 9.5s
0 50 1000
20
40Hm0 1.25m Te 10.5s
0 50 1000
20
40Hm0 1.25m Te 11.5s
0 50 1000
20
40
60Hm0 1.75m Te 7.5s
0 50 1000
20
40
60Hm0 1.75m Te 8.5s
0 50 1000
20
40
60Hm0 1.75m Te 9.5s
0 50 1000
20
40
60Hm0 1.75m Te 10.5s
0 50 1000
20
40
60Hm0 1.75m Te 11.5s
0 50 1000
20
40
60
80Hm0 2.25m Te 7.5s
0 50 1000
20
40
60
80Hm0 2.25m Te 8.5s
0 50 1000
20
40
60
80Hm0 2.25m Te 9.5s
0 50 1000
20
40
60
80Hm0 2.25m Te 10.5s
0 50 1000
20
40
60
80Hm0 2.25m Te 11.5s
0 50 1000
50
100Hm0 2.75m Te 7.5s
0 50 1000
50
100Hm0 2.75m Te 8.5s
0 50 1000
50
100Hm0 2.75m Te 9.5s
0 50 1000
50
100Hm0 2.75m Te 10.5s
0 50 1000
50
100Hm0 2.75m Te 11.5s
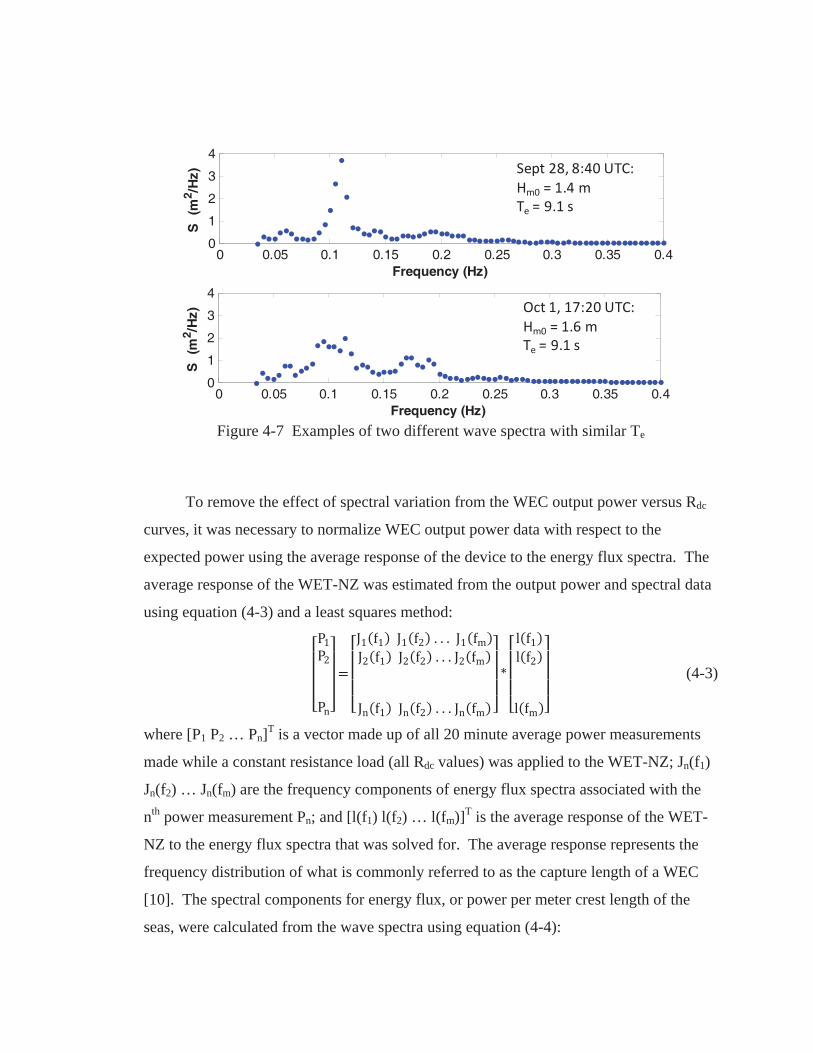
74
Figure 4-7 Examples of two different wave spectra with similar Te
To remove the effect of spectral variation from the WEC output power versus Rdc
curves, it was necessary to normalize WEC output power data with respect to the
expected power using the average response of the device to the energy flux spectra. The
average response of the WET-NZ was estimated from the output power and spectral data
using equation (4-3) and a least squares method:
(4-3)
where [P1 P2 … Pn]T is a vector made up of all 20 minute average power measurements
made while a constant resistance load (all Rdc values) was applied to the WET-NZ; Jn(f1)
Jn(f2) … Jn(fm) are the frequency components of energy flux spectra associated with the
nth power measurement Pn; and [l(f1) l(f2) … l(fm)]T is the average response of the WET-
NZ to the energy flux spectra that was solved for. The average response represents the
frequency distribution of what is commonly referred to as the capture length of a WEC
[10]. The spectral components for energy flux, or power per meter crest length of the
seas, were calculated from the wave spectra using equation (4-4):
0 0.05 0.1 0.15 0.2 0.25 0.3 0.35 0.40
1
2
3
4
Frequency (Hz)
S
(m2 /H
z) Sept 28, 8:40 UTC:Hm0 = 1.4 mTe = 9.1 s
0 0.05 0.1 0.15 0.2 0.25 0.3 0.35 0.40
1
2
3
4
Frequency (Hz)
S
(m2 /H
z) Oct 1, 17:20 UTC:Hm0 = 1.6 mTe = 9.1 s
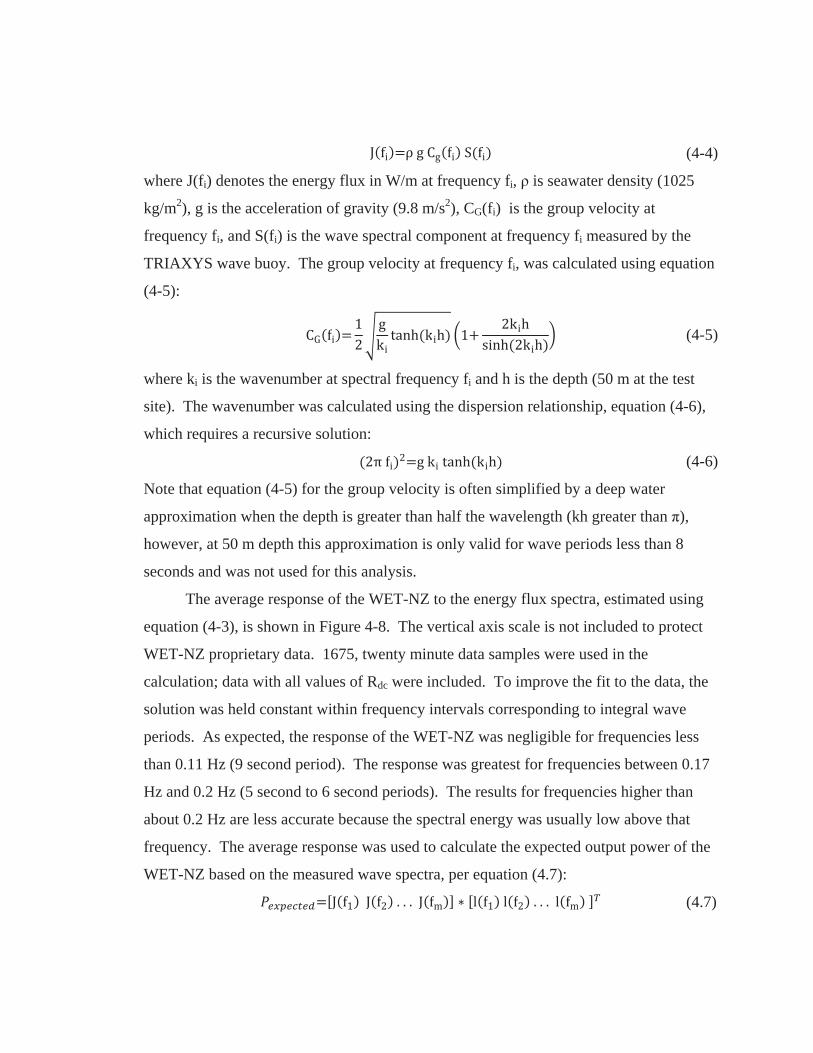
75
(4-4)
where J(fi) denotes the energy flux in W/m at frequency fi, is seawater density (1025
kg/m2), g is the acceleration of gravity (9.8 m/s2), CG(fi) is the group velocity at
frequency fi, and S(fi) is the wave spectral component at frequency fi measured by the
TRIAXYS wave buoy. The group velocity at frequency fi, was calculated using equation
(4-5):
(4-5)
where ki is the wavenumber at spectral frequency fi and h is the depth (50 m at the test
site). The wavenumber was calculated using the dispersion relationship, equation (4-6),
which requires a recursive solution:
(4-6)
Note that equation (4-5) for the group velocity is often simplified by a deep water
approximation when the depth is greater than half the wavelength (kh greater than ),
however, at 50 m depth this approximation is only valid for wave periods less than 8
seconds and was not used for this analysis.
The average response of the WET-NZ to the energy flux spectra, estimated using
equation (4-3), is shown in Figure 4-8. The vertical axis scale is not included to protect
WET-NZ proprietary data. 1675, twenty minute data samples were used in the
calculation; data with all values of Rdc were included. To improve the fit to the data, the
solution was held constant within frequency intervals corresponding to integral wave
periods. As expected, the response of the WET-NZ was negligible for frequencies less
than 0.11 Hz (9 second period). The response was greatest for frequencies between 0.17
Hz and 0.2 Hz (5 second to 6 second periods). The results for frequencies higher than
about 0.2 Hz are less accurate because the spectral energy was usually low above that
frequency. The average response was used to calculate the expected output power of the
WET-NZ based on the measured wave spectra, per equation (4.7):
(4.7)
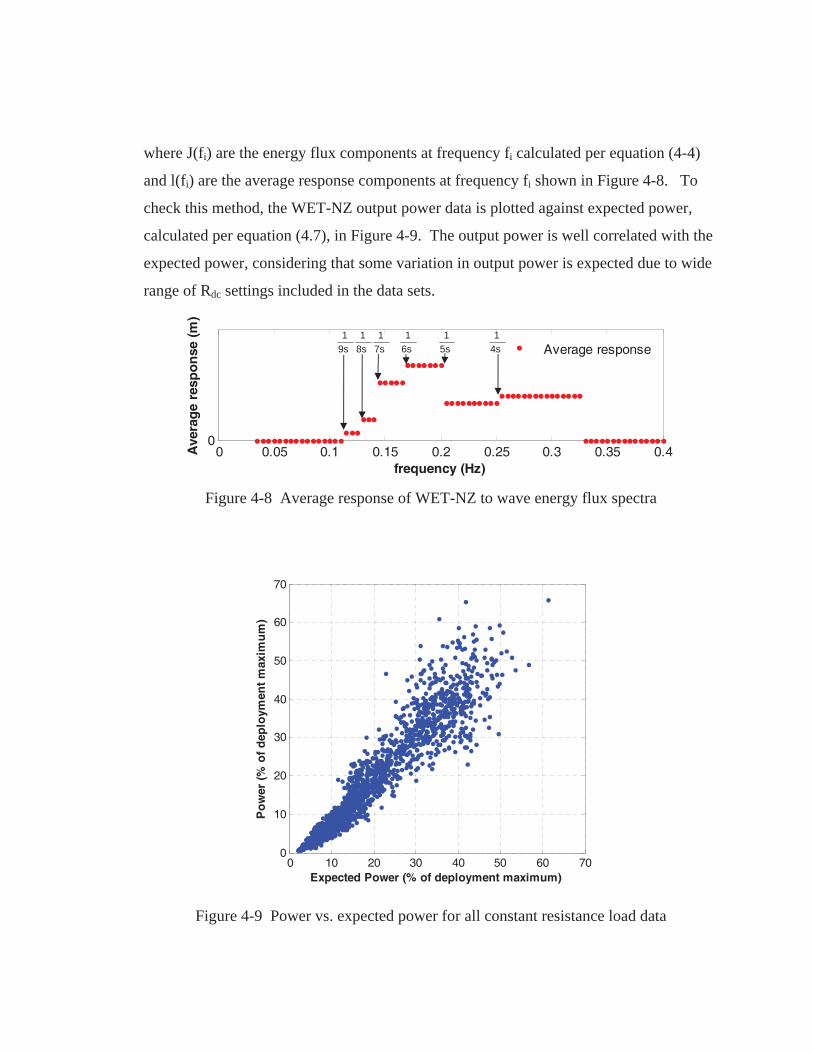
76
where J(fi) are the energy flux components at frequency fi calculated per equation (4-4)
and l(fi) are the average response components at frequency fi shown in Figure 4-8. To
check this method, the WET-NZ output power data is plotted against expected power,
calculated per equation (4.7), in Figure 4-9. The output power is well correlated with the
expected power, considering that some variation in output power is expected due to wide
range of Rdc settings included in the data sets.
Figure 4-8 Average response of WET-NZ to wave energy flux spectra
Figure 4-9 Power vs. expected power for all constant resistance load data
0 0.05 0.1 0.15 0.2 0.25 0.3 0.35 0.40
frequency (Hz)
Ave
rag
e re
spo
nse
(m
)
Average response4s1
5s1
6s1
7s1
8s1
9s1
0 10 20 30 40 50 60 700
10
20
30
40
50
60
70
Expected Power (% of deployment maximum)
Po
wer
(%
of
dep
loym
ent
max
imu
m)

77
To best present the power versus Rdc characterization data, it was desirable to bin
the data using a method that better segregates it per the expected response of the WET-
NZ than simply binning per Te and Hm0 as done in Figure 4-6. This was done by
calculating modified versions of Hm0 and Te that take into account the response of the
WET-NZ. This method is shown by example in Figure 4-10. In the top plot of Figure
4-10, the average response of the WET-NZ is plotted along with a normalized version of
this response that has a maximum of one. A sample wave spectrum is shown in the
center plot. A modified version of this spectrum is shown at the bottom of Figure 4-10
that takes the response of the WET-NZ into account. The modified spectrum is the
product of the normalized response in the top plot and the spectrum in the center plot and
is the portion of spectrum that the WET-NZ responded to. The modified significant wave
height Hm0 mod and modified energy period Te mod were calculated from moments of the
modified spectrum using equations (4-1) and (4-2), and were used for data binning.
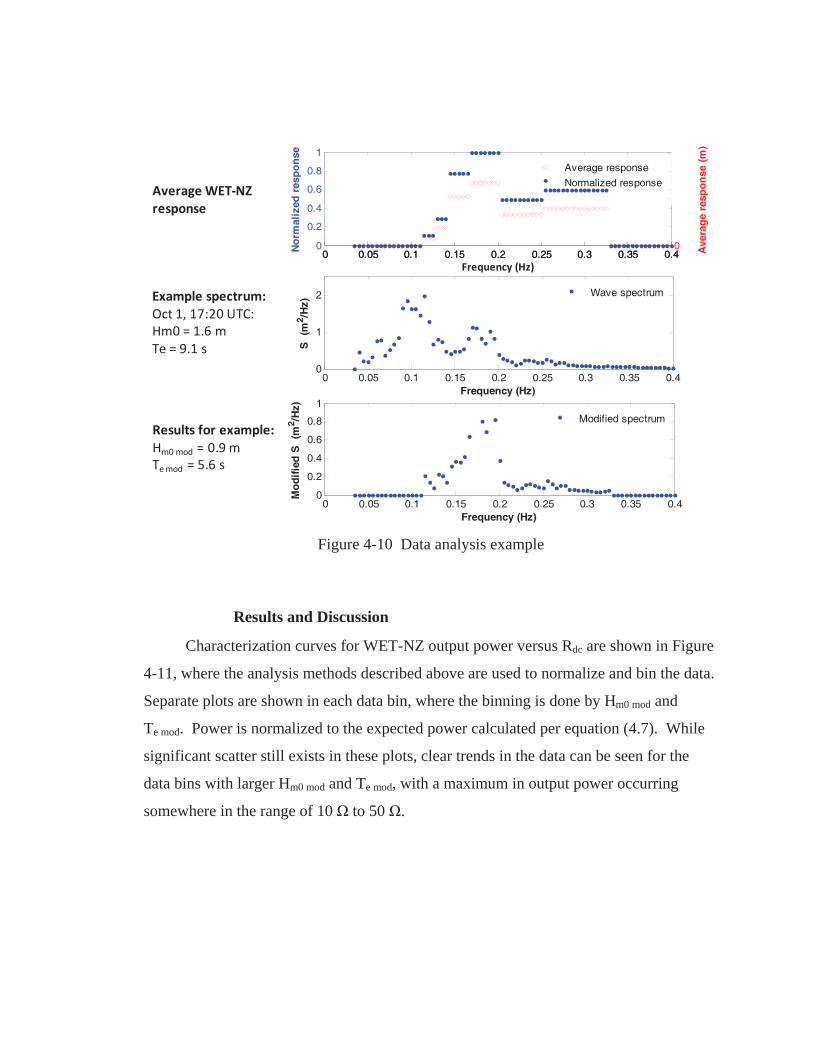
78
Figure 4-10 Data analysis example
4.5.4 Results and Discussion
Characterization curves for WET-NZ output power versus Rdc are shown in Figure
4-11, where the analysis methods described above are used to normalize and bin the data.
Separate plots are shown in each data bin, where the binning is done by Hm0 mod and
Te mod. Power is normalized to the expected power calculated per equation (4.7). While
significant scatter still exists in these plots, clear trends in the data can be seen for the
data bins with larger Hm0 mod and Te mod, with a maximum in output power occurring
somewhere in the range of 10 to 50 .
0 0.05 0.1 0.15 0.2 0.25 0.3 0.35 0.40
0.2
0.4
0.6
0.8
1
No
rmal
ized
res
po
nse
0 0.05 0.1 0.15 0.2 0.25 0.3 0.35 0.40
0.05
0.1
Ave
rag
e re
spo
nse
(m
)
Average response
Normalized response
Frequency (Hz)
Results for example:Hm0mod = 0.9 mTemod = 5.6 s
Average WET NZresponse
Example spectrum:Oct 1, 17:20 UTC:Hm0 = 1.6 mTe = 9.1 s
0 0.05 0.1 0.15 0.2 0.25 0.3 0.35 0.40
1
2
Frequency (Hz)
S
(m2 /H
z)
Wave spectrum
0 0.05 0.1 0.15 0.2 0.25 0.3 0.35 0.40
0.2
0.4
0.6
0.8
1
Frequency (Hz)
Mo
dif
ied
S
(m2 /H
z)
Modified spectrum
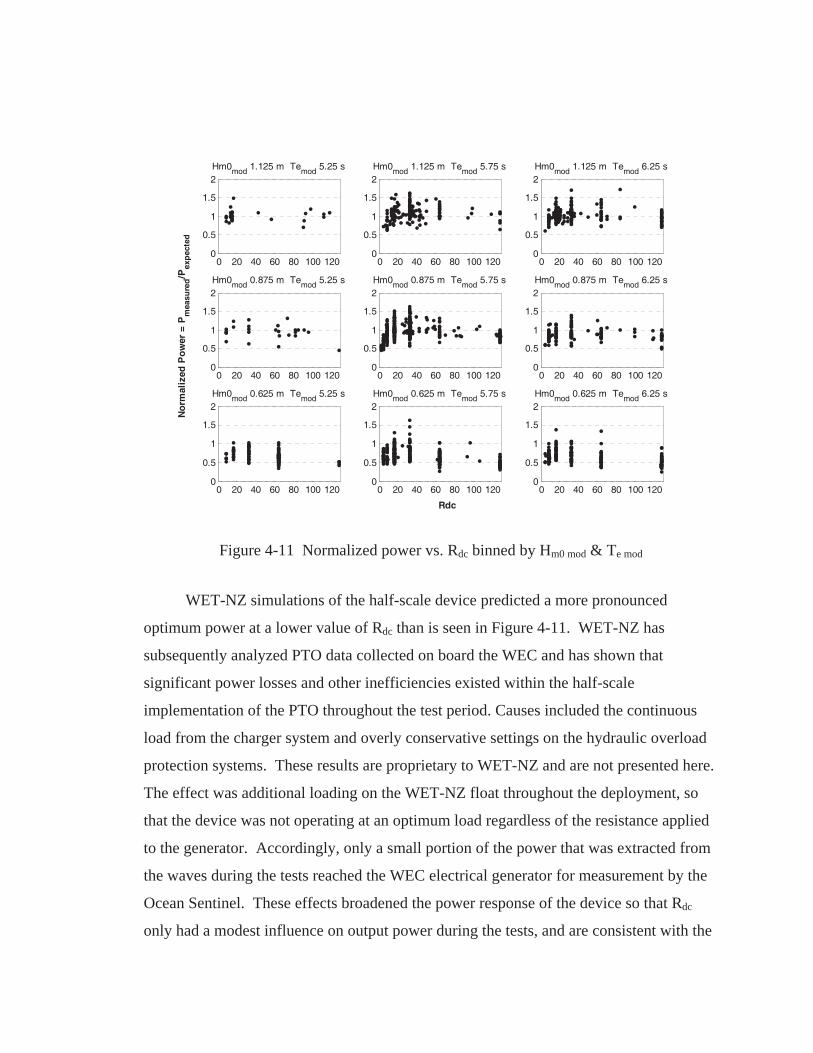
79
Figure 4-11 Normalized power vs. Rdc binned by Hm0 mod & Te mod
WET-NZ simulations of the half-scale device predicted a more pronounced
optimum power at a lower value of Rdc than is seen in Figure 4-11. WET-NZ has
subsequently analyzed PTO data collected on board the WEC and has shown that
significant power losses and other inefficiencies existed within the half-scale
implementation of the PTO throughout the test period. Causes included the continuous
load from the charger system and overly conservative settings on the hydraulic overload
protection systems. These results are proprietary to WET-NZ and are not presented here.
The effect was additional loading on the WET-NZ float throughout the deployment, so
that the device was not operating at an optimum load regardless of the resistance applied
to the generator. Accordingly, only a small portion of the power that was extracted from
the waves during the tests reached the WEC electrical generator for measurement by the
Ocean Sentinel. These effects broadened the power response of the device so that Rdc
only had a modest influence on output power during the tests, and are consistent with the
Rdc
No
rmal
ized
Po
wer
= P
mea
sure
d/P
exp
ecte
d
0 20 40 60 80 100 1200
0.5
1
1.5
2Hm0mod 0.625 m Temod 5.25 s
0 20 40 60 80 100 1200
0.5
1
1.5
2Hm0mod 0.625 m Temod 5.75 s
0 20 40 60 80 100 1200
0.5
1
1.5
2Hm0mod 0.625 m Temod 6.25 s
0 20 40 60 80 100 1200
0.5
1
1.5
2Hm0mod 0.875 m Temod 5.25 s
0 20 40 60 80 100 1200
0.5
1
1.5
2Hm0mod 0.875 m Temod 5.75 s
0 20 40 60 80 100 1200
0.5
1
1.5
2Hm0mod 0.875 m Temod 6.25 s
0 20 40 60 80 100 1200
0.5
1
1.5
2Hm0mod 1.125 m Temod 5.25 s
0 20 40 60 80 100 1200
0.5
1
1.5
2Hm0mod 1.125 m Temod 5.75 s
0 20 40 60 80 100 1200
0.5
1
1.5
2Hm0mod 1.125 m Temod 6.25 s
80
results shown in Figure 4-11. WET-NZ has been able to identify and quantify the
different PTO loss paths, further analyze device operation during the test, and determine
improvements to the scaled PTO design that will correct these problems for future
deployments.
4.6 Voltage Threshold Switching Tests
During these tests, the WET-NZ generator was controlled by the Ocean Sentinel
power converter so that two different values of Rdc were applied, the first below and the
second above a generator output voltage threshold Vthresh. Assuming that generator
voltage is proportional to float speed and generator current is proportional to float force,
this is a simple method of applying different values of damping to the float above and
below a speed threshold, in order to implement what is often referred to as either latching
or declutching control in the literature [13]:
1. Under latching control, the float is locked into position twice per wave cycle at
the moments when float velocity decreases to zero, then released after a set time
delay and operated with constant damping until the velocity decreases to zero
again;
2. Under declutching control, the float is released to move without resistance twice
per wave cycle at the moments when float velocity decreases to zero; after a set
time delay a constant damping is applied to the float. Ideally that level of
damping is applied until the float velocity decreases to zero again.
Latching control was implemented by setting Rdc to a low value below Vthresh and
to a higher value above Vthresh; the opposite was used for declutching control. Both
latching and declutching are reactive methods of control that attempt to introduce a phase
shift between the force applied to the float and the velocity of the float; latching causes
the velocity to lag the force and declutching causes the velocity to lead the force. The
control provided by the implementations of these methods used for the WET-NZ tests
differed somewhat from that described in the literature, due to the non-linear relationship
between float speed and generator speed caused by the hydraulic accumulator in the
81
WET-NZ PTO. Due to the PTO accumulator, the WET-NZ generator speed does not
necessarily decrease to zero when the float speed goes to zero each wave cycle. As a
result, when Rdc was switched at Vthresh, the change in loading did not necessarily occur
every wave cycle for low Vthresh settings, also, variations in the phase shift probably
existed from one wave cycle to the next when the load switching did occur. Although not
ideal, the voltage switching method was relatively simple to implement in the Ocean
Sentinel power converter control and allowed the latching and declutching tests to be
performed without implementing more sophisticated hydraulic control in the WET-NZ
PTO.
The voltage threshold control of the Ocean Sentinel power converter was
implemented in the CompactRIO, as described in Section 3.5.8 and shown in Figure
3-16. The voltage of the dc bus is compared to Vthresh to determine whether to apply a
high or low voltage resistance setting. A hysteresis of 10 volts, not adjustable during
testing, is included in the voltage comparison to eliminate jitter. The Vthresh, high voltage
Rdc setting, and low voltage Rdc setting are inputs from the CompactRIO host interface.
When operating at either the high or low Rdc setting, the control regulates the dc bus
current in the converter so that it is proportional to the dc bus voltage using the same
method used for constant Rdc control.
4.6.1 Test Method
A similar 20 minute cycling method was used during the voltage threshold
switching tests as was used for the constant resistance tests (see Section 4.5), except for
during these tests Vthresh as well as the high voltage Rdc setting could be cycled to
different values for each 20 minute load step. The most common settings used during the
voltage threshold tests are listed in Table 4-3 for both the latching and declutching cases.
In the case of latching control, the low voltage Rdc was always set as low as possible, to
4.2 , which is the resistance of the Ocean Sentinel load bank as configured for the
WET-NZ tests. High Rdc settings of either 32 or 64 were used, which were intended
to be in the optimum range for constant resistance loading. Voltage thresholds in the
82
range of 0V to 60V were used for the latching tests; Vthresh of 0V gives a constant Rdc
load equal to the high voltage Rdc setting and was included as a baseline for comparison.
These thresholds were very small relative to the peak no-load voltages observed during
the tests. In the case of the declutching tests, a low voltage Rdc setting of 128 was used
together with either 32 or 64 above Vthresh; voltage thresholds were between 0V and
200V. A larger voltage switching hysteresis than 10 volts would have been better for the
declutching tests to delay switching back to high Rdc until later in the wave cycle,
however, a 10 volt hysteresis was fixed in the control and could not be adjusted during
the test. More data was collected for both the latching and declutching tests with the high
voltage Rdc set to 32 than 64 . Experimentation was also done with various other
voltage threshold and resistance settings for short periods during the deployment.
Table 4-3 Settings typically used during voltage threshold load cycling sequences
Low Voltage Rdc High Voltage Rdc Vthresh Sequence Latching control
4 32 0V - 10V - 20V - 40V – 60V or 0V - 20V – 40V – 60V 4 64
Declutching control 128 32 0V - 50V – 100V 128 64 0V - 100V – 200V
Time series plots of data recorded during a short segment of the test are shown in
Figure 4-12 to illustrate the load cycling method used. In this example, where the
latching control is being tested, a Vthresh cycling sequence of 0-20-40-60 volts was used,
while Rdc was switched between 4 below Vthresh and either 32 or 64 above Vthresh.
The load settings were changed every 20 minutes, with the 20 minute load step intervals
synchronized with the TRIAXYS wave buoy measurement periods. Load sequences used
during other test intervals often only included the 32 high voltage Rdc setting.
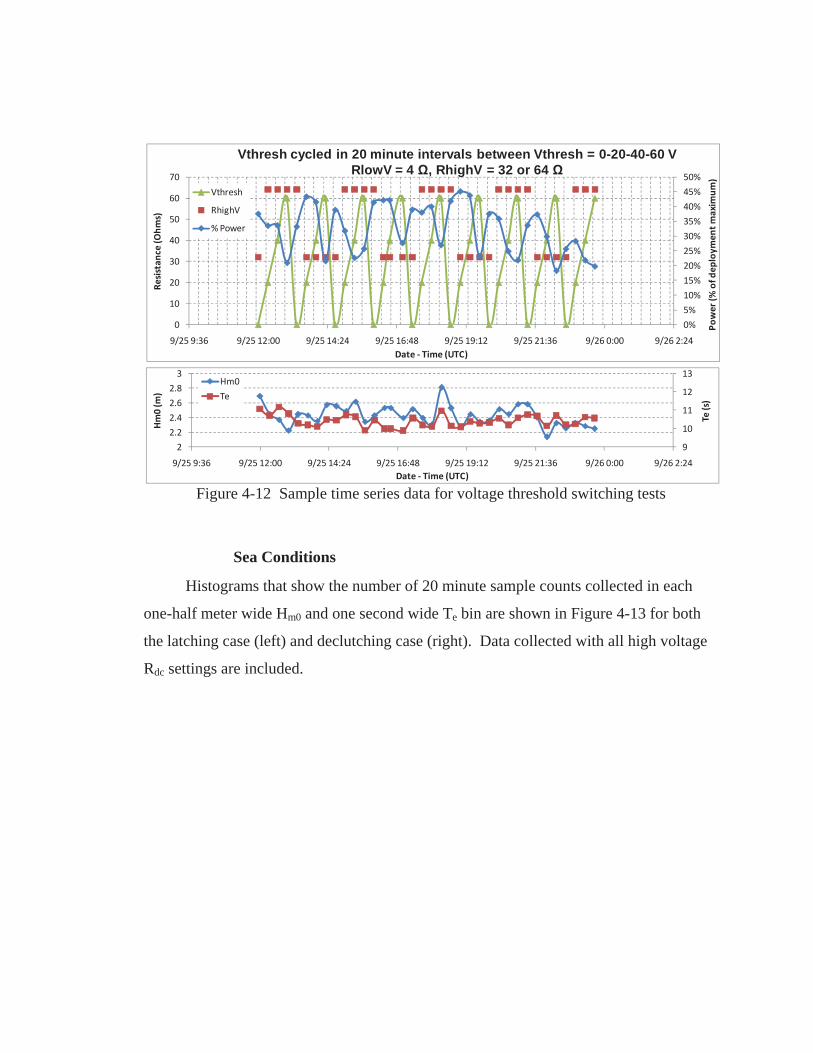
83
Figure 4-12 Sample time series data for voltage threshold switching tests
4.6.2 Sea Conditions
Histograms that show the number of 20 minute sample counts collected in each
one-half meter wide Hm0 and one second wide Te bin are shown in Figure 4-13 for both
the latching case (left) and declutching case (right). Data collected with all high voltage
Rdc settings are included.
0%
5%
10%
15%
20%
25%
30%
35%
40%
45%
50%
0
10
20
30
40
50
60
70
9/25 9:36 9/25 12:00 9/25 14:24 9/25 16:48 9/25 19:12 9/25 21:36 9/26 0:00 9/26 2:24
Power
(%of
deploy
men
tmaxim
um)
Resistan
ce(Ohm
s)
Date Time (UTC)
Vthresh cycled in 20 minute intervals between Vthresh = 0-20-40-60 VRlowV = 4 , RhighV = 32 or 64
Vthresh
RhighV
%Power
9
10
11
12
13
2
2.2
2.4
2.6
2.8
3
9/25 9:36 9/25 12:00 9/25 14:24 9/25 16:48 9/25 19:12 9/25 21:36 9/26 0:00 9/26 2:24
Te(s)
Hm0(m
)
Date Time (UTC)
Hm0
Te
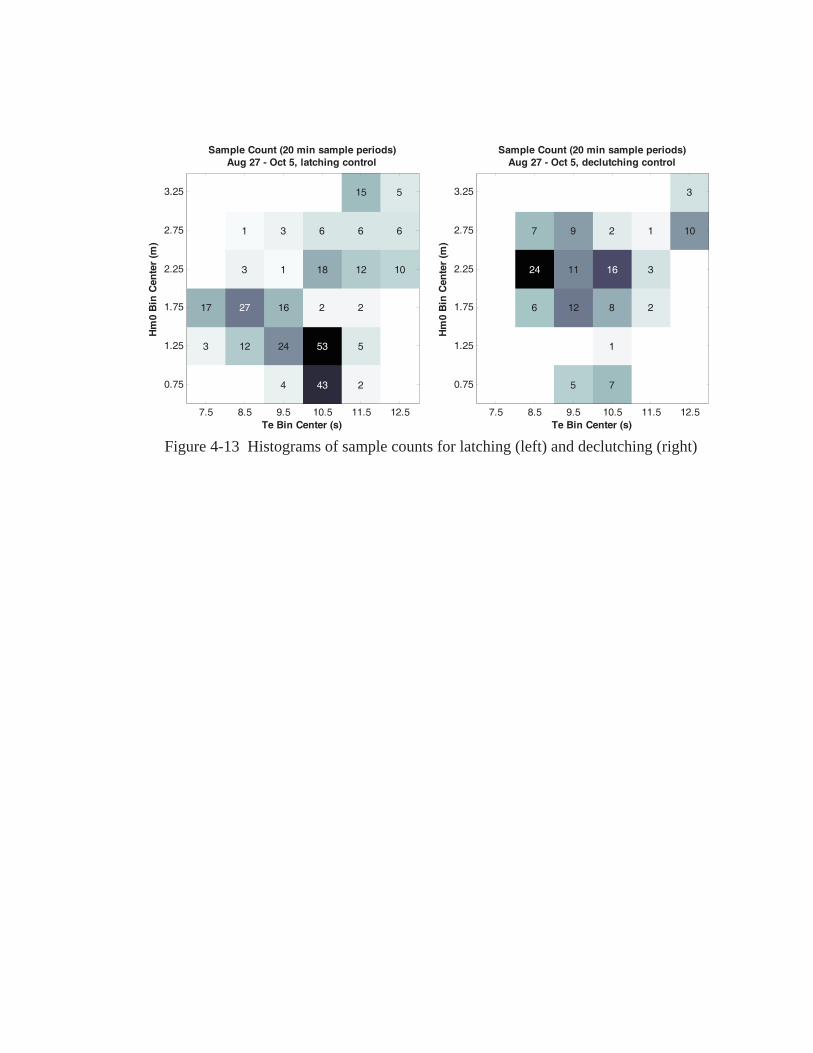
84
Figure 4-13 Histograms of sample counts for latching (left) and declutching (right)
6
24
7
5
12
11
9
7
1
8
16
2
2
3
1 10
3
Te Bin Center (s)
Hm
0 B
in C
ente
r (m
)
Sample Count (20 min sample periods)Aug 27 - Oct 5, declutching control
7.5 8.5 9.5 10.5 11.5 12.5
0.75
1.25
1.75
2.25
2.75
3.25
3
17
12
27
3
1
4
24
16
1
3
43
53
2
18
6
2
5
2
12
6
15
10
6
5
Te Bin Center (s)
Hm
0 B
in C
ente
r (m
)Sample Count (20 min sample periods)
Aug 27 - Oct 5, latching control
7.5 8.5 9.5 10.5 11.5 12.5
0.75
1.25
1.75
2.25
2.75
3.25

85
4.6.3 Results for Latching Control
Data collected while the WET-NZ was under latching control with Rdc at 32
above Vthresh and 4 below Vthresh are shown in Figure 4-14. These were the most
common Rdc settings used. Plots of normalized power versus Vthresh are shown binned by
Hm0 and Te; power is normalized to expected power calculated from the measured wave
spectra per equation (4.7). Data with Vthresh at zero indicates a constant Rdc load and is
the baseline case for comparison. In the 2.25 meter Hm0 and 10.5 second Te bin, the
WET-NZ output power clearly increased under the voltage threshold control relative to
constant resistance control; it appears that the optimum Vthresh is near 20 V. Trends are
less clear in other data bins due to scatter in the data and the limited amount of data
available, however, it appears that the voltage threshold control was generally more
effective at higher Te that are beyond the normal response range of the half-scale WET-
NZ, shown in Figure 4-8, which cuts off above a period of about 9 seconds.
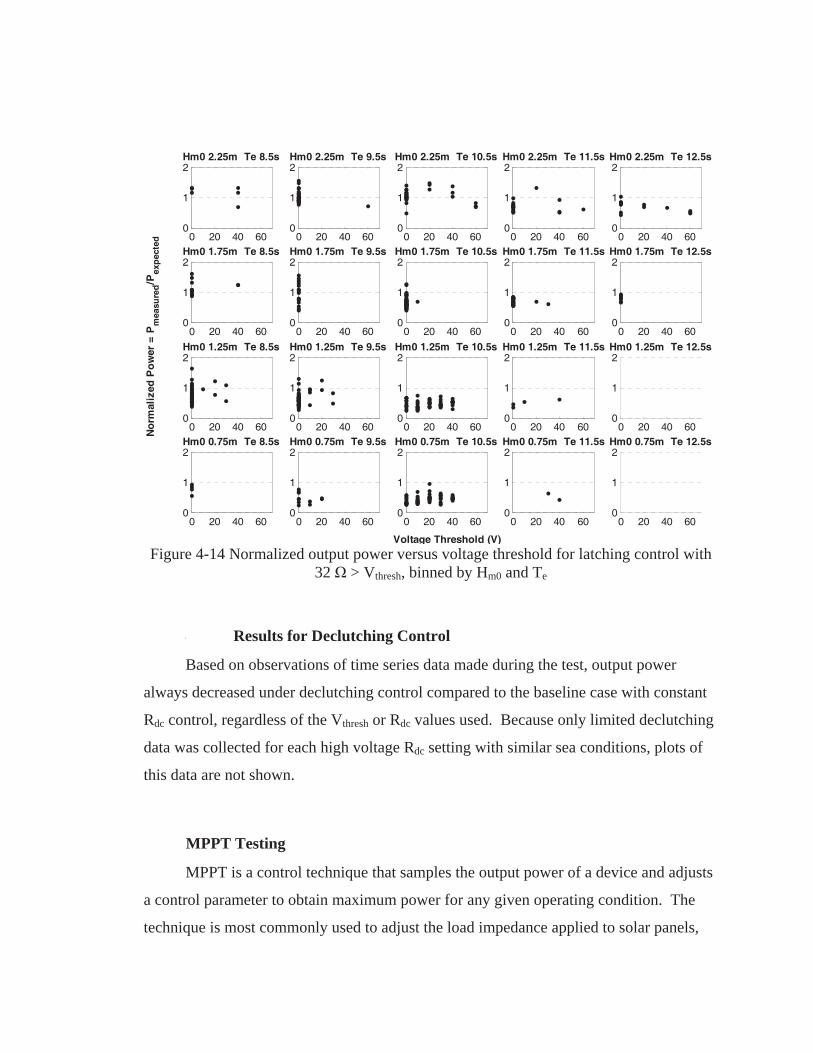
86
Figure 4-14 Normalized output power versus voltage threshold for latching control with
32 > Vthresh, binned by Hm0 and Te
4.6.4 Results for Declutching Control
Based on observations of time series data made during the test, output power
always decreased under declutching control compared to the baseline case with constant
Rdc control, regardless of the Vthresh or Rdc values used. Because only limited declutching
data was collected for each high voltage Rdc setting with similar sea conditions, plots of
this data are not shown.
4.7 MPPT Testing
MPPT is a control technique that samples the output power of a device and adjusts
a control parameter to obtain maximum power for any given operating condition. The
technique is most commonly used to adjust the load impedance applied to solar panels,
Voltage Threshold (V)
No
rmal
ized
Po
wer
= P
mea
sure
d/P
exp
ecte
d
0 20 40 600
1
2Hm0 0.75m Te 8.5s
0 20 40 600
1
2Hm0 0.75m Te 9.5s
0 20 40 600
1
2Hm0 0.75m Te 10.5s
0 20 40 600
1
2Hm0 0.75m Te 11.5s
0 20 40 600
1
2Hm0 0.75m Te 12.5s
0 20 40 600
1
2Hm0 1.25m Te 8.5s
0 20 40 600
1
2Hm0 1.25m Te 9.5s
0 20 40 600
1
2Hm0 1.25m Te 10.5s
0 20 40 600
1
2Hm0 1.25m Te 11.5s
0 20 40 600
1
2Hm0 1.25m Te 12.5s
0 20 40 600
1
2Hm0 1.75m Te 8.5s
0 20 40 600
1
2Hm0 1.75m Te 9.5s
0 20 40 600
1
2Hm0 1.75m Te 10.5s
0 20 40 600
1
2Hm0 1.75m Te 11.5s
0 20 40 600
1
2Hm0 1.75m Te 12.5s
0 20 40 600
1
2Hm0 2.25m Te 8.5s
0 20 40 600
1
2Hm0 2.25m Te 9.5s
0 20 40 600
1
2Hm0 2.25m Te 10.5s
0 20 40 600
1
2Hm0 2.25m Te 11.5s
0 20 40 600
1
2Hm0 2.25m Te 12.5s

87
however, previous work at OSU [8],[9] has shown that this technique can also be used for
WEC control. During the course of the WET-NZ deployment, NNMREC experimented
with MPPT control of the WET-NZ using two different MPPT algorithms that were
implemented in the CompactRIO host during the course of the deployment: 1) a perturb
and observe algorithm, and 2) a cycling algorithm. The MPPT algorithms were used to
control either Rdc while operating under constant resistance loading or Vthresh while
operating under latching voltage threshold control. Optimum control of Vthresh was not
successful using either algorithm because, as can be seen in the Figure 4-14 plots, voltage
threshold control of the WET-NZ was only effective in a limited range of sea conditions.
Optimum control of Rdc was not achieved with the perturb and observe algorithm, but
optimum control of Rdc was achieved using the cycling algorithm even though, as shown
in Figure 4-11, the optimum Rdc was not well pronounced in the case of the half-scale
WET-NZ due to high PTO losses.
4.7.1 Perturb and Observe Algorithm
A block diagram of the perturb and observe MPPT algorithm that was
implemented in the CompactRIO host is shown in Figure 4-15. This is the same
algorithm described in [8] for controlling the load applied to a WEC, and is commonly
used to control solar panels [6]. Regulation of Rdc is illustrated in Figure 4-15; the
algorithm can also be used to regulate Vthresh. Starting with some load resistance setting
Rdc k-1 for the k-1 interval, the WEC is controlled with this resistance value for a fixed
MPPT time period TMPPT, and at the end of the interval the average power Pavg k-1is
calculated. Assume that Rdc is then increased by a fixed control step Cstep to give the
resistance Rdc k used for the kth interval. At the end of the kth interval, if the average
power Pavg k is greater than Pavg k-1, Rdc is again changed in the same direction by Cstep and
Rdc k+1 is higher than Rdc k, but if power decreases Rdc is changed in the opposite direction.
The algorithm continues to search for an optimum Rdc setting in this manner,
incrementing or decrementing Rdc by Cstep indefinitely depending on whether power
increases or decreases from one interval to the next. Rdc is never increased beyond a
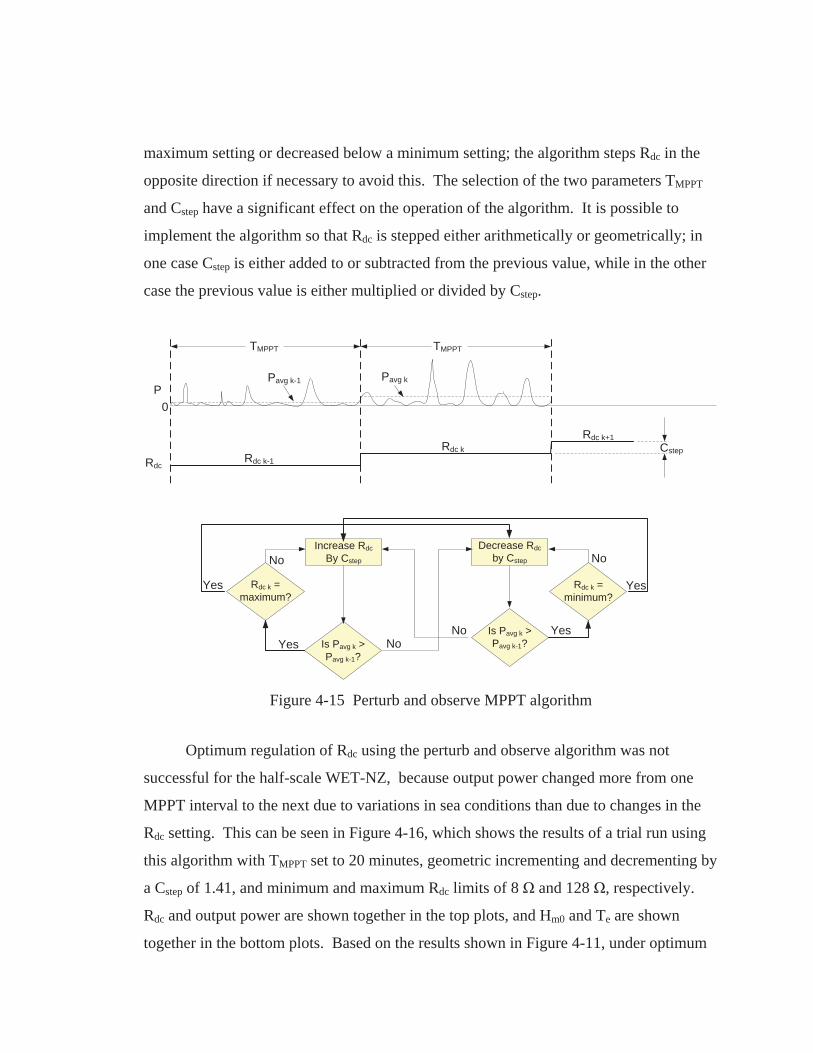
88
maximum setting or decreased below a minimum setting; the algorithm steps Rdc in the
opposite direction if necessary to avoid this. The selection of the two parameters TMPPT
and Cstep have a significant effect on the operation of the algorithm. It is possible to
implement the algorithm so that Rdc is stepped either arithmetically or geometrically; in
one case Cstep is either added to or subtracted from the previous value, while in the other
case the previous value is either multiplied or divided by Cstep.
Figure 4-15 Perturb and observe MPPT algorithm
Optimum regulation of Rdc using the perturb and observe algorithm was not
successful for the half-scale WET-NZ, because output power changed more from one
MPPT interval to the next due to variations in sea conditions than due to changes in the
Rdc setting. This can be seen in Figure 4-16, which shows the results of a trial run using
this algorithm with TMPPT set to 20 minutes, geometric incrementing and decrementing by
a Cstep of 1.41, and minimum and maximum Rdc limits of 8 and 128 , respectively.
Rdc and output power are shown together in the top plots, and Hm0 and Te are shown
together in the bottom plots. Based on the results shown in Figure 4-11, under optimum
Cstep
0
Pavg k-1P
Rdc
TMPPT
Pavg k
Rdc k-1
Rdc k
Rdc k+1
TMPPT
Is Pavg k >Pavg k-1?
Increase RdcBy Cstep
Decrease Rdcby Cstep
Yes NoNo YesIs Pavg k >
Pavg k-1?
Rdc k =minimum?
Rdc k =maximum?
Yes Yes
NoNo
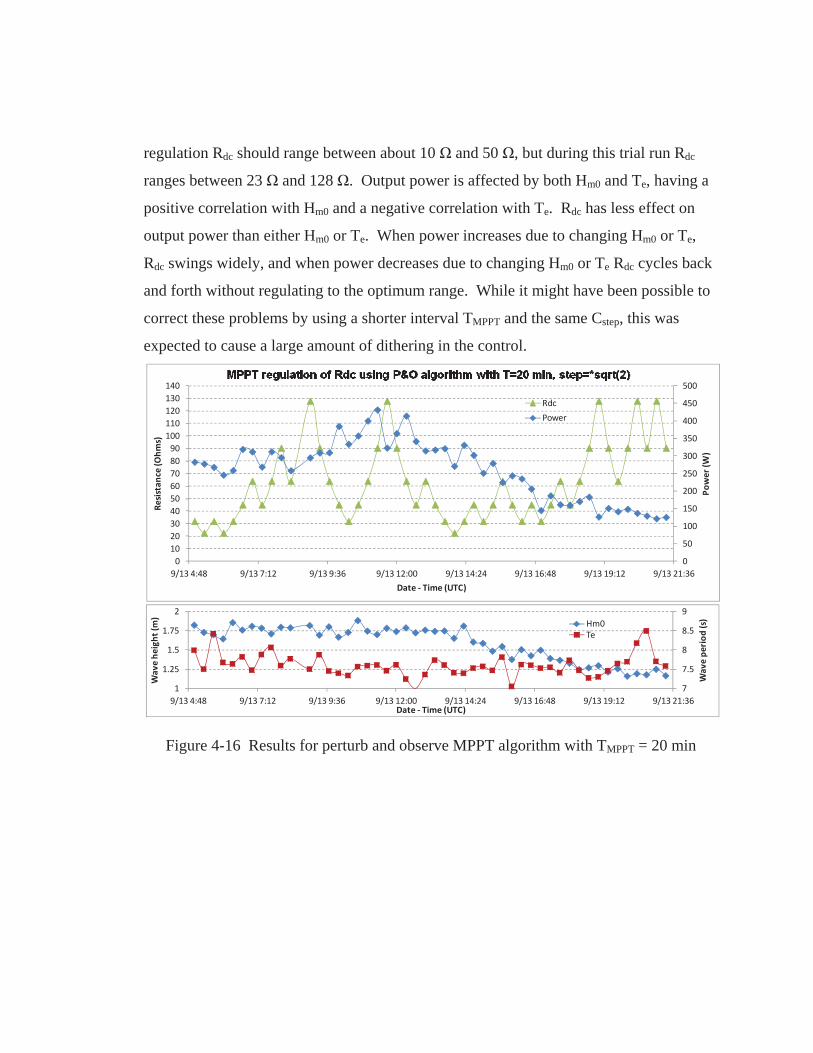
89
regulation Rdc should range between about 10 and 50 , but during this trial run Rdc
ranges between 23 and 128 . Output power is affected by both Hm0 and Te, having a
positive correlation with Hm0 and a negative correlation with Te. Rdc has less effect on
output power than either Hm0 or Te. When power increases due to changing Hm0 or Te,
Rdc swings widely, and when power decreases due to changing Hm0 or Te Rdc cycles back
and forth without regulating to the optimum range. While it might have been possible to
correct these problems by using a shorter interval TMPPT and the same Cstep, this was
expected to cause a large amount of dithering in the control.
Figure 4-16 Results for perturb and observe MPPT algorithm with TMPPT = 20 min
0
50
100
150
200
250
300
350
400
450
500
0102030405060708090100110120130140
9/13 4:48 9/13 7:12 9/13 9:36 9/13 12:00 9/13 14:24 9/13 16:48 9/13 19:12 9/13 21:36
Power
(W)
Resistan
ce(Ohm
s)
Date Time (UTC)
Rdc
Power
7
7.5
8
8.5
9
1
1.25
1.5
1.75
2
9/13 4:48 9/13 7:12 9/13 9:36 9/13 12:00 9/13 14:24 9/13 16:48 9/13 19:12 9/13 21:36Wavepe
riod
(s)
Wavehe
ight
(m)
Date Time (UTC)
Hm0Te

90
4.7.2 Cycling Algorithm
A block diagram of the cycling MPPT algorithm that was implemented in the
CompactRIO host is shown in Figure 4-17. This algorithm was developed during the
course of the WET-NZ tests to overcome the difficulties encountered with the perturb
and observe algorithm. When using this algorithm to regulate Rdc, it is cycled alternately
between a nominal value Rdc nom plus and minus a deviation Rdc dev throughout each
MPPT period TMPPT. At the end of each period the difference between the average power
calculated for the portions of time that the WEC was operating at the high and low Rdc
settings, P0 and P1 respectively, is used to calculate Rdc nom for the next MPPT period.
The Rdc cycling time Tinterval was typically set to 1 minute during the WET-NZ tests and
the time period TMPPT was typically set to 20 or 60 minutes. Rdc dev is always a fixed
percentage of Rdc nom, and Rdc nom is changed in proportion to the difference P0-P1 each
period based on a gain parameter. By cycling repeatedly between alternate Rdc settings
each MPPT interval, the effect that Rdc has on WEC output power can be measured even
if output power changes substantially over the MPPT period due to changes in sea state.
The selection of Tinterval, TMPPT, the percent deviation, and the gain have a significant
effect on the operation of the algorithm.
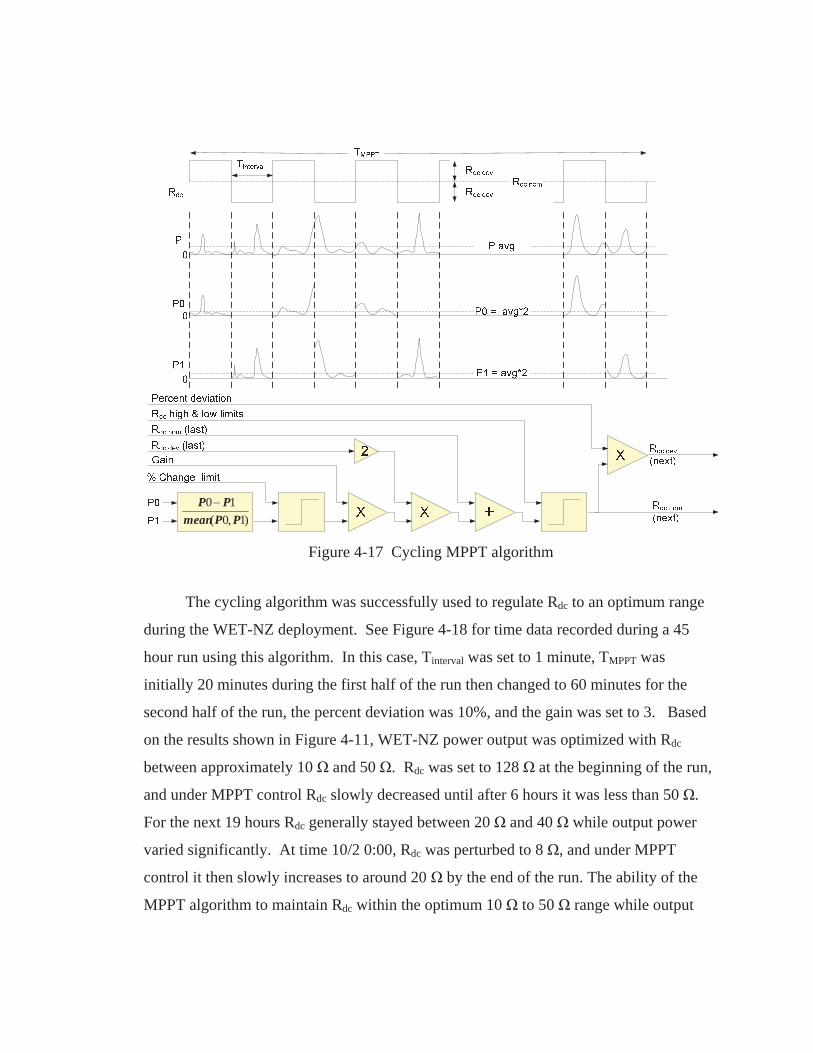
91
Figure 4-17 Cycling MPPT algorithm
The cycling algorithm was successfully used to regulate Rdc to an optimum range
during the WET-NZ deployment. See Figure 4-18 for time data recorded during a 45
hour run using this algorithm. In this case, Tinterval was set to 1 minute, TMPPT was
initially 20 minutes during the first half of the run then changed to 60 minutes for the
second half of the run, the percent deviation was 10%, and the gain was set to 3. Based
on the results shown in Figure 4-11, WET-NZ power output was optimized with Rdc
between approximately 10 and 50 . Rdc was set to 128 at the beginning of the run,
and under MPPT control Rdc slowly decreased until after 6 hours it was less than 50 .
For the next 19 hours Rdc generally stayed between 20 and 40 while output power
varied significantly. At time 10/2 0:00, Rdc was perturbed to 8 , and under MPPT
control it then slowly increases to around 20 by the end of the run. The ability of the
MPPT algorithm to maintain Rdc within the optimum 10 to 50 range while output
)1,0(10PPmean
PP
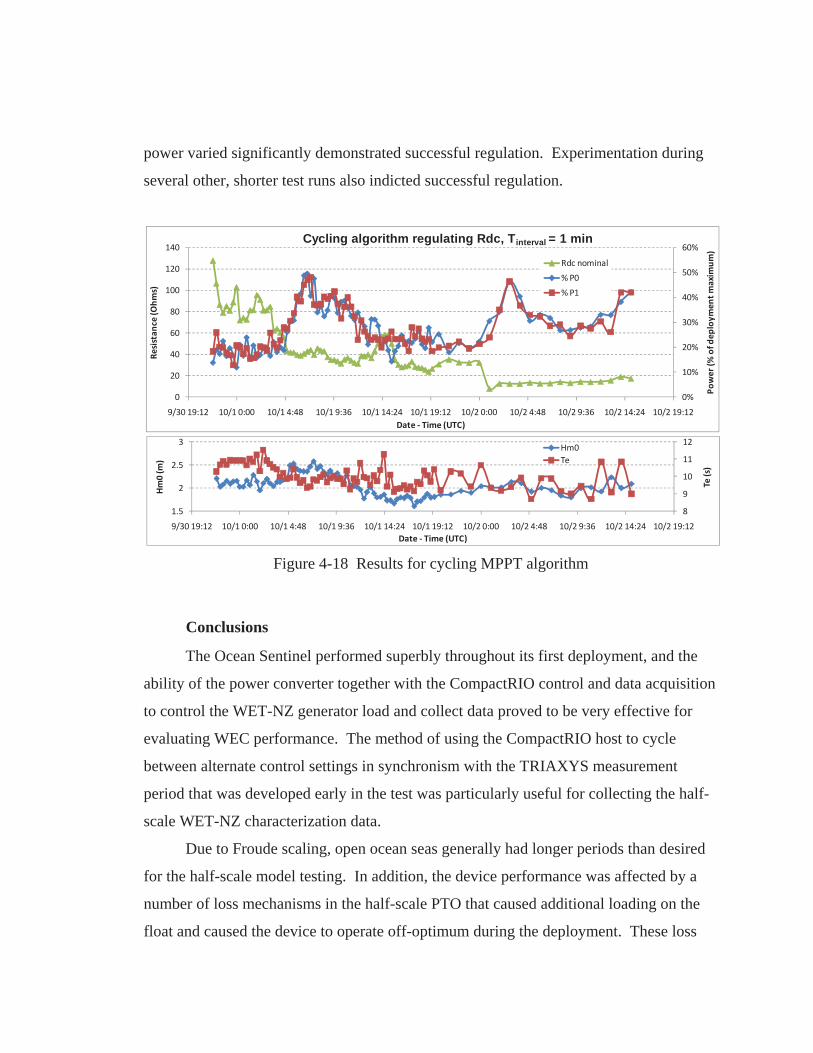
92
power varied significantly demonstrated successful regulation. Experimentation during
several other, shorter test runs also indicted successful regulation.
Figure 4-18 Results for cycling MPPT algorithm
4.8 Conclusions
The Ocean Sentinel performed superbly throughout its first deployment, and the
ability of the power converter together with the CompactRIO control and data acquisition
to control the WET-NZ generator load and collect data proved to be very effective for
evaluating WEC performance. The method of using the CompactRIO host to cycle
between alternate control settings in synchronism with the TRIAXYS measurement
period that was developed early in the test was particularly useful for collecting the half-
scale WET-NZ characterization data.
Due to Froude scaling, open ocean seas generally had longer periods than desired
for the half-scale model testing. In addition, the device performance was affected by a
number of loss mechanisms in the half-scale PTO that caused additional loading on the
float and caused the device to operate off-optimum during the deployment. These loss
0%
10%
20%
30%
40%
50%
60%
0
20
40
60
80
100
120
140
9/30 19:12 10/1 0:00 10/1 4:48 10/1 9:36 10/1 14:24 10/1 19:12 10/2 0:00 10/2 4:48 10/2 9:36 10/2 14:24 10/2 19:12
Power
(%of
deploy
men
tmaxim
um)
Resistan
ce(Ohm
s)
Date Time (UTC)
Cycling algorithm regulating Rdc, Tinterval = 1 min
Rdc nominal
% P0
%P1
8
9
10
11
12
1.5
2
2.5
3
9/30 19:12 10/1 0:00 10/1 4:48 10/1 9:36 10/1 14:24 10/1 19:12 10/2 0:00 10/2 4:48 10/2 9:36 10/2 14:24 10/2 19:12
Te(s)
Hm0(m
)
Date Time (UTC)
Hm0Te
93
mechanisms have since been identified and quantified by WET-NZ. Although the non-
ideal sea conditions and high PTO losses made data difficult to interpret, several
conclusions were made concerning the half-scale WET-NZ:
Controlled external resistance loading via the Ocean Sentinel allowed
essential on-board data to be collected and the PTO operation characterized in
detail under a wide range of real sea conditions.
The low response of the WEC to wave periods greater than 9 seconds that was
predicted by Callaghan Innovation design analysis was verified.
An optimum in the device output with respect to the constant resistance load
applied to the generator was observed and characterized
An improvement in the response of the device was seen when latching control
was used in long period seas, while no improvement was seen with
declutching control. The latching control, which introduces a phase lag in the
velocity of the float with respect to the force on the float, apparently provided
better impedance matching under these conditions.
While not reported here, internal PTO characteristics that prevented optimum
resistive loading conditions to be achieved during this deployment have been
identified and addressed.
A perturb and observe MPPT algorithm was not able to regulate generator load
resistance Rdc while output power fluctuated due to changing sea conditions. A new
cycling MPPT algorithm that was developed during the deployment did successfully
regulate Rdc under similar conditions..

Final Scientific Technical Report DE-EE0003642
34 | P a g e
APPENDIX F – WAVE TANK TEST REPORT
Report: PPLUSDOE001 1 February 2012
WET-NZ 1:30-scale Model Tank Testing
Oregon October 2011

Power Projects Limited Equinox House
111 The Terrace Wellington 6011
Telephone: +64 (0) 4 499 0060
Fax: +64(0) 4 499 0059
© Power Projects Limited February 2012
CONTENTS GLOSSARY OF TERMS .............................................................................................................................. 6
EXECUTIVE SUMMARY .............................................................................................................................. 7
1 INTRODUCTION ......................................................................................................................... 8 1.1 Purpose ..................................................................................................................................................... 8 1.2 Author ....................................................................................................................................................... 8
2 FACILITIES & SET UP ............................................................................................................... 9 2.1 Tank Details .............................................................................................................................................. 9 2.2 Instrumentation Details ........................................................................................................................... 9 2.3 Mooring Details ........................................................................................................................................ 9
3 INITIALISATION TESTS ........................................................................................................... 10 3.1 Initialisation Test 1 ................................................................................................................................. 10 3.2 Initialisation Test 2 ................................................................................................................................. 10 3.3 Initialisation Test 3 ................................................................................................................................. 10 3.4 Initialisation Test 4 ................................................................................................................................. 11 3.5 Initialisation Tests - Conclusions & Summary .................................................................................... 11
4 VERIFICATION TESTS ............................................................................................................. 12 4.1 Schedule ................................................................................................................................................. 12
4.1.1 Objective .................................................................................................................................... 12 4.1.2 Wave Conditions ........................................................................................................................ 12 4.1.3 Duration ..................................................................................................................................... 12 4.1.4 Depth ......................................................................................................................................... 12 4.1.5 Damping ..................................................................................................................................... 12
4.2 Tests ........................................................................................................................................................ 13 4.2.1 Verification T1 ............................................................................................................................ 13 4.2.2 Verification T2 ............................................................................................................................ 13 4.2.3 Verification T3 ............................................................................................................................ 13 4.2.4 Verification T4 ............................................................................................................................ 13 4.2.5 Verification T5 ............................................................................................................................ 14 4.2.6 Verification T6 ............................................................................................................................ 14 4.2.7 Verification T6b .......................................................................................................................... 15 4.2.8 Verification T7 ............................................................................................................................ 15 4.2.9 Verification T8 ............................................................................................................................ 15 4.2.10 Verification T9 ............................................................................................................................ 16 4.2.11 Verification T10 .......................................................................................................................... 16 4.2.12 Verification T11 .......................................................................................................................... 16 4.2.13 Verification T12 .......................................................................................................................... 16 4.2.14 Verification T13 .......................................................................................................................... 17 4.2.15 Verification T14 .......................................................................................................................... 17 4.2.16 Verification T15 .......................................................................................................................... 17 4.2.17 Verification T16 .......................................................................................................................... 17 4.2.18 Verification T17 .......................................................................................................................... 18 4.2.19 Verification T18 .......................................................................................................................... 18 4.2.20 Verification T19 .......................................................................................................................... 18 4.2.21 Verification T20 .......................................................................................................................... 19
4.3 Verifications Tests - Conclusions & Summary.................................................................................... 19
5 PERFORMANCE SERIES 1 ..................................................................................................... 20 5.1 Schedule ................................................................................................................................................. 20
5.1.1 Objective .................................................................................................................................... 20 5.1.2 Wave Conditions ........................................................................................................................ 20 5.1.3 Duration ..................................................................................................................................... 20 5.1.4 Depth ......................................................................................................................................... 20
© Power Projects Limited February 2012
5.1.5 Damping ..................................................................................................................................... 20 5.2 Tests ........................................................................................................................................................ 21
5.2.1 Performance series 1: t1 ............................................................................................................ 21 5.2.2 Performance series 1: t2 ............................................................................................................ 21 5.2.3 Performance series 1: t3 ............................................................................................................ 21 5.2.4 Performance series 1: t4 ............................................................................................................ 21 5.2.5 Performance series 1: t5 ............................................................................................................ 22
5.3 Performance Series 1 - Conclusions & Summary ............................................................................... 22
6 PERFORMANCE SERIES 2 ..................................................................................................... 23 6.1 Schedule ................................................................................................................................................. 23
6.1.1 Objective .................................................................................................................................... 23 6.1.2 Wave Conditions ........................................................................................................................ 23 6.1.3 Duration ..................................................................................................................................... 23 6.1.4 Depth ......................................................................................................................................... 23 6.1.5 Damping ..................................................................................................................................... 23
6.2 Tests ........................................................................................................................................................ 24 6.2.1 Performance Series 2: T1 .......................................................................................................... 24 6.2.2 Performance Series 2: T2 .......................................................................................................... 24
6.3 Performance Series 2 - Conclusions & Summary ............................................................................... 24
7 PERFORMANCE SERIES 3 ..................................................................................................... 25 7.1 Schedule ................................................................................................................................................. 25
7.1.1 Objective .................................................................................................................................... 25 7.1.2 Wave Conditions ........................................................................................................................ 25 7.1.3 Duration ..................................................................................................................................... 25 7.1.4 Depth ......................................................................................................................................... 25 7.1.5 Damping ..................................................................................................................................... 25
7.2 Tests ........................................................................................................................................................ 26 7.2.1 Performance Series 3: T1 .......................................................................................................... 26 7.2.2 Performance Series 3: T2 .......................................................................................................... 26 7.2.3 Performance Series 3: T3 .......................................................................................................... 26 7.2.4 Performance Series 3: T4 .......................................................................................................... 26 7.2.5 Performance Series 3: T5 .......................................................................................................... 27
7.3 Performance Series 3 - Conclusions & Summary ............................................................................... 27
8 PERFORMANCE SERIES 4 ..................................................................................................... 28 8.1 Schedule ................................................................................................................................................. 28
8.1.1 Objective .................................................................................................................................... 28 8.1.2 Wave Conditions ........................................................................................................................ 28 8.1.3 Duration ..................................................................................................................................... 28 8.1.4 Depth ......................................................................................................................................... 28 8.1.5 Damping ..................................................................................................................................... 28
8.2 Tests ........................................................................................................................................................ 29 8.2.1 Performance Series 4: T1 .......................................................................................................... 29 8.2.2 Performance Series 4: T2 .......................................................................................................... 29 8.2.3 Performance Series 4: T3 .......................................................................................................... 29 8.2.4 Performance Series 4: T4 .......................................................................................................... 30 8.2.5 Performance Series 4: T5 .......................................................................................................... 30
8.3 Performance Series 4 - Conclusions & Summary ............................................................................... 30
9 PERFORMANCE SERIES 5 ..................................................................................................... 31 9.1 Schedule ................................................................................................................................................. 31
9.1.1 Objective .................................................................................................................................... 31 9.1.2 Wave Conditions ........................................................................................................................ 31 9.1.3 Duration ..................................................................................................................................... 31 9.1.4 Depth ......................................................................................................................................... 31 9.1.5 Damping ..................................................................................................................................... 31
9.2 Tests ........................................................................................................................................................ 32 9.2.1 Performance Series 5: T1 .......................................................................................................... 32 9.2.2 Performance Series 3: T2 .......................................................................................................... 32
9.3 Performance Series 5 - Conclusions & Summary ............................................................................... 32
© Power Projects Limited February 2012
10 ANGLED WAVES 1 .................................................................................................................. 33 10.1 Schedule ................................................................................................................................................. 33
10.1.1 Objective .................................................................................................................................... 33 10.1.2 Wave Conditions ........................................................................................................................ 33 10.1.3 Duration ..................................................................................................................................... 33 10.1.4 Depth ......................................................................................................................................... 33 10.1.5 Damping .................................................................................................................................... 33
10.2 Tests ........................................................................................................................................................ 33 10.2.1 Angled Waves 1: T1 ................................................................................................................... 33 10.2.2 Angled Waves 1: T2 ................................................................................................................... 34
10.3 Angled Waves 1 - Conclusions & Summary ........................................................................................ 34
11 MOORING TESTS..................................................................................................................... 35 11.1 Schedule ................................................................................................................................................. 35
11.1.1 Objective .................................................................................................................................... 35 11.1.2 Wave Conditions ........................................................................................................................ 35 11.1.3 Duration ..................................................................................................................................... 35 11.1.4 Depth ......................................................................................................................................... 35 11.1.5 Damping .................................................................................................................................... 35
11.2 Tests ........................................................................................................................................................ 36 11.2.1 Mooring: T1 ................................................................................................................................ 36 11.2.2 Mooring: T2 ................................................................................................................................ 36 11.2.3 Mooring: T3 ................................................................................................................................ 37 11.2.4 Mooring: T4 ................................................................................................................................ 38 11.2.5 Mooring: T5 ................................................................................................................................ 38
11.3 Mooring - Conclusions & Summary...................................................................................................... 38
12 ORTHOGONAL TESTS ............................................................................................................ 40 12.1 Schedule ................................................................................................................................................. 40
12.1.1 Objective .................................................................................................................................... 40 12.1.2 Wave Conditions ........................................................................................................................ 40 12.1.3 Duration ..................................................................................................................................... 40 12.1.4 Depth ......................................................................................................................................... 40 12.1.5 Damping .................................................................................................................................... 40
12.2 Tests ........................................................................................................................................................ 41 12.2.1 Orthogonal: T1 ........................................................................................................................... 41 12.2.2 Orthogonal: T2 ........................................................................................................................... 41 12.2.3 Orthogonal: T3 ........................................................................................................................... 41 12.2.4 Orthogonal: T4 ........................................................................................................................... 42 12.2.5 Orthogonal: T5 ........................................................................................................................... 42 12.2.6 Orthogonal: T6 ........................................................................................................................... 42 12.2.7 Orthogonal: T7 ........................................................................................................................... 43
12.3 Orthogonal - Conclusions & Summary ................................................................................................ 43
13 SPAR CONFIG 1 ....................................................................................................................... 44 13.1 Schedule ................................................................................................................................................. 44
13.1.1 Objective .................................................................................................................................... 44 13.1.2 Model Set Up ............................................................................................................................. 44 13.1.3 Wave Conditions ........................................................................................................................ 44 13.1.4 Duration ..................................................................................................................................... 45 13.1.5 Depth ......................................................................................................................................... 45 13.1.6 Damping .................................................................................................................................... 45
13.2 Tests ........................................................................................................................................................ 46 13.2.1 Spar Config 1: T1 ....................................................................................................................... 46 13.2.2 Spar Config 1: T2....................................................................................................................... 4613.2.3 Spar Config 1: T3 ....................................................................................................................... 46 13.2.4 Spar Config 1: T4 ....................................................................................................................... 47 13.2.5 Spar Config 1: T5 ....................................................................................................................... 47 13.2.6 Spar Config 1: T6 ....................................................................................................................... 47 13.2.7 Spar Config 1: T7 ....................................................................................................................... 48
13.3 Spar Config 1 - Conclusions & Summary ............................................................................................ 48
14 SPAR CONFIG 2 ....................................................................................................................... 49
© Power Projects Limited February 2012
14.1 Schedule ................................................................................................................................................. 49 14.1.1 Objective .................................................................................................................................... 49 14.1.2 Model Set Up ............................................................................................................................. 49
14.2 Spar Config 2- Conclusions & Summary ............................................................................................. 49
15 SPAR CONFIG 3 ....................................................................................................................... 50 15.1 Schedule ................................................................................................................................................. 50
15.1.1 Objective .................................................................................................................................... 50 15.1.2 Model Set Up ............................................................................................................................. 50
15.2 Spar Config 2- Conclusions & Summary ............................................................................................. 50
16 SPAR CONFIG 4 ....................................................................................................................... 51 16.1 Schedule ................................................................................................................................................. 51
16.1.1 Objective .................................................................................................................................... 51 16.1.2 Model Set Up ............................................................................................................................. 51 16.1.3 Wave Conditions ........................................................................................................................ 51 16.1.4 Duration ..................................................................................................................................... 52 16.1.5 Depth ......................................................................................................................................... 52 16.1.6 Damping .................................................................................................................................... 52
16.2 Tests ........................................................................................................................................................ 53 16.2.1 Spar Config 4: T1 ....................................................................................................................... 53 16.2.2 Spar Config 4: T2 ....................................................................................................................... 53 16.2.3 Spar Config 4: T3 ....................................................................................................................... 53 16.2.4 Spar Config 4: T4 ....................................................................................................................... 54 16.2.5 Spar Config 4: T5 ....................................................................................................................... 54 16.2.6 Spar Config 4: T6 ....................................................................................................................... 54
16.3 Spar Config 4 - Conclusions & Summary ............................................................................................ 55
17 CIRCULAR FLOAT ................................................................................................................... 56 17.1 Schedule ................................................................................................................................................. 56
17.1.1 Objective .................................................................................................................................... 56 17.1.2 Wave Conditions ........................................................................................................................ 56 17.1.3 Duration ..................................................................................................................................... 56 17.1.4 Depth ......................................................................................................................................... 56 17.1.5 Damping .................................................................................................................................... 56
17.2 Tests ........................................................................................................................................................ 57 17.2.1 Circular Float: T1 ....................................................................................................................... 57 17.2.2 Circular Float: T2 ....................................................................................................................... 57 17.2.3 Circular Float: T3 ....................................................................................................................... 57 17.2.4 Circular Float: T4 ....................................................................................................................... 58 17.2.5 Circular Float: T5 ....................................................................................................................... 58 17.2.6 Circular Float: T6 ....................................................................................................................... 58
17.3 Circular Float - Conclusions & Summary ............................................................................................. 59
18 DIAMOND FLOAT..................................................................................................................... 60 18.1 Schedule ................................................................................................................................................. 60
18.1.1 Objective .................................................................................................................................... 60 18.1.2 Wave Conditions ........................................................................................................................ 60 18.1.3 Duration ..................................................................................................................................... 60 18.1.4 Depth ......................................................................................................................................... 60 18.1.5 Damping .................................................................................................................................... 60
18.2 Tests ........................................................................................................................................................ 61 18.2.1 Diamond Float: T1 ..................................................................................................................... 61 18.2.2 Diamond Float: T2 ..................................................................................................................... 61 18.2.3 Diamond Float: T3 ..................................................................................................................... 61 18.2.4 Diamond Float: T4 ..................................................................................................................... 62 18.2.5 Diamond Float: T5 ..................................................................................................................... 62 18.2.6 Diamond Float: T6 ..................................................................................................................... 62
18.3 Diamond Float - Conclusions & Summary ........................................................................................... 63
19 FREQUENCY SWEEP .............................................................................................................. 64 19.1 Schedule ................................................................................................................................................. 64
© Power Projects Limited February 2012
19.1.1 Objective .................................................................................................................................... 64 19.1.2 Wave Conditions ........................................................................................................................ 64 19.1.3 Duration ..................................................................................................................................... 64 19.1.4 Depth ......................................................................................................................................... 64 19.1.5 Damping .................................................................................................................................... 64
19.2 Tests ........................................................................................................................................................ 65 19.2.1 Frequency Sweep: T1 ................................................................................................................ 65 19.2.2 Frequency Sweep: T2 ................................................................................................................ 65 19.2.3 Frequency Sweep: T3 ................................................................................................................ 65 19.2.4 Frequency Sweep: T4 ................................................................................................................ 66 19.2.5 Frequency Sweep: T5 ................................................................................................................ 66 19.2.6 Frequency Sweep: T6 ................................................................................................................ 66 19.2.7 Frequency Sweep: T7 ................................................................................................................ 66 19.2.8 Frequency Sweep: T8 ................................................................................................................ 67 19.2.9 Frequency Sweep: T9 ................................................................................................................ 67 19.2.10 Frequency Sweep: T10 ............................................................................................................ 67 19.2.11 Frequency Sweep: T11 ............................................................................................................ 68 19.2.12 Frequency Sweep: T12 ............................................................................................................ 68 19.2.13 Frequency Sweep: T13 ............................................................................................................ 68 19.2.14 Frequency Sweep: T14 ............................................................................................................ 69 19.2.15 Frequency Sweep: T15 ............................................................................................................ 69
19.3 Frequency Sweep - CONCLUSIONS & Summary ................................................................................ 69
20 SURVIVABILITY TESTS ........................................................................................................... 70 20.1 Schedule ................................................................................................................................................. 70
20.1.1 Objective .................................................................................................................................... 70 20.1.2 Wave Conditions ........................................................................................................................ 70 20.1.3 Duration ..................................................................................................................................... 70 20.1.4 Depth ......................................................................................................................................... 70 20.1.5 Damping .................................................................................................................................... 70
20.2 Tests ........................................................................................................................................................ 71 20.2.1 Survivability T1........................................................................................................................... 71 20.2.2 Survivability T2........................................................................................................................... 71 20.2.3 Survivability T3........................................................................................................................... 71 20.2.4 Survivability T4........................................................................................................................... 72 20.2.5 Survivability T5........................................................................................................................... 72 20.2.6 Survivability T6........................................................................................................................... 72
20.3 Survivability - CONCLUSIONS & Summary ......................................................................................... 73
21 FINAL CONCLUSIONS AND RECOMMENDATIONS FOR FUTURE WORK ........................ 74 21.1 Conclusions ............................................................................................................................................ 74 21.2 Recommendations ................................................................................................................................. 74
21.2.1 Conceptual Modifications ........................................................................................................... 74 21.2.2 Recommendations for future tank testing .................................................................................. 74 21.2.3 Opportunities for Technical Collaboration between IRL AND PPL/David Findlay ...................... 75
FIGURES Figure 1 - The Default Mooring system ......................................................................................................................... 9 Figure 2 - Approximate float sticking position .............................................................................................................. 14 Figure 3 - Mooring harness ......................................................................................................................................... 37 Figure 4 - Spar Config 1 .............................................................................................................................................. 44 Figure 5 - Spar Config 2 .............................................................................................................................................. 49 Figure 6 - Spar Config 3 .............................................................................................................................................. 50 Figure 7 - Spar Config 4 .............................................................................................................................................. 51

© Power Projects Limited February 2012 6
GLOSSARY OF TERMS IRL Industrial Research Limited, a Crown Research Institute PPL Power Projects Limited, a privately-owned Wellington-based company WET-NZ Wave Energy Technology - New Zealand, a consortium R&D project between IRL and PPL OSU Oregon State University ADV Acoustic Doppler Velocimeter TDC Top Dead Centre BDC Bottom Dead Centre
REVISION HISTORY
Version Author Reviewed By Date Draft David Findlay John Huckerby 4/11/2011 Final David Findlay 07/02/2011
© Power Projects Limited February 2012 7
EXECUTIVE SUMMARY The report provides details of a series of scaled tank tests performed on the WET-NZ 1:30-scale wave energy device model at the O.H. Hinsdale Wave Research Laboratory between the 17 - 27 October 2011. A range of tests were performed, including verification tests carried out in regular waves, and used to validate existing numerical models of the device, a variety of irregular wave tests based largely on the IEA-OES Annex 2 testing methodology, and a number of alternative structural and mooring configurations. This document provides an extensive summary of the tests performed with notes and observations recorded. No attempt has been made within this report to analysis the recorded data, draw conclusions as to efficacy of the device, or compare the results with previous performance estimations. Conclusions and recommendations based purely on visual observation of the device are listed at the end of each section. Recommendations for future work are contained in the final section of the report.

© Power Projects Limited February 2012 8
1 INTRODUCTION
1.1 PURPOSE The following list details the main objectives behind the series of tests detailed in this report:
Quantify the accuracy and assumptions behind existing numerical simulations of the dynamic performance of the WET-NZ device.
Provide insight into the dynamic response of the WET-NZ device when subjected to real sea states
Examine the significance of 3D hydrodynamic effects and interactions between the WET-NZ device and a complex wave field.
Provide confidence to the project stakeholders and technical development team as to the likely performance and durability of the WET-NZ design.
Examine the survivability characteristics of the device in extreme wave conditions.
1.2 AUTHOR This report was compiled by David Findlay on behalf of Power Project limited
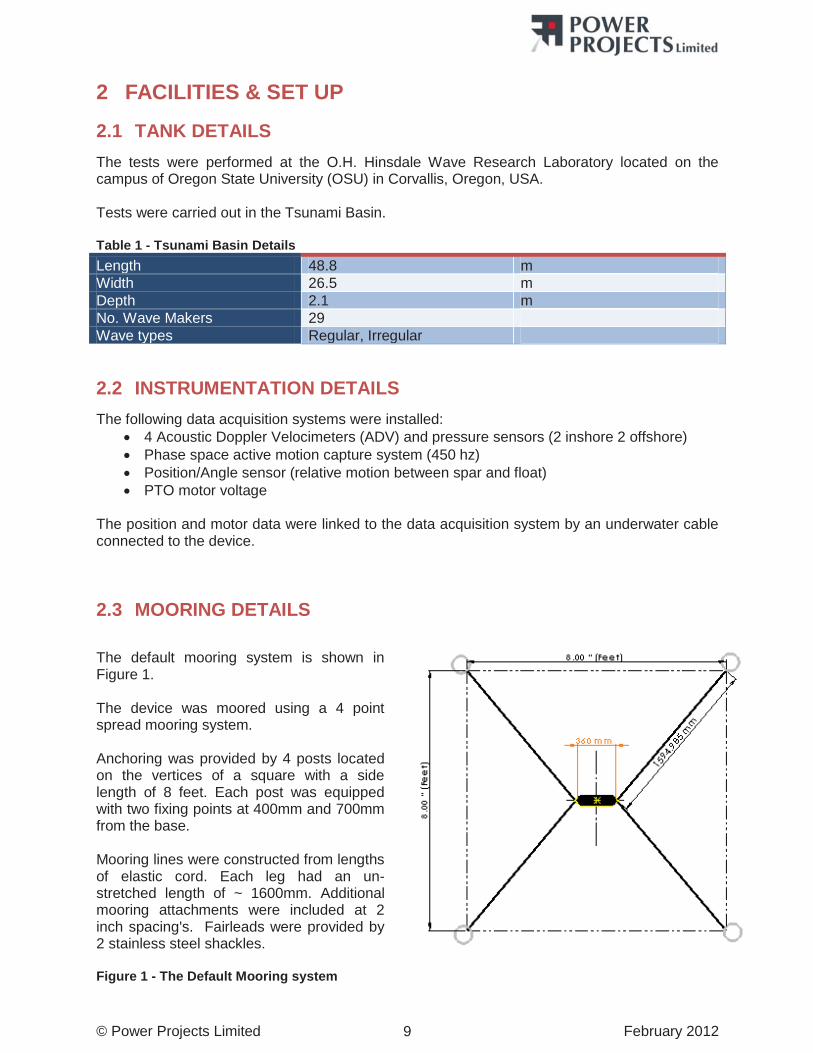
© Power Projects Limited February 2012 9
2 FACILITIES & SET UP
2.1 TANK DETAILS The tests were performed at the O.H. Hinsdale Wave Research Laboratory located on the campus of Oregon State University (OSU) in Corvallis, Oregon, USA. Tests were carried out in the Tsunami Basin. Table 1 - Tsunami Basin Details Length 48.8 m Width 26.5 m Depth 2.1 m No. Wave Makers 29 Wave types Regular, Irregular
2.2 INSTRUMENTATION DETAILS The following data acquisition systems were installed:
4 Acoustic Doppler Velocimeters (ADV) and pressure sensors (2 inshore 2 offshore) Phase space active motion capture system (450 hz) Position/Angle sensor (relative motion between spar and float) PTO motor voltage
The position and motor data were linked to the data acquisition system by an underwater cable connected to the device.
2.3 MOORING DETAILS The default mooring system is shown in Figure 1. The device was moored using a 4 point spread mooring system. Anchoring was provided by 4 posts located on the vertices of a square with a side length of 8 feet. Each post was equipped with two fixing points at 400mm and 700mm from the base. Mooring lines were constructed from lengths of elastic cord. Each leg had an un-stretched length of ~ 1600mm. Additional mooring attachments were included at 2 inch spacing's. Fairleads were provided by 2 stainless steel shackles. Figure 1 - The Default Mooring system
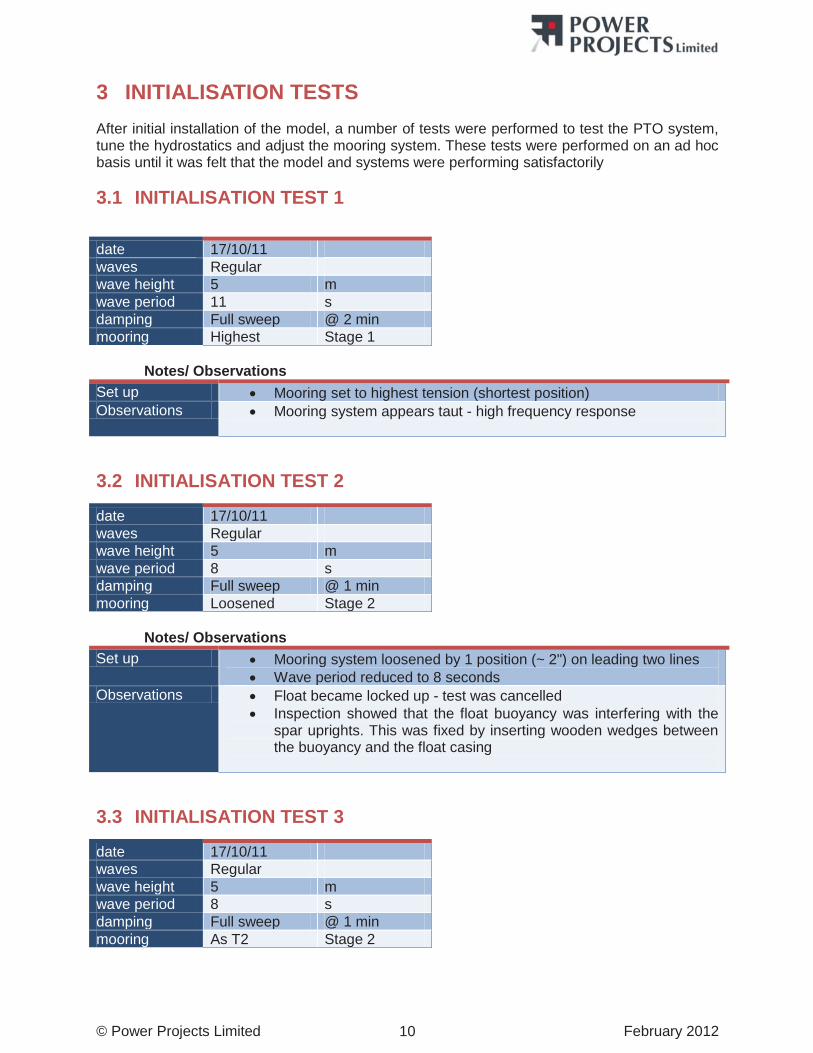
© Power Projects Limited February 2012 10
3 INITIALISATION TESTS After initial installation of the model, a number of tests were performed to test the PTO system, tune the hydrostatics and adjust the mooring system. These tests were performed on an ad hoc basis until it was felt that the model and systems were performing satisfactorily
3.1 INITIALISATION TEST 1 date 17/10/11 waves Regular wave height 5 m wave period 11 s damping Full sweep @ 2 min mooring Highest Stage 1
Notes/ Observations Set up Mooring set to highest tension (shortest position) Observations Mooring system appears taut - high frequency response
3.2 INITIALISATION TEST 2
date 17/10/11 waves Regular wave height 5 m wave period 8 s damping Full sweep @ 1 min mooring Loosened Stage 2
Notes/ Observations Set up Mooring system loosened by 1 position (~ 2") on leading two lines
Wave period reduced to 8 seconds Observations Float became locked up - test was cancelled
Inspection showed that the float buoyancy was interfering with the spar uprights. This was fixed by inserting wooden wedges between the buoyancy and the float casing
3.3 INITIALISATION TEST 3
date 17/10/11 waves Regular wave height 5 m wave period 8 s damping Full sweep @ 1 min mooring As T2 Stage 2
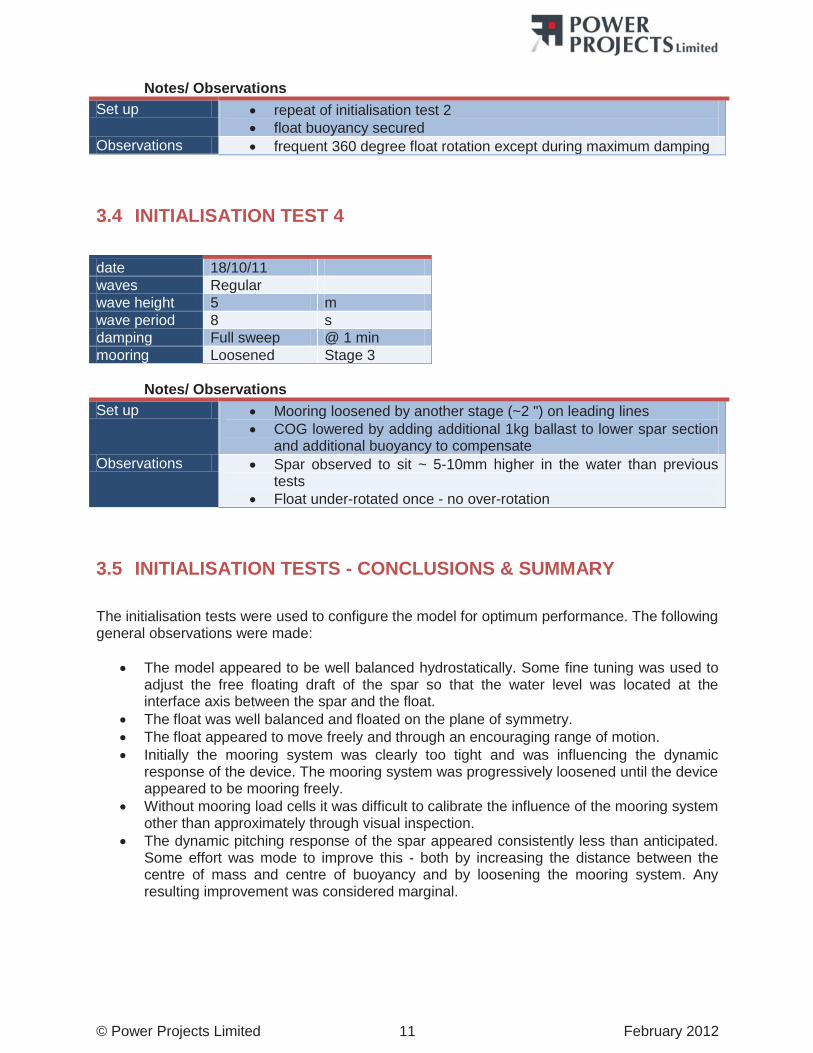
© Power Projects Limited February 2012 11
Notes/ Observations Set up repeat of initialisation test 2
float buoyancy secured Observations frequent 360 degree float rotation except during maximum damping
3.4 INITIALISATION TEST 4 date 18/10/11 waves Regular wave height 5 m wave period 8 s damping Full sweep @ 1 min mooring Loosened Stage 3
Notes/ Observations Set up Mooring loosened by another stage (~2 ") on leading lines
COG lowered by adding additional 1kg ballast to lower spar section and additional buoyancy to compensate
Observations Spar observed to sit ~ 5-10mm higher in the water than previous tests
Float under-rotated once - no over-rotation
3.5 INITIALISATION TESTS - CONCLUSIONS & SUMMARY The initialisation tests were used to configure the model for optimum performance. The following general observations were made:
The model appeared to be well balanced hydrostatically. Some fine tuning was used to adjust the free floating draft of the spar so that the water level was located at the interface axis between the spar and the float.
The float was well balanced and floated on the plane of symmetry. The float appeared to move freely and through an encouraging range of motion. Initially the mooring system was clearly too tight and was influencing the dynamic
response of the device. The mooring system was progressively loosened until the device appeared to be mooring freely.
Without mooring load cells it was difficult to calibrate the influence of the mooring system other than approximately through visual inspection.
The dynamic pitching response of the spar appeared consistently less than anticipated. Some effort was mode to improve this - both by increasing the distance between the centre of mass and centre of buoyancy and by loosening the mooring system. Any resulting improvement was considered marginal.
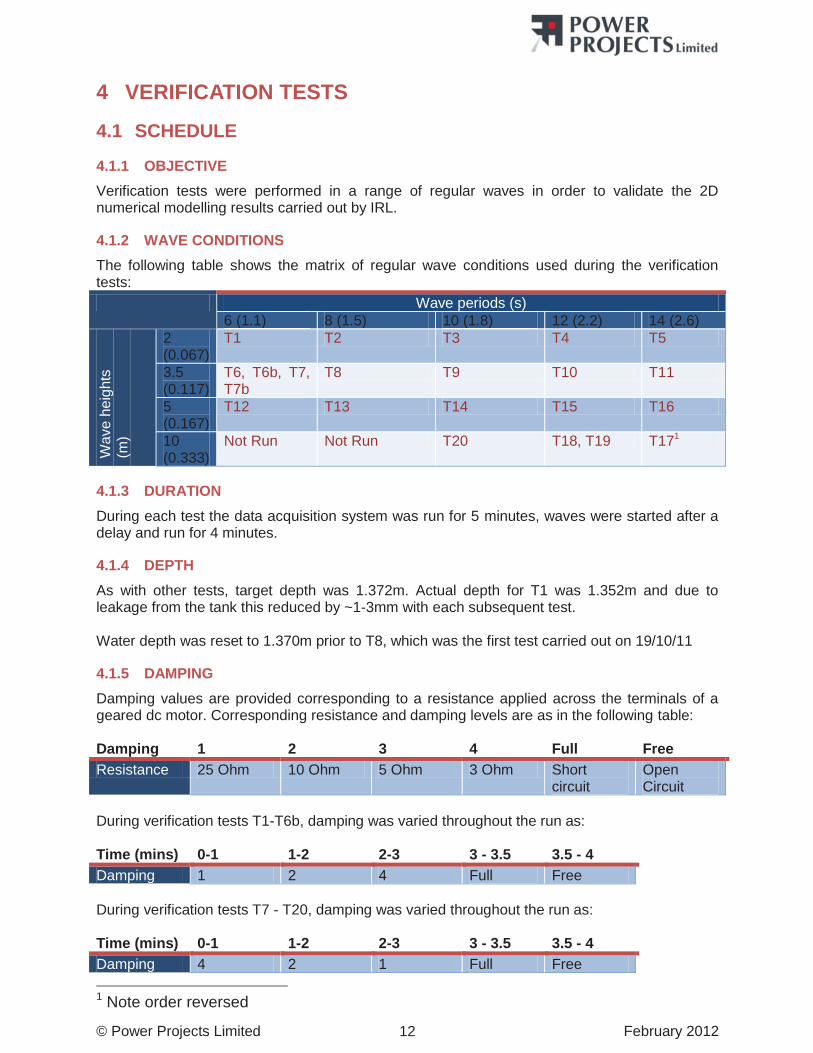
© Power Projects Limited February 2012 12
4 VERIFICATION TESTS
4.1 SCHEDULE
4.1.1 OBJECTIVE Verification tests were performed in a range of regular waves in order to validate the 2D numerical modelling results carried out by IRL.
4.1.2 WAVE CONDITIONS The following table shows the matrix of regular wave conditions used during the verification tests: Wave periods (s)
6 (1.1) 8 (1.5) 10 (1.8) 12 (2.2) 14 (2.6)
Wav
e he
ight
s (m
)
2 (0.067)
T1 T2 T3 T4 T5
3.5 (0.117)
T6, T6b, T7, T7b
T8 T9 T10 T11
5 (0.167)
T12 T13 T14 T15 T16
10 (0.333)
Not Run Not Run T20 T18, T19 T171
4.1.3 DURATION During each test the data acquisition system was run for 5 minutes, waves were started after a delay and run for 4 minutes.
4.1.4 DEPTH As with other tests, target depth was 1.372m. Actual depth for T1 was 1.352m and due to leakage from the tank this reduced by ~1-3mm with each subsequent test. Water depth was reset to 1.370m prior to T8, which was the first test carried out on 19/10/11
4.1.5 DAMPING Damping values are provided corresponding to a resistance applied across the terminals of a geared dc motor. Corresponding resistance and damping levels are as in the following table: Damping 1 2 3 4 Full Free Resistance 25 Ohm 10 Ohm 5 Ohm 3 Ohm Short
circuit Open Circuit
During verification tests T1-T6b, damping was varied throughout the run as: Time (mins) 0-1 1-2 2-3 3 - 3.5 3.5 - 4 Damping 1 2 4 Full Free During verification tests T7 - T20, damping was varied throughout the run as: Time (mins) 0-1 1-2 2-3 3 - 3.5 3.5 - 4 Damping 4 2 1 Full Free 1 Note order reversed
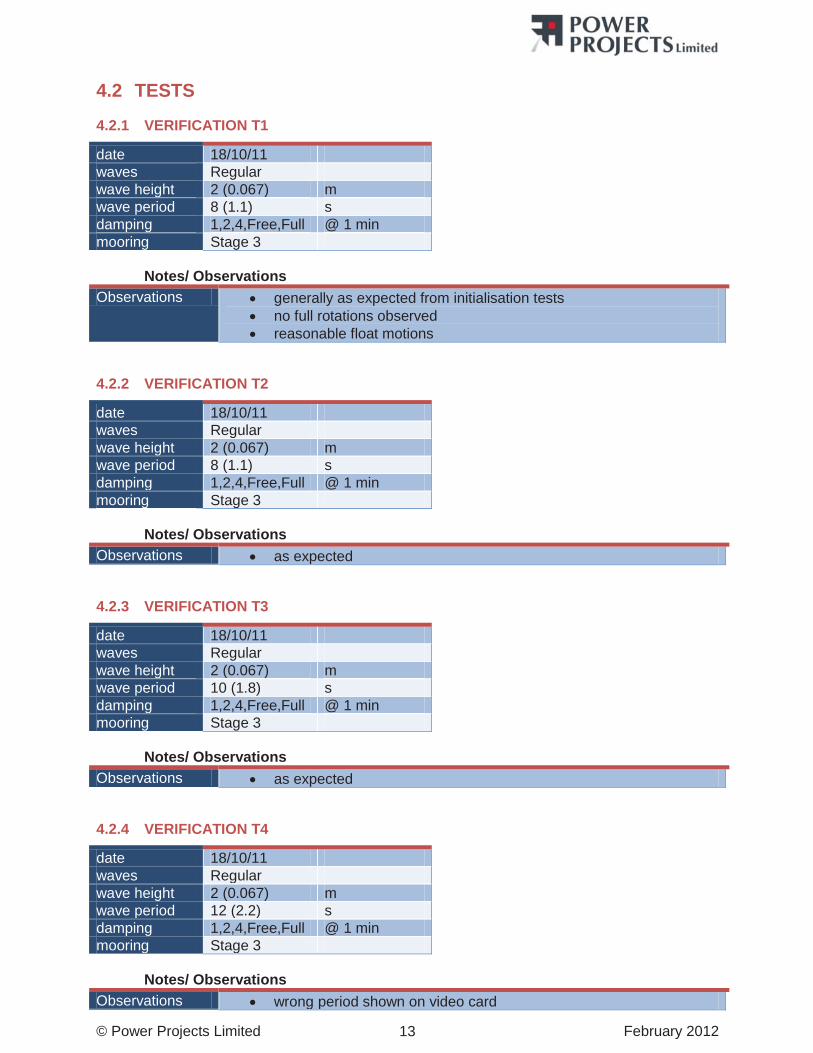
© Power Projects Limited February 2012 13
4.2 TESTS
4.2.1 VERIFICATION T1
date 18/10/11 waves Regular wave height 2 (0.067) m wave period 8 (1.1) s damping 1,2,4,Free,Full @ 1 min mooring Stage 3
Notes/ Observations Observations generally as expected from initialisation tests
no full rotations observed reasonable float motions
4.2.2 VERIFICATION T2
date 18/10/11 waves Regular wave height 2 (0.067) m wave period 8 (1.1) s damping 1,2,4,Free,Full @ 1 min mooring Stage 3
Notes/ Observations Observations as expected
4.2.3 VERIFICATION T3
date 18/10/11 waves Regular wave height 2 (0.067) m wave period 10 (1.8) s damping 1,2,4,Free,Full @ 1 min mooring Stage 3
Notes/ Observations Observations as expected
4.2.4 VERIFICATION T4
date 18/10/11 waves Regular wave height 2 (0.067) m wave period 12 (2.2) s damping 1,2,4,Free,Full @ 1 min mooring Stage 3
Notes/ Observations Observations wrong period shown on video card
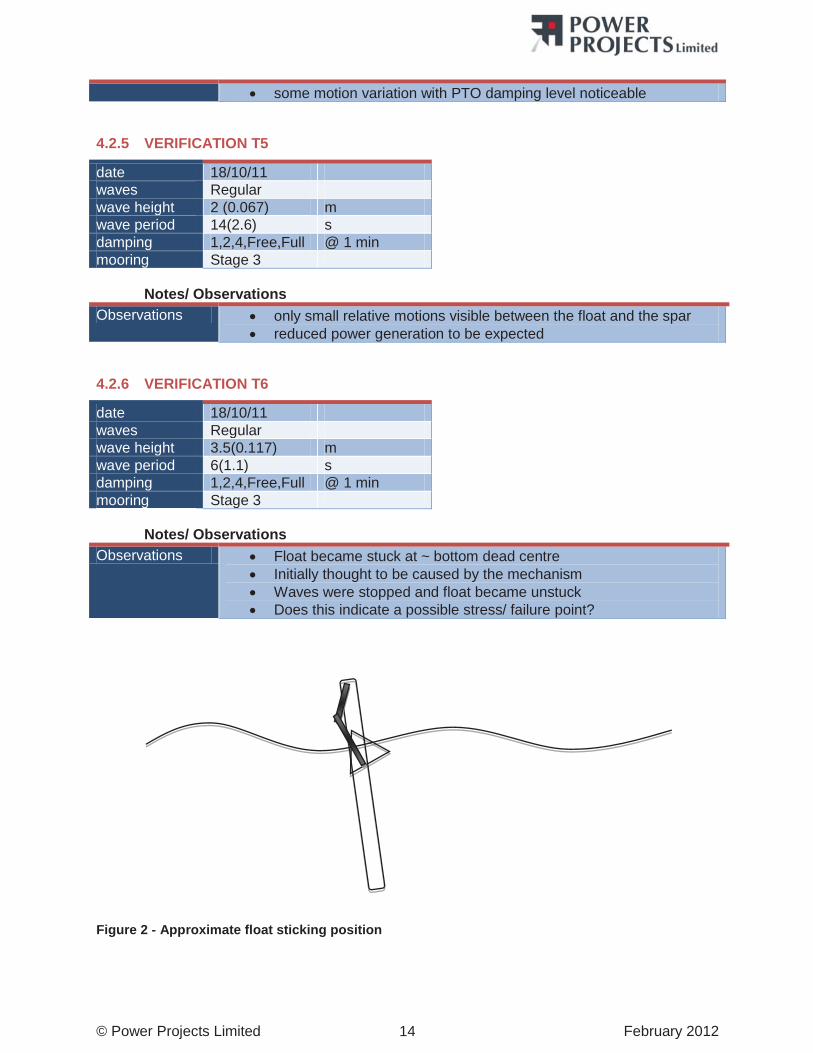
© Power Projects Limited February 2012 14
some motion variation with PTO damping level noticeable
4.2.5 VERIFICATION T5
date 18/10/11 waves Regular wave height 2 (0.067) m wave period 14(2.6) s damping 1,2,4,Free,Full @ 1 min mooring Stage 3
Notes/ Observations Observations only small relative motions visible between the float and the spar
reduced power generation to be expected
4.2.6 VERIFICATION T6
date 18/10/11 waves Regular wave height 3.5(0.117) m wave period 6(1.1) s damping 1,2,4,Free,Full @ 1 min mooring Stage 3
Notes/ Observations Observations Float became stuck at ~ bottom dead centre
Initially thought to be caused by the mechanism Waves were stopped and float became unstuck Does this indicate a possible stress/ failure point?
Figure 2 - Approximate float sticking position
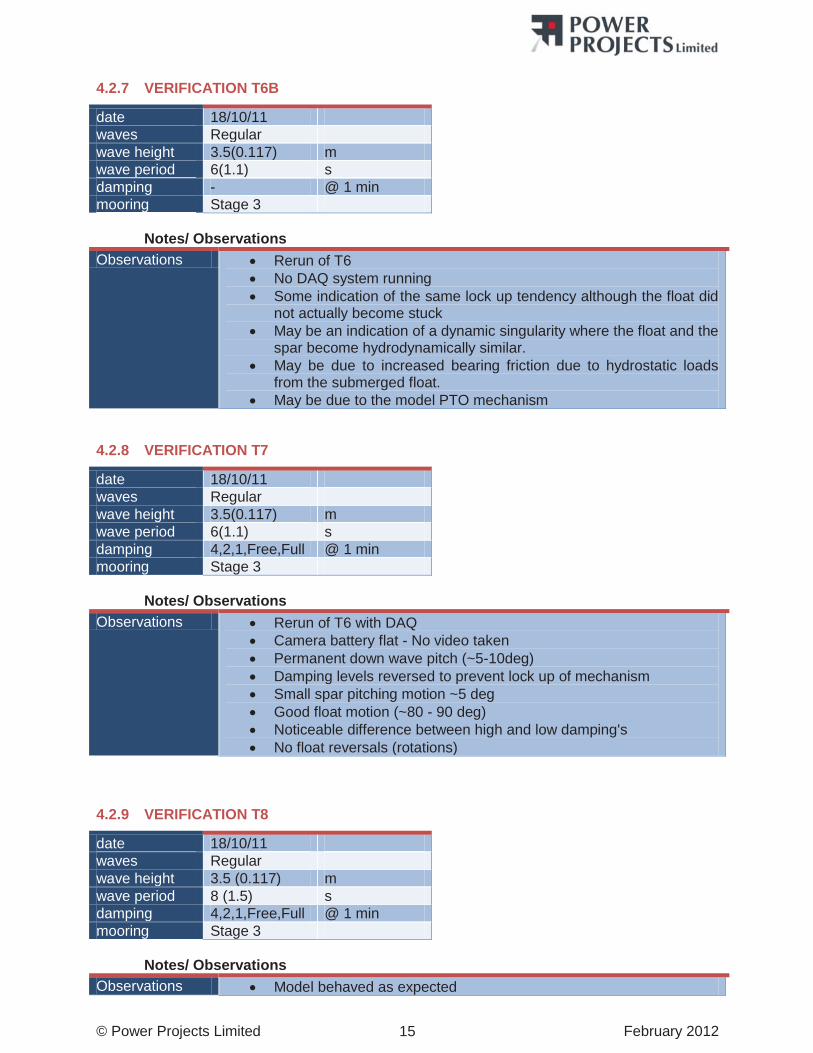
© Power Projects Limited February 2012 15
4.2.7 VERIFICATION T6B
date 18/10/11 waves Regular wave height 3.5(0.117) m wave period 6(1.1) s damping - @ 1 min mooring Stage 3
Notes/ Observations Observations Rerun of T6
No DAQ system running Some indication of the same lock up tendency although the float did
not actually become stuck May be an indication of a dynamic singularity where the float and the
spar become hydrodynamically similar. May be due to increased bearing friction due to hydrostatic loads
from the submerged float. May be due to the model PTO mechanism
4.2.8 VERIFICATION T7
date 18/10/11 waves Regular wave height 3.5(0.117) m wave period 6(1.1) s damping 4,2,1,Free,Full @ 1 min mooring Stage 3
Notes/ Observations Observations Rerun of T6 with DAQ
Camera battery flat - No video taken Permanent down wave pitch (~5-10deg) Damping levels reversed to prevent lock up of mechanism Small spar pitching motion ~5 deg Good float motion (~80 - 90 deg) Noticeable difference between high and low damping's No float reversals (rotations)
4.2.9 VERIFICATION T8
date 18/10/11 waves Regular wave height 3.5 (0.117) m wave period 8 (1.5) s damping 4,2,1,Free,Full @ 1 min mooring Stage 3
Notes/ Observations Observations Model behaved as expected
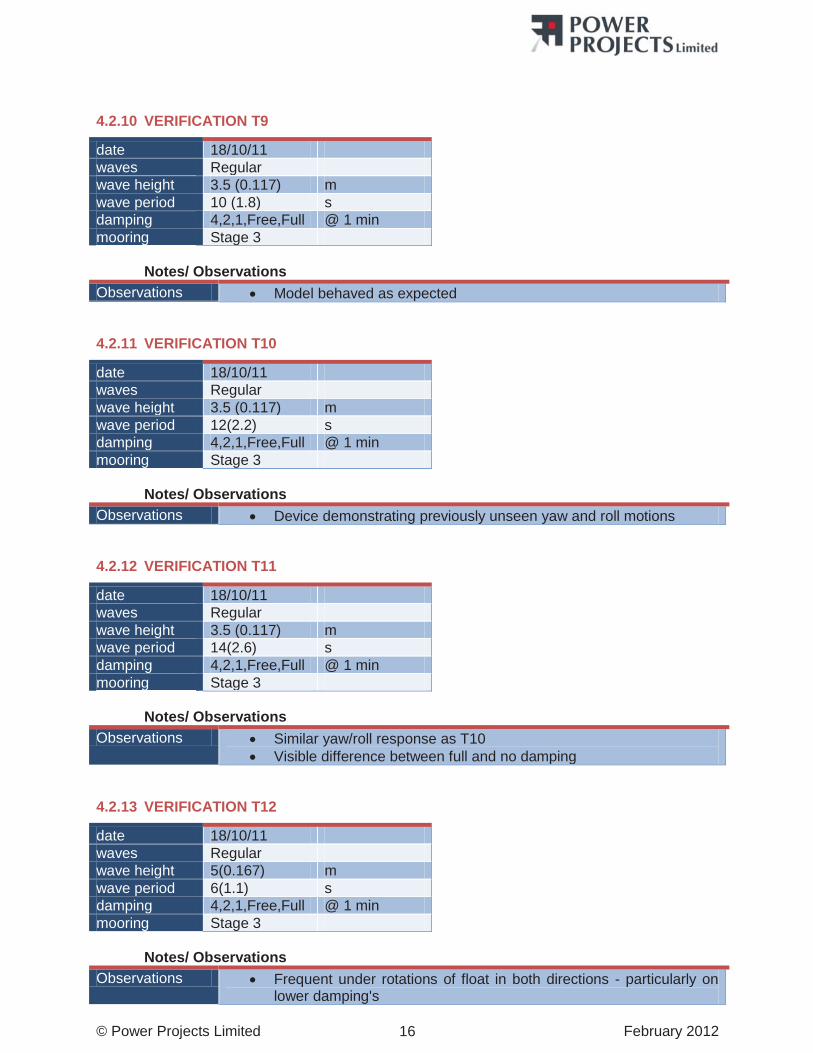
© Power Projects Limited February 2012 16
4.2.10 VERIFICATION T9
date 18/10/11 waves Regular wave height 3.5 (0.117) m wave period 10 (1.8) s damping 4,2,1,Free,Full @ 1 min mooring Stage 3
Notes/ Observations Observations Model behaved as expected
4.2.11 VERIFICATION T10
date 18/10/11 waves Regular wave height 3.5 (0.117) m wave period 12(2.2) s damping 4,2,1,Free,Full @ 1 min mooring Stage 3
Notes/ Observations Observations Device demonstrating previously unseen yaw and roll motions
4.2.12 VERIFICATION T11
date 18/10/11 waves Regular wave height 3.5 (0.117) m wave period 14(2.6) s damping 4,2,1,Free,Full @ 1 min mooring Stage 3
Notes/ Observations Observations Similar yaw/roll response as T10
Visible difference between full and no damping
4.2.13 VERIFICATION T12
date 18/10/11 waves Regular wave height 5(0.167) m wave period 6(1.1) s damping 4,2,1,Free,Full @ 1 min mooring Stage 3
Notes/ Observations Observations Frequent under rotations of float in both directions - particularly on
lower damping's
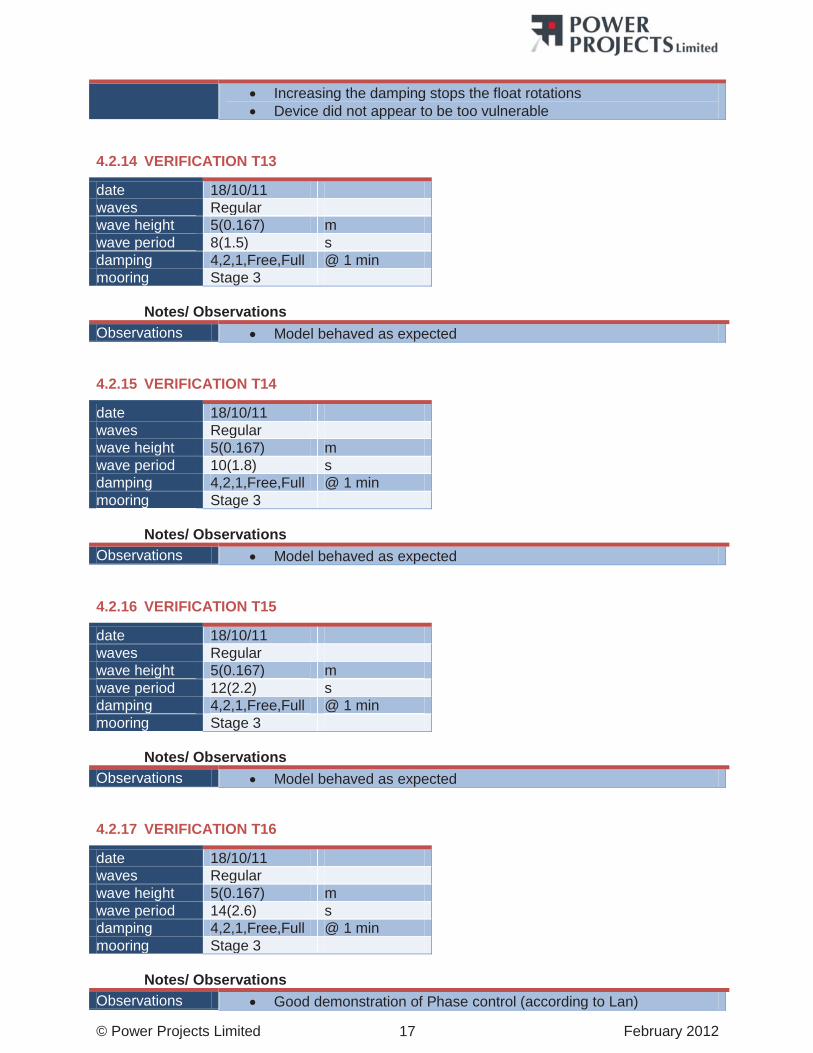
© Power Projects Limited February 2012 17
Increasing the damping stops the float rotations Device did not appear to be too vulnerable
4.2.14 VERIFICATION T13
date 18/10/11 waves Regular wave height 5(0.167) m wave period 8(1.5) s damping 4,2,1,Free,Full @ 1 min mooring Stage 3
Notes/ Observations Observations Model behaved as expected
4.2.15 VERIFICATION T14
date 18/10/11 waves Regular wave height 5(0.167) m wave period 10(1.8) s damping 4,2,1,Free,Full @ 1 min mooring Stage 3
Notes/ Observations Observations Model behaved as expected
4.2.16 VERIFICATION T15
date 18/10/11 waves Regular wave height 5(0.167) m wave period 12(2.2) s damping 4,2,1,Free,Full @ 1 min mooring Stage 3
Notes/ Observations Observations Model behaved as expected
4.2.17 VERIFICATION T16
date 18/10/11 waves Regular wave height 5(0.167) m wave period 14(2.6) s damping 4,2,1,Free,Full @ 1 min mooring Stage 3
Notes/ Observations Observations Good demonstration of Phase control (according to Lan)
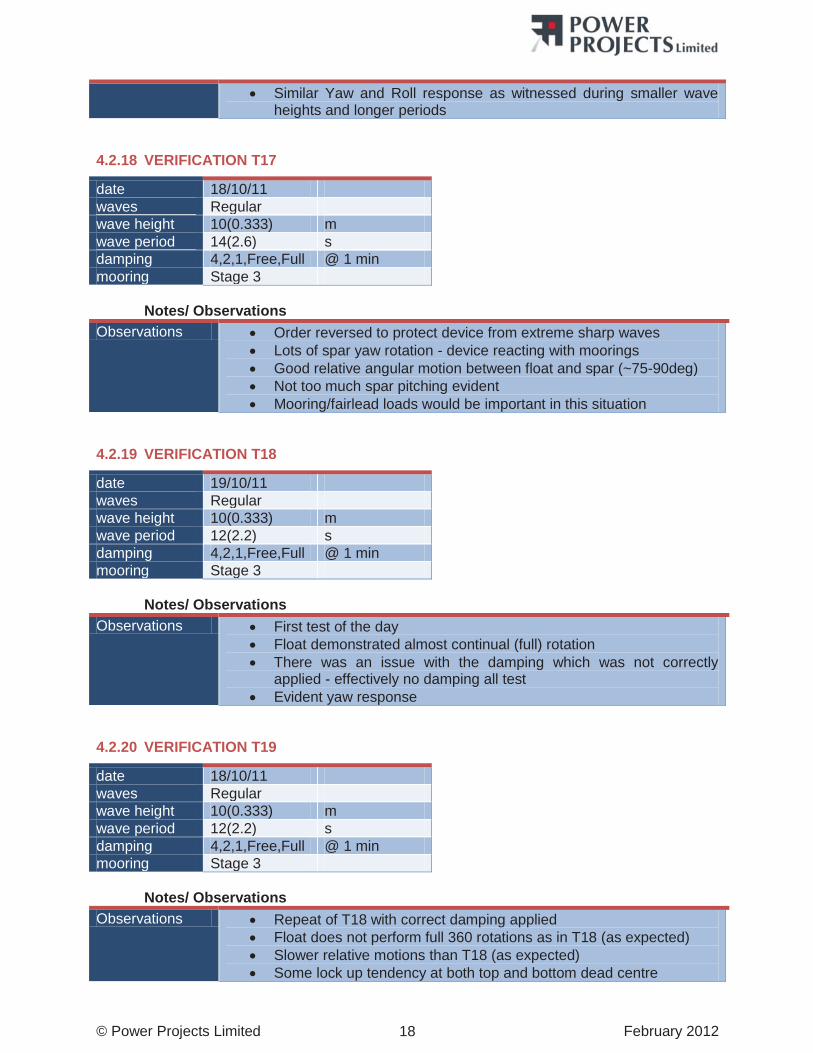
© Power Projects Limited February 2012 18
Similar Yaw and Roll response as witnessed during smaller wave heights and longer periods
4.2.18 VERIFICATION T17
date 18/10/11 waves Regular wave height 10(0.333) m wave period 14(2.6) s damping 4,2,1,Free,Full @ 1 min mooring Stage 3
Notes/ Observations Observations Order reversed to protect device from extreme sharp waves
Lots of spar yaw rotation - device reacting with moorings Good relative angular motion between float and spar (~75-90deg) Not too much spar pitching evident Mooring/fairlead loads would be important in this situation
4.2.19 VERIFICATION T18
date 19/10/11 waves Regular wave height 10(0.333) m wave period 12(2.2) s damping 4,2,1,Free,Full @ 1 min mooring Stage 3
Notes/ Observations Observations First test of the day
Float demonstrated almost continual (full) rotation There was an issue with the damping which was not correctly
applied - effectively no damping all test Evident yaw response
4.2.20 VERIFICATION T19
date 18/10/11 waves Regular wave height 10(0.333) m wave period 12(2.2) s damping 4,2,1,Free,Full @ 1 min mooring Stage 3
Notes/ Observations Observations Repeat of T18 with correct damping applied
Float does not perform full 360 rotations as in T18 (as expected) Slower relative motions than T18 (as expected) Some lock up tendency at both top and bottom dead centre
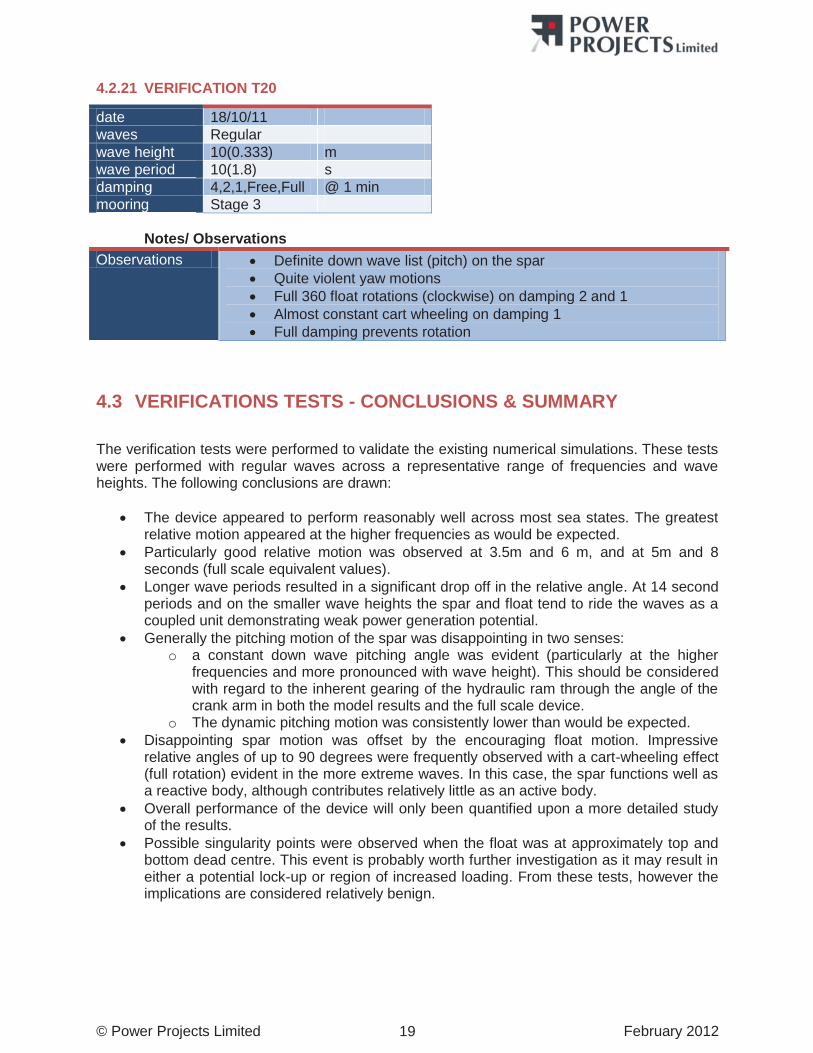
© Power Projects Limited February 2012 19
4.2.21 VERIFICATION T20
date 18/10/11 waves Regular wave height 10(0.333) m wave period 10(1.8) s damping 4,2,1,Free,Full @ 1 min mooring Stage 3
Notes/ Observations Observations Definite down wave list (pitch) on the spar
Quite violent yaw motions Full 360 float rotations (clockwise) on damping 2 and 1 Almost constant cart wheeling on damping 1 Full damping prevents rotation
4.3 VERIFICATIONS TESTS - CONCLUSIONS & SUMMARY The verification tests were performed to validate the existing numerical simulations. These tests were performed with regular waves across a representative range of frequencies and wave heights. The following conclusions are drawn:
The device appeared to perform reasonably well across most sea states. The greatest relative motion appeared at the higher frequencies as would be expected.
Particularly good relative motion was observed at 3.5m and 6 m, and at 5m and 8 seconds (full scale equivalent values).
Longer wave periods resulted in a significant drop off in the relative angle. At 14 second periods and on the smaller wave heights the spar and float tend to ride the waves as a coupled unit demonstrating weak power generation potential.
Generally the pitching motion of the spar was disappointing in two senses: o a constant down wave pitching angle was evident (particularly at the higher
frequencies and more pronounced with wave height). This should be considered with regard to the inherent gearing of the hydraulic ram through the angle of the crank arm in both the model results and the full scale device.
o The dynamic pitching motion was consistently lower than would be expected. Disappointing spar motion was offset by the encouraging float motion. Impressive
relative angles of up to 90 degrees were frequently observed with a cart-wheeling effect (full rotation) evident in the more extreme waves. In this case, the spar functions well as a reactive body, although contributes relatively little as an active body.
Overall performance of the device will only been quantified upon a more detailed study of the results.
Possible singularity points were observed when the float was at approximately top and bottom dead centre. This event is probably worth further investigation as it may result in either a potential lock-up or region of increased loading. From these tests, however the implications are considered relatively benign.
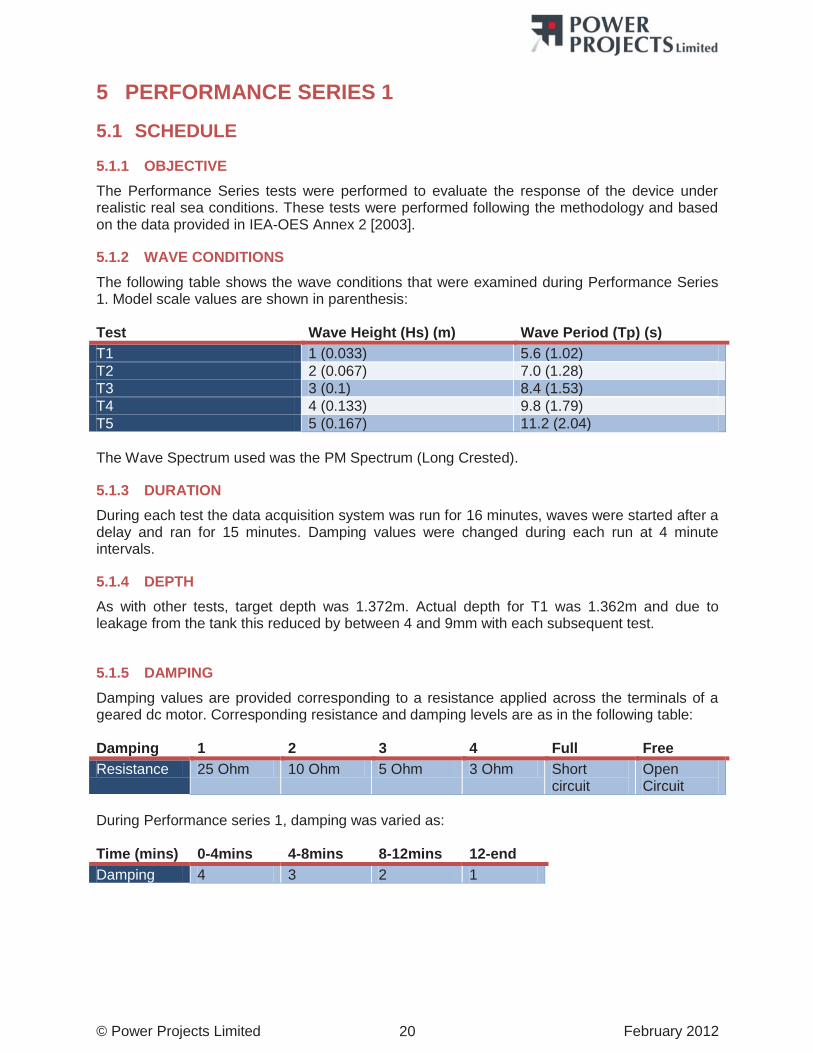
© Power Projects Limited February 2012 20
5 PERFORMANCE SERIES 1
5.1 SCHEDULE
5.1.1 OBJECTIVE The Performance Series tests were performed to evaluate the response of the device under realistic real sea conditions. These tests were performed following the methodology and based on the data provided in IEA-OES Annex 2 [2003].
5.1.2 WAVE CONDITIONS The following table shows the wave conditions that were examined during Performance Series 1. Model scale values are shown in parenthesis: Test Wave Height (Hs) (m) Wave Period (Tp) (s) T1 1 (0.033) 5.6 (1.02) T2 2 (0.067) 7.0 (1.28) T3 3 (0.1) 8.4 (1.53) T4 4 (0.133) 9.8 (1.79) T5 5 (0.167) 11.2 (2.04) The Wave Spectrum used was the PM Spectrum (Long Crested).
5.1.3 DURATION During each test the data acquisition system was run for 16 minutes, waves were started after a delay and ran for 15 minutes. Damping values were changed during each run at 4 minute intervals.
5.1.4 DEPTH As with other tests, target depth was 1.372m. Actual depth for T1 was 1.362m and due to leakage from the tank this reduced by between 4 and 9mm with each subsequent test.
5.1.5 DAMPING Damping values are provided corresponding to a resistance applied across the terminals of a geared dc motor. Corresponding resistance and damping levels are as in the following table: Damping 1 2 3 4 Full Free Resistance 25 Ohm 10 Ohm 5 Ohm 3 Ohm Short
circuit Open Circuit
During Performance series 1, damping was varied as: Time (mins) 0-4mins 4-8mins 8-12mins 12-end Damping 4 3 2 1
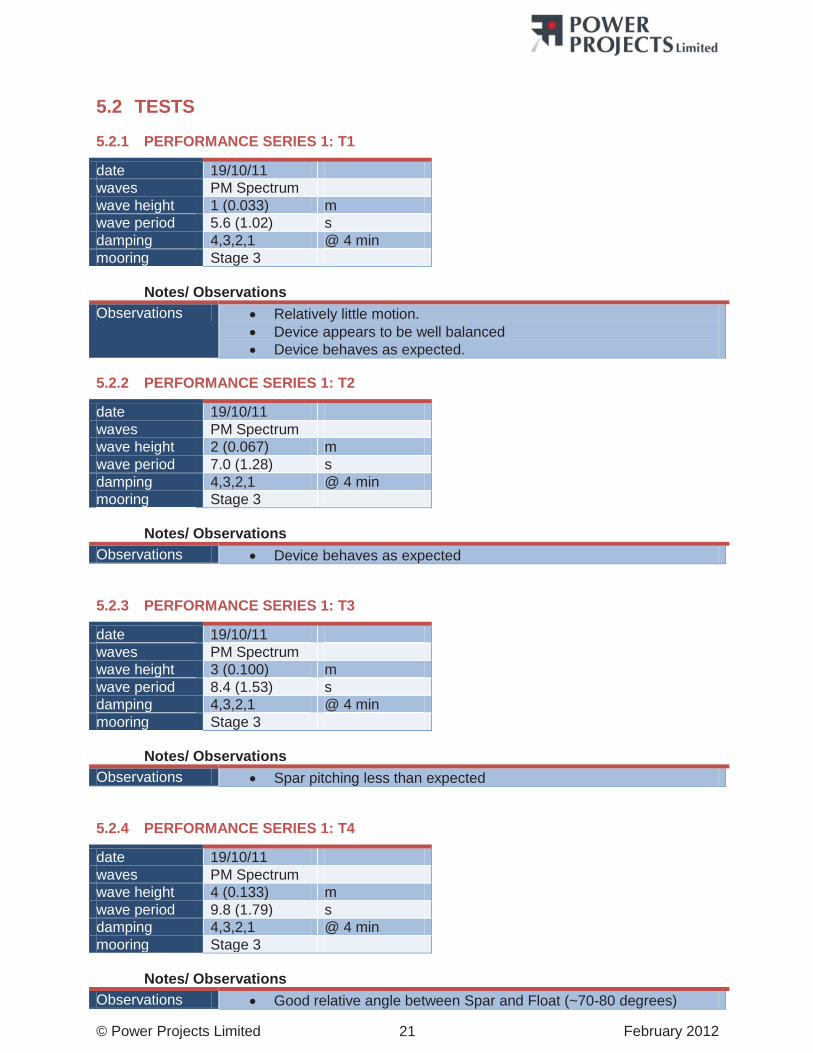
© Power Projects Limited February 2012 21
5.2 TESTS
5.2.1 PERFORMANCE SERIES 1: T1
date 19/10/11 waves PM Spectrum wave height 1 (0.033) m wave period 5.6 (1.02) s damping 4,3,2,1 @ 4 min mooring Stage 3
Notes/ Observations Observations Relatively little motion.
Device appears to be well balanced Device behaves as expected.
5.2.2 PERFORMANCE SERIES 1: T2
date 19/10/11 waves PM Spectrum wave height 2 (0.067) m wave period 7.0 (1.28) s damping 4,3,2,1 @ 4 min mooring Stage 3
Notes/ Observations Observations Device behaves as expected
5.2.3 PERFORMANCE SERIES 1: T3
date 19/10/11 waves PM Spectrum wave height 3 (0.100) m wave period 8.4 (1.53) s damping 4,3,2,1 @ 4 min mooring Stage 3
Notes/ Observations Observations Spar pitching less than expected
5.2.4 PERFORMANCE SERIES 1: T4
date 19/10/11 waves PM Spectrum wave height 4 (0.133) m wave period 9.8 (1.79) s damping 4,3,2,1 @ 4 min mooring Stage 3
Notes/ Observations Observations Good relative angle between Spar and Float (~70-80 degrees)
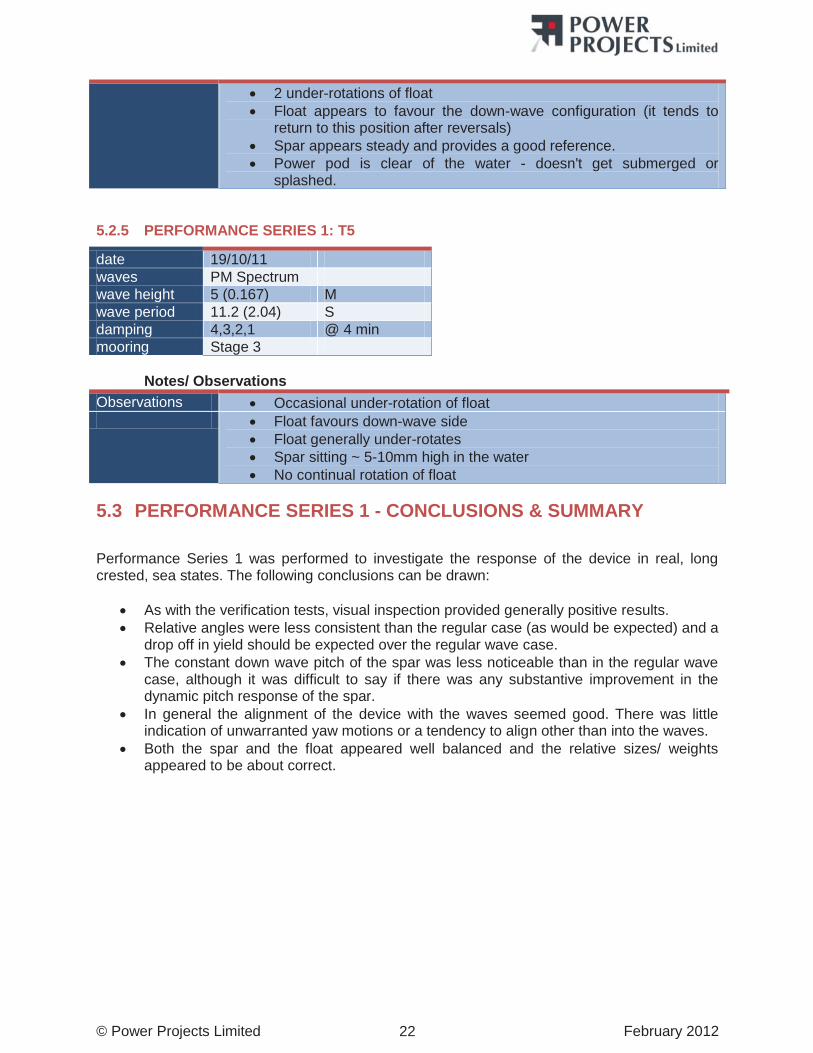
© Power Projects Limited February 2012 22
2 under-rotations of float Float appears to favour the down-wave configuration (it tends to
return to this position after reversals) Spar appears steady and provides a good reference. Power pod is clear of the water - doesn't get submerged or
splashed.
5.2.5 PERFORMANCE SERIES 1: T5
date 19/10/11 waves PM Spectrum wave height 5 (0.167) M wave period 11.2 (2.04) S damping 4,3,2,1 @ 4 min mooring Stage 3
Notes/ Observations Observations Occasional under-rotation of float Float favours down-wave side
Float generally under-rotates Spar sitting ~ 5-10mm high in the water No continual rotation of float
5.3 PERFORMANCE SERIES 1 - CONCLUSIONS & SUMMARY Performance Series 1 was performed to investigate the response of the device in real, long crested, sea states. The following conclusions can be drawn:
As with the verification tests, visual inspection provided generally positive results. Relative angles were less consistent than the regular case (as would be expected) and a
drop off in yield should be expected over the regular wave case. The constant down wave pitch of the spar was less noticeable than in the regular wave
case, although it was difficult to say if there was any substantive improvement in the dynamic pitch response of the spar.
In general the alignment of the device with the waves seemed good. There was little indication of unwarranted yaw motions or a tendency to align other than into the waves.
Both the spar and the float appeared well balanced and the relative sizes/ weights appeared to be about correct.
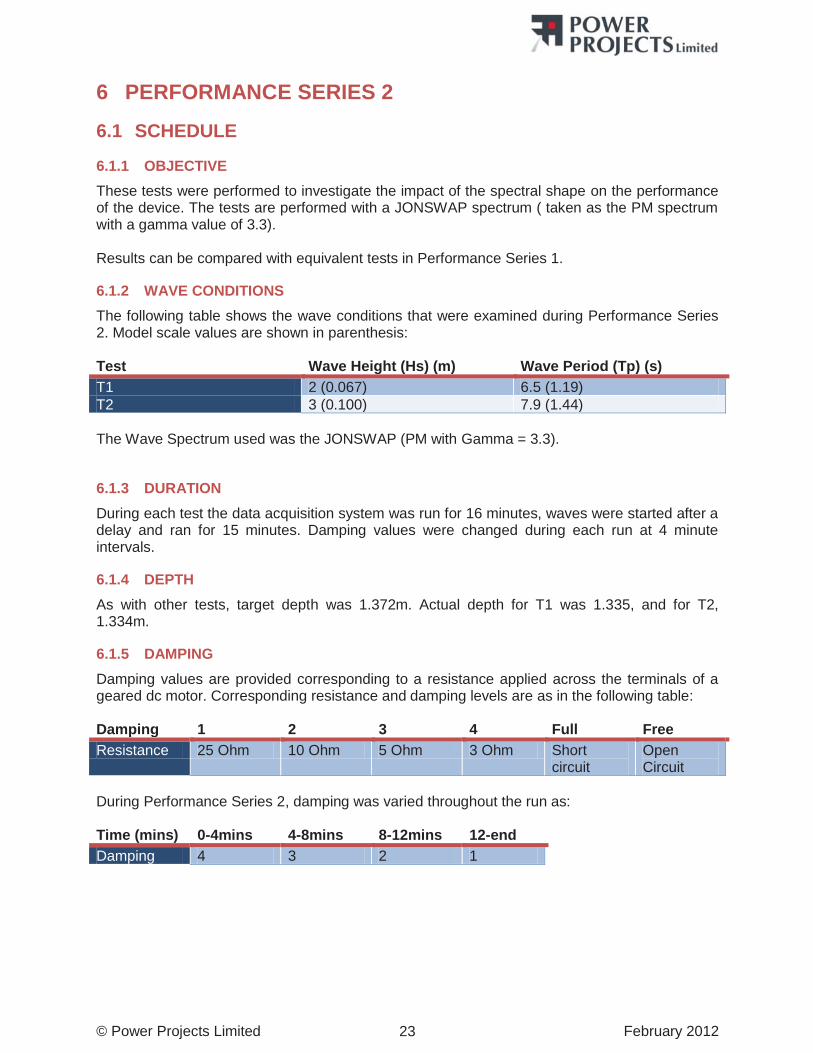
© Power Projects Limited February 2012 23
6 PERFORMANCE SERIES 2
6.1 SCHEDULE
6.1.1 OBJECTIVE These tests were performed to investigate the impact of the spectral shape on the performance of the device. The tests are performed with a JONSWAP spectrum ( taken as the PM spectrum with a gamma value of 3.3). Results can be compared with equivalent tests in Performance Series 1.
6.1.2 WAVE CONDITIONS The following table shows the wave conditions that were examined during Performance Series 2. Model scale values are shown in parenthesis: Test Wave Height (Hs) (m) Wave Period (Tp) (s) T1 2 (0.067) 6.5 (1.19) T2 3 (0.100) 7.9 (1.44) The Wave Spectrum used was the JONSWAP (PM with Gamma = 3.3).
6.1.3 DURATION During each test the data acquisition system was run for 16 minutes, waves were started after a delay and ran for 15 minutes. Damping values were changed during each run at 4 minute intervals.
6.1.4 DEPTH As with other tests, target depth was 1.372m. Actual depth for T1 was 1.335, and for T2, 1.334m.
6.1.5 DAMPING Damping values are provided corresponding to a resistance applied across the terminals of a geared dc motor. Corresponding resistance and damping levels are as in the following table: Damping 1 2 3 4 Full Free Resistance 25 Ohm 10 Ohm 5 Ohm 3 Ohm Short
circuit Open Circuit
During Performance Series 2, damping was varied throughout the run as: Time (mins) 0-4mins 4-8mins 8-12mins 12-end Damping 4 3 2 1
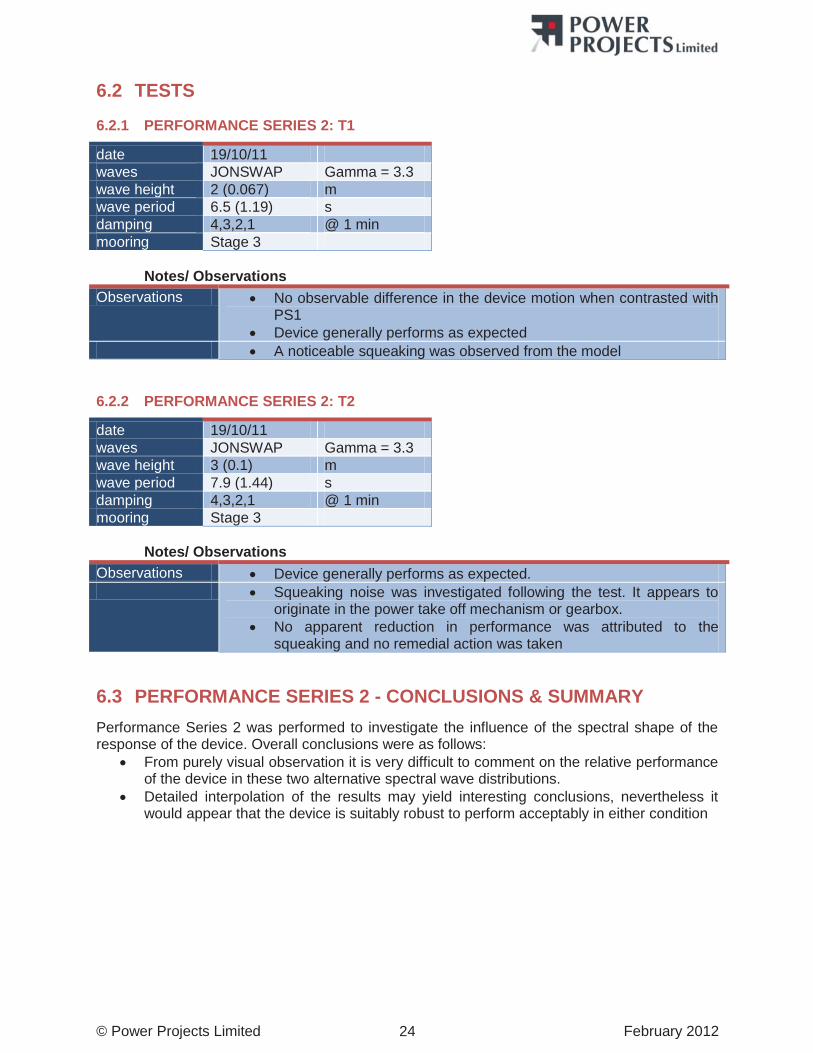
© Power Projects Limited February 2012 24
6.2 TESTS
6.2.1 PERFORMANCE SERIES 2: T1
date 19/10/11 waves JONSWAP Gamma = 3.3 wave height 2 (0.067) m wave period 6.5 (1.19) s damping 4,3,2,1 @ 1 min mooring Stage 3
Notes/ Observations Observations No observable difference in the device motion when contrasted with
PS1 Device generally performs as expected
A noticeable squeaking was observed from the model
6.2.2 PERFORMANCE SERIES 2: T2
date 19/10/11 waves JONSWAP Gamma = 3.3 wave height 3 (0.1) m wave period 7.9 (1.44) s damping 4,3,2,1 @ 1 min mooring Stage 3
Notes/ Observations Observations Device generally performs as expected. Squeaking noise was investigated following the test. It appears to
originate in the power take off mechanism or gearbox. No apparent reduction in performance was attributed to the
squeaking and no remedial action was taken
6.3 PERFORMANCE SERIES 2 - CONCLUSIONS & SUMMARY Performance Series 2 was performed to investigate the influence of the spectral shape of the response of the device. Overall conclusions were as follows:
From purely visual observation it is very difficult to comment on the relative performance of the device in these two alternative spectral wave distributions.
Detailed interpolation of the results may yield interesting conclusions, nevertheless it would appear that the device is suitably robust to perform acceptably in either condition
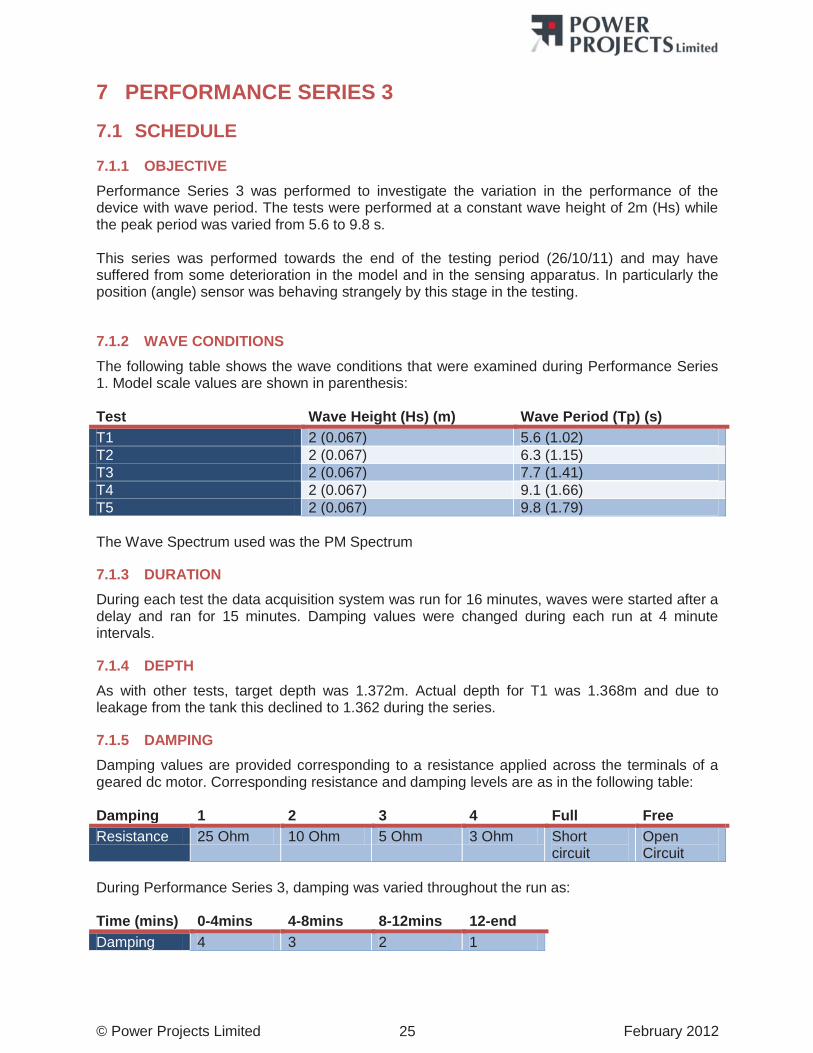
© Power Projects Limited February 2012 25
7 PERFORMANCE SERIES 3
7.1 SCHEDULE
7.1.1 OBJECTIVE Performance Series 3 was performed to investigate the variation in the performance of the device with wave period. The tests were performed at a constant wave height of 2m (Hs) while the peak period was varied from 5.6 to 9.8 s. This series was performed towards the end of the testing period (26/10/11) and may have suffered from some deterioration in the model and in the sensing apparatus. In particularly the position (angle) sensor was behaving strangely by this stage in the testing.
7.1.2 WAVE CONDITIONS The following table shows the wave conditions that were examined during Performance Series 1. Model scale values are shown in parenthesis: Test Wave Height (Hs) (m) Wave Period (Tp) (s) T1 2 (0.067) 5.6 (1.02) T2 2 (0.067) 6.3 (1.15) T3 2 (0.067) 7.7 (1.41) T4 2 (0.067) 9.1 (1.66) T5 2 (0.067) 9.8 (1.79) The Wave Spectrum used was the PM Spectrum
7.1.3 DURATION During each test the data acquisition system was run for 16 minutes, waves were started after a delay and ran for 15 minutes. Damping values were changed during each run at 4 minute intervals.
7.1.4 DEPTH As with other tests, target depth was 1.372m. Actual depth for T1 was 1.368m and due to leakage from the tank this declined to 1.362 during the series.
7.1.5 DAMPING Damping values are provided corresponding to a resistance applied across the terminals of a geared dc motor. Corresponding resistance and damping levels are as in the following table: Damping 1 2 3 4 Full Free Resistance 25 Ohm 10 Ohm 5 Ohm 3 Ohm Short
circuit Open Circuit
During Performance Series 3, damping was varied throughout the run as: Time (mins) 0-4mins 4-8mins 8-12mins 12-end Damping 4 3 2 1
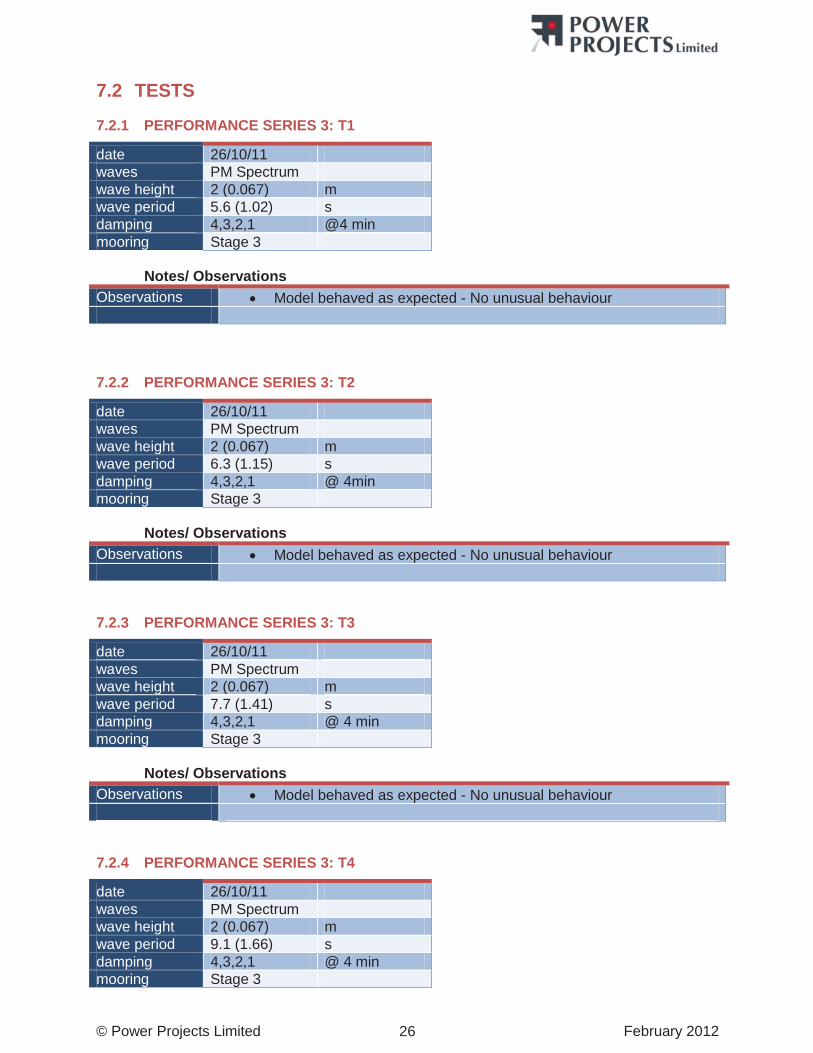
© Power Projects Limited February 2012 26
7.2 TESTS
7.2.1 PERFORMANCE SERIES 3: T1
date 26/10/11 waves PM Spectrum wave height 2 (0.067) m wave period 5.6 (1.02) s damping 4,3,2,1 @4 min mooring Stage 3
Notes/ Observations Observations Model behaved as expected - No unusual behaviour
7.2.2 PERFORMANCE SERIES 3: T2
date 26/10/11 waves PM Spectrum wave height 2 (0.067) m wave period 6.3 (1.15) s damping 4,3,2,1 @ 4min mooring Stage 3
Notes/ Observations Observations Model behaved as expected - No unusual behaviour
7.2.3 PERFORMANCE SERIES 3: T3
date 26/10/11 waves PM Spectrum wave height 2 (0.067) m wave period 7.7 (1.41) s damping 4,3,2,1 @ 4 min mooring Stage 3
Notes/ Observations Observations Model behaved as expected - No unusual behaviour
7.2.4 PERFORMANCE SERIES 3: T4
date 26/10/11 waves PM Spectrum wave height 2 (0.067) m wave period 9.1 (1.66) s damping 4,3,2,1 @ 4 min mooring Stage 3
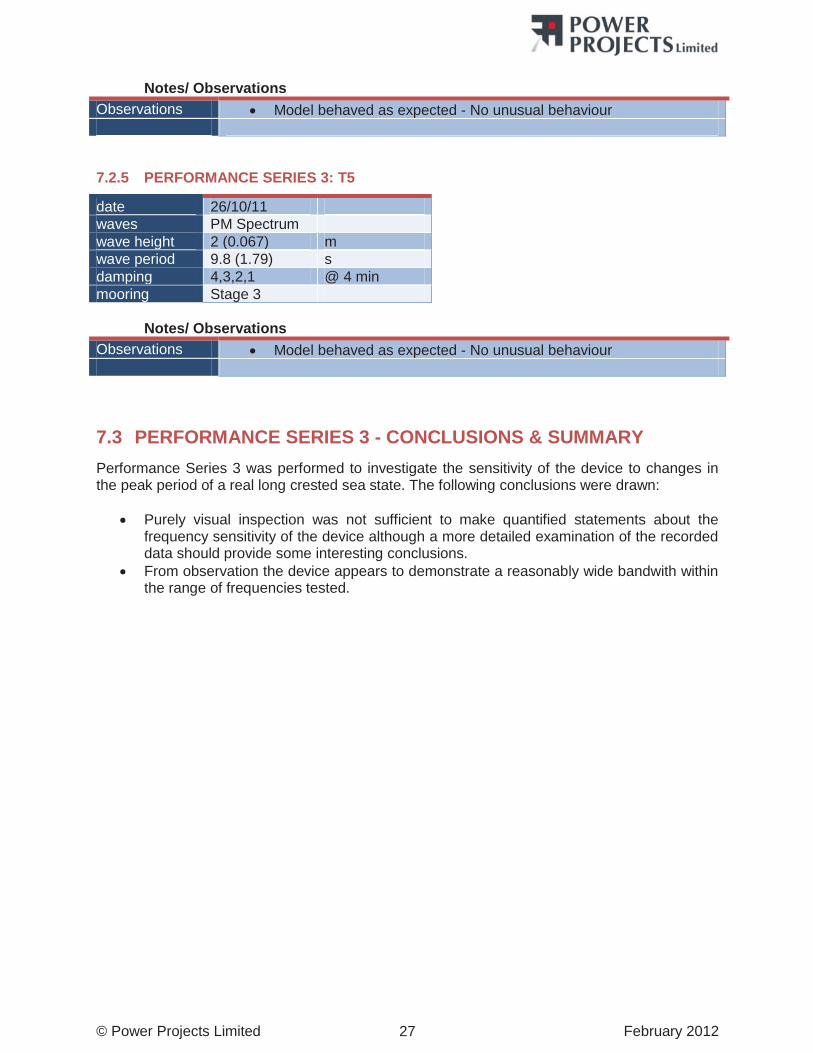
© Power Projects Limited February 2012 27
Notes/ Observations Observations Model behaved as expected - No unusual behaviour
7.2.5 PERFORMANCE SERIES 3: T5
date 26/10/11 waves PM Spectrum wave height 2 (0.067) m wave period 9.8 (1.79) s damping 4,3,2,1 @ 4 min mooring Stage 3
Notes/ Observations Observations Model behaved as expected - No unusual behaviour
7.3 PERFORMANCE SERIES 3 - CONCLUSIONS & SUMMARY Performance Series 3 was performed to investigate the sensitivity of the device to changes in the peak period of a real long crested sea state. The following conclusions were drawn:
Purely visual inspection was not sufficient to make quantified statements about the frequency sensitivity of the device although a more detailed examination of the recorded data should provide some interesting conclusions.
From observation the device appears to demonstrate a reasonably wide bandwith within the range of frequencies tested.
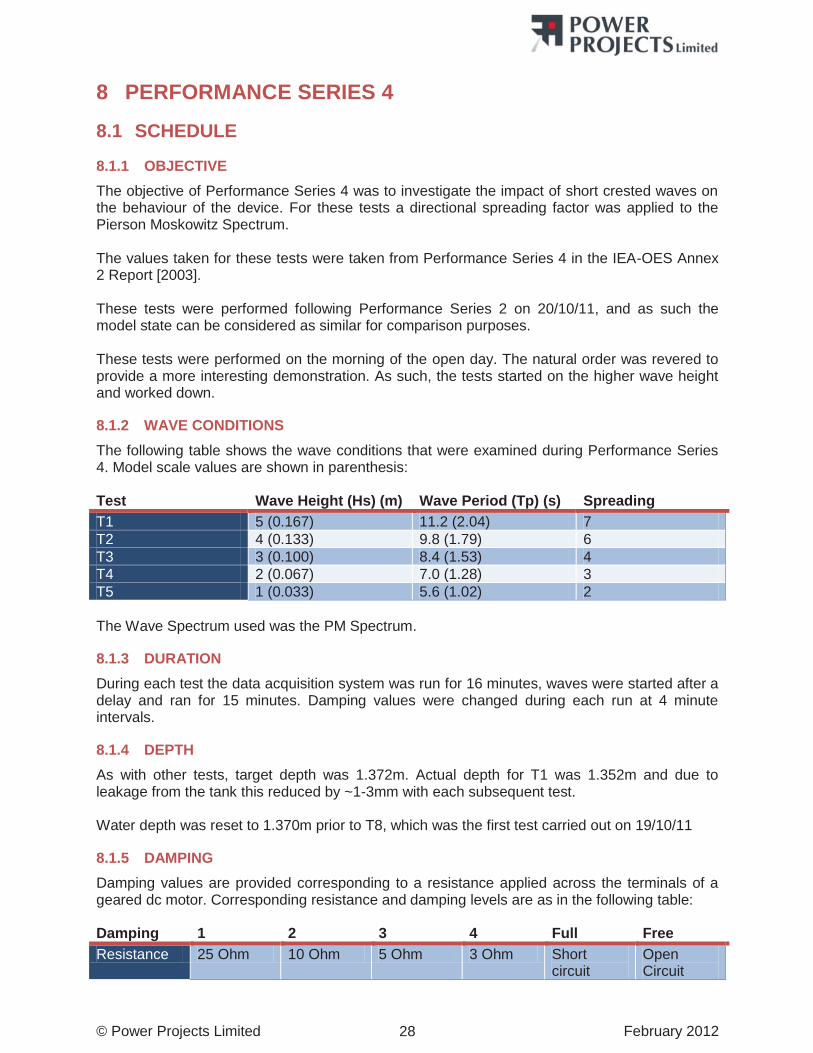
© Power Projects Limited February 2012 28
8 PERFORMANCE SERIES 4
8.1 SCHEDULE
8.1.1 OBJECTIVE The objective of Performance Series 4 was to investigate the impact of short crested waves on the behaviour of the device. For these tests a directional spreading factor was applied to the Pierson Moskowitz Spectrum. The values taken for these tests were taken from Performance Series 4 in the IEA-OES Annex 2 Report [2003]. These tests were performed following Performance Series 2 on 20/10/11, and as such the model state can be considered as similar for comparison purposes. These tests were performed on the morning of the open day. The natural order was revered to provide a more interesting demonstration. As such, the tests started on the higher wave height and worked down.
8.1.2 WAVE CONDITIONS The following table shows the wave conditions that were examined during Performance Series 4. Model scale values are shown in parenthesis: Test Wave Height (Hs) (m) Wave Period (Tp) (s) Spreading T1 5 (0.167) 11.2 (2.04) 7 T2 4 (0.133) 9.8 (1.79) 6 T3 3 (0.100) 8.4 (1.53) 4 T4 2 (0.067) 7.0 (1.28) 3 T5 1 (0.033) 5.6 (1.02) 2 The Wave Spectrum used was the PM Spectrum.
8.1.3 DURATION During each test the data acquisition system was run for 16 minutes, waves were started after a delay and ran for 15 minutes. Damping values were changed during each run at 4 minute intervals.
8.1.4 DEPTH As with other tests, target depth was 1.372m. Actual depth for T1 was 1.352m and due to leakage from the tank this reduced by ~1-3mm with each subsequent test. Water depth was reset to 1.370m prior to T8, which was the first test carried out on 19/10/11
8.1.5 DAMPING Damping values are provided corresponding to a resistance applied across the terminals of a geared dc motor. Corresponding resistance and damping levels are as in the following table: Damping 1 2 3 4 Full Free Resistance 25 Ohm 10 Ohm 5 Ohm 3 Ohm Short
circuitOpen Circuit
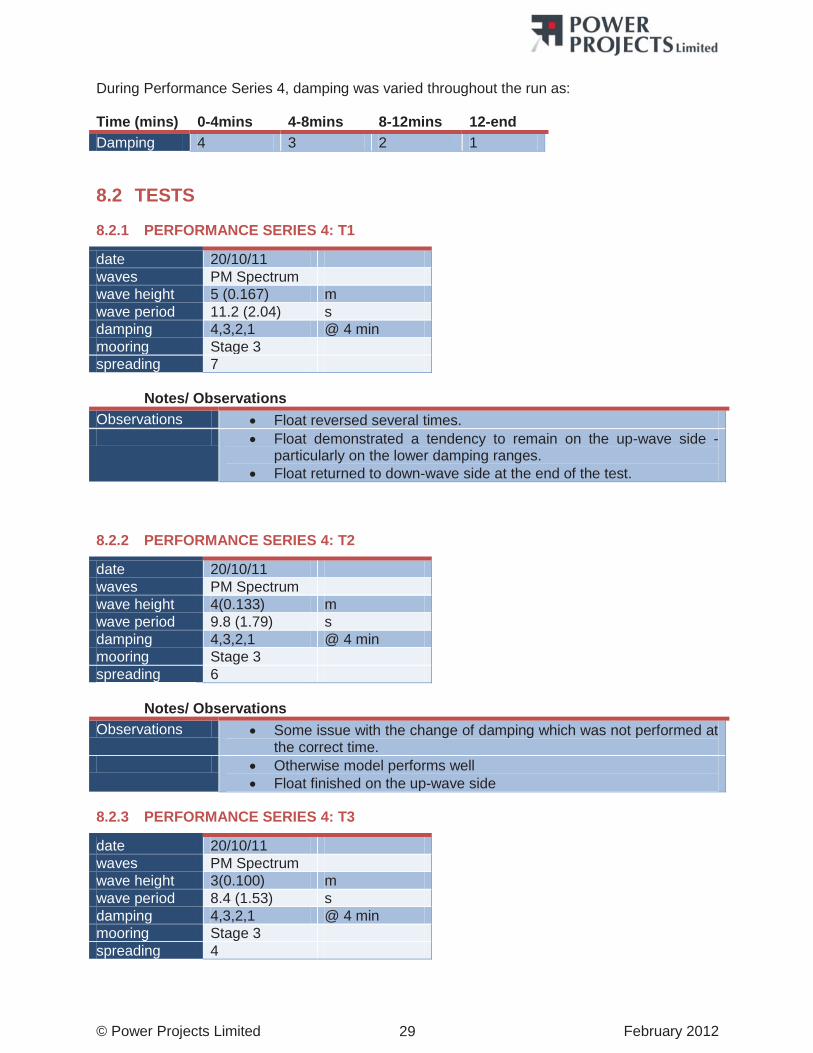
© Power Projects Limited February 2012 29
During Performance Series 4, damping was varied throughout the run as: Time (mins) 0-4mins 4-8mins 8-12mins 12-end Damping 4 3 2 1
8.2 TESTS
8.2.1 PERFORMANCE SERIES 4: T1
date 20/10/11 waves PM Spectrum wave height 5 (0.167) m wave period 11.2 (2.04) s damping 4,3,2,1 @ 4 min mooring Stage 3 spreading 7
Notes/ Observations Observations Float reversed several times. Float demonstrated a tendency to remain on the up-wave side -
particularly on the lower damping ranges. Float returned to down-wave side at the end of the test.
8.2.2 PERFORMANCE SERIES 4: T2
date 20/10/11 waves PM Spectrum wave height 4(0.133) m wave period 9.8 (1.79) s damping 4,3,2,1 @ 4 min mooring Stage 3 spreading 6
Notes/ Observations Observations Some issue with the change of damping which was not performed at
the correct time. Otherwise model performs well
Float finished on the up-wave side
8.2.3 PERFORMANCE SERIES 4: T3
date 20/10/11 waves PM Spectrum wave height 3(0.100) m wave period 8.4 (1.53) s damping 4,3,2,1 @ 4 min mooring Stage 3 spreading 4
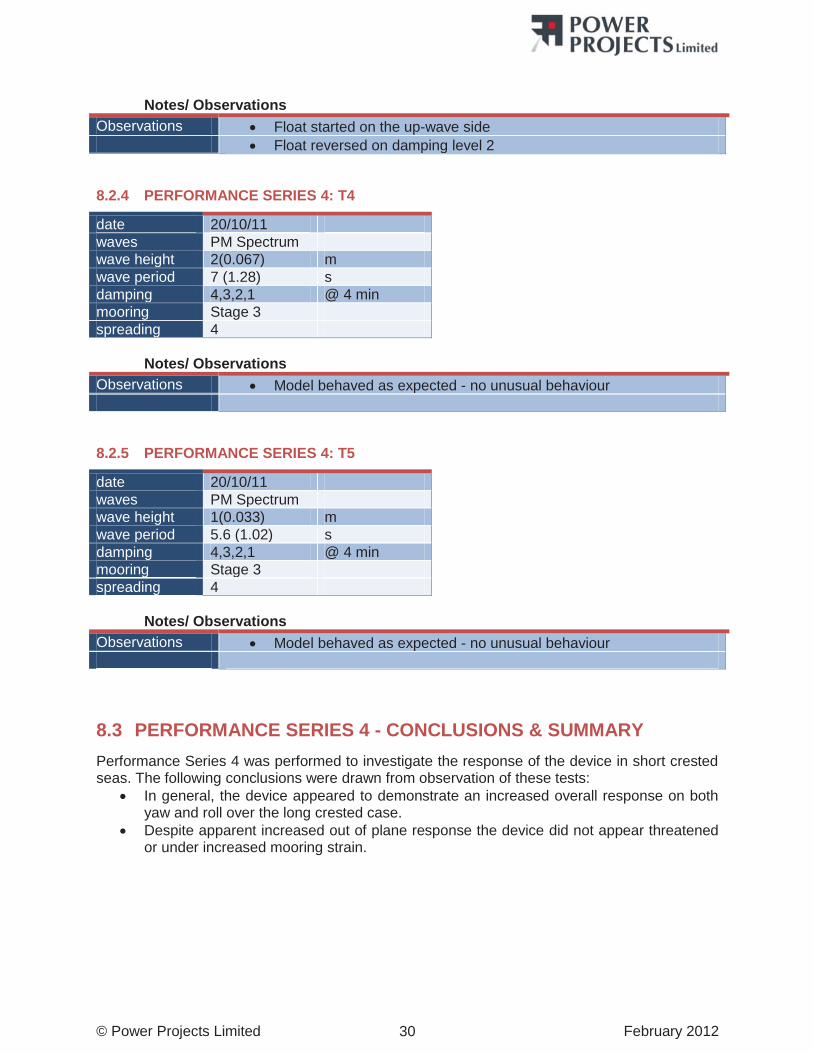
© Power Projects Limited February 2012 30
Notes/ Observations
Observations Float started on the up-wave side Float reversed on damping level 2
8.2.4 PERFORMANCE SERIES 4: T4
date 20/10/11 waves PM Spectrum wave height 2(0.067) m wave period 7 (1.28) s damping 4,3,2,1 @ 4 min mooring Stage 3 spreading 4
Notes/ Observations Observations Model behaved as expected - no unusual behaviour
8.2.5 PERFORMANCE SERIES 4: T5
date 20/10/11 waves PM Spectrum wave height 1(0.033) m wave period 5.6 (1.02) s damping 4,3,2,1 @ 4 min mooring Stage 3 spreading 4
Notes/ Observations Observations Model behaved as expected - no unusual behaviour
8.3 PERFORMANCE SERIES 4 - CONCLUSIONS & SUMMARY Performance Series 4 was performed to investigate the response of the device in short crested seas. The following conclusions were drawn from observation of these tests:
In general, the device appeared to demonstrate an increased overall response on both yaw and roll over the long crested case.
Despite apparent increased out of plane response the device did not appear threatened or under increased mooring strain.
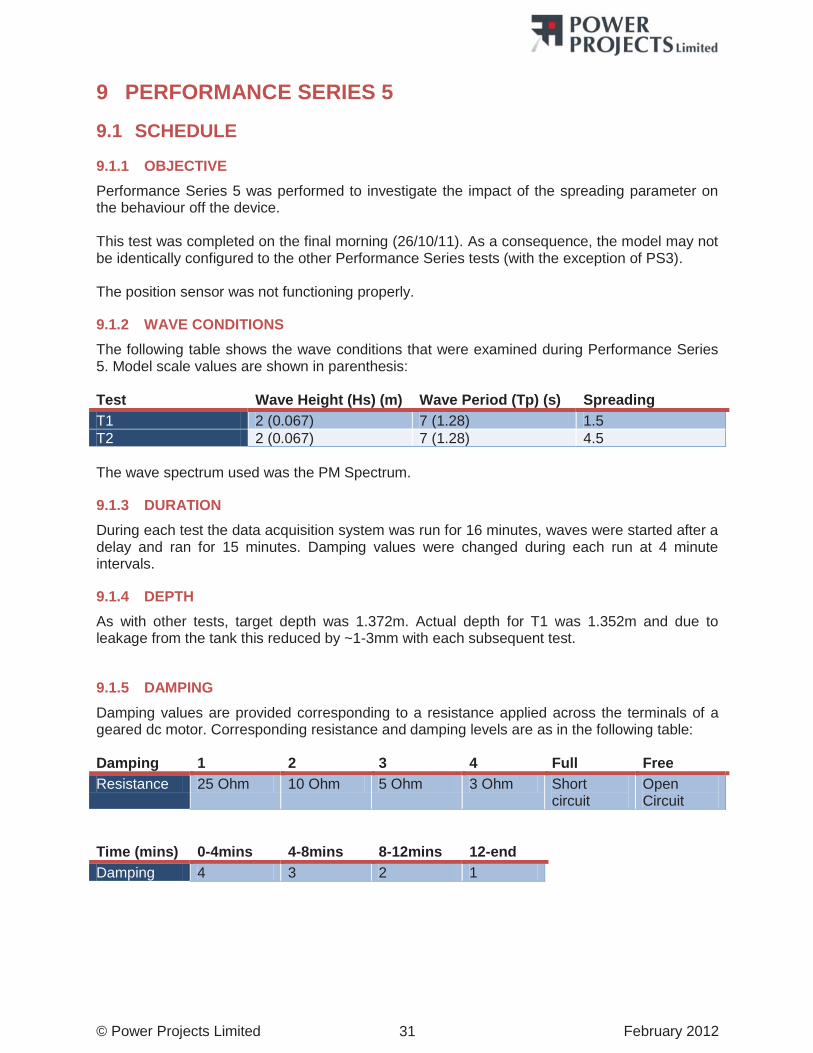
© Power Projects Limited February 2012 31
9 PERFORMANCE SERIES 5
9.1 SCHEDULE
9.1.1 OBJECTIVE Performance Series 5 was performed to investigate the impact of the spreading parameter on the behaviour off the device. This test was completed on the final morning (26/10/11). As a consequence, the model may not be identically configured to the other Performance Series tests (with the exception of PS3). The position sensor was not functioning properly.
9.1.2 WAVE CONDITIONS The following table shows the wave conditions that were examined during Performance Series 5. Model scale values are shown in parenthesis: Test Wave Height (Hs) (m) Wave Period (Tp) (s) Spreading T1 2 (0.067) 7 (1.28) 1.5 T2 2 (0.067) 7 (1.28) 4.5 The wave spectrum used was the PM Spectrum.
9.1.3 DURATION During each test the data acquisition system was run for 16 minutes, waves were started after a delay and ran for 15 minutes. Damping values were changed during each run at 4 minute intervals.
9.1.4 DEPTH As with other tests, target depth was 1.372m. Actual depth for T1 was 1.352m and due to leakage from the tank this reduced by ~1-3mm with each subsequent test.
9.1.5 DAMPING Damping values are provided corresponding to a resistance applied across the terminals of a geared dc motor. Corresponding resistance and damping levels are as in the following table: Damping 1 2 3 4 Full Free Resistance 25 Ohm 10 Ohm 5 Ohm 3 Ohm Short
circuit Open Circuit
Time (mins) 0-4mins 4-8mins 8-12mins 12-end Damping 4 3 2 1
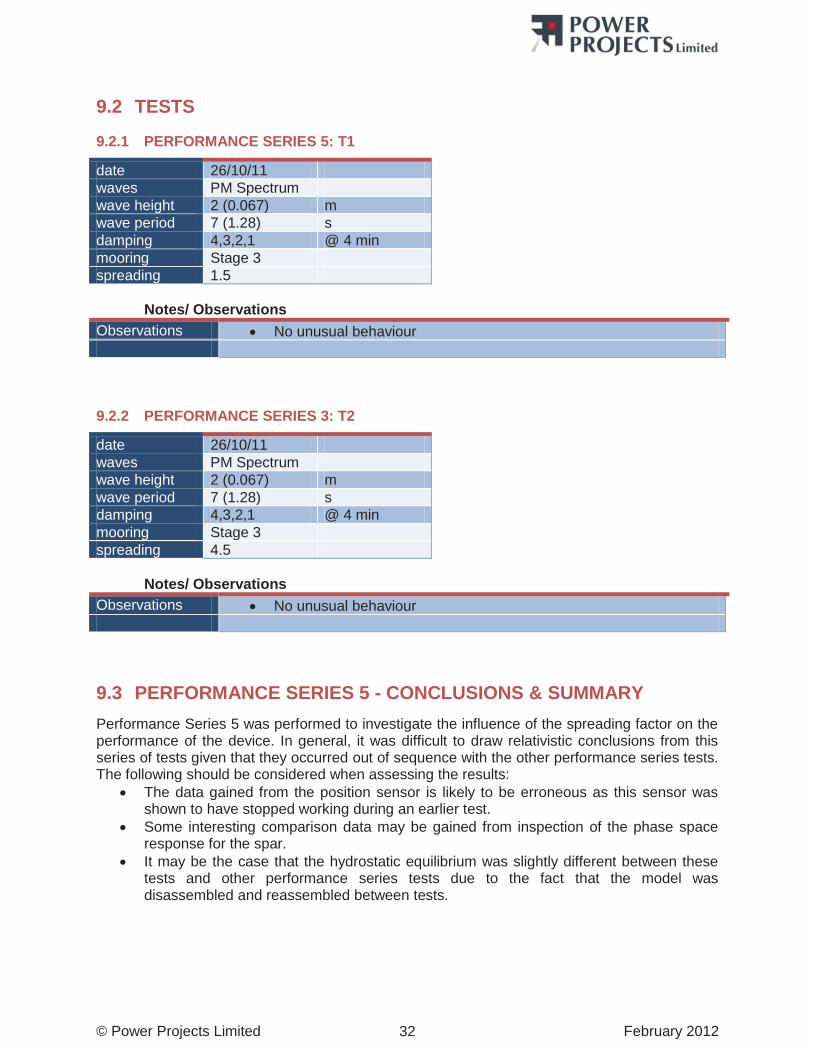
© Power Projects Limited February 2012 32
9.2 TESTS
9.2.1 PERFORMANCE SERIES 5: T1
date 26/10/11 waves PM Spectrum wave height 2 (0.067) m wave period 7 (1.28) s damping 4,3,2,1 @ 4 min mooring Stage 3 spreading 1.5
Notes/ Observations Observations No unusual behaviour
9.2.2 PERFORMANCE SERIES 3: T2
date 26/10/11 waves PM Spectrum wave height 2 (0.067) m wave period 7 (1.28) s damping 4,3,2,1 @ 4 min mooring Stage 3 spreading 4.5
Notes/ Observations Observations No unusual behaviour
9.3 PERFORMANCE SERIES 5 - CONCLUSIONS & SUMMARY Performance Series 5 was performed to investigate the influence of the spreading factor on the performance of the device. In general, it was difficult to draw relativistic conclusions from this series of tests given that they occurred out of sequence with the other performance series tests. The following should be considered when assessing the results:
The data gained from the position sensor is likely to be erroneous as this sensor was shown to have stopped working during an earlier test.
Some interesting comparison data may be gained from inspection of the phase space response for the spar.
It may be the case that the hydrostatic equilibrium was slightly different between these tests and other performance series tests due to the fact that the model was disassembled and reassembled between tests.
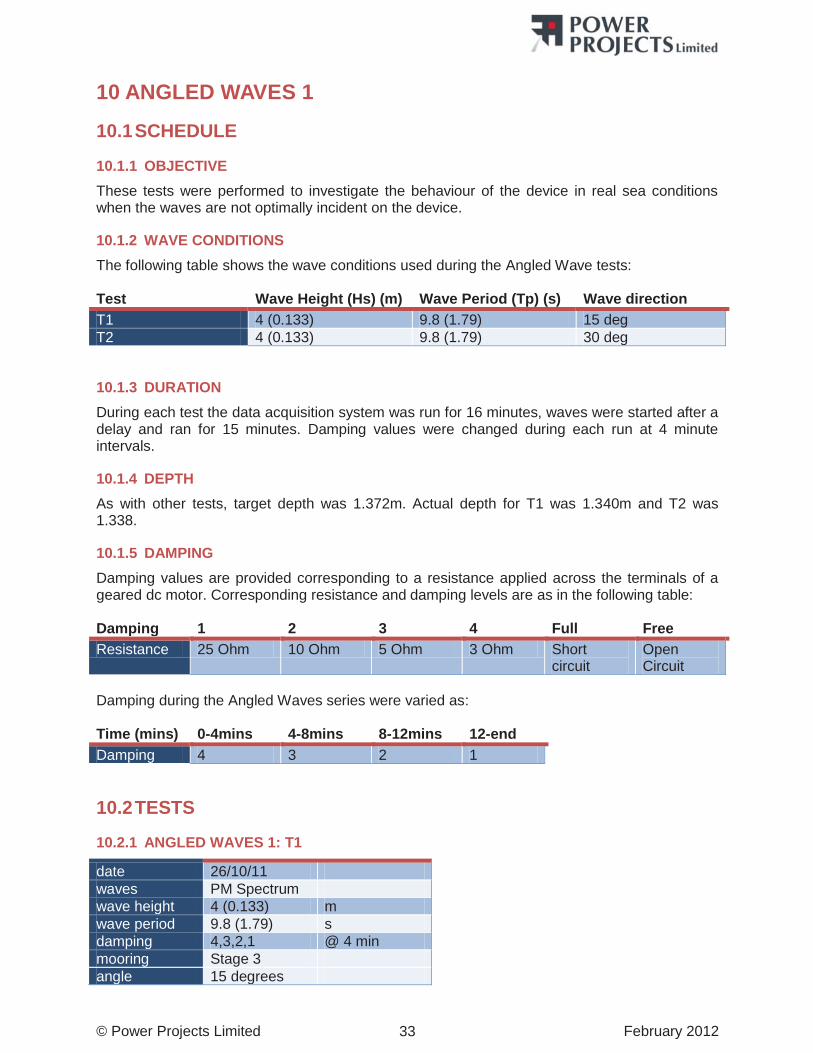
© Power Projects Limited February 2012 33
10 ANGLED WAVES 1
10.1 SCHEDULE
10.1.1 OBJECTIVE These tests were performed to investigate the behaviour of the device in real sea conditions when the waves are not optimally incident on the device.
10.1.2 WAVE CONDITIONS The following table shows the wave conditions used during the Angled Wave tests: Test Wave Height (Hs) (m) Wave Period (Tp) (s) Wave direction T1 4 (0.133) 9.8 (1.79) 15 deg T2 4 (0.133) 9.8 (1.79) 30 deg
10.1.3 DURATION During each test the data acquisition system was run for 16 minutes, waves were started after a delay and ran for 15 minutes. Damping values were changed during each run at 4 minute intervals.
10.1.4 DEPTH As with other tests, target depth was 1.372m. Actual depth for T1 was 1.340m and T2 was 1.338.
10.1.5 DAMPING Damping values are provided corresponding to a resistance applied across the terminals of a geared dc motor. Corresponding resistance and damping levels are as in the following table: Damping 1 2 3 4 Full Free Resistance 25 Ohm 10 Ohm 5 Ohm 3 Ohm Short
circuit Open Circuit
Damping during the Angled Waves series were varied as: Time (mins) 0-4mins 4-8mins 8-12mins 12-end Damping 4 3 2 1
10.2 TESTS
10.2.1 ANGLED WAVES 1: T1
date 26/10/11 waves PM Spectrum wave height 4 (0.133) m wave period 9.8 (1.79) s damping 4,3,2,1 @ 4 min mooring Stage 3 angle 15 degrees
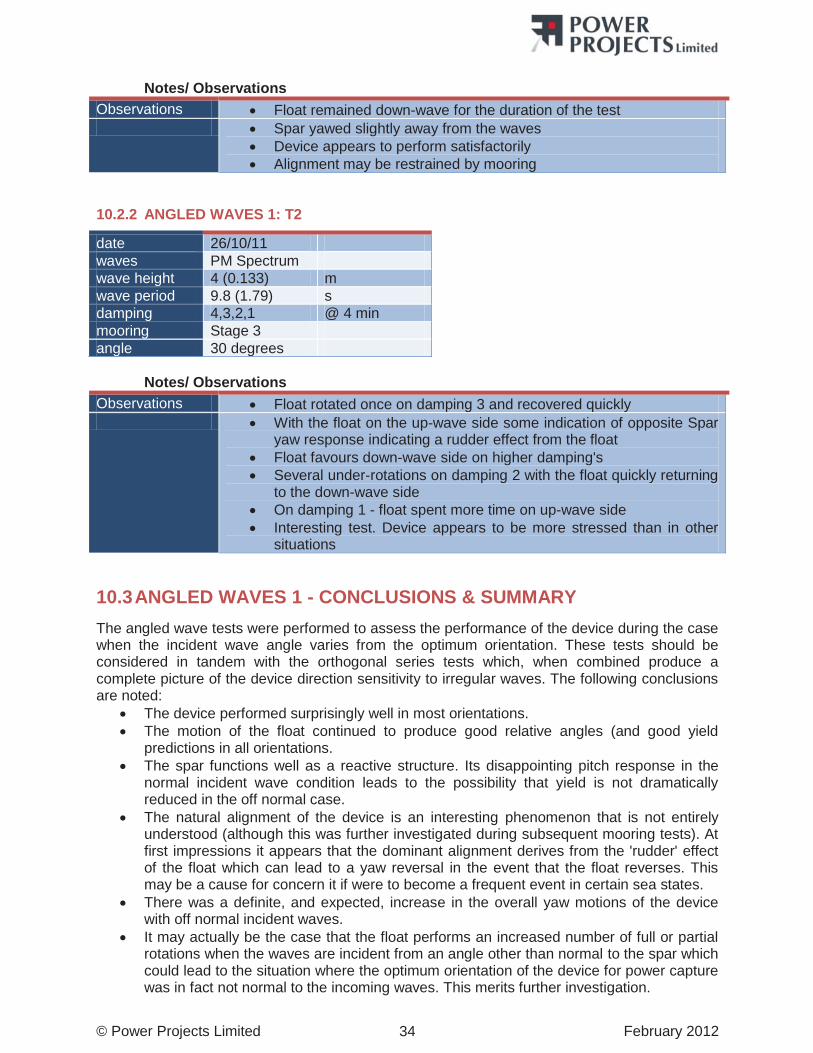
© Power Projects Limited February 2012 34
Notes/ Observations Observations Float remained down-wave for the duration of the test Spar yawed slightly away from the waves
Device appears to perform satisfactorily Alignment may be restrained by mooring
10.2.2 ANGLED WAVES 1: T2
date 26/10/11 waves PM Spectrum wave height 4 (0.133) m wave period 9.8 (1.79) s damping 4,3,2,1 @ 4 min mooring Stage 3 angle 30 degrees
Notes/ Observations Observations Float rotated once on damping 3 and recovered quickly With the float on the up-wave side some indication of opposite Spar
yaw response indicating a rudder effect from the float Float favours down-wave side on higher damping's Several under-rotations on damping 2 with the float quickly returning
to the down-wave side On damping 1 - float spent more time on up-wave side Interesting test. Device appears to be more stressed than in other
situations
10.3 ANGLED WAVES 1 - CONCLUSIONS & SUMMARY The angled wave tests were performed to assess the performance of the device during the case when the incident wave angle varies from the optimum orientation. These tests should be considered in tandem with the orthogonal series tests which, when combined produce a complete picture of the device direction sensitivity to irregular waves. The following conclusions are noted:
The device performed surprisingly well in most orientations. The motion of the float continued to produce good relative angles (and good yield
predictions in all orientations. The spar functions well as a reactive structure. Its disappointing pitch response in the
normal incident wave condition leads to the possibility that yield is not dramatically reduced in the off normal case.
The natural alignment of the device is an interesting phenomenon that is not entirely understood (although this was further investigated during subsequent mooring tests). At first impressions it appears that the dominant alignment derives from the 'rudder' effect of the float which can lead to a yaw reversal in the event that the float reverses. This may be a cause for concern it if were to become a frequent event in certain sea states.
There was a definite, and expected, increase in the overall yaw motions of the device with off normal incident waves.
It may actually be the case that the float performs an increased number of full or partial rotations when the waves are incident from an angle other than normal to the spar which could lead to the situation where the optimum orientation of the device for power capture was in fact not normal to the incoming waves. This merits further investigation.
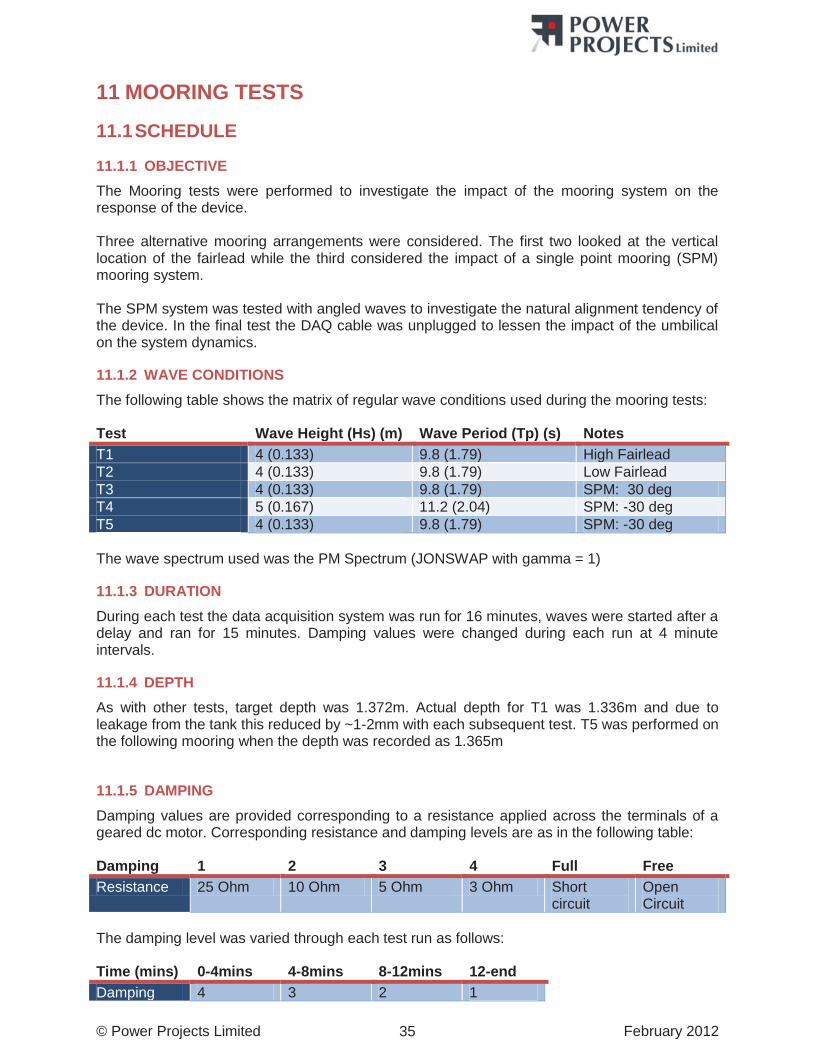
© Power Projects Limited February 2012 35
11 MOORING TESTS
11.1 SCHEDULE
11.1.1 OBJECTIVE The Mooring tests were performed to investigate the impact of the mooring system on the response of the device. Three alternative mooring arrangements were considered. The first two looked at the vertical location of the fairlead while the third considered the impact of a single point mooring (SPM) mooring system. The SPM system was tested with angled waves to investigate the natural alignment tendency of the device. In the final test the DAQ cable was unplugged to lessen the impact of the umbilical on the system dynamics.
11.1.2 WAVE CONDITIONS The following table shows the matrix of regular wave conditions used during the mooring tests: Test Wave Height (Hs) (m) Wave Period (Tp) (s) Notes T1 4 (0.133) 9.8 (1.79) High Fairlead T2 4 (0.133) 9.8 (1.79) Low Fairlead T3 4 (0.133) 9.8 (1.79) SPM: 30 deg T4 5 (0.167) 11.2 (2.04) SPM: -30 deg T5 4 (0.133) 9.8 (1.79) SPM: -30 deg The wave spectrum used was the PM Spectrum (JONSWAP with gamma = 1)
11.1.3 DURATION During each test the data acquisition system was run for 16 minutes, waves were started after a delay and ran for 15 minutes. Damping values were changed during each run at 4 minute intervals.
11.1.4 DEPTH As with other tests, target depth was 1.372m. Actual depth for T1 was 1.336m and due to leakage from the tank this reduced by ~1-2mm with each subsequent test. T5 was performed on the following mooring when the depth was recorded as 1.365m
11.1.5 DAMPING Damping values are provided corresponding to a resistance applied across the terminals of a geared dc motor. Corresponding resistance and damping levels are as in the following table: Damping 1 2 3 4 Full Free Resistance 25 Ohm 10 Ohm 5 Ohm 3 Ohm Short
circuit Open Circuit
The damping level was varied through each test run as follows: Time (mins) 0-4mins 4-8mins 8-12mins 12-end Damping 4 3 2 1
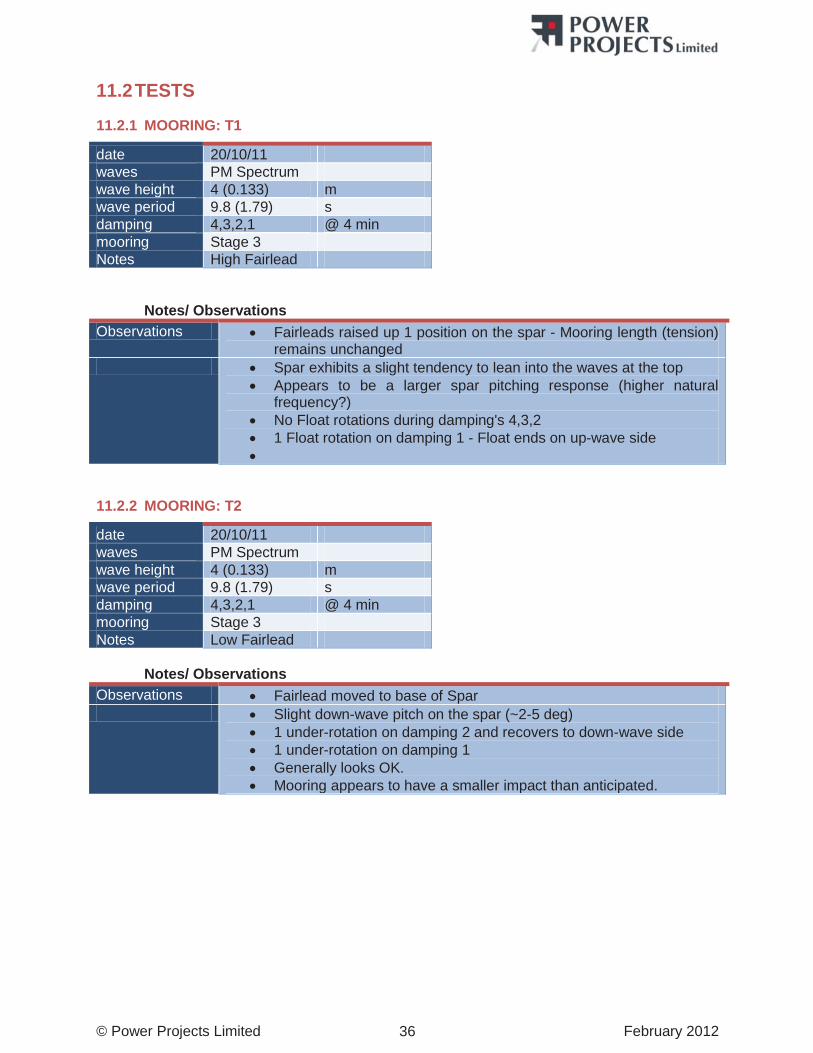
© Power Projects Limited February 2012 36
11.2 TESTS
11.2.1 MOORING: T1
date 20/10/11 waves PM Spectrum wave height 4 (0.133) m wave period 9.8 (1.79) s damping 4,3,2,1 @ 4 min mooring Stage 3 Notes High Fairlead
Notes/ Observations Observations Fairleads raised up 1 position on the spar - Mooring length (tension)
remains unchanged Spar exhibits a slight tendency to lean into the waves at the top
Appears to be a larger spar pitching response (higher natural frequency?)
No Float rotations during damping's 4,3,2 1 Float rotation on damping 1 - Float ends on up-wave side
11.2.2 MOORING: T2
date 20/10/11 waves PM Spectrum wave height 4 (0.133) m wave period 9.8 (1.79) s damping 4,3,2,1 @ 4 min mooring Stage 3 Notes Low Fairlead
Notes/ Observations Observations Fairlead moved to base of Spar Slight down-wave pitch on the spar (~2-5 deg)
1 under-rotation on damping 2 and recovers to down-wave side 1 under-rotation on damping 1 Generally looks OK. Mooring appears to have a smaller impact than anticipated.
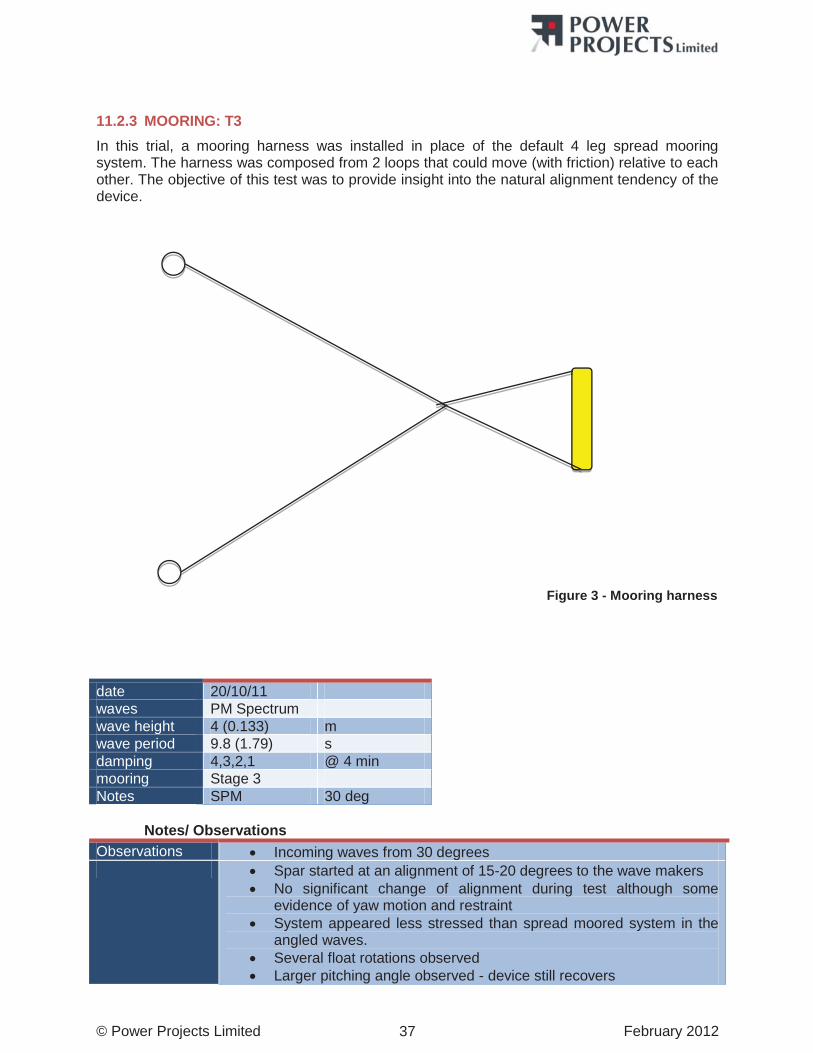
© Power Projects Limited February 2012 37
11.2.3 MOORING: T3 In this trial, a mooring harness was installed in place of the default 4 leg spread mooring system. The harness was composed from 2 loops that could move (with friction) relative to each other. The objective of this test was to provide insight into the natural alignment tendency of the device.
date 20/10/11 waves PM Spectrum wave height 4 (0.133) m wave period 9.8 (1.79) s damping 4,3,2,1 @ 4 min mooring Stage 3 Notes SPM 30 deg
Notes/ Observations Observations Incoming waves from 30 degrees Spar started at an alignment of 15-20 degrees to the wave makers
No significant change of alignment during test although some evidence of yaw motion and restraint
System appeared less stressed than spread moored system in the angled waves.
Several float rotations observed Larger pitching angle observed - device still recovers
Figure 3 - Mooring harness
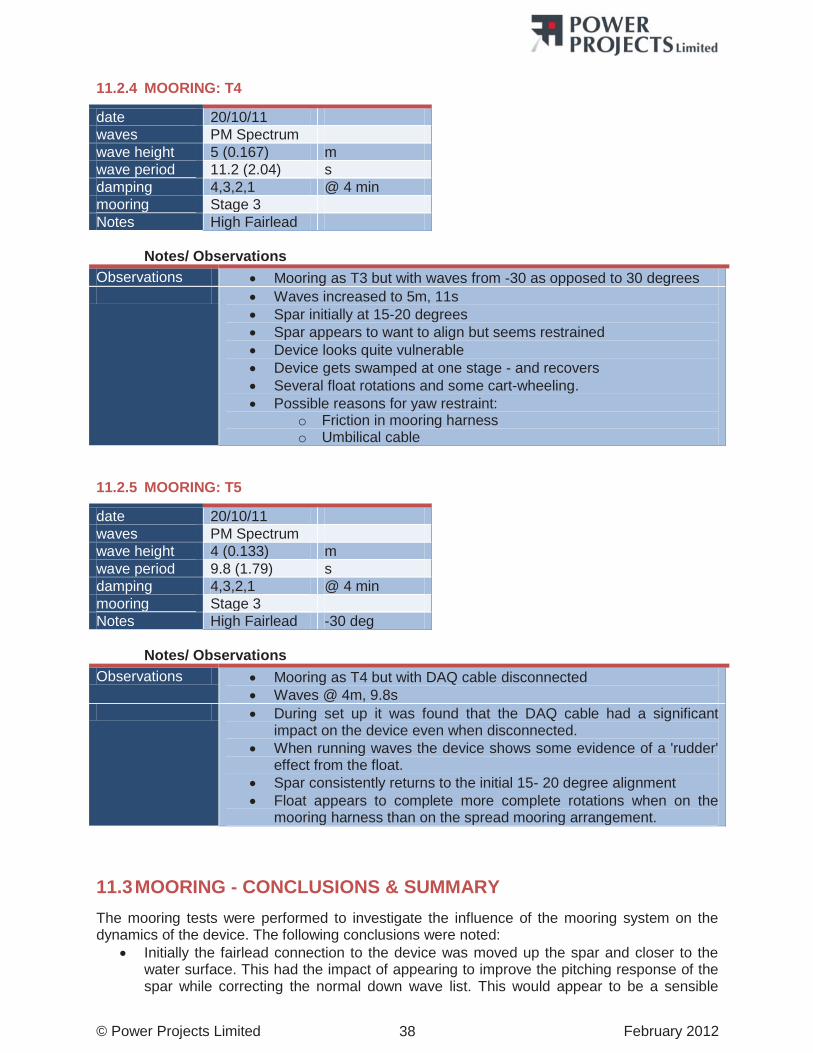
© Power Projects Limited February 2012 38
11.2.4 MOORING: T4
date 20/10/11 waves PM Spectrum wave height 5 (0.167) m wave period 11.2 (2.04) s damping 4,3,2,1 @ 4 min mooring Stage 3 Notes High Fairlead
Notes/ Observations Observations Mooring as T3 but with waves from -30 as opposed to 30 degrees Waves increased to 5m, 11s
Spar initially at 15-20 degrees Spar appears to want to align but seems restrained Device looks quite vulnerable Device gets swamped at one stage - and recovers Several float rotations and some cart-wheeling. Possible reasons for yaw restraint:
o Friction in mooring harness o Umbilical cable
11.2.5 MOORING: T5
date 20/10/11 waves PM Spectrum wave height 4 (0.133) m wave period 9.8 (1.79) s damping 4,3,2,1 @ 4 min mooring Stage 3 Notes High Fairlead -30 deg
Notes/ Observations Observations Mooring as T4 but with DAQ cable disconnected
Waves @ 4m, 9.8s During set up it was found that the DAQ cable had a significant
impact on the device even when disconnected. When running waves the device shows some evidence of a 'rudder'
effect from the float. Spar consistently returns to the initial 15- 20 degree alignment Float appears to complete more complete rotations when on the
mooring harness than on the spread mooring arrangement.
11.3 MOORING - CONCLUSIONS & SUMMARY The mooring tests were performed to investigate the influence of the mooring system on the dynamics of the device. The following conclusions were noted:
Initially the fairlead connection to the device was moved up the spar and closer to the water surface. This had the impact of appearing to improve the pitching response of the spar while correcting the normal down wave list. This would appear to be a sensible
© Power Projects Limited February 2012 39
modification to the full scale device which may have the further benefit of simplifying the installation procedure. However some caution is advised as it will tend to enforce a higher rotational centre on the spar which may show a tendency to convert to an increased surge mooring load in larger waves.
The device was also examined with the mooring located at the base of the spar with a relatively small impact on the overall dynamics. This confirms that the spar performs well as a reactive structure and any attempt to enhance the response through the action of the mooring system is likely to result mainly in an increased load on the fairleads.
The mooring harness demonstrated that the device can be moored with a simpler mooring arrangement than the spread system although the umbilical system will then be particularly exposed.
The device appears to align predominantly due to a rudder effect from the float although if the cable is off centre then the device will tend to 'hang' off the umbilical.
The overall implication may be that in these tests the mooring system had relatively little impact and the device was in fact more constrained by the data acquisition cable. This is a significant concern for the full scale device and the design of the power umbilical.

© Power Projects Limited February 2012 40
12 ORTHOGONAL TESTS
12.1 SCHEDULE
12.1.1 OBJECTIVE The Orthogonal tests were performed to specifically examine the response of the device when the incident waves were applied orthogonally to the spar or in-line with the rotational axis of the device. To perform these tests the model and the mooring system were rotated through 90 degrees. The symmetry of the mooring attachment points allowed this to be achieved without materially altering the overall mooring stiffness.
12.1.2 WAVE CONDITIONS The following table shows the matrix of regular wave conditions used during the orthogonal tests: Test Wave Height (Hs) (m) Wave Period (Tp) (s) Notes T1 3.5(0.117) 8 (1.46) Regular Waves T2 3.5(0.117) 8 (1.46) Repeat T1 T3 5 (0.167) 10 (1.83) Regular Waves T4 4 (0.133) 9.8 (1.79) PM Waves T5 4 (0.133) 9.8 (1.79) PM, 15 degs T6 4 (0.133) 9.8 (1.79) PM 30 degs T7 4 (0.133) 9.8 (1.79) Repeat T6
12.1.3 DURATION For the first three tests (regular waves) the data acquisition system was run for 5 minutes, waves were started after a delay and run for 4 minutes. For the remaining tests (irregular waves) the data acquisition system was run for 16 minutes, waves were started after a delay and ran for 15 minutes. Damping values were changed during each run at 4 minute intervals.
12.1.4 DEPTH As with other tests, target depth was 1.372m. Actual depth for T1 was 1.362m and due to leakage from the tank this reduced by ~1-3mm with each subsequent test.
12.1.5 DAMPING Damping values are provided corresponding to a resistance applied across the terminals of a geared dc motor. Corresponding resistance and damping levels are as in the following table: Damping 1 2 3 4 Full Free Resistance 25 Ohm 10 Ohm 5 Ohm 3 Ohm Short
circuit Open Circuit
For Tests 1-3 (regular waves), damping was varied as: Time (mins) 0-1 1-2 2-3 3 - 3.5 3.5 - 4 Damping 4 2 1 Full Free
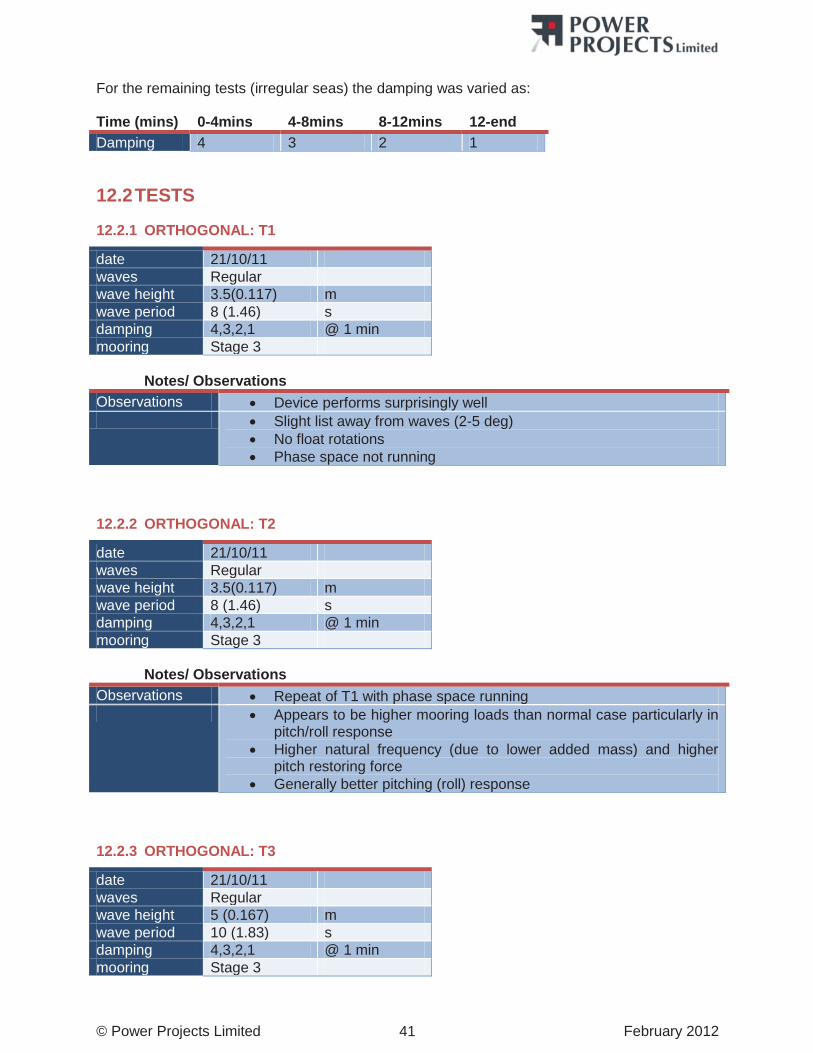
© Power Projects Limited February 2012 41
For the remaining tests (irregular seas) the damping was varied as: Time (mins) 0-4mins 4-8mins 8-12mins 12-end Damping 4 3 2 1
12.2 TESTS
12.2.1 ORTHOGONAL: T1
date 21/10/11 waves Regular wave height 3.5(0.117) m wave period 8 (1.46) s damping 4,3,2,1 @ 1 min mooring Stage 3
Notes/ Observations Observations Device performs surprisingly well Slight list away from waves (2-5 deg)
No float rotations Phase space not running
12.2.2 ORTHOGONAL: T2
date 21/10/11 waves Regular wave height 3.5(0.117) m wave period 8 (1.46) s damping 4,3,2,1 @ 1 min mooring Stage 3
Notes/ Observations Observations Repeat of T1 with phase space running Appears to be higher mooring loads than normal case particularly in
pitch/roll response Higher natural frequency (due to lower added mass) and higher
pitch restoring force Generally better pitching (roll) response
12.2.3 ORTHOGONAL: T3
date 21/10/11 waves Regular wave height 5 (0.167) m wave period 10 (1.83) s damping 4,3,2,1 @ 1 min mooring Stage 3
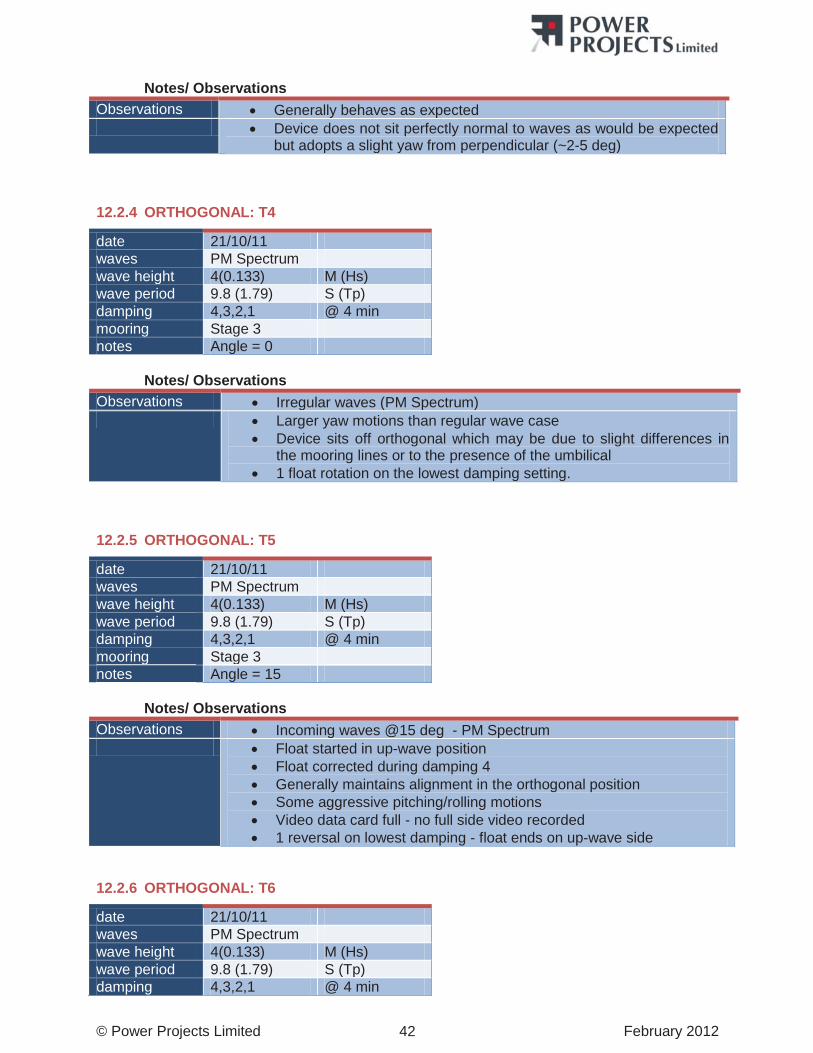
© Power Projects Limited February 2012 42
Notes/ Observations Observations Generally behaves as expected Device does not sit perfectly normal to waves as would be expected
but adopts a slight yaw from perpendicular (~2-5 deg)
12.2.4 ORTHOGONAL: T4
date 21/10/11 waves PM Spectrum wave height 4(0.133) M (Hs) wave period 9.8 (1.79) S (Tp) damping 4,3,2,1 @ 4 min mooring Stage 3 notes Angle = 0
Notes/ Observations Observations Irregular waves (PM Spectrum) Larger yaw motions than regular wave case
Device sits off orthogonal which may be due to slight differences in the mooring lines or to the presence of the umbilical
1 float rotation on the lowest damping setting.
12.2.5 ORTHOGONAL: T5
date 21/10/11 waves PM Spectrum wave height 4(0.133) M (Hs) wave period 9.8 (1.79) S (Tp) damping 4,3,2,1 @ 4 min mooring Stage 3 notes Angle = 15
Notes/ Observations Observations Incoming waves @15 deg - PM Spectrum Float started in up-wave position
Float corrected during damping 4 Generally maintains alignment in the orthogonal position Some aggressive pitching/rolling motions Video data card full - no full side video recorded 1 reversal on lowest damping - float ends on up-wave side
12.2.6 ORTHOGONAL: T6
date 21/10/11 waves PM Spectrum wave height 4(0.133) M (Hs) wave period 9.8 (1.79) S (Tp) damping 4,3,2,1 @ 4 min

© Power Projects Limited February 2012 43
mooring Stage 3 notes Angle = 30 deg
Notes/ Observations Observations Incoming waves @30 deg Float started on reverse side and corrects quickly during damping 4
Float favours down -wave side Several rotations on damping 4 and 3 Float slightly stalled at both top and bottom dead centre More rotations than seen in other alignments with similar waves Phase space failed
12.2.7 ORTHOGONAL: T7 date 21/10/11 waves PM Spectrum wave height 4(0.133) M (Hs) wave period 9.8 (1.79) S (Tp) damping 4,3,2,1 @ 4 min mooring Stage 3 notes Angle = 30 deg
Notes/ Observations Observations Repeat of T6 with phase space recording No wave velocity measurements (adv)
Otherwise as T6
12.3 ORTHOGONAL - CONCLUSIONS & SUMMARY The orthogonal tests were performed to continue the investigation of the response of the device to incident waves other than normal. In the orthogonal tests the device was rotated through 90 degrees such that the mutual axis of the spar and the float was orientated normal to the wake makers. The following conclusions are drawn:
In general, the device performed surprisingly well in response to off-normal incident waves.
The spar appears to pitch (roll) more when waves are in this sense which is presumably due to the lower added mass and higher mooring restoring force ( due to the offset of the fairleads).
Device consistently sits slightly off the orthogonal sense ( attributed to presence of data cable)
More yaw response in the orthogonal case than the normal case (due to rudder effect of float).

© Power Projects Limited February 2012 44
13 SPAR CONFIG 1
13.1 SCHEDULE
13.1.1 OBJECTIVE The spar configuration series were performed to investigate various other spar arrangements, configurations and geometries. Spar Config 1 investigates the case when the lower section of the spar is rotated such that its smallest cross-section is orientated into the dominant wave direction and the rotation axis of the float is normal to the longest face of the lower spar section.
13.1.2 MODEL SET UP
Figure 4 - Spar Config 1
13.1.2.1 Hydrostatics In order to achieve the correct mass buoyancy distribution, an additional three shackles were attached to the lower spar.
13.1.3 WAVE CONDITIONS The following table shows the matrix of regular wave conditions used during the verification tests: Test Wave Height (Hs) (m) Wave Period (Tp) (s) Notes T1 3.5(0.117) 6 (1.10) Regular Waves T2 3.5(0.117) 6 (1.10) Repeat T1 T3 3.5(0.117) 8(1.46) Regular Waves
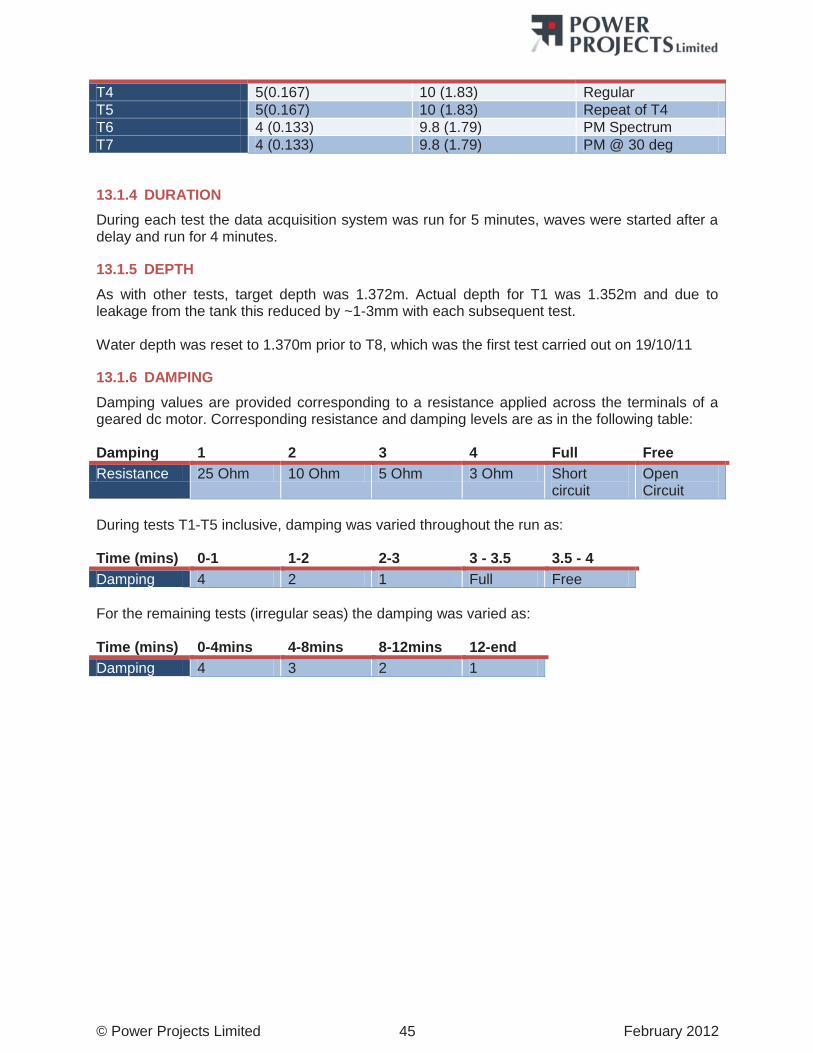
© Power Projects Limited February 2012 45
T4 5(0.167) 10 (1.83) Regular T5 5(0.167) 10 (1.83) Repeat of T4 T6 4 (0.133) 9.8 (1.79) PM Spectrum T7 4 (0.133) 9.8 (1.79) PM @ 30 deg
13.1.4 DURATION During each test the data acquisition system was run for 5 minutes, waves were started after a delay and run for 4 minutes.
13.1.5 DEPTH As with other tests, target depth was 1.372m. Actual depth for T1 was 1.352m and due to leakage from the tank this reduced by ~1-3mm with each subsequent test. Water depth was reset to 1.370m prior to T8, which was the first test carried out on 19/10/11
13.1.6 DAMPING Damping values are provided corresponding to a resistance applied across the terminals of a geared dc motor. Corresponding resistance and damping levels are as in the following table: Damping 1 2 3 4 Full Free Resistance 25 Ohm 10 Ohm 5 Ohm 3 Ohm Short
circuit Open Circuit
During tests T1-T5 inclusive, damping was varied throughout the run as: Time (mins) 0-1 1-2 2-3 3 - 3.5 3.5 - 4 Damping 4 2 1 Full Free For the remaining tests (irregular seas) the damping was varied as: Time (mins) 0-4mins 4-8mins 8-12mins 12-end Damping 4 3 2 1
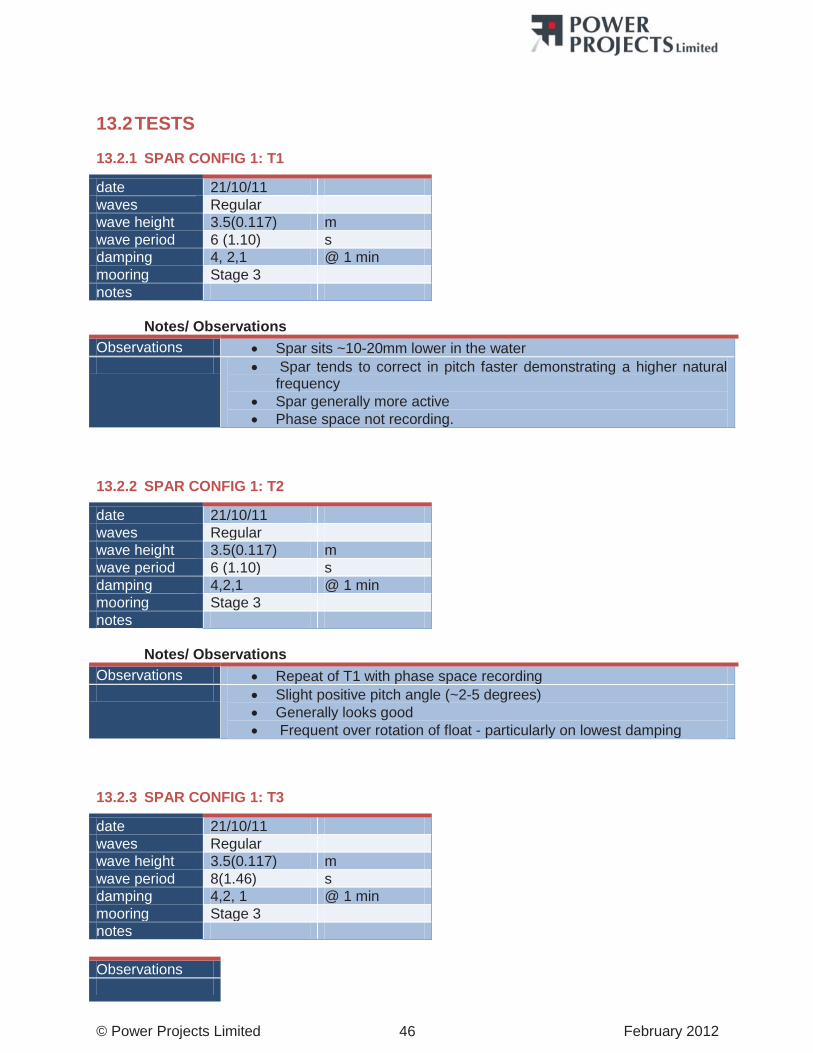
© Power Projects Limited February 2012 46
13.2 TESTS
13.2.1 SPAR CONFIG 1: T1
date 21/10/11 waves Regular wave height 3.5(0.117) m wave period 6 (1.10) s damping 4, 2,1 @ 1 min mooring Stage 3 notes
Notes/ Observations Observations Spar sits ~10-20mm lower in the water Spar tends to correct in pitch faster demonstrating a higher natural
frequency Spar generally more active Phase space not recording.
13.2.2 SPAR CONFIG 1: T2
date 21/10/11 waves Regular wave height 3.5(0.117) m wave period 6 (1.10) s damping 4,2,1 @ 1 min mooring Stage 3 notes
Notes/ Observations Observations Repeat of T1 with phase space recording Slight positive pitch angle (~2-5 degrees)
Generally looks good Frequent over rotation of float - particularly on lowest damping
13.2.3 SPAR CONFIG 1: T3
date 21/10/11 waves Regular wave height 3.5(0.117) m wave period 8(1.46) s damping 4,2, 1 @ 1 min mooring Stage 3 notes Observations
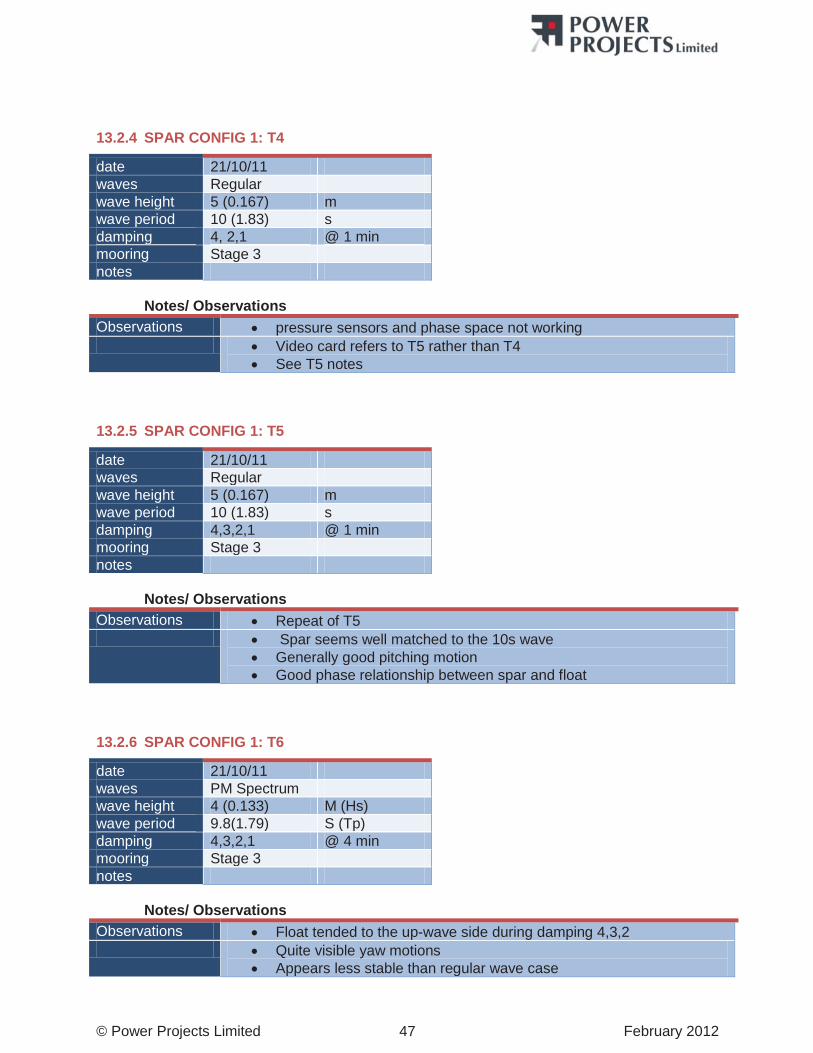
© Power Projects Limited February 2012 47
13.2.4 SPAR CONFIG 1: T4
date 21/10/11 waves Regular wave height 5 (0.167) m wave period 10 (1.83) s damping 4, 2,1 @ 1 min mooring Stage 3 notes
Notes/ Observations Observations pressure sensors and phase space not working Video card refers to T5 rather than T4
See T5 notes
13.2.5 SPAR CONFIG 1: T5
date 21/10/11 waves Regular wave height 5 (0.167) m wave period 10 (1.83) s damping 4,3,2,1 @ 1 min mooring Stage 3 notes
Notes/ Observations Observations Repeat of T5 Spar seems well matched to the 10s wave
Generally good pitching motion Good phase relationship between spar and float
13.2.6 SPAR CONFIG 1: T6
date 21/10/11 waves PM Spectrum wave height 4 (0.133) M (Hs) wave period 9.8(1.79) S (Tp) damping 4,3,2,1 @ 4 min mooring Stage 3 notes
Notes/ Observations Observations Float tended to the up-wave side during damping 4,3,2 Quite visible yaw motions
Appears less stable than regular wave case
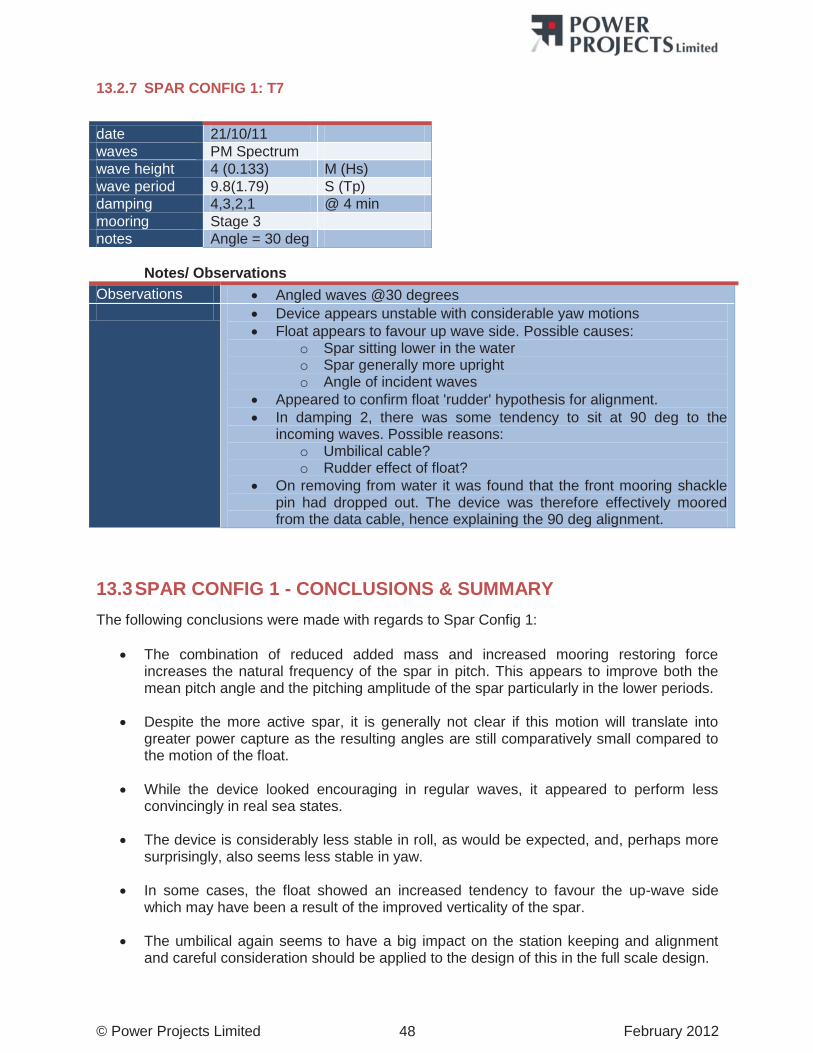
© Power Projects Limited February 2012 48
13.2.7 SPAR CONFIG 1: T7 date 21/10/11 waves PM Spectrum wave height 4 (0.133) M (Hs) wave period 9.8(1.79) S (Tp) damping 4,3,2,1 @ 4 min mooring Stage 3 notes Angle = 30 deg
Notes/ Observations Observations Angled waves @30 degrees Device appears unstable with considerable yaw motions
Float appears to favour up wave side. Possible causes: o Spar sitting lower in the water o Spar generally more upright o Angle of incident waves
Appeared to confirm float 'rudder' hypothesis for alignment. In damping 2, there was some tendency to sit at 90 deg to the
incoming waves. Possible reasons: o Umbilical cable? o Rudder effect of float?
On removing from water it was found that the front mooring shackle pin had dropped out. The device was therefore effectively moored from the data cable, hence explaining the 90 deg alignment.
13.3 SPAR CONFIG 1 - CONCLUSIONS & SUMMARY The following conclusions were made with regards to Spar Config 1:
The combination of reduced added mass and increased mooring restoring force increases the natural frequency of the spar in pitch. This appears to improve both the mean pitch angle and the pitching amplitude of the spar particularly in the lower periods.
Despite the more active spar, it is generally not clear if this motion will translate into greater power capture as the resulting angles are still comparatively small compared to the motion of the float.
While the device looked encouraging in regular waves, it appeared to perform less convincingly in real sea states.
The device is considerably less stable in roll, as would be expected, and, perhaps more surprisingly, also seems less stable in yaw.
In some cases, the float showed an increased tendency to favour the up-wave side which may have been a result of the improved verticality of the spar.
The umbilical again seems to have a big impact on the station keeping and alignment and careful consideration should be applied to the design of this in the full scale design.

© Power Projects Limited February 2012 49
14 SPAR CONFIG 2
14.1 SCHEDULE
14.1.1 OBJECTIVE The spar configuration series were performed to investigate various alternative Spar arrangements, configurations and geometries. Spar Config 2 investigates the case when the middle section of the spar is removed. This test was performed to investigate the possibility of reducing the overall material requirements and operational costs by reducing the length of the Spar.
14.1.2 MODEL SET UP
14.1.2.1 Hydrostatics Overall 2.3kg of ballast was removed from the device to compensate for the reduced overall buoyancy while maintaining the required draft. The resulting centre of mass was found to be too high with relation to the centre of buoyancy and, consequently, the device floats horizontally rather than vertically. An attempt was made to use the mooring system to maintain the vertical orientation of the device. This approach was found to be unfeasible.
14.1.2.2 Hydrodynamics Due to the problems of achieving a satisfactory hydrostatic equilibrium, no attempt was made to examine the hydrodynamic response of the device.
Figure 5 - Spar Config 2
14.2 SPAR CONFIG 2- CONCLUSIONS & SUMMARY The following conclusions were made with regards to Spar Config 2:
The default configuration of the spar and float are about right.
It will be difficult to reduce the length of the spar given the location of the power take off module and associated ballast located above the water.
Maintaining the distance between the centre of mass and centre of buoyancy is a key design challenge.
Middle Section removed

© Power Projects Limited February 2012 50
15 SPAR CONFIG 3
15.1 SCHEDULE
15.1.1 OBJECTIVE The spar configuration series were performed to investigate various alternative Spar arrangements, configurations and geometries. Spar Config 3 was another attempt to reduce the overall length of the spar.
15.1.2 MODEL SET UP In this configuration, the lower two section of the spar are mounted at the same effective draft, created a shorter, thicker spar.
15.1.2.1 Hydrostatics The mass distribution between the spar sections was equivalent to the default case. All of the ballast was contained within one of the lower sections As with Spar Config 2, it proved to be unrealistic to achieve anything other than a horizontal equilibrium condition
15.1.2.2 Hydrodynamics Due to the difficulties of achieving a satisfactory hydrostatic equilibrium, no attempt was made to investigate the hydrodynamic response of this configuration.
15.2 SPAR CONFIG 2- CONCLUSIONS & SUMMARY The following conclusions were drawn from the Spar Config 2 model:
This was an interesting arrangement that could perhaps have worked with some modification and additional ballast.
While it may be possible to reduce the overall length it is likely that the overall weight and corresponding buoyancy will have to increase to compensate for the reduced lever arm. This may well turn out to be self defeating as a means to reduce the overall cost of energy.
Figure 6 - Spar Config 3
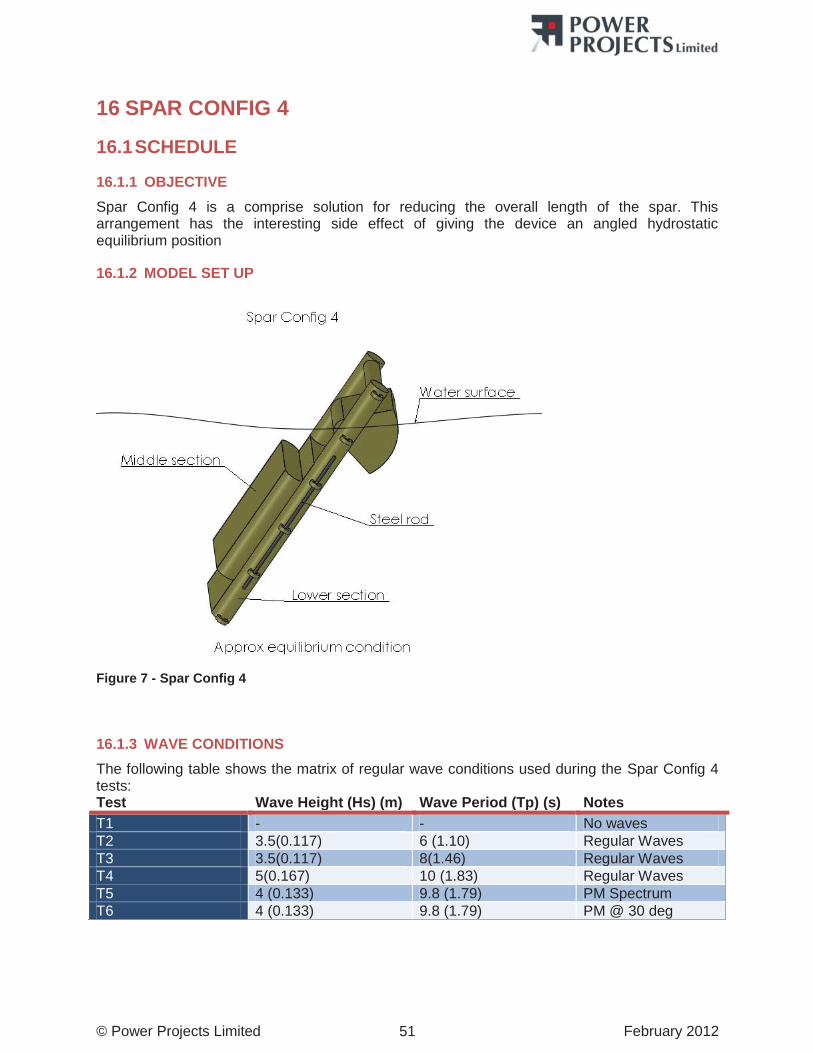
© Power Projects Limited February 2012 51
16 SPAR CONFIG 4
16.1 SCHEDULE
16.1.1 OBJECTIVE Spar Config 4 is a comprise solution for reducing the overall length of the spar. This arrangement has the interesting side effect of giving the device an angled hydrostatic equilibrium position
16.1.2 MODEL SET UP
Figure 7 - Spar Config 4
16.1.3 WAVE CONDITIONS The following table shows the matrix of regular wave conditions used during the Spar Config 4 tests: Test Wave Height (Hs) (m) Wave Period (Tp) (s) Notes T1 - - No waves T2 3.5(0.117) 6 (1.10) Regular Waves T3 3.5(0.117) 8(1.46) Regular Waves T4 5(0.167) 10 (1.83) Regular Waves T5 4 (0.133) 9.8 (1.79) PM Spectrum T6 4 (0.133) 9.8 (1.79) PM @ 30 deg
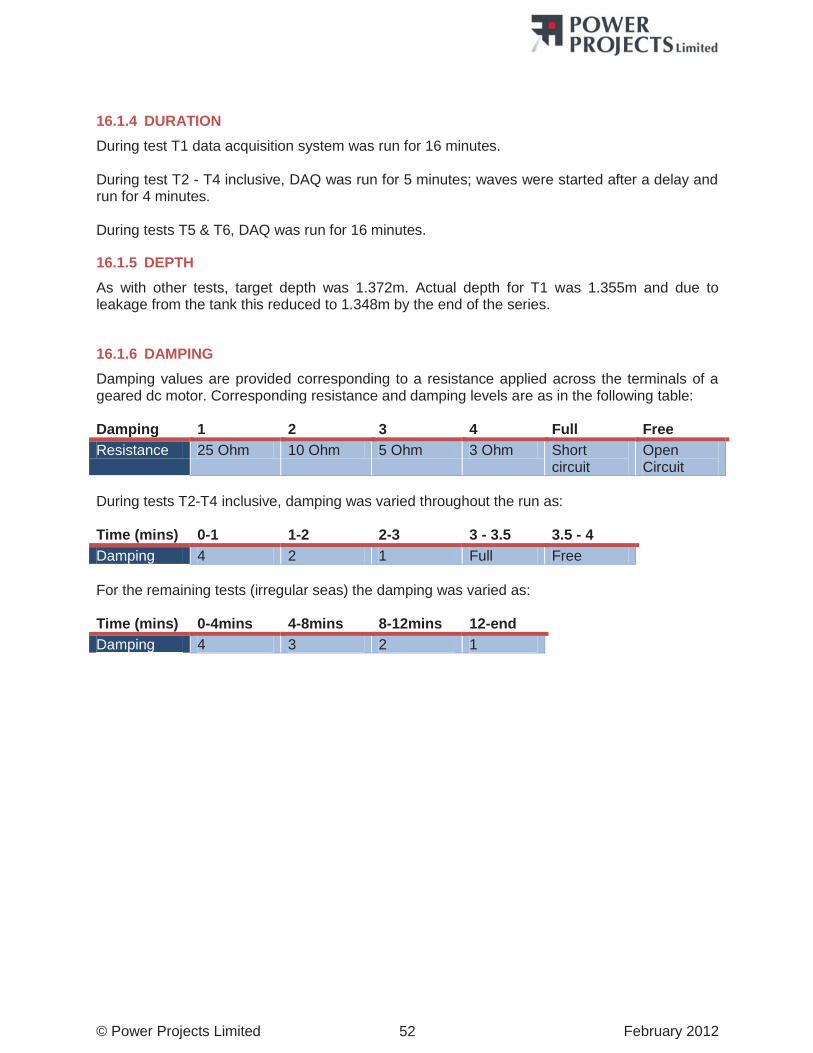
© Power Projects Limited February 2012 52
16.1.4 DURATION During test T1 data acquisition system was run for 16 minutes. During test T2 - T4 inclusive, DAQ was run for 5 minutes; waves were started after a delay and run for 4 minutes. During tests T5 & T6, DAQ was run for 16 minutes.
16.1.5 DEPTH As with other tests, target depth was 1.372m. Actual depth for T1 was 1.355m and due to leakage from the tank this reduced to 1.348m by the end of the series.
16.1.6 DAMPING Damping values are provided corresponding to a resistance applied across the terminals of a geared dc motor. Corresponding resistance and damping levels are as in the following table: Damping 1 2 3 4 Full Free Resistance 25 Ohm 10 Ohm 5 Ohm 3 Ohm Short
circuit Open Circuit
During tests T2-T4 inclusive, damping was varied throughout the run as: Time (mins) 0-1 1-2 2-3 3 - 3.5 3.5 - 4 Damping 4 2 1 Full Free For the remaining tests (irregular seas) the damping was varied as: Time (mins) 0-4mins 4-8mins 8-12mins 12-end Damping 4 3 2 1
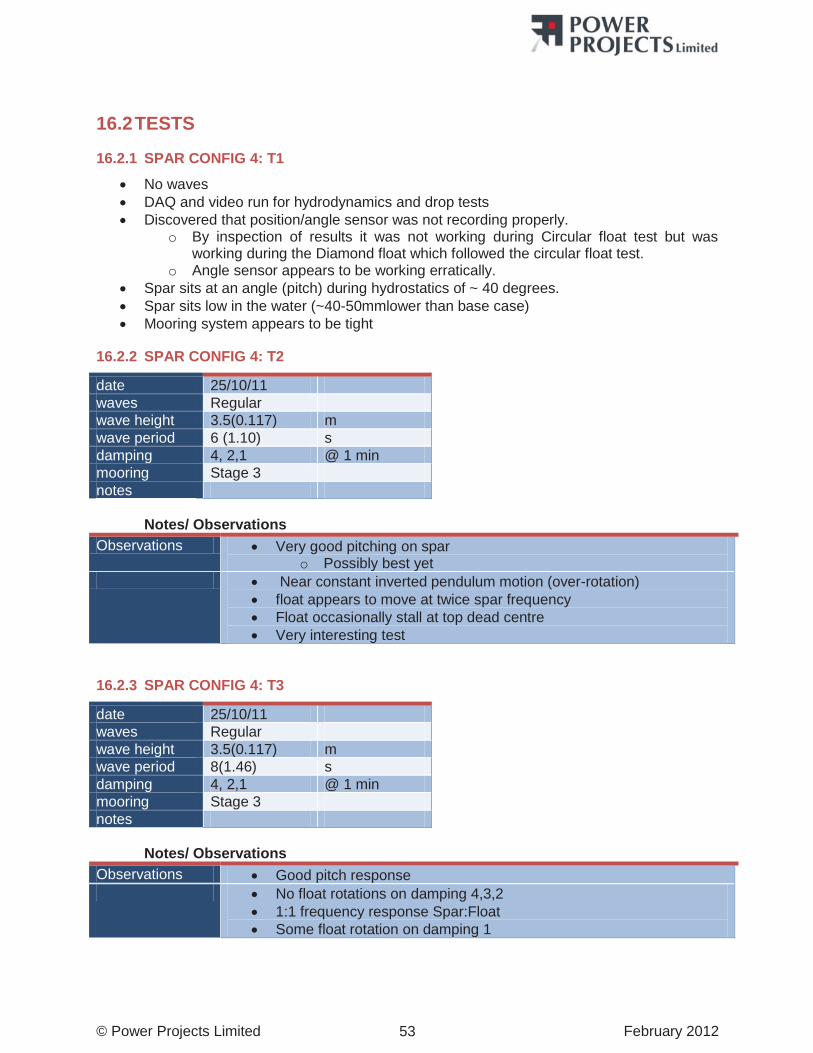
© Power Projects Limited February 2012 53
16.2 TESTS
16.2.1 SPAR CONFIG 4: T1
No waves DAQ and video run for hydrodynamics and drop tests Discovered that position/angle sensor was not recording properly.
o By inspection of results it was not working during Circular float test but was working during the Diamond float which followed the circular float test.
o Angle sensor appears to be working erratically. Spar sits at an angle (pitch) during hydrostatics of ~ 40 degrees. Spar sits low in the water (~40-50mmlower than base case) Mooring system appears to be tight
16.2.2 SPAR CONFIG 4: T2
date 25/10/11 waves Regular wave height 3.5(0.117) m wave period 6 (1.10) s damping 4, 2,1 @ 1 min mooring Stage 3 notes
Notes/ Observations Observations Very good pitching on spar
o Possibly best yet Near constant inverted pendulum motion (over-rotation)
float appears to move at twice spar frequency Float occasionally stall at top dead centre Very interesting test
16.2.3 SPAR CONFIG 4: T3
date 25/10/11 waves Regular wave height 3.5(0.117) m wave period 8(1.46) s damping 4, 2,1 @ 1 min mooring Stage 3 notes
Notes/ Observations Observations Good pitch response No float rotations on damping 4,3,2
1:1 frequency response Spar:Float Some float rotation on damping 1
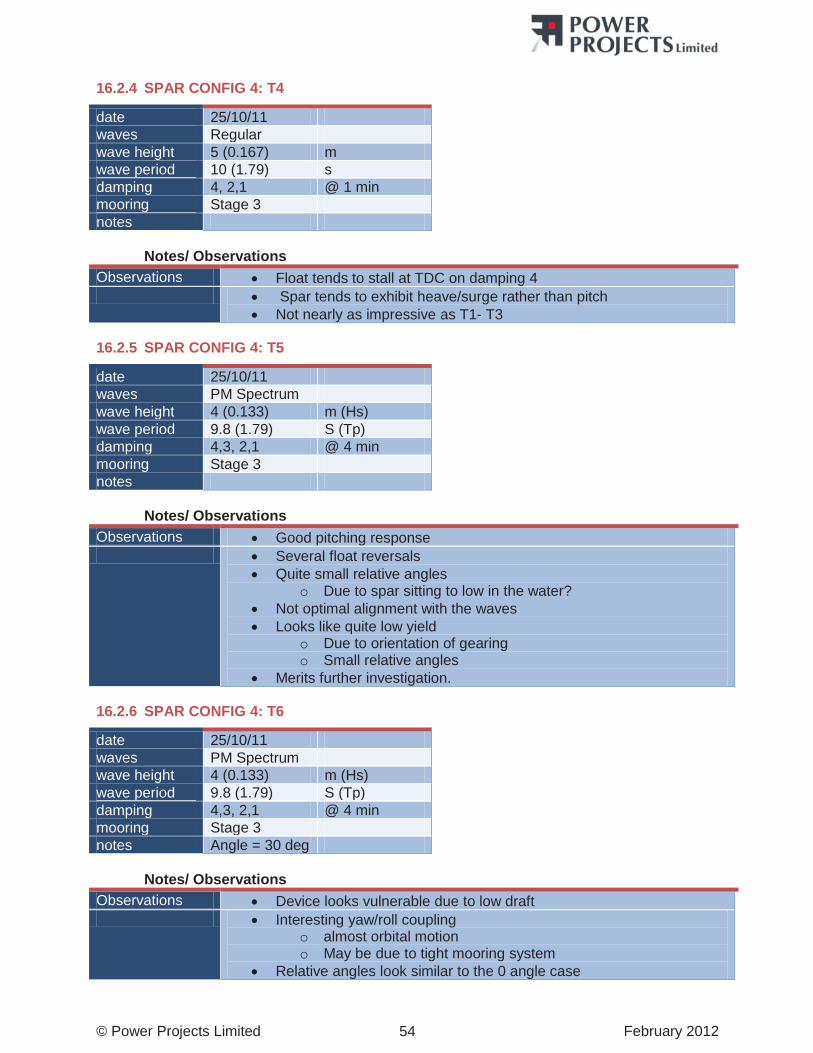
© Power Projects Limited February 2012 54
16.2.4 SPAR CONFIG 4: T4
date 25/10/11 waves Regular wave height 5 (0.167) m wave period 10 (1.79) s damping 4, 2,1 @ 1 min mooring Stage 3 notes
Notes/ Observations Observations Float tends to stall at TDC on damping 4 Spar tends to exhibit heave/surge rather than pitch
Not nearly as impressive as T1- T3
16.2.5 SPAR CONFIG 4: T5
date 25/10/11 waves PM Spectrum wave height 4 (0.133) m (Hs) wave period 9.8 (1.79) S (Tp) damping 4,3, 2,1 @ 4 min mooring Stage 3 notes
Notes/ Observations Observations Good pitching response Several float reversals
Quite small relative angles o Due to spar sitting to low in the water?
Not optimal alignment with the waves Looks like quite low yield
o Due to orientation of gearing o Small relative angles
Merits further investigation.
16.2.6 SPAR CONFIG 4: T6
date 25/10/11 waves PM Spectrum wave height 4 (0.133) m (Hs) wave period 9.8 (1.79) S (Tp) damping 4,3, 2,1 @ 4 min mooring Stage 3 notes Angle = 30 deg
Notes/ Observations Observations Device looks vulnerable due to low draft Interesting yaw/roll coupling
o almost orbital motion o May be due to tight mooring system
Relative angles look similar to the 0 angle case
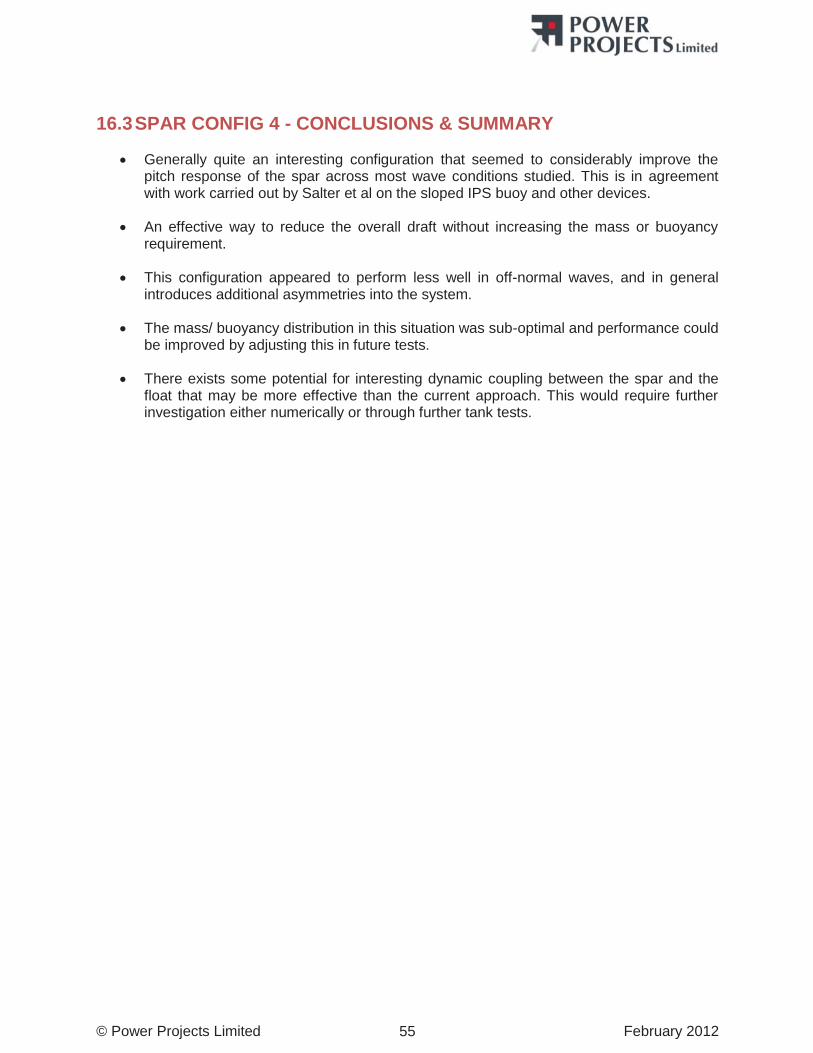
© Power Projects Limited February 2012 55
16.3 SPAR CONFIG 4 - CONCLUSIONS & SUMMARY
Generally quite an interesting configuration that seemed to considerably improve the pitch response of the spar across most wave conditions studied. This is in agreement with work carried out by Salter et al on the sloped IPS buoy and other devices.
An effective way to reduce the overall draft without increasing the mass or buoyancy requirement.
This configuration appeared to perform less well in off-normal waves, and in general introduces additional asymmetries into the system.
The mass/ buoyancy distribution in this situation was sub-optimal and performance could be improved by adjusting this in future tests.
There exists some potential for interesting dynamic coupling between the spar and the float that may be more effective than the current approach. This would require further investigation either numerically or through further tank tests.
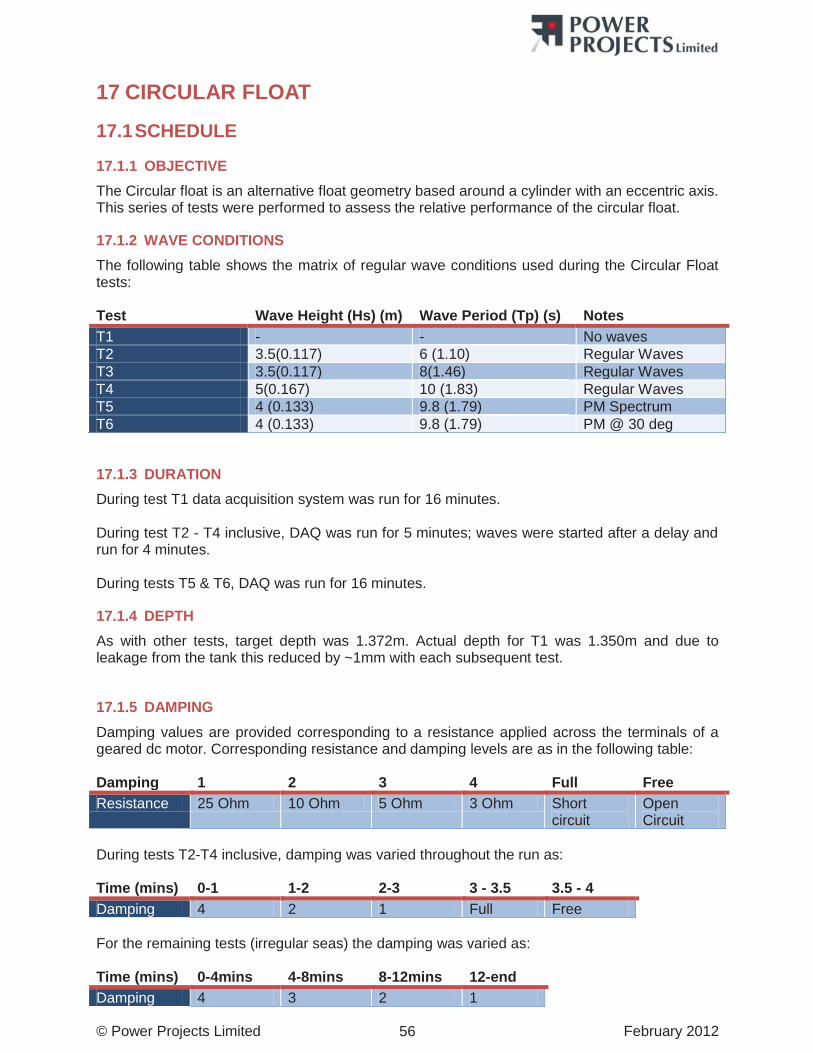
© Power Projects Limited February 2012 56
17 CIRCULAR FLOAT
17.1 SCHEDULE
17.1.1 OBJECTIVE The Circular float is an alternative float geometry based around a cylinder with an eccentric axis. This series of tests were performed to assess the relative performance of the circular float.
17.1.2 WAVE CONDITIONS The following table shows the matrix of regular wave conditions used during the Circular Float tests: Test Wave Height (Hs) (m) Wave Period (Tp) (s) Notes T1 - - No waves T2 3.5(0.117) 6 (1.10) Regular Waves T3 3.5(0.117) 8(1.46) Regular Waves T4 5(0.167) 10 (1.83) Regular Waves T5 4 (0.133) 9.8 (1.79) PM Spectrum T6 4 (0.133) 9.8 (1.79) PM @ 30 deg
17.1.3 DURATION During test T1 data acquisition system was run for 16 minutes. During test T2 - T4 inclusive, DAQ was run for 5 minutes; waves were started after a delay and run for 4 minutes. During tests T5 & T6, DAQ was run for 16 minutes.
17.1.4 DEPTH As with other tests, target depth was 1.372m. Actual depth for T1 was 1.350m and due to leakage from the tank this reduced by ~1mm with each subsequent test.
17.1.5 DAMPING Damping values are provided corresponding to a resistance applied across the terminals of a geared dc motor. Corresponding resistance and damping levels are as in the following table: Damping 1 2 3 4 Full Free Resistance 25 Ohm 10 Ohm 5 Ohm 3 Ohm Short
circuit Open Circuit
During tests T2-T4 inclusive, damping was varied throughout the run as: Time (mins) 0-1 1-2 2-3 3 - 3.5 3.5 - 4 Damping 4 2 1 Full Free For the remaining tests (irregular seas) the damping was varied as: Time (mins) 0-4mins 4-8mins 8-12mins 12-end Damping 4 3 2 1
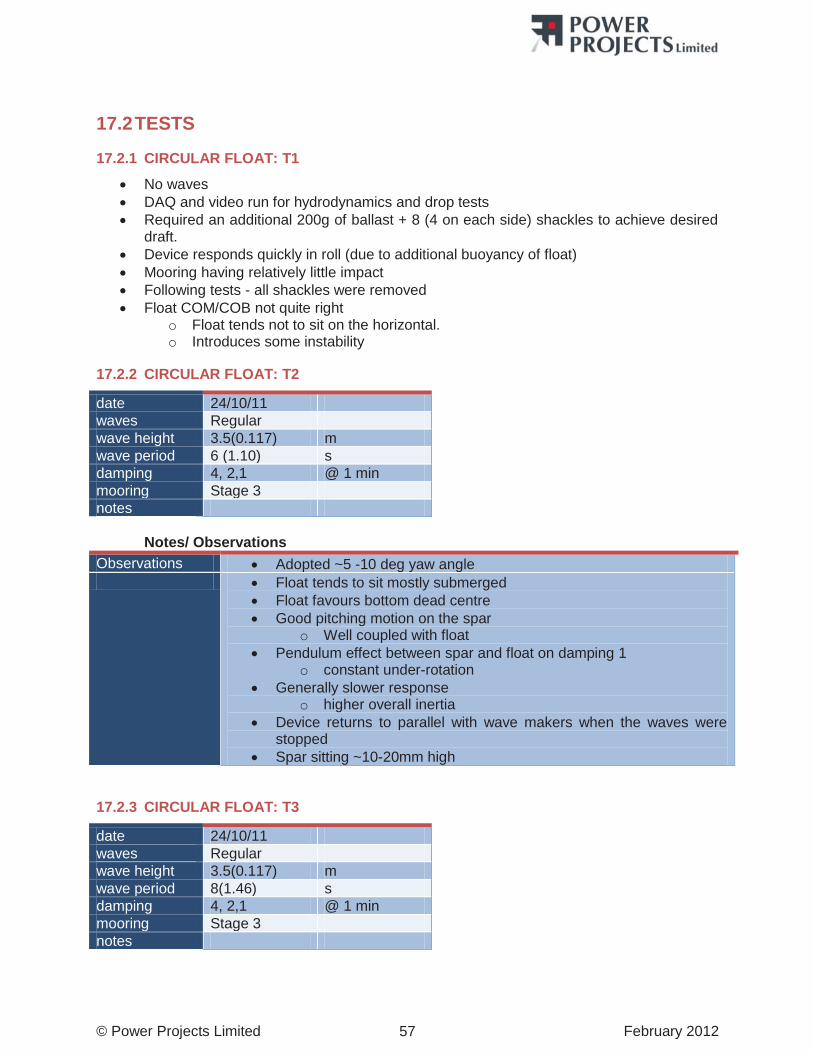
© Power Projects Limited February 2012 57
17.2 TESTS
17.2.1 CIRCULAR FLOAT: T1
No waves DAQ and video run for hydrodynamics and drop tests Required an additional 200g of ballast + 8 (4 on each side) shackles to achieve desired
draft. Device responds quickly in roll (due to additional buoyancy of float) Mooring having relatively little impact Following tests - all shackles were removed Float COM/COB not quite right
o Float tends not to sit on the horizontal. o Introduces some instability
17.2.2 CIRCULAR FLOAT: T2
date 24/10/11 waves Regular wave height 3.5(0.117) m wave period 6 (1.10) s damping 4, 2,1 @ 1 min mooring Stage 3 notes
Notes/ Observations Observations Adopted ~5 -10 deg yaw angle Float tends to sit mostly submerged
Float favours bottom dead centre Good pitching motion on the spar
o Well coupled with float Pendulum effect between spar and float on damping 1
o constant under-rotation Generally slower response
o higher overall inertia Device returns to parallel with wave makers when the waves were
stopped Spar sitting ~10-20mm high
17.2.3 CIRCULAR FLOAT: T3
date 24/10/11 waves Regular wave height 3.5(0.117) m wave period 8(1.46) s damping 4, 2,1 @ 1 min mooring Stage 3 notes
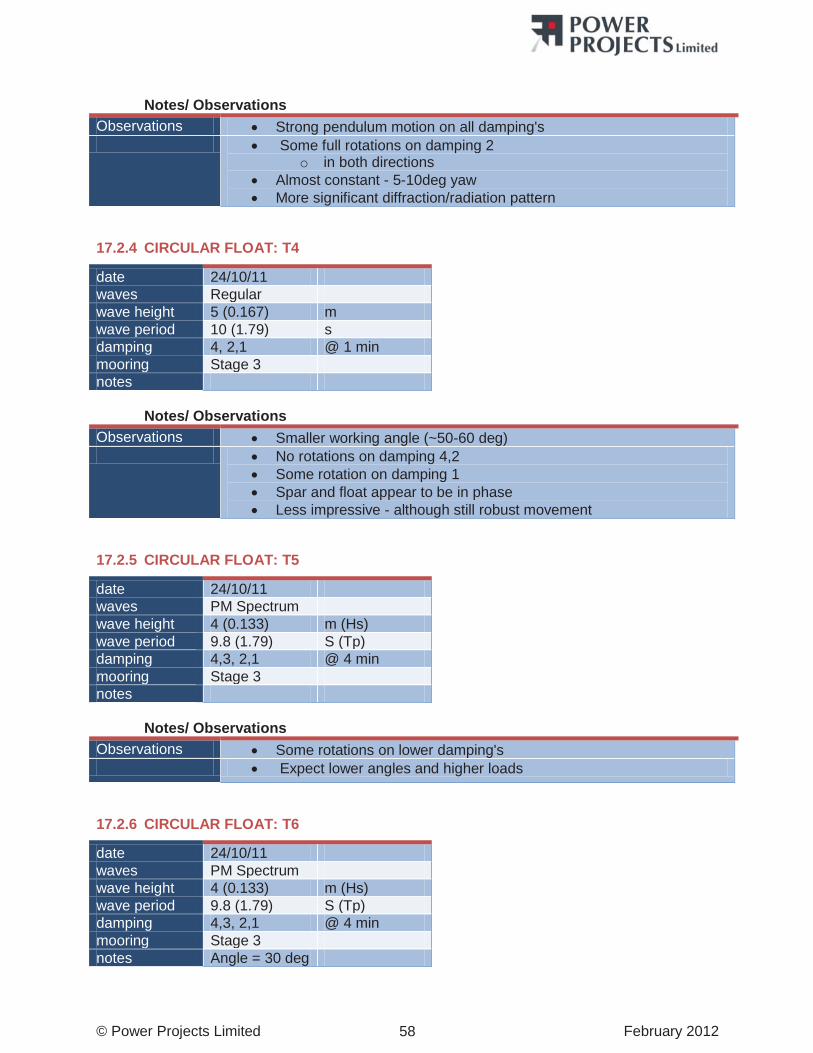
© Power Projects Limited February 2012 58
Notes/ Observations
Observations Strong pendulum motion on all damping's Some full rotations on damping 2
o in both directions Almost constant - 5-10deg yaw More significant diffraction/radiation pattern
17.2.4 CIRCULAR FLOAT: T4
date 24/10/11 waves Regular wave height 5 (0.167) m wave period 10 (1.79) s damping 4, 2,1 @ 1 min mooring Stage 3 notes
Notes/ Observations Observations Smaller working angle (~50-60 deg) No rotations on damping 4,2
Some rotation on damping 1 Spar and float appear to be in phase Less impressive - although still robust movement
17.2.5 CIRCULAR FLOAT: T5
date 24/10/11 waves PM Spectrum wave height 4 (0.133) m (Hs) wave period 9.8 (1.79) S (Tp) damping 4,3, 2,1 @ 4 min mooring Stage 3 notes
Notes/ Observations Observations Some rotations on lower damping's Expect lower angles and higher loads
17.2.6 CIRCULAR FLOAT: T6
date 24/10/11 waves PM Spectrum wave height 4 (0.133) m (Hs) wave period 9.8 (1.79) S (Tp) damping 4,3, 2,1 @ 4 min mooring Stage 3 notes Angle = 30 deg
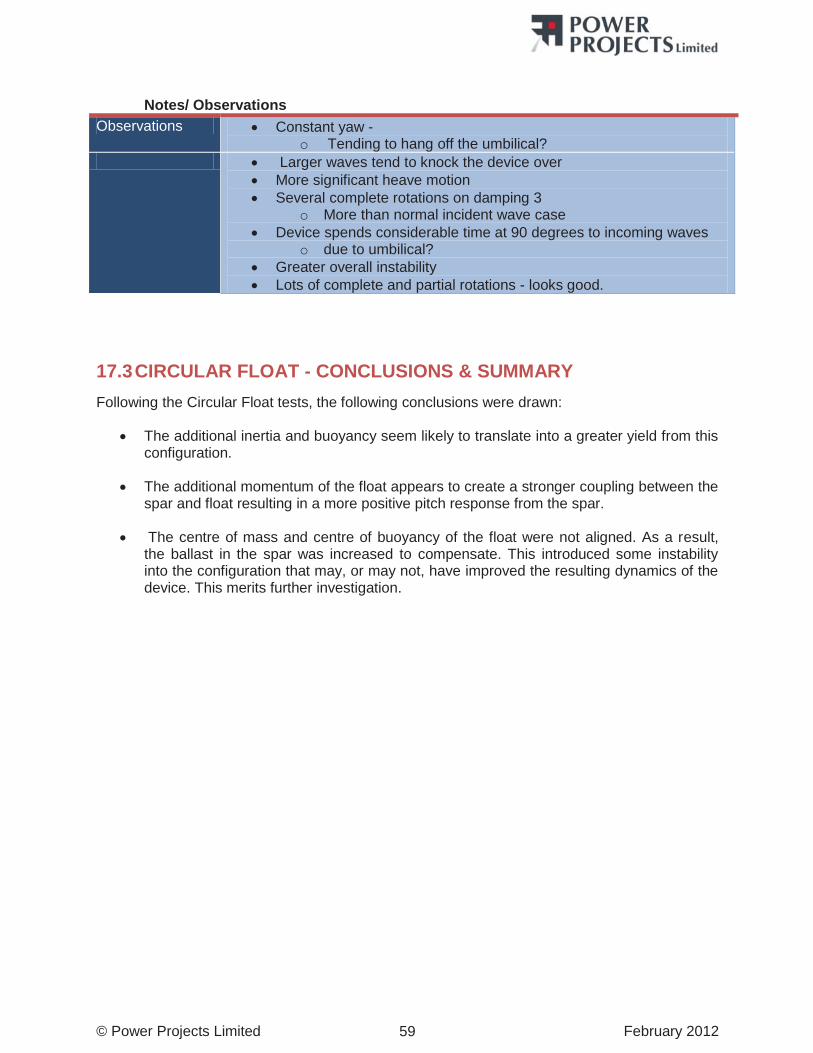
© Power Projects Limited February 2012 59
Notes/ Observations
Observations Constant yaw - o Tending to hang off the umbilical?
Larger waves tend to knock the device over More significant heave motion Several complete rotations on damping 3
o More than normal incident wave case Device spends considerable time at 90 degrees to incoming waves
o due to umbilical? Greater overall instability Lots of complete and partial rotations - looks good.
17.3 CIRCULAR FLOAT - CONCLUSIONS & SUMMARY Following the Circular Float tests, the following conclusions were drawn:
The additional inertia and buoyancy seem likely to translate into a greater yield from this configuration.
The additional momentum of the float appears to create a stronger coupling between the spar and float resulting in a more positive pitch response from the spar.
The centre of mass and centre of buoyancy of the float were not aligned. As a result, the ballast in the spar was increased to compensate. This introduced some instability into the configuration that may, or may not, have improved the resulting dynamics of the device. This merits further investigation.
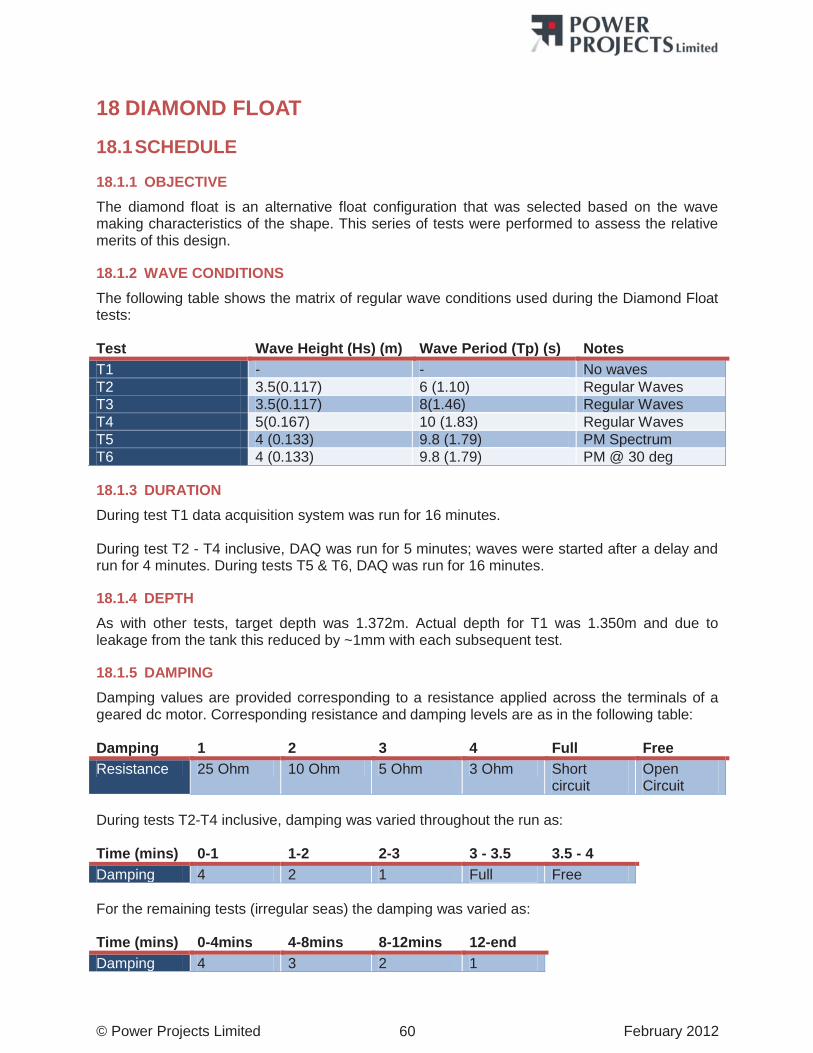
© Power Projects Limited February 2012 60
18 DIAMOND FLOAT
18.1 SCHEDULE
18.1.1 OBJECTIVE The diamond float is an alternative float configuration that was selected based on the wave making characteristics of the shape. This series of tests were performed to assess the relative merits of this design.
18.1.2 WAVE CONDITIONS The following table shows the matrix of regular wave conditions used during the Diamond Float tests: Test Wave Height (Hs) (m) Wave Period (Tp) (s) Notes T1 - - No waves T2 3.5(0.117) 6 (1.10) Regular Waves T3 3.5(0.117) 8(1.46) Regular Waves T4 5(0.167) 10 (1.83) Regular Waves T5 4 (0.133) 9.8 (1.79) PM Spectrum T6 4 (0.133) 9.8 (1.79) PM @ 30 deg
18.1.3 DURATION During test T1 data acquisition system was run for 16 minutes. During test T2 - T4 inclusive, DAQ was run for 5 minutes; waves were started after a delay and run for 4 minutes. During tests T5 & T6, DAQ was run for 16 minutes.
18.1.4 DEPTH As with other tests, target depth was 1.372m. Actual depth for T1 was 1.350m and due to leakage from the tank this reduced by ~1mm with each subsequent test.
18.1.5 DAMPING Damping values are provided corresponding to a resistance applied across the terminals of a geared dc motor. Corresponding resistance and damping levels are as in the following table: Damping 1 2 3 4 Full Free Resistance 25 Ohm 10 Ohm 5 Ohm 3 Ohm Short
circuit Open Circuit
During tests T2-T4 inclusive, damping was varied throughout the run as: Time (mins) 0-1 1-2 2-3 3 - 3.5 3.5 - 4 Damping 4 2 1 Full Free For the remaining tests (irregular seas) the damping was varied as: Time (mins) 0-4mins 4-8mins 8-12mins 12-end Damping 4 3 2 1
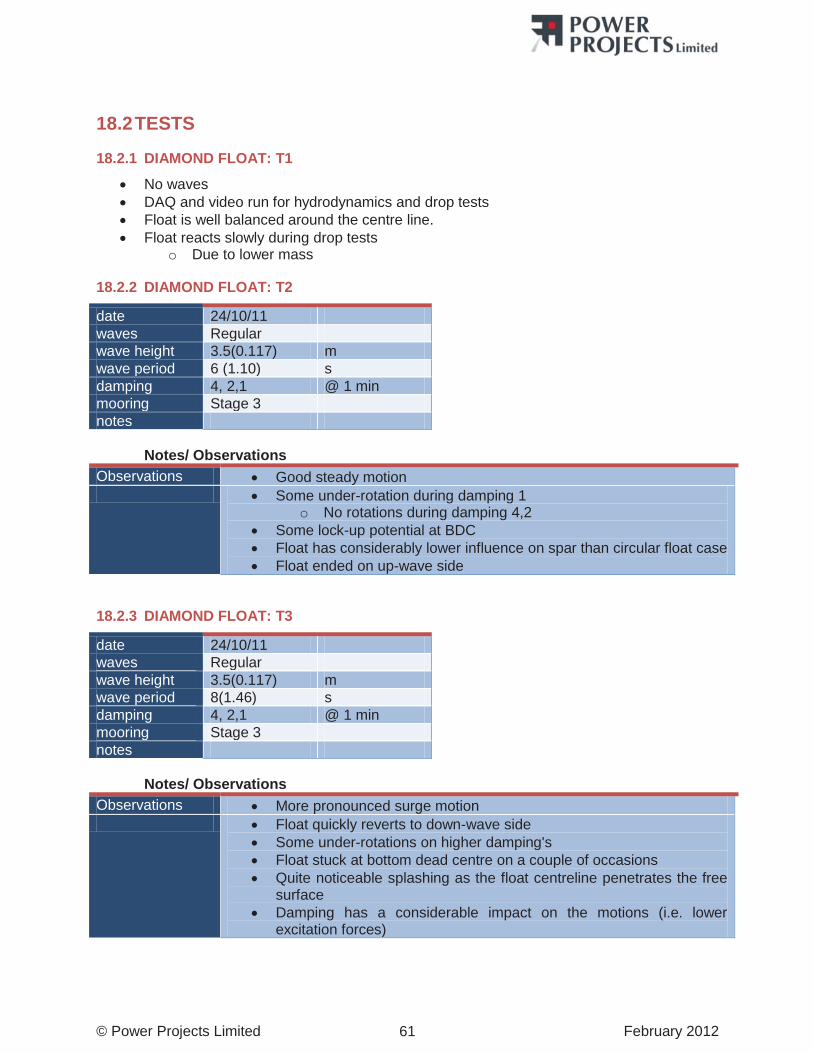
© Power Projects Limited February 2012 61
18.2 TESTS
18.2.1 DIAMOND FLOAT: T1
No waves DAQ and video run for hydrodynamics and drop tests Float is well balanced around the centre line. Float reacts slowly during drop tests
o Due to lower mass
18.2.2 DIAMOND FLOAT: T2
date 24/10/11 waves Regular wave height 3.5(0.117) m wave period 6 (1.10) s damping 4, 2,1 @ 1 min mooring Stage 3 notes
Notes/ Observations Observations Good steady motion Some under-rotation during damping 1
o No rotations during damping 4,2 Some lock-up potential at BDC Float has considerably lower influence on spar than circular float case Float ended on up-wave side
18.2.3 DIAMOND FLOAT: T3
date 24/10/11 waves Regular wave height 3.5(0.117) m wave period 8(1.46) s damping 4, 2,1 @ 1 min mooring Stage 3 notes
Notes/ Observations Observations More pronounced surge motion Float quickly reverts to down-wave side
Some under-rotations on higher damping's Float stuck at bottom dead centre on a couple of occasions Quite noticeable splashing as the float centreline penetrates the free
surface Damping has a considerable impact on the motions (i.e. lower
excitation forces)
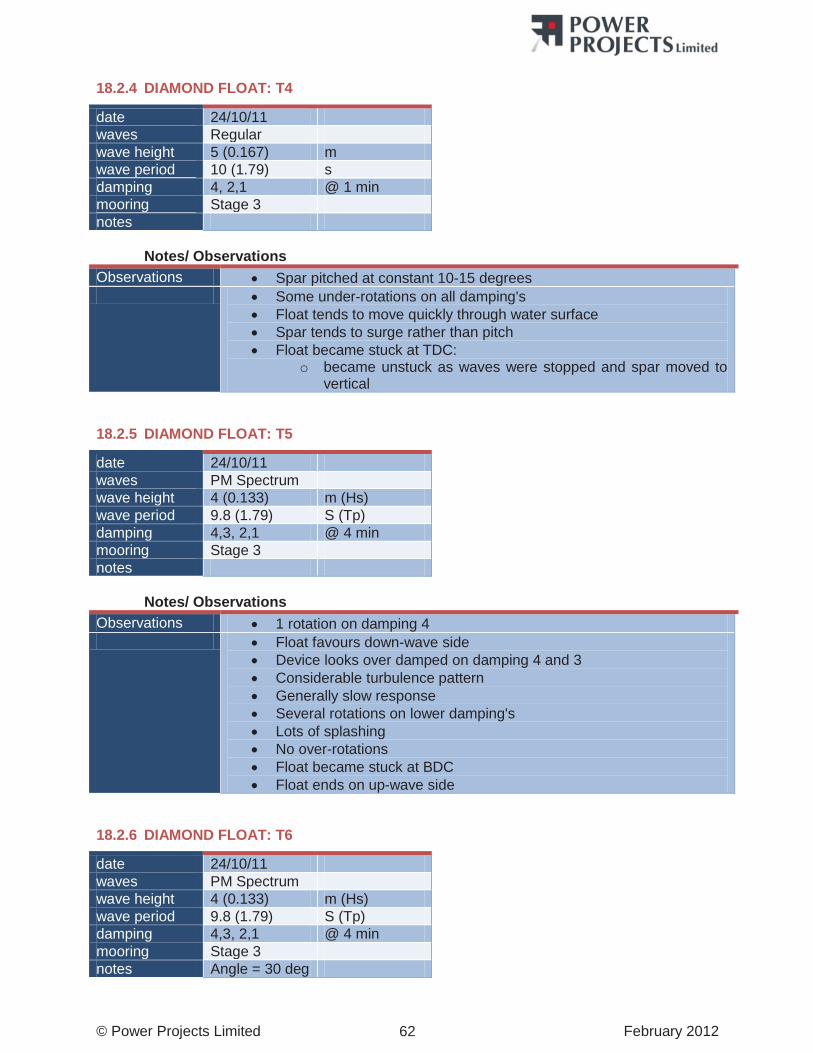
© Power Projects Limited February 2012 62
18.2.4 DIAMOND FLOAT: T4
date 24/10/11 waves Regular wave height 5 (0.167) m wave period 10 (1.79) s damping 4, 2,1 @ 1 min mooring Stage 3 notes
Notes/ Observations Observations Spar pitched at constant 10-15 degrees Some under-rotations on all damping's
Float tends to move quickly through water surface Spar tends to surge rather than pitch Float became stuck at TDC:
o became unstuck as waves were stopped and spar moved to vertical
18.2.5 DIAMOND FLOAT: T5
date 24/10/11 waves PM Spectrum wave height 4 (0.133) m (Hs) wave period 9.8 (1.79) S (Tp) damping 4,3, 2,1 @ 4 min mooring Stage 3 notes
Notes/ Observations Observations 1 rotation on damping 4 Float favours down-wave side
Device looks over damped on damping 4 and 3 Considerable turbulence pattern Generally slow response Several rotations on lower damping's Lots of splashing No over-rotations Float became stuck at BDC Float ends on up-wave side
18.2.6 DIAMOND FLOAT: T6
date 24/10/11 waves PM Spectrum wave height 4 (0.133) m (Hs) wave period 9.8 (1.79) S (Tp) damping 4,3, 2,1 @ 4 min mooring Stage 3 notes Angle = 30 deg
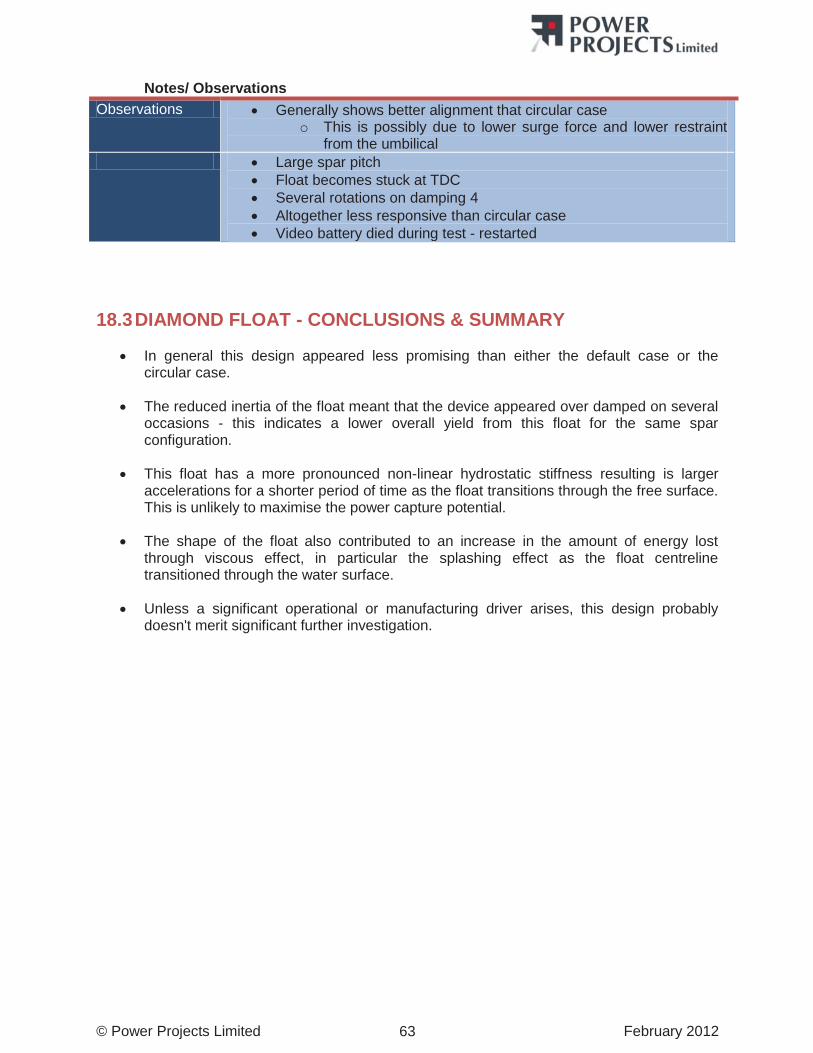
© Power Projects Limited February 2012 63
Notes/ Observations Observations Generally shows better alignment that circular case
o This is possibly due to lower surge force and lower restraint from the umbilical
Large spar pitch Float becomes stuck at TDC Several rotations on damping 4 Altogether less responsive than circular case Video battery died during test - restarted
18.3 DIAMOND FLOAT - CONCLUSIONS & SUMMARY
In general this design appeared less promising than either the default case or the circular case.
The reduced inertia of the float meant that the device appeared over damped on several occasions - this indicates a lower overall yield from this float for the same spar configuration.
This float has a more pronounced non-linear hydrostatic stiffness resulting is larger accelerations for a shorter period of time as the float transitions through the free surface. This is unlikely to maximise the power capture potential.
The shape of the float also contributed to an increase in the amount of energy lost through viscous effect, in particular the splashing effect as the float centreline transitioned through the water surface.
Unless a significant operational or manufacturing driver arises, this design probably doesn't merit significant further investigation.
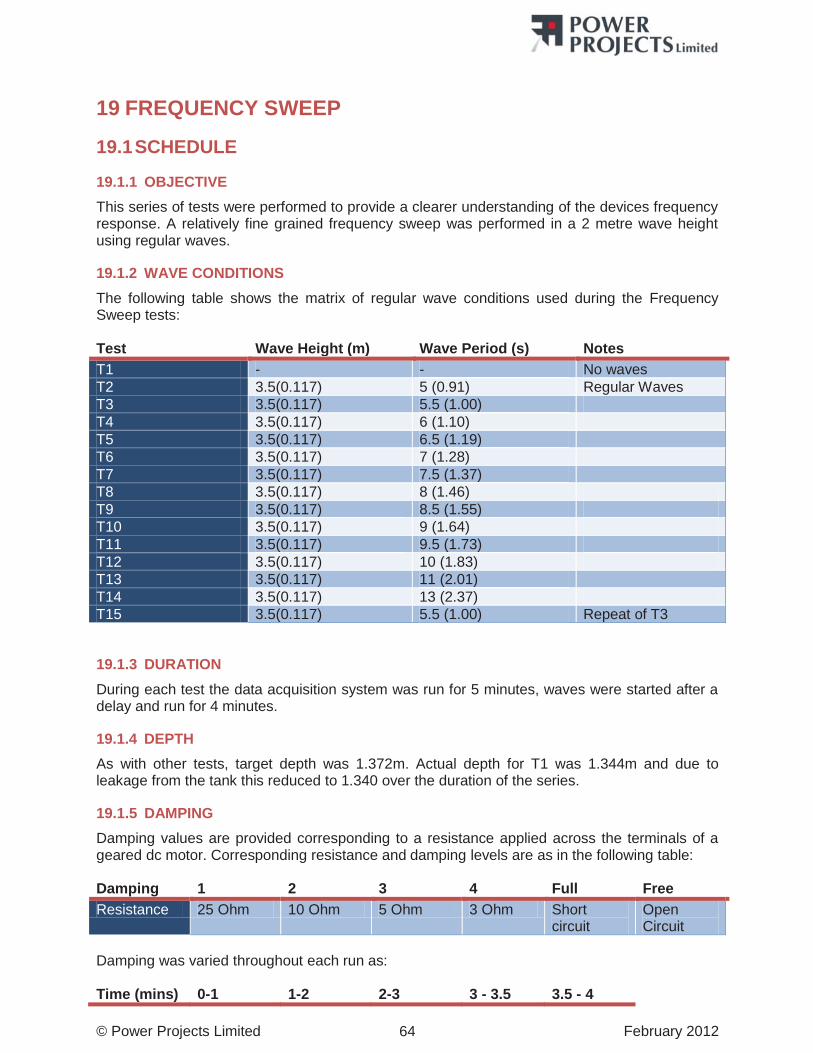
© Power Projects Limited February 2012 64
19 FREQUENCY SWEEP
19.1 SCHEDULE
19.1.1 OBJECTIVE This series of tests were performed to provide a clearer understanding of the devices frequency response. A relatively fine grained frequency sweep was performed in a 2 metre wave height using regular waves.
19.1.2 WAVE CONDITIONS The following table shows the matrix of regular wave conditions used during the Frequency Sweep tests: Test Wave Height (m) Wave Period (s) Notes T1 - - No waves T2 3.5(0.117) 5 (0.91) Regular Waves T3 3.5(0.117) 5.5 (1.00) T4 3.5(0.117) 6 (1.10) T5 3.5(0.117) 6.5 (1.19) T6 3.5(0.117) 7 (1.28) T7 3.5(0.117) 7.5 (1.37) T8 3.5(0.117) 8 (1.46) T9 3.5(0.117) 8.5 (1.55) T10 3.5(0.117) 9 (1.64) T11 3.5(0.117) 9.5 (1.73) T12 3.5(0.117) 10 (1.83) T13 3.5(0.117) 11 (2.01) T14 3.5(0.117) 13 (2.37) T15 3.5(0.117) 5.5 (1.00) Repeat of T3
19.1.3 DURATION During each test the data acquisition system was run for 5 minutes, waves were started after a delay and run for 4 minutes.
19.1.4 DEPTH As with other tests, target depth was 1.372m. Actual depth for T1 was 1.344m and due to leakage from the tank this reduced to 1.340 over the duration of the series.
19.1.5 DAMPING Damping values are provided corresponding to a resistance applied across the terminals of a geared dc motor. Corresponding resistance and damping levels are as in the following table: Damping 1 2 3 4 Full Free Resistance 25 Ohm 10 Ohm 5 Ohm 3 Ohm Short
circuit Open Circuit
Damping was varied throughout each run as: Time (mins) 0-1 1-2 2-3 3 - 3.5 3.5 - 4
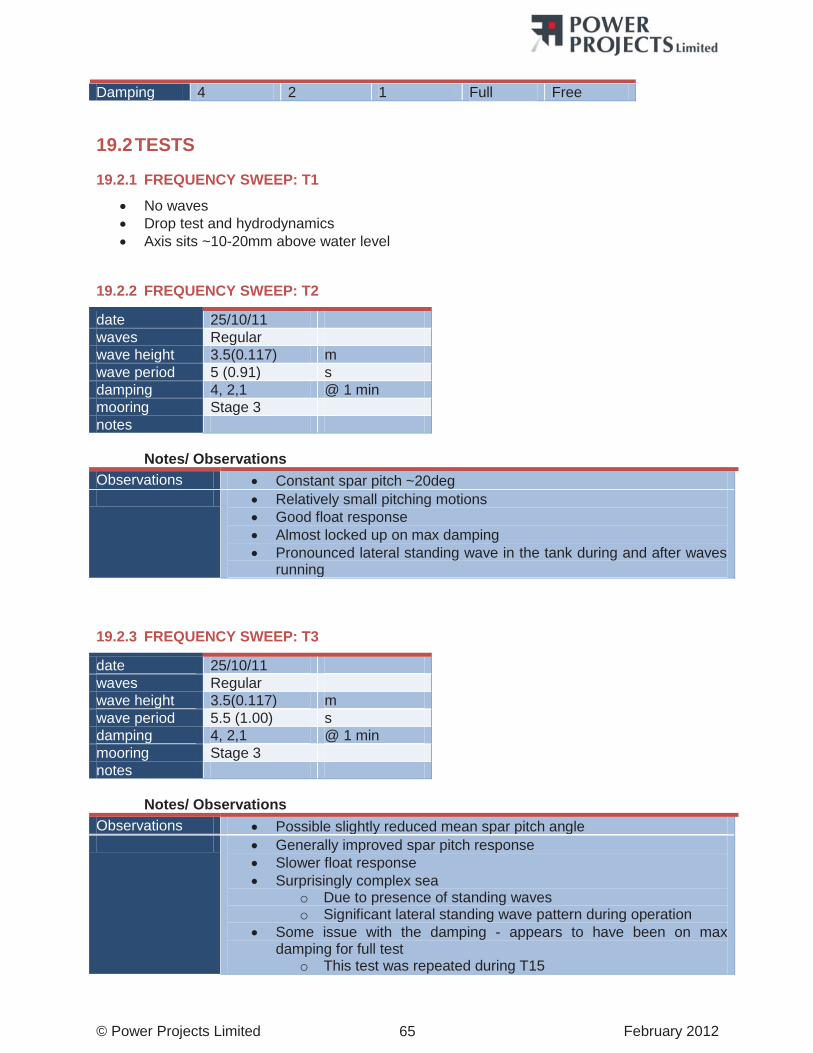
© Power Projects Limited February 2012 65
Damping 4 2 1 Full Free
19.2 TESTS
19.2.1 FREQUENCY SWEEP: T1
No waves Drop test and hydrodynamics Axis sits ~10-20mm above water level
19.2.2 FREQUENCY SWEEP: T2
date 25/10/11 waves Regular wave height 3.5(0.117) m wave period 5 (0.91) s damping 4, 2,1 @ 1 min mooring Stage 3 notes
Notes/ Observations Observations Constant spar pitch ~20deg Relatively small pitching motions
Good float response Almost locked up on max damping Pronounced lateral standing wave in the tank during and after waves
running
19.2.3 FREQUENCY SWEEP: T3
date 25/10/11 waves Regular wave height 3.5(0.117) m wave period 5.5 (1.00) s damping 4, 2,1 @ 1 min mooring Stage 3 notes
Notes/ Observations Observations Possible slightly reduced mean spar pitch angle Generally improved spar pitch response
Slower float response Surprisingly complex sea
o Due to presence of standing waves o Significant lateral standing wave pattern during operation
Some issue with the damping - appears to have been on max damping for full test
o This test was repeated during T15
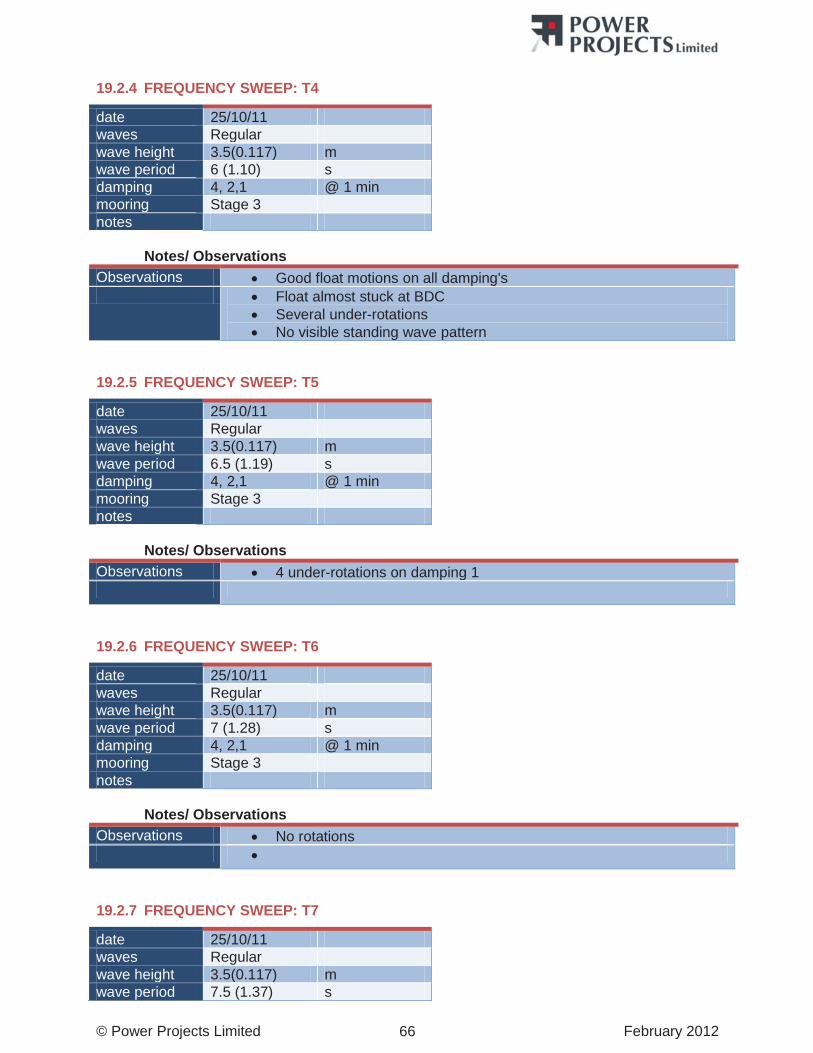
© Power Projects Limited February 2012 66
19.2.4 FREQUENCY SWEEP: T4
date 25/10/11 waves Regular wave height 3.5(0.117) m wave period 6 (1.10) s damping 4, 2,1 @ 1 min mooring Stage 3 notes
Notes/ Observations Observations Good float motions on all damping's Float almost stuck at BDC
Several under-rotations No visible standing wave pattern
19.2.5 FREQUENCY SWEEP: T5
date 25/10/11 waves Regular wave height 3.5(0.117) m wave period 6.5 (1.19) s damping 4, 2,1 @ 1 min mooring Stage 3 notes
Notes/ Observations Observations 4 under-rotations on damping 1
19.2.6 FREQUENCY SWEEP: T6
date 25/10/11 waves Regular wave height 3.5(0.117) m wave period 7 (1.28) s damping 4, 2,1 @ 1 min mooring Stage 3 notes
Notes/ Observations Observations No rotations
19.2.7 FREQUENCY SWEEP: T7
date 25/10/11 waves Regular wave height 3.5(0.117) m wave period 7.5 (1.37) s
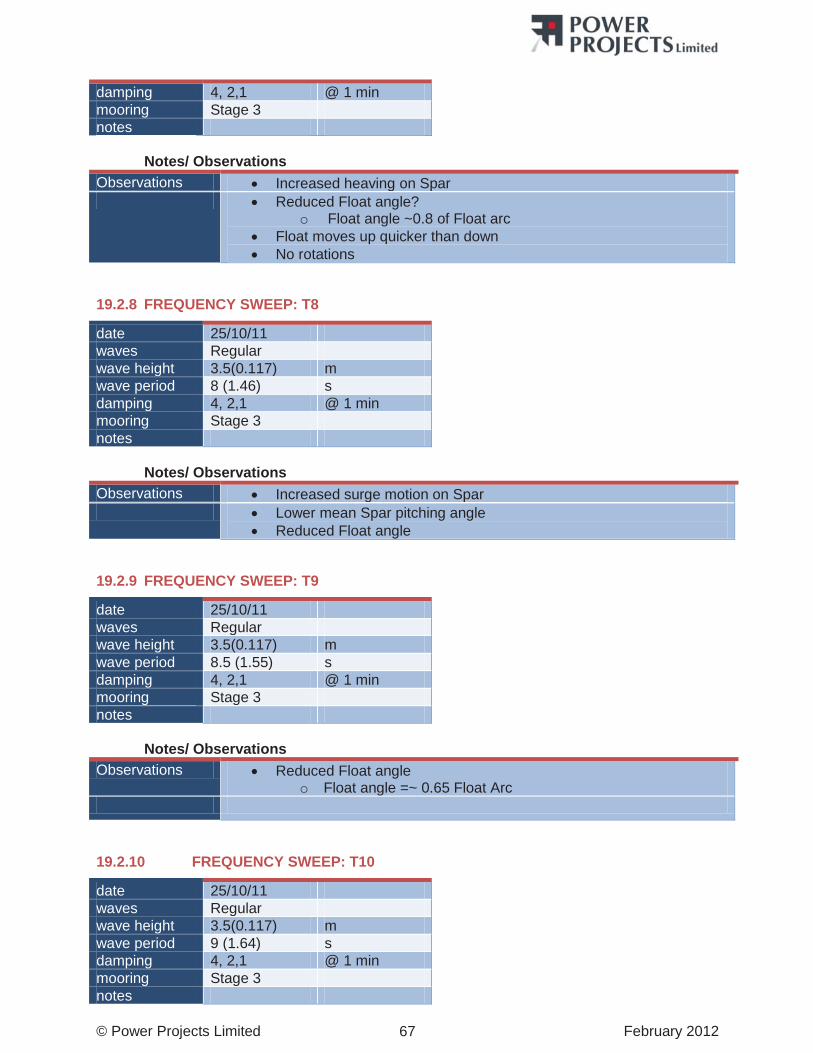
© Power Projects Limited February 2012 67
damping 4, 2,1 @ 1 min mooring Stage 3 notes
Notes/ Observations Observations Increased heaving on Spar Reduced Float angle?
o Float angle ~0.8 of Float arc Float moves up quicker than down No rotations
19.2.8 FREQUENCY SWEEP: T8
date 25/10/11 waves Regular wave height 3.5(0.117) m wave period 8 (1.46) s damping 4, 2,1 @ 1 min mooring Stage 3 notes
Notes/ Observations Observations Increased surge motion on Spar Lower mean Spar pitching angle
Reduced Float angle
19.2.9 FREQUENCY SWEEP: T9
date 25/10/11 waves Regular wave height 3.5(0.117) m wave period 8.5 (1.55) s damping 4, 2,1 @ 1 min mooring Stage 3 notes
Notes/ Observations Observations Reduced Float angle
o Float angle =~ 0.65 Float Arc
19.2.10 FREQUENCY SWEEP: T10
date 25/10/11 waves Regular wave height 3.5(0.117) m wave period 9 (1.64) s damping 4, 2,1 @ 1 min mooring Stage 3 notes
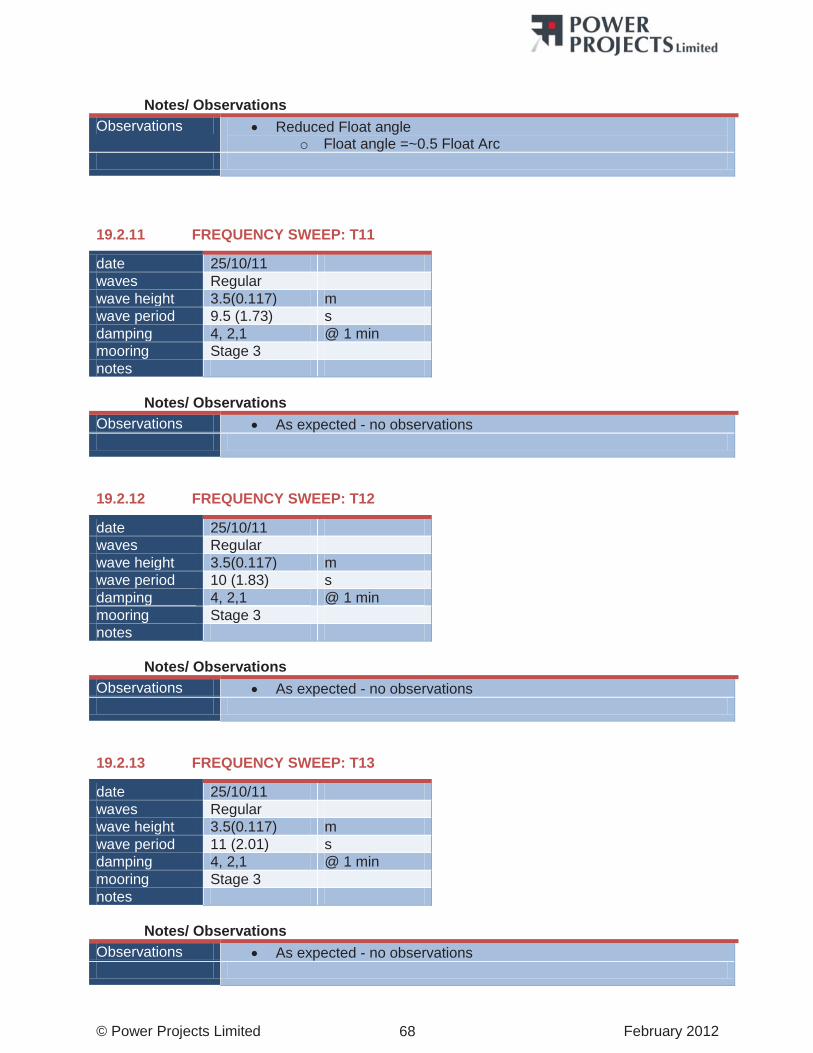
© Power Projects Limited February 2012 68
Notes/ Observations
Observations Reduced Float angle o Float angle =~0.5 Float Arc
19.2.11 FREQUENCY SWEEP: T11
date 25/10/11 waves Regular wave height 3.5(0.117) m wave period 9.5 (1.73) s damping 4, 2,1 @ 1 min mooring Stage 3 notes
Notes/ Observations Observations As expected - no observations
19.2.12 FREQUENCY SWEEP: T12
date 25/10/11 waves Regular wave height 3.5(0.117) m wave period 10 (1.83) s damping 4, 2,1 @ 1 min mooring Stage 3 notes
Notes/ Observations Observations As expected - no observations
19.2.13 FREQUENCY SWEEP: T13
date 25/10/11 waves Regular wave height 3.5(0.117) m wave period 11 (2.01) s damping 4, 2,1 @ 1 min mooring Stage 3notes
Notes/ Observations Observations As expected - no observations
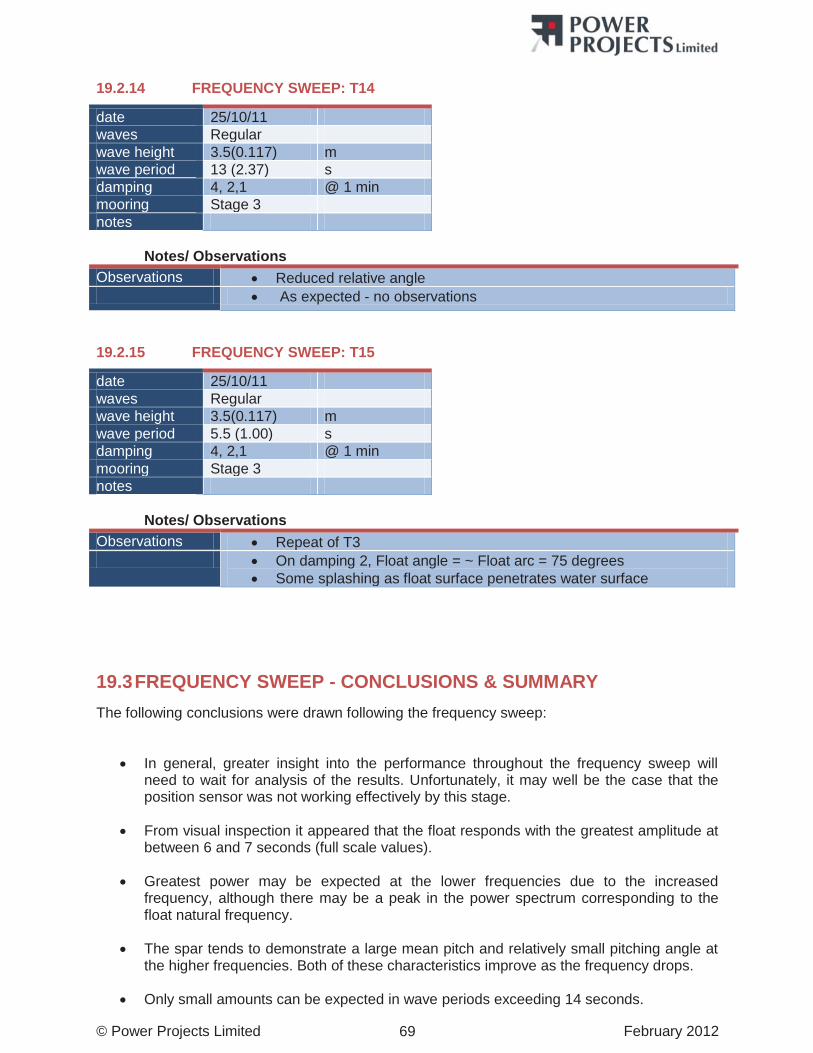
© Power Projects Limited February 2012 69
19.2.14 FREQUENCY SWEEP: T14
date 25/10/11 waves Regular wave height 3.5(0.117) m wave period 13 (2.37) s damping 4, 2,1 @ 1 min mooring Stage 3 notes
Notes/ Observations Observations Reduced relative angle As expected - no observations
19.2.15 FREQUENCY SWEEP: T15
date 25/10/11 waves Regular wave height 3.5(0.117) m wave period 5.5 (1.00) s damping 4, 2,1 @ 1 min mooring Stage 3 notes
Notes/ Observations Observations Repeat of T3 On damping 2, Float angle = ~ Float arc = 75 degrees
Some splashing as float surface penetrates water surface
19.3 FREQUENCY SWEEP - CONCLUSIONS & SUMMARY The following conclusions were drawn following the frequency sweep:
In general, greater insight into the performance throughout the frequency sweep will need to wait for analysis of the results. Unfortunately, it may well be the case that the position sensor was not working effectively by this stage.
From visual inspection it appeared that the float responds with the greatest amplitude at between 6 and 7 seconds (full scale values).
Greatest power may be expected at the lower frequencies due to the increased frequency, although there may be a peak in the power spectrum corresponding to the float natural frequency.
The spar tends to demonstrate a large mean pitch and relatively small pitching angle at the higher frequencies. Both of these characteristics improve as the frequency drops.
Only small amounts can be expected in wave periods exceeding 14 seconds.
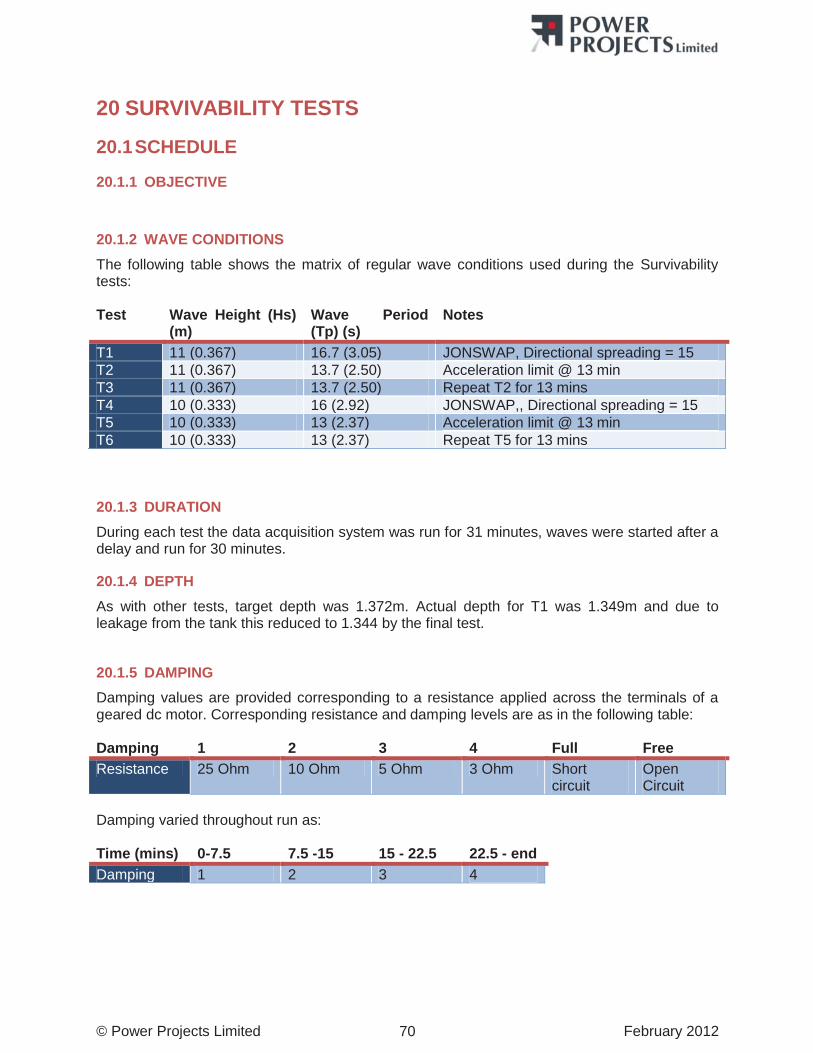
© Power Projects Limited February 2012 70
20 SURVIVABILITY TESTS
20.1 SCHEDULE
20.1.1 OBJECTIVE
20.1.2 WAVE CONDITIONS The following table shows the matrix of regular wave conditions used during the Survivability tests: Test Wave Height (Hs)
(m) Wave Period (Tp) (s)
Notes
T1 11 (0.367) 16.7 (3.05) JONSWAP, Directional spreading = 15 T2 11 (0.367) 13.7 (2.50) Acceleration limit @ 13 min T3 11 (0.367) 13.7 (2.50) Repeat T2 for 13 mins T4 10 (0.333) 16 (2.92) JONSWAP,, Directional spreading = 15 T5 10 (0.333) 13 (2.37) Acceleration limit @ 13 min T6 10 (0.333) 13 (2.37) Repeat T5 for 13 mins
20.1.3 DURATION During each test the data acquisition system was run for 31 minutes, waves were started after a delay and run for 30 minutes.
20.1.4 DEPTH As with other tests, target depth was 1.372m. Actual depth for T1 was 1.349m and due to leakage from the tank this reduced to 1.344 by the final test.
20.1.5 DAMPING Damping values are provided corresponding to a resistance applied across the terminals of a geared dc motor. Corresponding resistance and damping levels are as in the following table: Damping 1 2 3 4 Full Free Resistance 25 Ohm 10 Ohm 5 Ohm 3 Ohm Short
circuit Open Circuit
Damping varied throughout run as: Time (mins) 0-7.5 7.5 -15 15 - 22.5 22.5 - end Damping 1 2 3 4
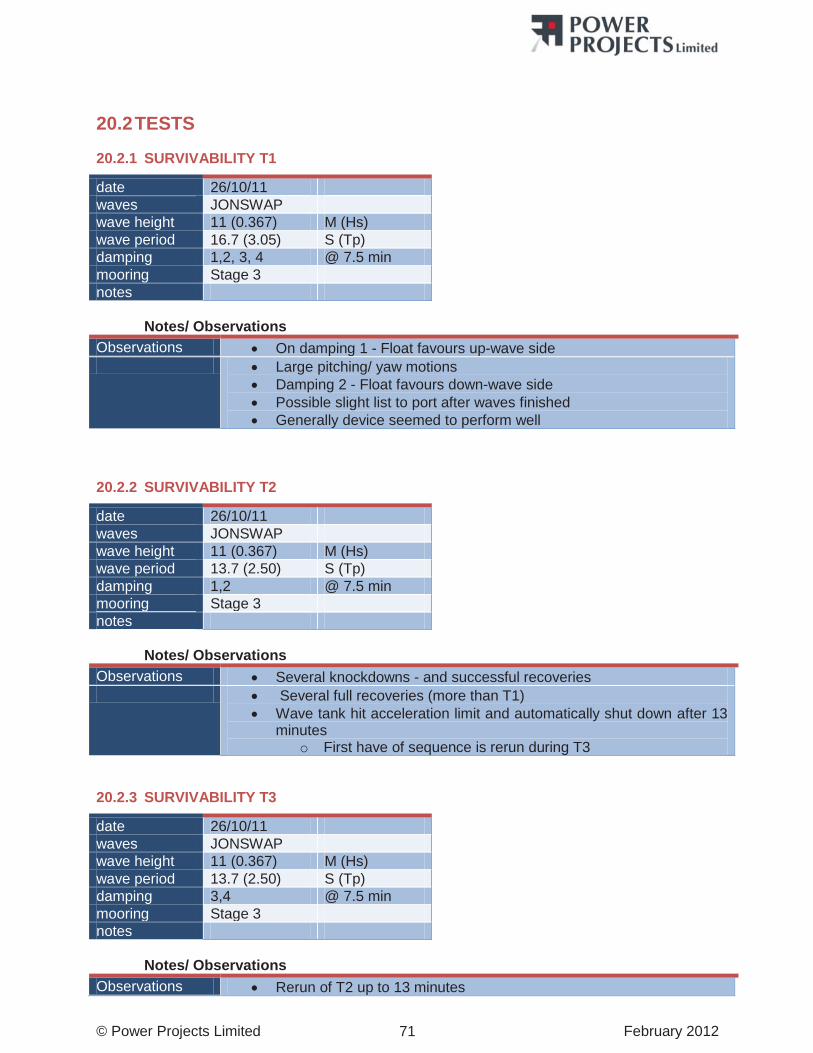
© Power Projects Limited February 2012 71
20.2 TESTS
20.2.1 SURVIVABILITY T1
date 26/10/11 waves JONSWAP wave height 11 (0.367) M (Hs) wave period 16.7 (3.05) S (Tp) damping 1,2, 3, 4 @ 7.5 min mooring Stage 3 notes
Notes/ Observations Observations On damping 1 - Float favours up-wave side Large pitching/ yaw motions
Damping 2 - Float favours down-wave side Possible slight list to port after waves finished Generally device seemed to perform well
20.2.2 SURVIVABILITY T2
date 26/10/11 waves JONSWAP wave height 11 (0.367) M (Hs) wave period 13.7 (2.50) S (Tp) damping 1,2 @ 7.5 min mooring Stage 3 notes
Notes/ Observations Observations Several knockdowns - and successful recoveries Several full recoveries (more than T1)
Wave tank hit acceleration limit and automatically shut down after 13 minutes
o First have of sequence is rerun during T3
20.2.3 SURVIVABILITY T3
date 26/10/11 waves JONSWAP wave height 11 (0.367) M (Hs) wave period 13.7 (2.50) S (Tp) damping 3,4 @ 7.5 min mooring Stage 3 notes
Notes/ Observations Observations Rerun of T2 up to 13 minutes
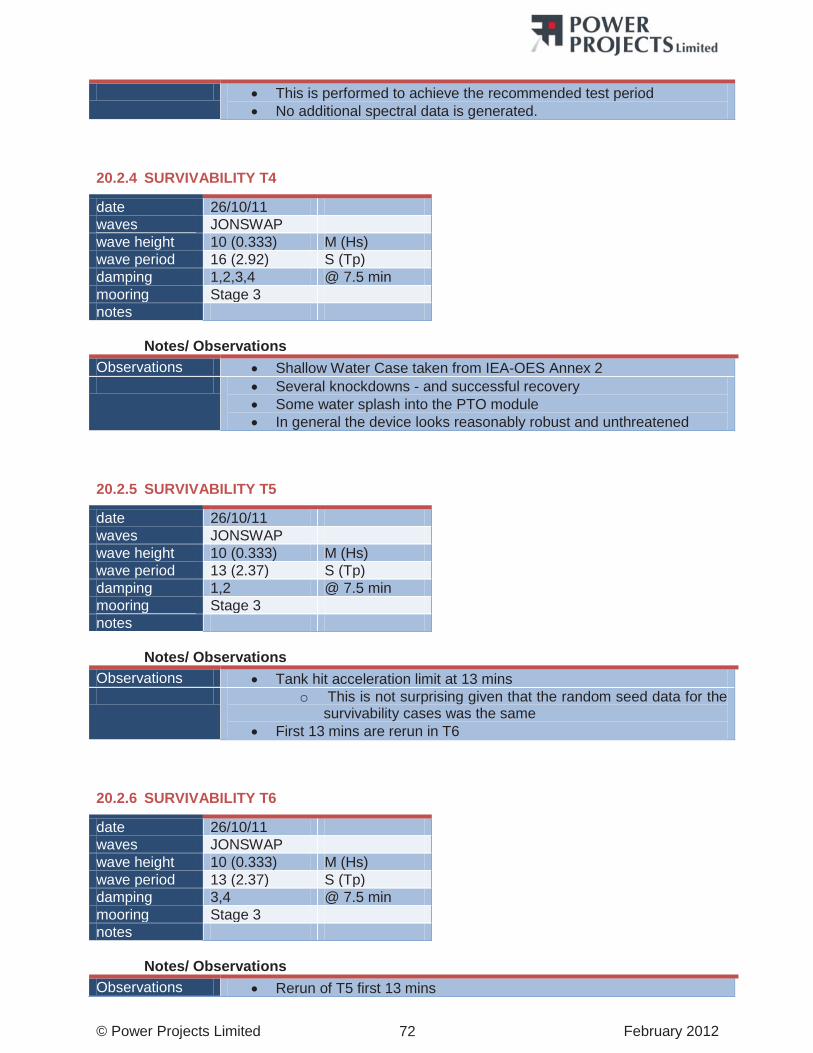
© Power Projects Limited February 2012 72
This is performed to achieve the recommended test period No additional spectral data is generated.
20.2.4 SURVIVABILITY T4
date 26/10/11 waves JONSWAP wave height 10 (0.333) M (Hs) wave period 16 (2.92) S (Tp) damping 1,2,3,4 @ 7.5 min mooring Stage 3 notes
Notes/ Observations Observations Shallow Water Case taken from IEA-OES Annex 2 Several knockdowns - and successful recovery
Some water splash into the PTO module In general the device looks reasonably robust and unthreatened
20.2.5 SURVIVABILITY T5
date 26/10/11 waves JONSWAP wave height 10 (0.333) M (Hs) wave period 13 (2.37) S (Tp) damping 1,2 @ 7.5 min mooring Stage 3 notes
Notes/ Observations Observations Tank hit acceleration limit at 13 mins o This is not surprising given that the random seed data for the
survivability cases was the same First 13 mins are rerun in T6
20.2.6 SURVIVABILITY T6
date 26/10/11 waves JONSWAP wave height 10 (0.333) M (Hs) wave period 13 (2.37) S (Tp) damping 3,4 @ 7.5 min mooring Stage 3 notes
Notes/ Observations Observations Rerun of T5 first 13 mins
© Power Projects Limited February 2012 73
While the device looks responsive, it does not look unduly threatened
Appears reasonably robust
20.3 SURVIVABILITY - CONCLUSIONS & SUMMARY Following the survivability tests, the following conclusions were drawn:
In general, the device performed well under the 4 survivability cases.
The acceleration limitation prevented the completion of the recommended tests.
It is likely that the device will be more sensitive to extreme waves when orientated at other angles to the incoming waves. Time constraints prevented further investigation of these scenarios during this set of tests although this would be recommended during future tests.
The provision of mooring load cells would provide useful information during future survivability testing.
The tests completed here were based on those recommended by IEA -OES Annex 2. It is conceivable (likely) that an actual wave site (including the proposed Oregon site) would have extreme wave in excess of those proposed in these guidelines. It is recommended that further tests be completed when greater clarity is available for the actual test centre conditions.
© Power Projects Limited February 2012 74
21 FINAL CONCLUSIONS AND RECOMMENDATIONS FOR FUTURE WORK
21.1 CONCLUSIONS These tests provided a useful and comprehensive set of tank tests that will provide a useful set of data for future analysis and development of the WET-NZ wave energy converter. The following broad conclusions can be drawn:
Initial indications are that the WET-NZ is a promising wave energy converter that performs effectively across a wide range of sea states.
The data gained through these tests should be sufficient to validate, or otherwise, existing numerical simulations of the device performance.
Video footage taken during the tests will be useful for marketing and investment collateral
21.2 RECOMMENDATIONS
21.2.1 CONCEPTUAL MODIFICATIONS As a result of these tests several opportunities for advantageous conceptual modifications were identified. These are summarised:
The sloped spar as detailed in Spar Config 4 represents an interesting modification that could usefully improve the spar dynamics without adding significantly to the overall structure cost.
The circular float appears to offer significant opportunity for yield enhancement
21.2.2 RECOMMENDATIONS FOR FUTURE TANK TESTING During the ongoing development of the WET-NZ device there will be a requirement for further tank testing. Some recommendations for future tests are presented here:
Mooring and umbilical interaction o Investigation using correctly scaled mooring systems and the umbilical
attachment o Ideally including some form of mooring load cell
Conceptual Modifications o More detailed investigation of some of the conceptual modifications presented in
the previous section. Specific Sea States and Survivability
o Detailed investigation of performance and survivability given real site data