Embed Size (px)
Citation preview

August 1994
U. S. Department of the Interior Fish and Wildlife Service Region 5
ISS

Wetland Status and Trends in St. Marys Comty, Maryland (1981-82 to 1988-89)
by David B. Foulis and Ralph W. Tmer u.s. Fish and Wildlife Service
Ecological Services Region 5
Hadley,:Massachusetts 01035
Prepared for the Maryland 1Jepn1;nm of Natural Resoun:::es
Water ResouJ:ces Administration Nontidal Wetlands Division Annapolis, Mrry1ml 21401
August 1994
IN1RODUCI10N
Wetlands are subjected to multiple impacts, both natural and human-induced They may change from one type to another, e.g., emergent wetland to scrub-shrub wetland, due to natural succession or to nrinor filling or drainage. Wetlands are also destroyed directly or indirectly by human activities. Most wetlands, however, change gradually over long periods of time. Knowledge of wetland losses and gains is imrx>rtant for evaluating the effectiveness of goverrnnent programs and policies designed to protect wetlands, and for developing strategies to reverse undesirable trends.
The Maryland Department of Natural Resources, Water Resources Administration provided fimding to initiate county-based wetland trends studies in Maryland These studies identify the extent and nature of wetland alterations for designated local areas.
The purpose of this report is to present the findings of the wetland trends analysis study for st. Marys County, Maryland
S1UDY AREA
The study area is St Marys Comty, Matylan~ situated on the Atlantic Coastal Plain and bordering Chesapeake Bay, the Potomac River, the Wicomico River, and the Patuxent River (Figure 1). The County has a land surface area of approximately 373 square miles (Hoffinan 1992). The study area encompasses 23 large-scale (1:24,000) U.S. Geological Smvey topographic quadrangles: Barren Islan~ Benedict, Broomes Islan~ Burgess, Burgess East, Charlotte Hall, East Point Lookout, Heathsville, Hollyw~ Hughesville, Kinsale, Leonardtown, Mechanicsville, Piney Point, Point Lookout, Point No Point, Richland Point, Rock Point, S1. Clements Island, St Georges Island, St Marys City, Solomons Islan~ and Stratford Hall.
MEIHODS
Wetland trends analysis involves comparing aerial photography from at least two time periods. For the present study, aerial photos from 1981-82 and from 1988-89 were examined and compared to determine the extent of the wetland changes Oosses, gains, or changes in type) that occmred during that time period in St Mmys County.
The 1981-82 photography was 1 :58,000 scale color infrared aerial photography acquired by the National High Altitude Photography Program (NHAP). The 1988-89 photography was 1 :40,000 scale color infrared aerial photography acquired by the National Aerial Photography Program (NAPP). Wetlands and deepwater habitats were interpreted on
1

the NHAP photography and classified according to the Service's official wetland classification system (Cowardin, ~.al. 1979) following standard National Wetlands Inventory (NWI) mapping conventions (National Wetlands Inventory, 1990). These interpretations setVed as the basis for evaluating recent wetland trends.
The two sets of photographs were compared using a Bausch and Lomb SI8-95 zoom stereoscope. Changes were delineated on mylar overlays attached to the NAPP photographs. Cause of change was recorded for each polygon. The minimwn mapping lDlit for wetlands was generally 0.5 acre, except for ponds, which were mapped when 0.1 acre or larger in size. Changes as smaIl as 0.1 acre were detected. Wetland bOlmdaries were improved and previously tmdetected wetlands were added to the original maps because the larger scale and more apparent signs of wetland hydrology of the NAPP photos improved our ability to detect and classify wetlands. Delineated changes and map refinements were then transferred to an NWI map using an Ottico Meccanica 1taliana stereo facet plotter. Quality control of all photointerpretation was performed by a second photointerpreter. Tables were then prepared to present the study's findings.
RESULTS
In 1988-89, St Mnys County contained about 16,730 acres of wetlands (roughly 7% of the Cotmty's land surface), excluding linear fringing wetlands along narrow streams. Table 1 swnmarizes the acreage of the different wetland types fotmd in the County. Palustrine wetlands predominated with 10,076 acres, representing 60.2% of the Cotmty's total wetland acreage. Forested wetlands accounted for 86.6% (8, 723 acres) of all palustrine wetlands, and about 52.1 % of the IPlunty'S wetland total. Tidal palustrine wetlands totaled 1,324 acres, representing 13.1% of the Cotmty's freshwater wetlands.
Estuarine wetlands comprise about 39.6% (6,629 acres) of the Cotmty's wetlands. Emergent wetlands (e. g., salt and brackish marshes) were the predominant vegetated type, accounting for almost 90.2% (3, 142 acres) of the County's estuarine vegetated wetlands.
Recent Wedand 'funds
Wetland trends results are presented in Tables 2 through 9. The following discussion highlights the more significant or interesting findings.
Vegetaed Wetlaufs
Between 1981-82 and 1988-89, over 49 acres of vegetated wetlands were converted to upland (Table 2). Most of these losses affected palustrine forested wetlands. _ Housing and agriculture were the most significant causes of vegetated wetland loss, with connnercial construction also significant (Table 3). About 154 acres of vegetated wetland changed from
2
" ,
one type to another. Upland conversion impacted the temporarily flooded palustrine wetland type more than others (Table 4). Approximately 232 acres of palustrine forested wetlands were converted to upland or changed to other wetland types (Table 5). Vegetated wetland gain from upland was limited to approximately 11 acres (Table 6). Most gains in particular types of vegetated wetlands came from other vegetated wetland types (Table 6). Beaver activity affected 118 acres of vegetated wetlands (Table 7).
Nonvegetated Wetlands
About 119 acres of new ponds were created from upland, and over 39 acres were constructed in vegetated wetlands (Table 8). More than 7 acres of ponds were converted to upland, while 39 acres changed to vegetated wetlands. Approximately 63% of the new ponds built in uplands were the result of fann pond construction (Table 9).
CONCLUSION
The County had approximately 7% of its land mass covered by wetlands. Wetlands totaling 16,730 acres (in 1988-89) were identified in the County by the Service's National Wetlands Inventory. Palustrine wetland was the dominant typt; representing 60.2% of the wetlands in the Colmty.
Between 1981-82 and 1988-89, the County lost about 143 acres of vegetated wetlands, with roughly 49 acres converted to upland. Temporarily flooded wetland was the type most frequently converted to upland Pond construction added about 158 acres of palustrine nonvegetated wetlands, but this gain was reduced to about 111 acres by pond losses to upland and vegetated wetlands.
The overall trend for the County's wetlands was losses of vegetated wetlands and gains in nonvegetated wetlands (mostly ponds). The significance of the increase in ponds to fish and wildlife species has not been assessed and remains a point for discussion The losses of vegetated wetlands, however, represent known losses of valuable fish and wildlife habitats and areas providing other valued fimctions, including flood water storage, water quality enhancement, and local water supply.
While this report. docmnents recent trends in the Colmty's wetlands, it does not address changes in the quality of the remaining wetlands. As development increases, the quality of wetlands can be expected to deteriorate due to agricultural nmoff, increased sedimentation, grmmdwater withdrawals, increased water pollution, and other factors, unless adequate safeguards are taken to protect not only the existence of wetlands, but their quality.
3

ACKNOWLEDGMENTS
FlUlding for this project was provided by the Maryland Department ofNaturaI Resources, Water Resources Administration through an existing cooperative agreement with the Setvice. David G. Burke was the project coordinator, and we appreciate his interest in monitoring wetland trends in :Maryland.
Wetland maps and digital data were compiled by the U.S. Fish and Wildlife Service's National Wetlands mventory Office at St. Petersburg, Florida. Special appreciation is extended to Becky Stanley and Linda Shaffer for their assistance. Photointerpretation was performed by the senior author and quality control1ed by Glenn Smith. John Eaton compiled trend statistics, tables, and graphics for this report. Todd Nuerrninger tabulated mw data.
REFERENCES
Cowardin, L.M, V. Carter, F.e. Golet, and T. LaRoe. 1979. Classification of Wetlands and Deepwater Habitats of the United States. U.S. Fish and Wildlife Service, Washington, DC. FWS/OBS-79131. 103 pp.
Hoffinan, MS. (editor). 1992. The World Almanac and Book of Facts. Newspaper Entelprise Association, me., New York, NY. 960 pp.
National Wetlands mventory. 1990. Photointerpretation Conventions for the National Wetlands Inventory. U.S. Fish and Wildlife Service, S1. Petersburg, FL. 45 pp. plus appendices.
4

Figure 1. Location of Study Area - St. Marys County r Maryland.
Prince Georges County
Hughesville Benedict
I------J~r.;;.;~!:::':l"!~--il--- Calvert County
Broomes Islilno
'------ Virginia ~
Heathsville
5

'ThbIe 1. Acreage of wetland types in St Marys County, Muyland (1988-89).
%of WetJandType Thtal
PALUS1RINE WEIlANDS
Tidal Emergent Seasonally Flooded· Tidal 48.7 Temporarily Flooded-Tidal 6.3 (Subtotd Tidd) (55.0) 0.3
Nontidal Fmergent Semipennanently Flooded 20.2 Se3sonally Flooded/Saturated 167.5 Seasonally Flooded 51.2 Saturated 3.1 Temporarily Flooded 110.2 (Subtotd Nontidd) (352.2) 2.1
Totd Palustrine Emergent Wetlanik 407.2 2.4
Tidal Forested Deciduous, Broad-leaved 1,026.5 Evergn;:en, Needle-leaved 89.7 (Subtotd Tidd) (1,116.2) 6.7
Nontidal Forested Evergreen, Needle-leaved
Seasonally Flooded/Saturated 8.2 Seasonally Flooded 25.1 Temporarily Flooded 282.8
Deci~ Broad-leaved Seasonally Flooded/Saturated 476.6 Seasonally Flooded 1,388.4 Temporarily Flooded 5,382.5 Semipe.nnanently Flooded 6.4
IX-ad 36.1 (Subtotd Nontidd) (l,60Z2) 45.5
Total Palustrine Forested Wetlanik 8,723.4 52.1
6

Table 1, continued %of
Wetland Type Thtal
Tidal Scrub-Sbrub Deciduous, Broad-leaved
Temporarily Flooded-Tidal 4.3 Seasonally Flooded-Tidal 148.3 Semipermanently Flooded-TIdal 0.4 (Sublolci Tidd) (153.0) 0.9
Nontidal Scrub-Shrub Deciduous, Broad-leaved
Seasonally Flooded/Saturated 118.9 Seasonally Flooded 48.2 Temporarily Flooded 13.5 Semipennanently Flooded 14.9 (Subtotd NonJidd) (195.5) 1.2
Tobl Palustrine Scrub-Shrub Wetlruxh 348.5 2.1
Aquatic Bed 6.6
Tobl Palustrine Vegetated Wetlruxh 9,485.7 56.7
Unconsolidated Bottom (ponds) 587.8 Unconsolidated Shore 2.5
Tobl Palustrine NOlJVegetated ~tlruxh 590.3 5.9
GRAND 1UrAL PAllJSIRINE WEIIANDS 10,076.0 60.2
ES1UARINE WEIIANDS
Emergent Regularly Flooded 4.8 hreguIarly Flooded 2,304.6 Regularly Flooded, Oligohaline 7.0 Irregularly Floode4 Oligohaline 784.8 Unknown, Oligohaline 40.4
Tobl Estuarine Emergent Wetlamh 3,141.6 18.8
7
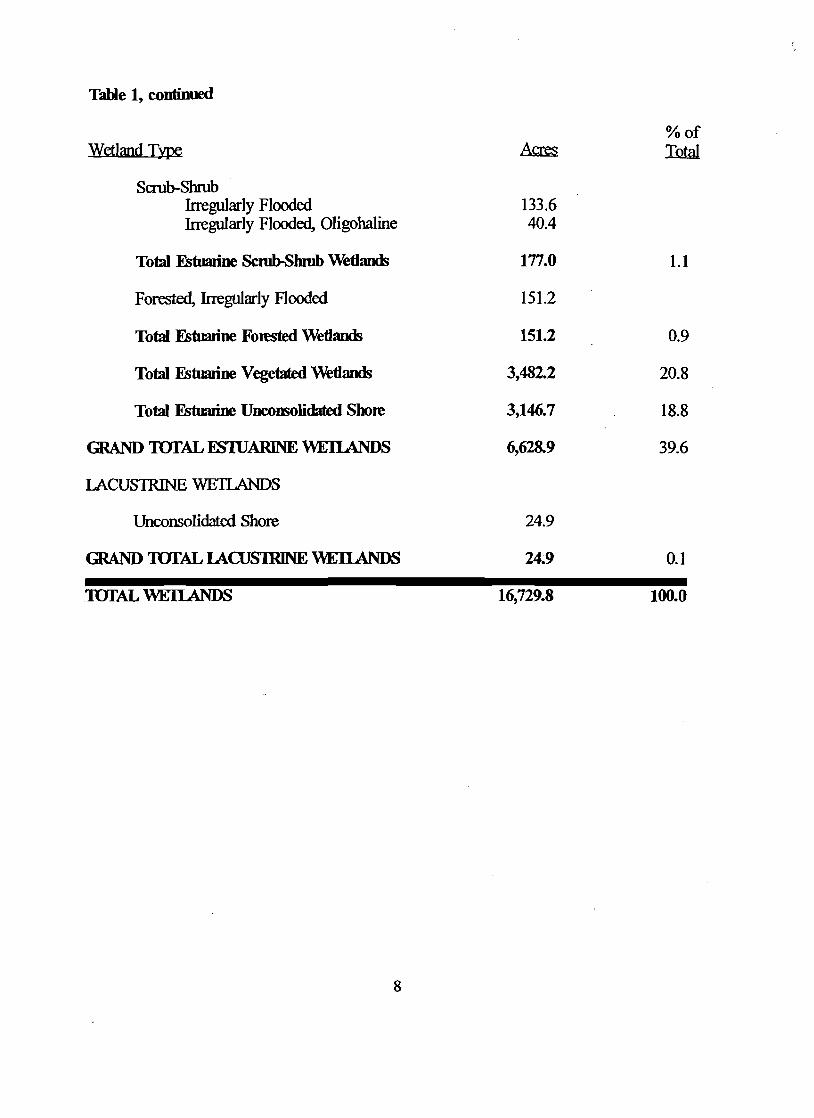
Table 1, continued
%of Wetland Type Thml
Scrub-Sluub Irregularly Flooded 133.6 Irregularly Flooded, Oligohaline 40.4
Total Estuarine Scrub-Sbrub Wetlands 177.0 1.1
Forested, Irregularly Flooded 151.2
Total Estuarine Forested Wetlands 151.2 0.9
Total Estuarine Vege1ated Wetlarm 3,482.2 20.8
Total Estuarine Uncomolidated Shore 3,146.7 18.8
GRAND IDrALFmUARlNE ~ 6,628.9 39.6
IACUSTRINE WETIANDS
lfuconsolidated Shore 24.9
GRAND IDrALIAUJSIRINE ~ 24~9 0.1
1UfAL~ 16,729.8 100.0
8

Table 4. Conversion of hydrologically similar ptlust:r:iIE vegetated wetl3lX& to upland in St:Marys County, Muyland (1981-82 to 1988-89).
Palustrine Wetland Type ~ % Total Loss
Semipermanently Flooded 0.5 1.0
Temporarily Flooded 35.5 77.0
Seasonally Flooded 7.1 15.0
Seasonally Flooded/Saturated 2.5 6.0
SeasonaJly Flooded-TIdal JM ~
Total 46.0 100.0%
Table 5. (hmges in ptlmbine forested wetlanck in St Muys County, Muyland (1981-82 to 1988-89).
Changed to Converted to Other Wetland Total Loss
Forested Wetland Type Upland (acres) Types* (acres) (acres)
Seasonally Flooded/Saturated 2.5 24.8 27.4
Seasonally Flooded 2.4 7.1 9.5
Temporarily Flooded 32.7 98.1 130.8
Semipennanently Flooded 0.0 15.4** 15.4
Seasonally Flooded-Tidal 0.4 46.4 46.7
Temporarily Flooded-TIdal .Jll! ....22 -22
Total 38.0 194.0 232.0
*Includes both changes in wetland class (e.g., forested to emergent) and changes in water regime within a given wetland class.
**10.9 acres of this total are dead fon:st:ed wetlands.
10

Table 6. Gains in vegetated wetland; in St Muys County, Muyland (1981-82 to 1988-89).
Gain from Gain from Nonvegetated Gain from Other Vegetated
Wetland Type Wetlands (acres) Upland (acres) Wetlands (acres)*
Palustrine Emergent** 34.3 1.3 71.9
Palustrine Scrub-Shrub** 5.0 0.0 45.8
Palustrine Forested 0.0 6.8 0.0
Palustrine Aquatic Bed 0.0 0.3 0.0
Estuarine Scrub-Shrub 0.0 0.0 35.9
Estuarine Forested ..M ..22 -.JU!
Total 39.3 11.3 153.6
*Represents changes in class (e.g., emergent to scrub-shrub) but not changes in water regime within a given class.
** Also, 2.3 acres of palustrine emergent wetlands and 3.9 acres of palustrine scrub-shrub wetlands were created from deepwater habitat
Table 7. OJanges of wetlands in St Muys County, Maryland due to beaver activity (1981-82 to 1988-89) •
.. Change in Water Change in Vegetated Gain from Wetland Type Regime Only (acres) Class (acres) Upland (acres)
Palustrine Emergent 0.9 0.7 0.0
Palustrine Scrub-Slnub 0.0 3.9 6.8
Palustrine Forested 73.3 26.3 0.0
Estuarine Emergent 0.0 2.3 0.0
Estuarine Scrub-Shrub JW ...12 M
Total 74.2 37.1 6.8
11

Table 8. Gaim and losses in nonvegefated wetlands in St l\fmys County, Maryland (1981-82 to 1988-89).
* Also, 6.4 acres of estuarine lUlconsolidated shore were gained from estuarine deepwater habitat due to coastal erosion and deposition and beach nourishment projects.
**Due to coastal erosion and deposition.