Embed Size (px)
Citation preview
WEYERHAEUSER
RAYMOND JAMES
39TH ANNUAL INSTITUTIONAL
INVESTORS CONFERENCE
March 7, 2018 | Orlando, FL
Doyle Simons, CEO
FORWARD-LOOKING STATEMENTSAND NON-GAAP FINANCIAL MEASURES
2
This presentation contains statements and depictions that constitute forward-looking statements within the meaning of the Private Securities
Litigation Reform Act of 1995, as amended, including, without limitation, with respect to future goals and prospects, business strategies, revenues,
earnings, cash flow, taxes, adjusted EBITDA, production, supply, dividend levels, share repurchases, business priorities, performance, cost
reductions and eliminations, operational excellence initiatives and goals, asset and portfolio review, quantitative and qualitative demand drivers and
levels for our products, competition and supply factors, pricing, margins, growth, housing markets, capital structure, financial ratios, credit ratings,
capital expenditure priorities, cash position, debt levels, harvests, and export markets, including future Canadian share of U.S. lumber markets.
Forward-looking statements can be identified by the fact that they do not relate strictly to historical or current facts. Forward-looking statements may
be identified by our use of certain words in such statements, including without limitation words such as “anticipate,” “believe,” “continue,”
“continued,” “could,” “forecast,” “estimate,” “outlook,” “goal,” “will,” “plan,” “expect,” “target,” “would” and similar words and terms and phrases using
such terms and words, while depictions that constitute forward-looking statements may be identified by graphs, charts or other illustrations indicating
expected or predicted occurrences of events, conditions, performance or achievements at a future date or during future time periods. We may refer
to assumptions, goals or targets, or we may reference expected performance through, or events to occur by or at, a future date, and such
references may also constitute forward-looking statements. Forward-looking statements are based on management’s current expectations and
assumptions concerning future events, and are inherently subject to uncertainties and factors relating to our operations and business environment
that are difficult to predict and often beyond the company’s control. These and other factors could cause one or more of our expectations to be
unmet, one or more of our assumptions to be materially inaccurate or actual results to differ materially from those expressed or implied in our
forward-looking statements. Such factors include, without limitation: our ability to successfully execute our performance plans, including cost
reductions and other operational excellence initiatives; the effect of general economic conditions, including employment rates, housing starts,
interest rate levels, availability of financing for home mortgages and the strength of the U.S. dollar; market demand for our products, including
demand for our timberland properties with higher and better uses, which in turn is related to the strength of various U.S. business segments and
U.S. and international economic conditions; domestic and foreign competition; raw material prices; energy prices; the effect of weather; the risk of
loss from fires, floods, windstorms, hurricanes, pest infestation and other natural disasters; transportation availability and costs; federal tax policies;
the effect of forestry, land use, environmental and other governmental regulations; legal proceedings; performance of pension fund investments and
related derivatives; the effect of timing of retirements and changes in market price of our common stock on charges for share-based compensation;
changes in accounting principles; and other factors described in filings we make from time to time with the Securities and Exchange Commission,
including without limitation the risk factors described in our annual report on Form 10-K for the year ended December 31, 2017. There is no
guarantee that any of the anticipated events or results articulated in this presentation will occur or, if they occur, what effect they will have on the
company’s results of operations or financial condition. The forward-looking statements contained herein apply only as of the date of this presentation
and we do not undertake any obligation to update these forward-looking statements. Nothing on our website is intended to be included or
incorporated by reference into, or made a part of, this presentation.
Also included in this presentation are certain non-GAAP financial measures, which management believes complement the financial information
presented in accordance with U.S. generally accepted accounting principles. Management believes such non-GAAP measures may be useful to
investors. Our non-GAAP financial measures may not be comparable to similarly named or captioned non-GAAP financial measures of other
companies due to potential inconsistencies in how such measures are calculated. A reconciliation of each presented non-GAAP measure to its most
directly comparable GAAP measure is provided in the appendices to this presentation.
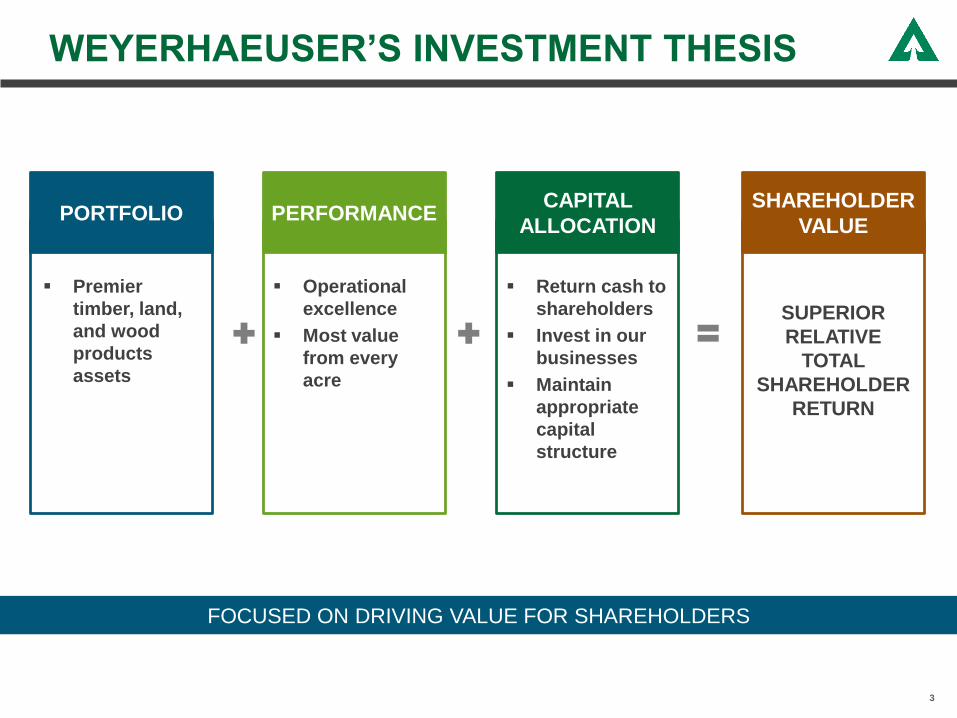
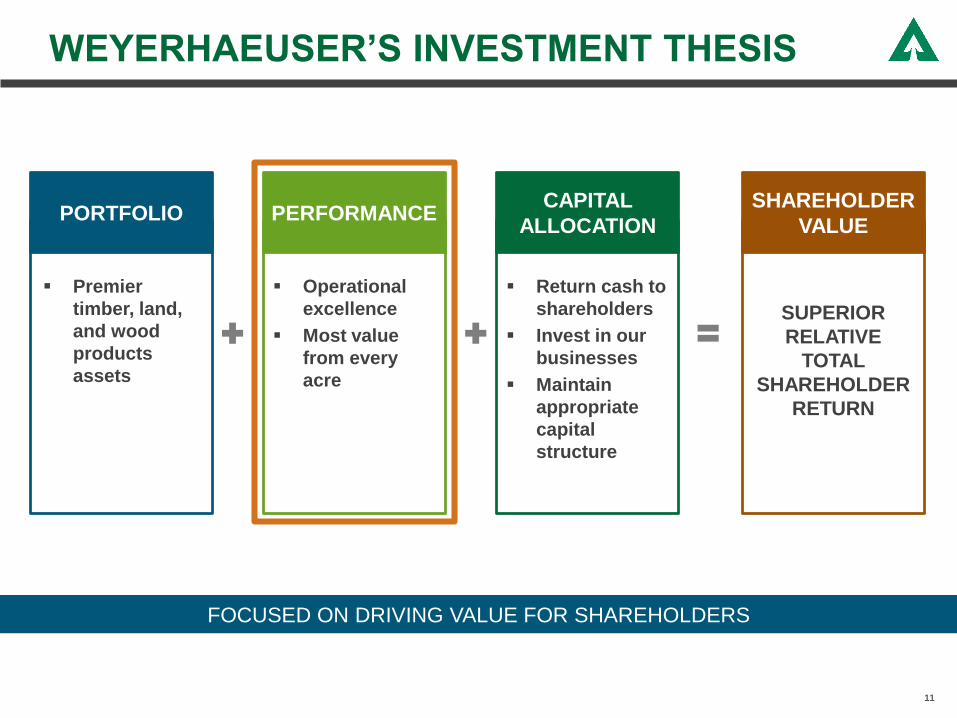
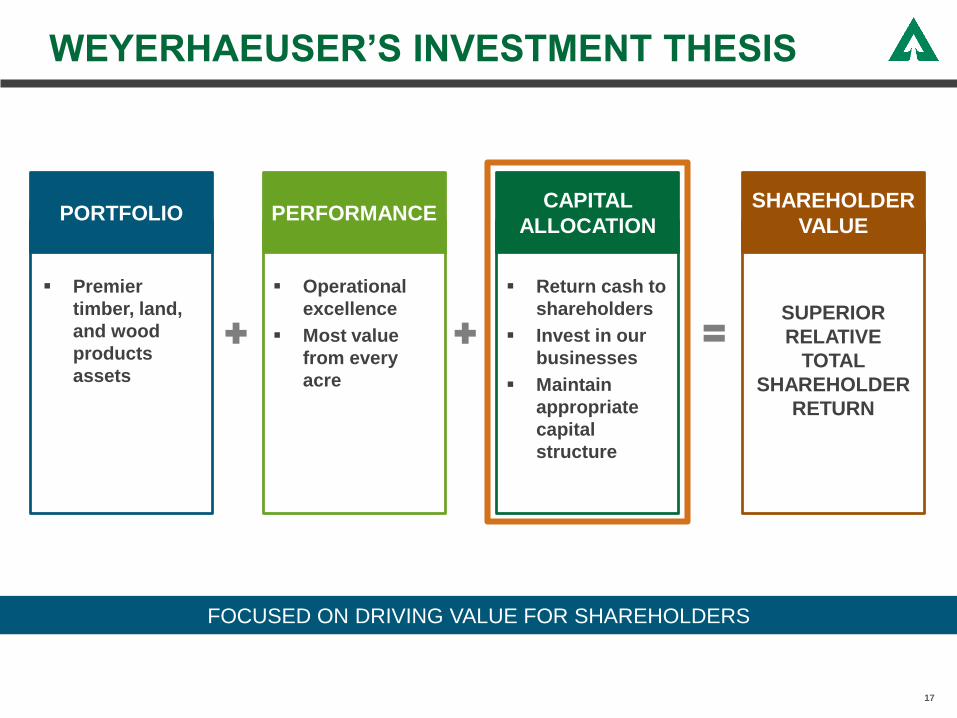
WEYERHAEUSER’S INVESTMENT THESIS
FOCUSED ON DRIVING VALUE FOR SHAREHOLDERS
▪ Operational
excellence
▪ Most value
from every
acre
▪ Return cash to
shareholders
▪ Invest in our
businesses
▪ Maintain
appropriate
capital
structure
▪ Premier
timber, land,
and wood
products
assets
SUPERIOR
RELATIVE
TOTAL
SHAREHOLDER
RETURN
PORTFOLIO PERFORMANCECAPITAL
ALLOCATION
SHAREHOLDER
VALUE
3
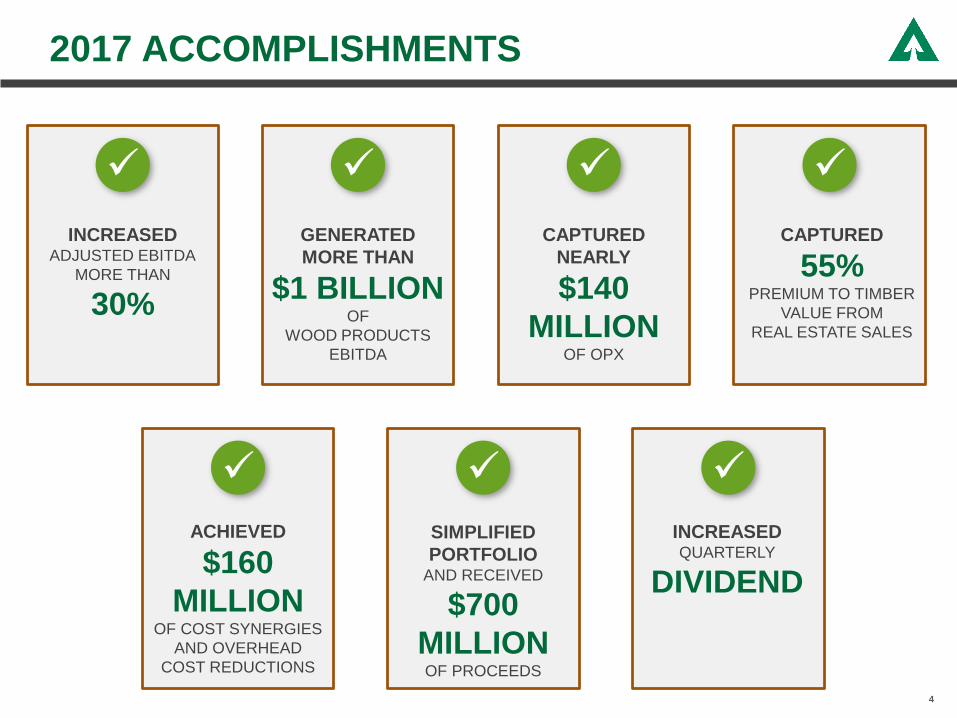
2017 ACCOMPLISHMENTS
4
ACHIEVED
$160
MILLIONOF COST SYNERGIES
AND OVERHEAD
COST REDUCTIONS
SIMPLIFIED
PORTFOLIOAND RECEIVED
$700
MILLIONOF PROCEEDS
GENERATED
MORE THAN
$1 BILLIONOF
WOOD PRODUCTS
EBITDA
INCREASEDADJUSTED EBITDA
MORE THAN
30%
CAPTURED
NEARLY
$140
MILLIONOF OPX
✓
INCREASEDQUARTERLY
DIVIDEND
✓ ✓ ✓
✓ ✓ ✓
CAPTURED
55%PREMIUM TO TIMBER
VALUE FROM
REAL ESTATE SALES
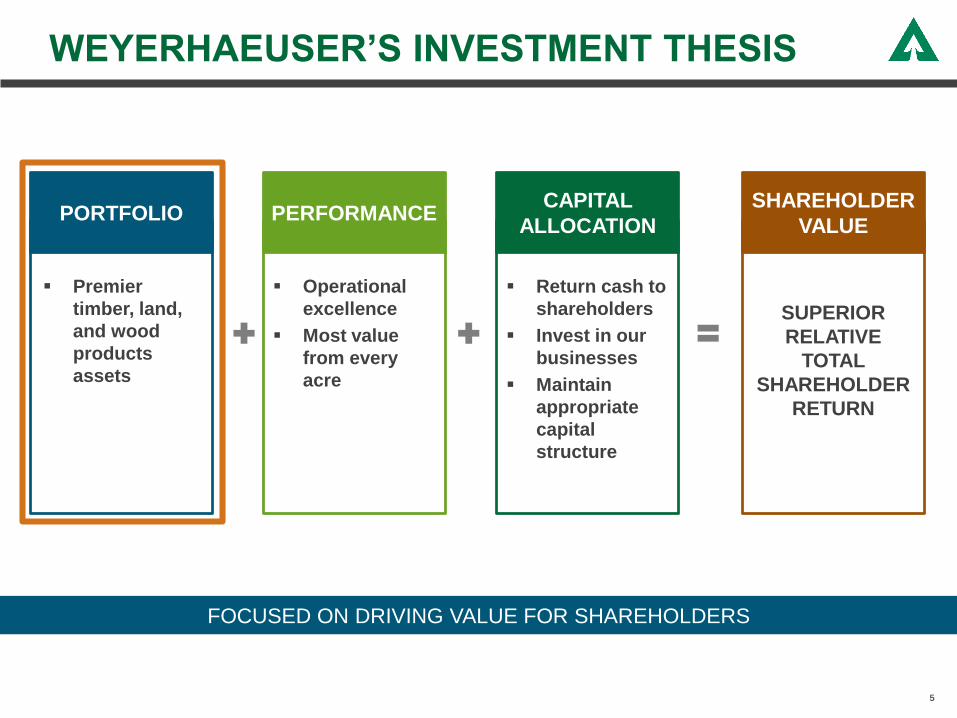
WEYERHAEUSER’S INVESTMENT THESIS
FOCUSED ON DRIVING VALUE FOR SHAREHOLDERS
▪ Operational
excellence
▪ Most value
from every
acre
▪ Return cash to
shareholders
▪ Invest in our
businesses
▪ Maintain
appropriate
capital
structure
▪ Premier
timber, land,
and wood
products
assets
SUPERIOR
RELATIVE
TOTAL
SHAREHOLDER
RETURN
PORTFOLIO PERFORMANCECAPITAL
ALLOCATION
SHAREHOLDER
VALUE
5
0
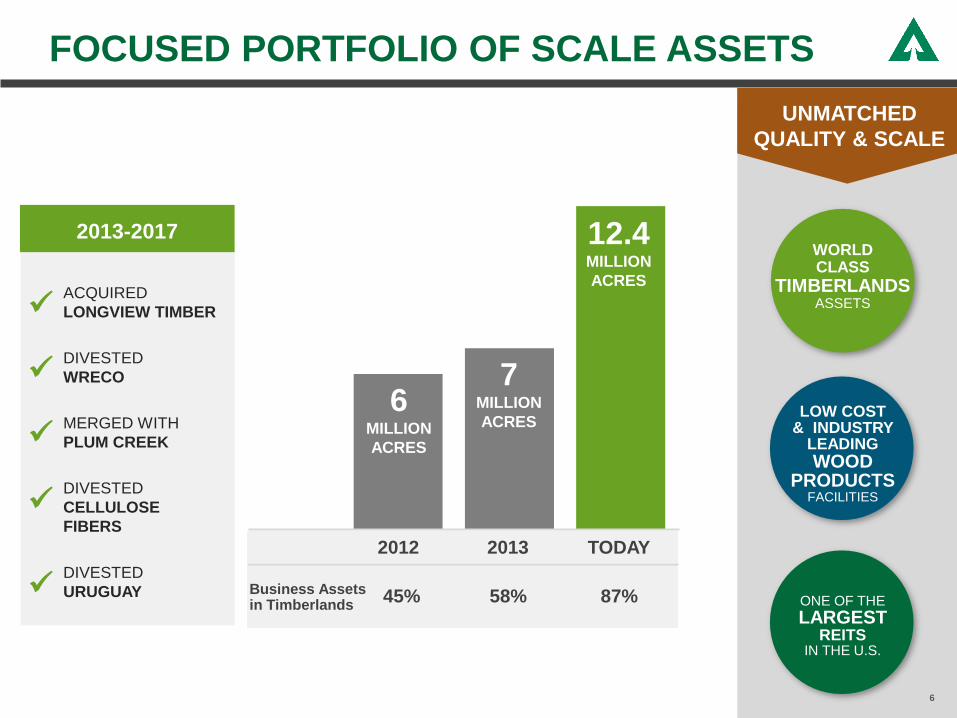
FOCUSED PORTFOLIO OF SCALE ASSETS
UNMATCHED
QUALITY & SCALE
6
6 MILLION
ACRES
7 MILLION
ACRES
12.4 MILLION
ACRES
ONE OF THE
LARGESTREITS
IN THE U.S.
LOW COST& INDUSTRY
LEADINGWOOD
PRODUCTSFACILITIES
45%Business Assets in Timberlands
58% 87%
TODAY20132012
WORLD CLASS
TIMBERLANDSASSETS
DIVESTED
WRECO
MERGED WITH
PLUM CREEK
DIVESTED
CELLULOSE
FIBERS
DIVESTED
URUGUAY
2013-2017
ACQUIRED
LONGVIEW TIMBER✓
✓
✓
✓
✓
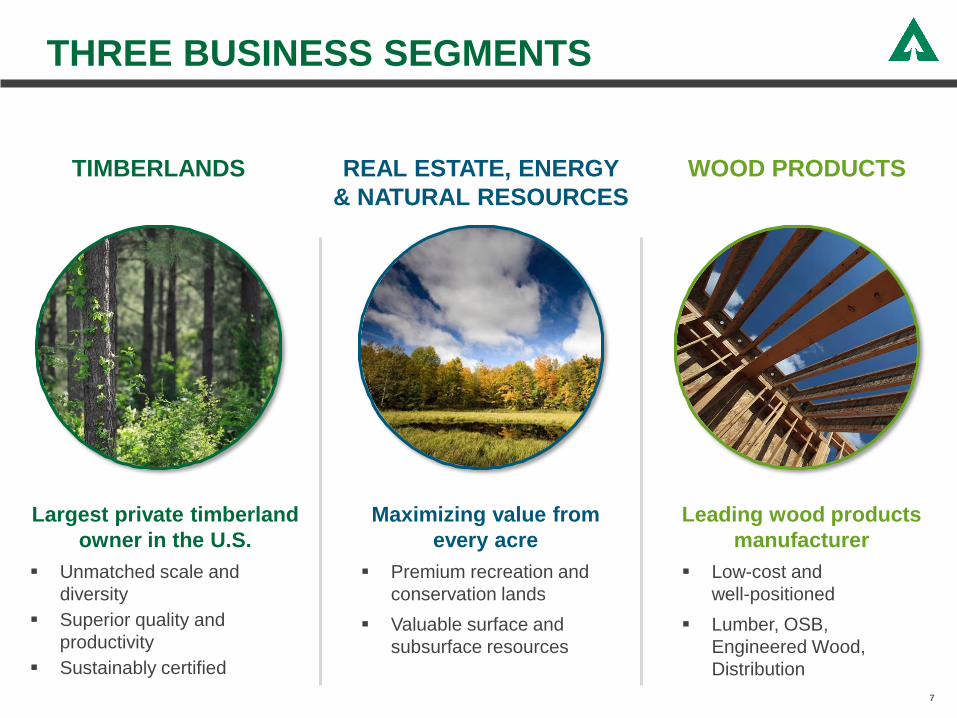
THREE BUSINESS SEGMENTS
TIMBERLANDS REAL ESTATE, ENERGY
& NATURAL RESOURCES
WOOD PRODUCTS
Largest private timberland
owner in the U.S.
▪ Unmatched scale and
diversity
▪ Superior quality and
productivity
▪ Sustainably certified
Maximizing value from
every acre
▪ Premium recreation and
conservation lands
▪ Valuable surface and
subsurface resources
Leading wood products
manufacturer
▪ Low-cost and
well-positioned
▪ Lumber, OSB,
Engineered Wood,
Distribution
7
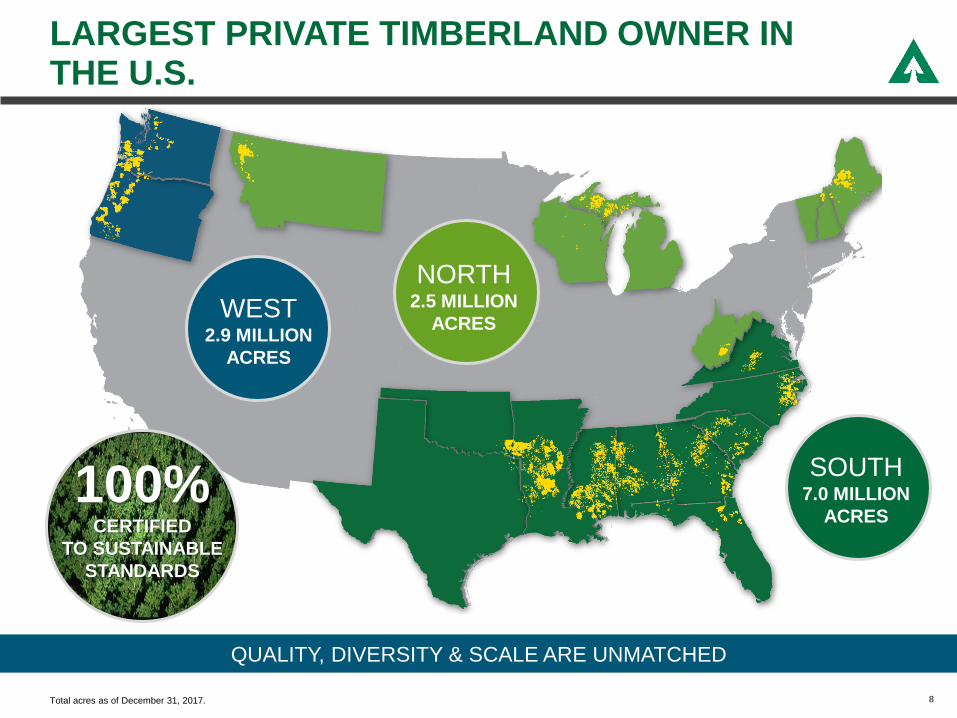
LARGEST PRIVATE TIMBERLAND OWNER IN THE U.S.
8
QUALITY, DIVERSITY & SCALE ARE UNMATCHED
NORTH2.5 MILLION
ACRESWEST
2.9 MILLION
ACRES
SOUTH7.0 MILLION
ACRES100%
CERTIFIED
TO SUSTAINABLE
STANDARDS
Total acres as of December 31, 2017.
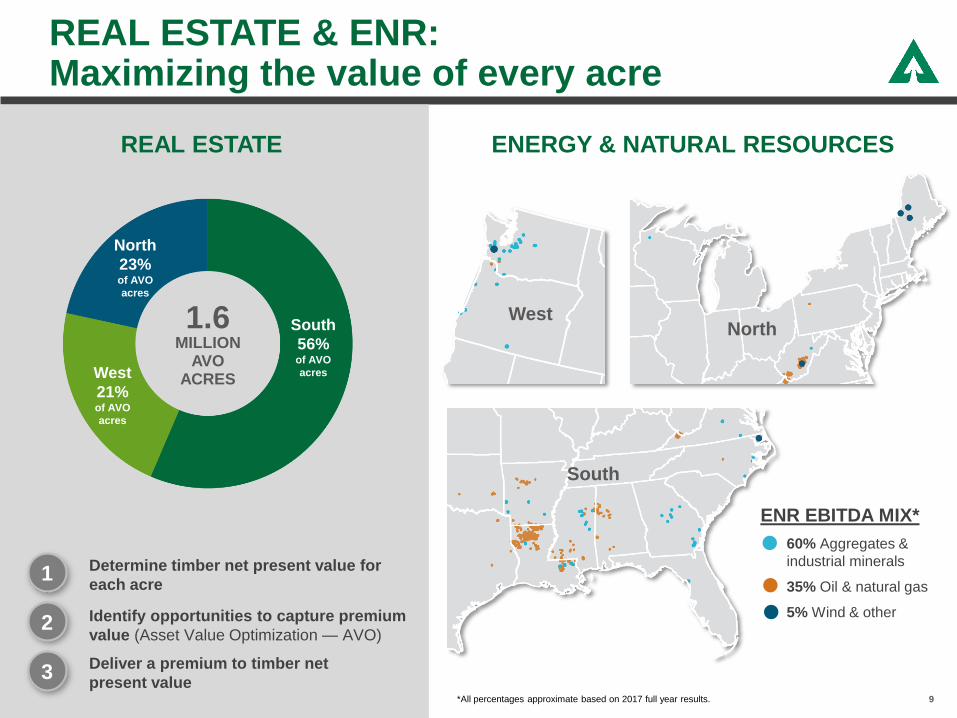
REAL ESTATE & ENR:Maximizing the value of every acre
9
1.6 MILLION
AVO ACRES
North
23%of AVO
acres
West
21%of AVO
acres
South
56%of AVO
acres
Determine timber net present value for
each acre1
Identify opportunities to capture premium
value (Asset Value Optimization — AVO)2
3Deliver a premium to timber net
present value
ENERGY & NATURAL RESOURCESREAL ESTATE
60% Aggregates &
industrial minerals
35% Oil & natural gas
5% Wind & other
ENR EBITDA MIX*
WestNorth
South
*All percentages approximate based on 2017 full year results.
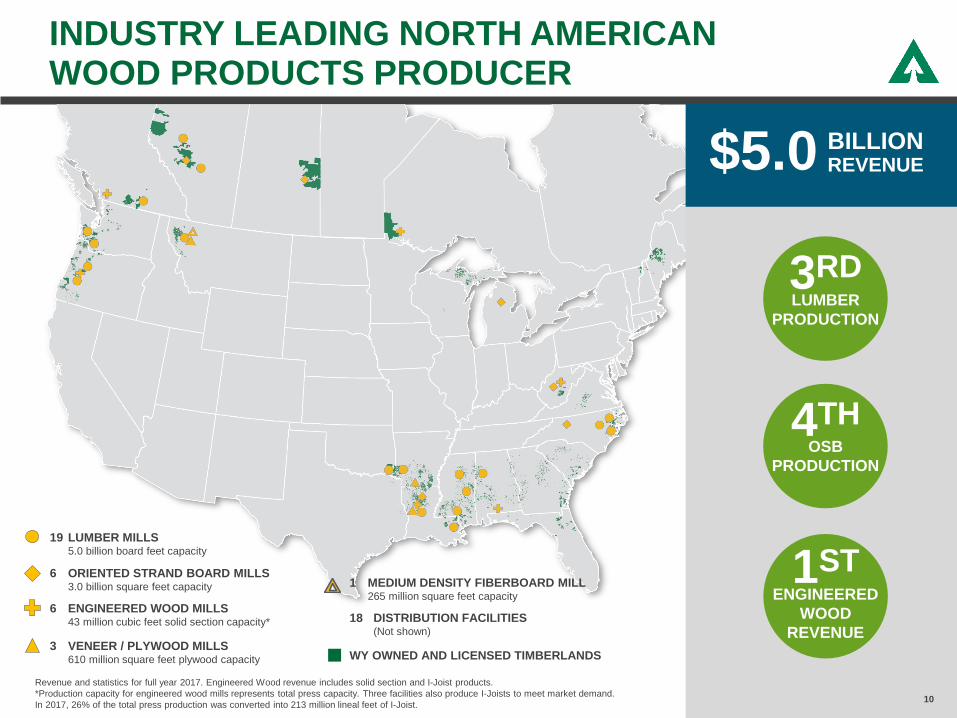
INDUSTRY LEADING NORTH AMERICANWOOD PRODUCTS PRODUCER
10
LUMBER
PRODUCTION
3RD
OSB
PRODUCTION
4TH
$5.0
Revenue and statistics for full year 2017. Engineered Wood revenue includes solid section and I-Joist products.
*Production capacity for engineered wood mills represents total press capacity. Three facilities also produce I-Joists to meet market demand.
In 2017, 26% of the total press production was converted into 213 million lineal feet of I-Joist.
BILLIONREVENUE
3 VENEER / PLYWOOD MILLS610 million square feet plywood capacity
6 ENGINEERED WOOD MILLS43 million cubic feet solid section capacity*
19 LUMBER MILLS5.0 billion board feet capacity
6 ORIENTED STRAND BOARD MILLS3.0 billion square feet capacity 1 MEDIUM DENSITY FIBERBOARD MILL
265 million square feet capacity
WY OWNED AND LICENSED TIMBERLANDS
ENGINEERED
WOOD
REVENUE
1ST
18 DISTRIBUTION FACILITIES(Not shown)
WEYERHAEUSER’S INVESTMENT THESIS
FOCUSED ON DRIVING VALUE FOR SHAREHOLDERS
▪ Operational
excellence
▪ Most value
from every
acre
▪ Return cash to
shareholders
▪ Invest in our
businesses
▪ Maintain
appropriate
capital
structure
▪ Premier
timber, land,
and wood
products
assets
SUPERIOR
RELATIVE
TOTAL
SHAREHOLDER
RETURN
PORTFOLIO PERFORMANCECAPITAL
ALLOCATION
SHAREHOLDER
VALUE
11
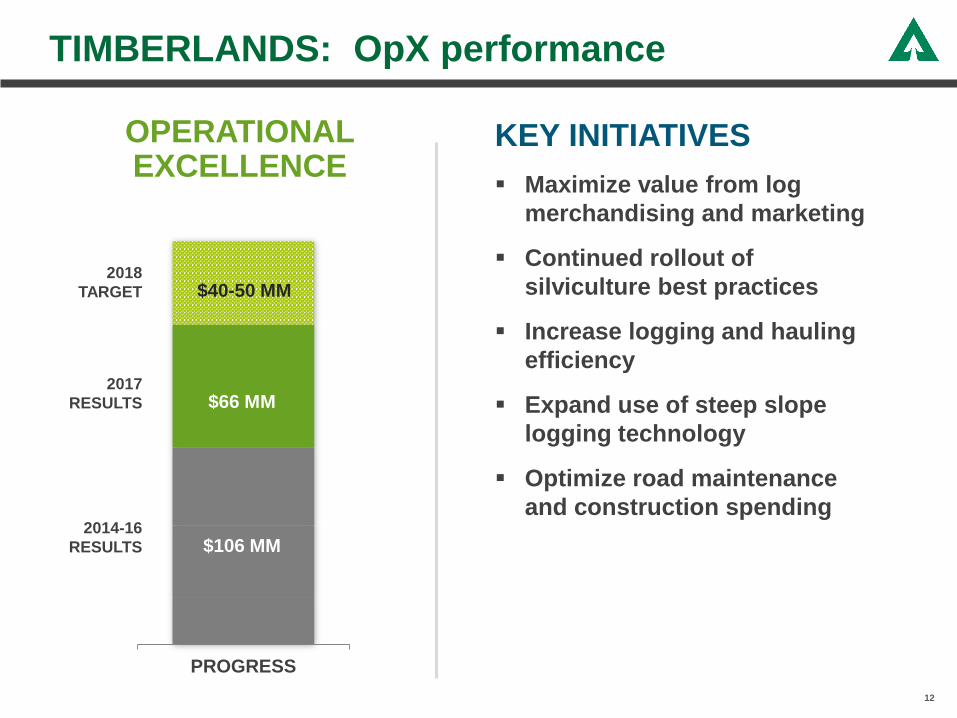
2014-16
RESULTS
PROGRESS
$106 MM
$66 MM
TIMBERLANDS: OpX performance
OPERATIONALEXCELLENCE
KEY INITIATIVES
▪ Maximize value from log
merchandising and marketing
▪ Continued rollout of
silviculture best practices
▪ Increase logging and hauling
efficiency
▪ Expand use of steep slope
logging technology
▪ Optimize road maintenance
and construction spending
$40-50 MM
12
2017
RESULTS
2018
TARGET
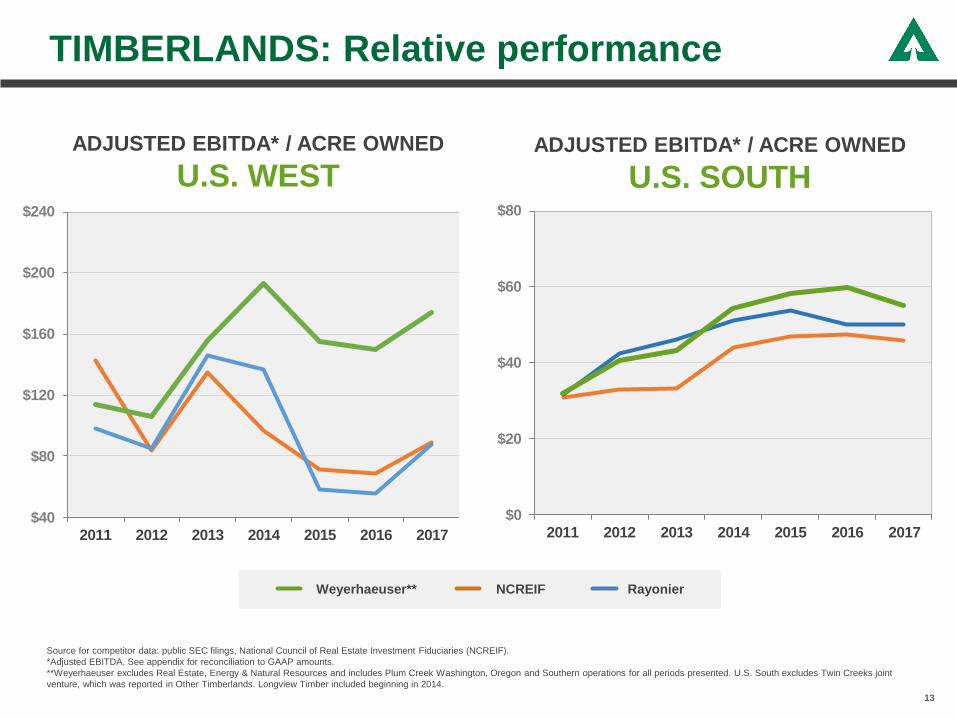
TIMBERLANDS: Relative performance
Source for competitor data: public SEC filings, National Council of Real Estate Investment Fiduciaries (NCREIF).
*Adjusted EBITDA. See appendix for reconciliation to GAAP amounts.
**Weyerhaeuser excludes Real Estate, Energy & Natural Resources and includes Plum Creek Washington, Oregon and Southern operations for all periods presented. U.S. South excludes Twin Creeks joint
venture, which was reported in Other Timberlands. Longview Timber included beginning in 2014.
Weyerhaeuser** NCREIF Rayonier
13
ADJUSTED EBITDA* / ACRE OWNED
U.S. WESTADJUSTED EBITDA* / ACRE OWNED
U.S. SOUTH
$40
$80
$120
$160
$200
$240
2011 2012 2013 2014 2015 2016 2017
$0
$20
$40
$60
$80
2011 2012 2013 2014 2015 2016 2017
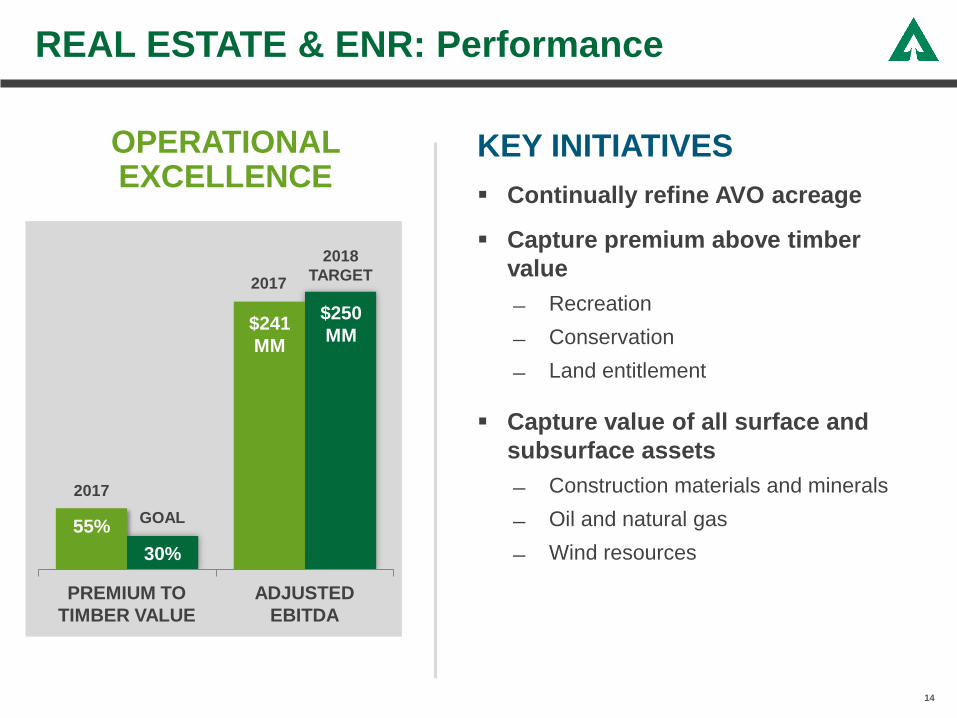
REAL ESTATE & ENR: Performance
14
$250 Million
OPERATIONAL EXCELLENCE
KEY INITIATIVES
▪ Continually refine AVO acreage
▪ Capture premium above timber
value
Recreation
Conservation
Land entitlement
▪ Capture value of all surface and
subsurface assets
Construction materials and minerals
Oil and natural gas
Wind resources
$241
MM
55%
$250
MM
30%
2017
GOAL
2017
2018
TARGET
$241
MM
PREMIUM TO
TIMBER VALUE
ADJUSTED
EBITDA
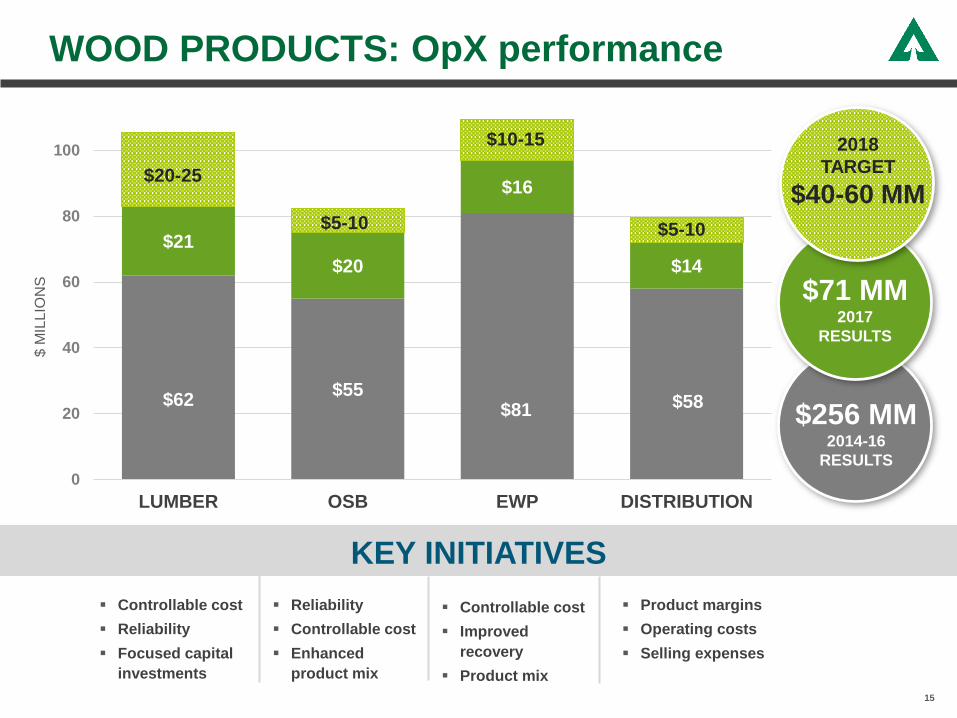
WOOD PRODUCTS: OpX performance
▪ Controllable cost
▪ Reliability
▪ Focused capital
investments
▪ Reliability
▪ Controllable cost
▪ Enhanced
product mix
▪ Controllable cost
▪ Improved
recovery
▪ Product mix
▪ Product margins
▪ Operating costs
▪ Selling expenses
KEY INITIATIVES
$62$55
$81 $58
$21
$20
$16
$14
0
20
40
60
80
100
LUMBER OSB EWP DISTRIBUTION
$ M
ILLIO
NS
$20-25
$5-10 $5-10
$10-15
$256 MM2014-16
RESULTS
$71 MM2017
RESULTS
2018
TARGET
$40-60 MM
15
-10%
0%
10%
20%
30%
40%
50%
2011 2012 2013 2014 2015 2016 2017
LPX OSB Norbord OSB Ainsworth OSB WY
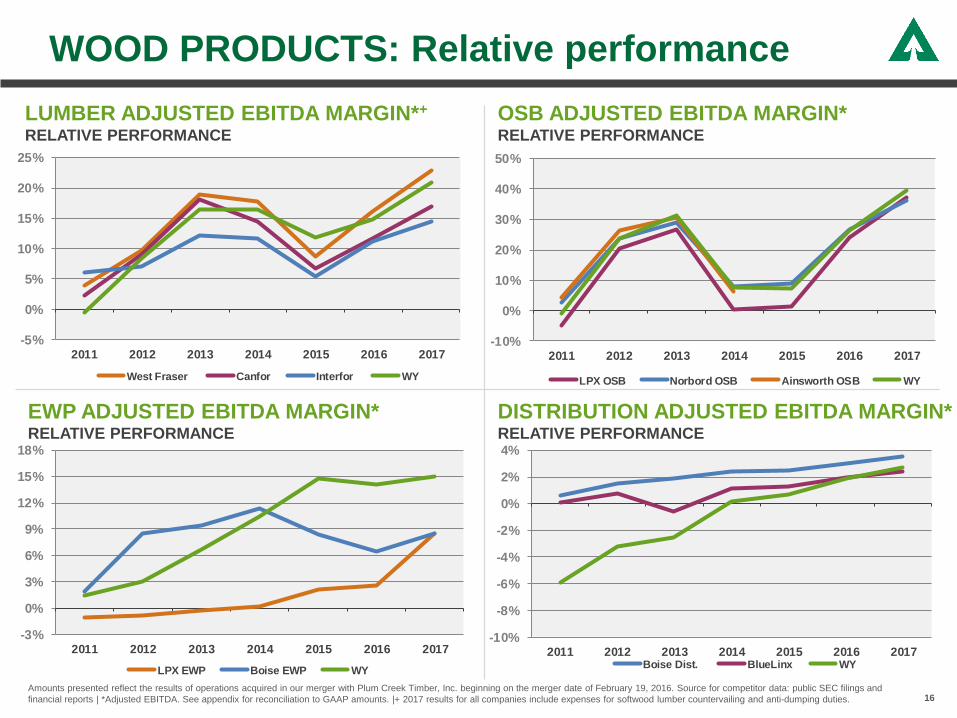
WOOD PRODUCTS: Relative performance
16
LUMBER ADJUSTED EBITDA MARGIN*+
RELATIVE PERFORMANCE
OSB ADJUSTED EBITDA MARGIN*RELATIVE PERFORMANCE
Amounts presented reflect the results of operations acquired in our merger with Plum Creek Timber, Inc. beginning on the merger date of February 19, 2016. Source for competitor data: public SEC filings and
financial reports | *Adjusted EBITDA. See appendix for reconciliation to GAAP amounts. |+ 2017 results for all companies include expenses for softwood lumber countervailing and anti-dumping duties.
EWP ADJUSTED EBITDA MARGIN*RELATIVE PERFORMANCE
-5%
0%
5%
10%
15%
20%
25%
2011 2012 2013 2014 2015 2016 2017
West Fraser Canfor Interfor WY
-3%
0%
3%
6%
9%
12%
15%
18%
2011 2012 2013 2014 2015 2016 2017
LPX EWP Boise EWP WY
-10%
-8%
-6%
-4%
-2%
0%
2%
4%
2011 2012 2013 2014 2015 2016 2017Boise Dist. BlueLinx WY
DISTRIBUTION ADJUSTED EBITDA MARGIN*RELATIVE PERFORMANCE
WEYERHAEUSER’S INVESTMENT THESIS
FOCUSED ON DRIVING VALUE FOR SHAREHOLDERS
▪ Operational
excellence
▪ Most value
from every
acre
▪ Return cash to
shareholders
▪ Invest in our
businesses
▪ Maintain
appropriate
capital
structure
▪ Premier
timber, land,
and wood
products
assets
SUPERIOR
RELATIVE
TOTAL
SHAREHOLDER
RETURN
PORTFOLIO PERFORMANCECAPITAL
ALLOCATION
SHAREHOLDER
VALUE
17
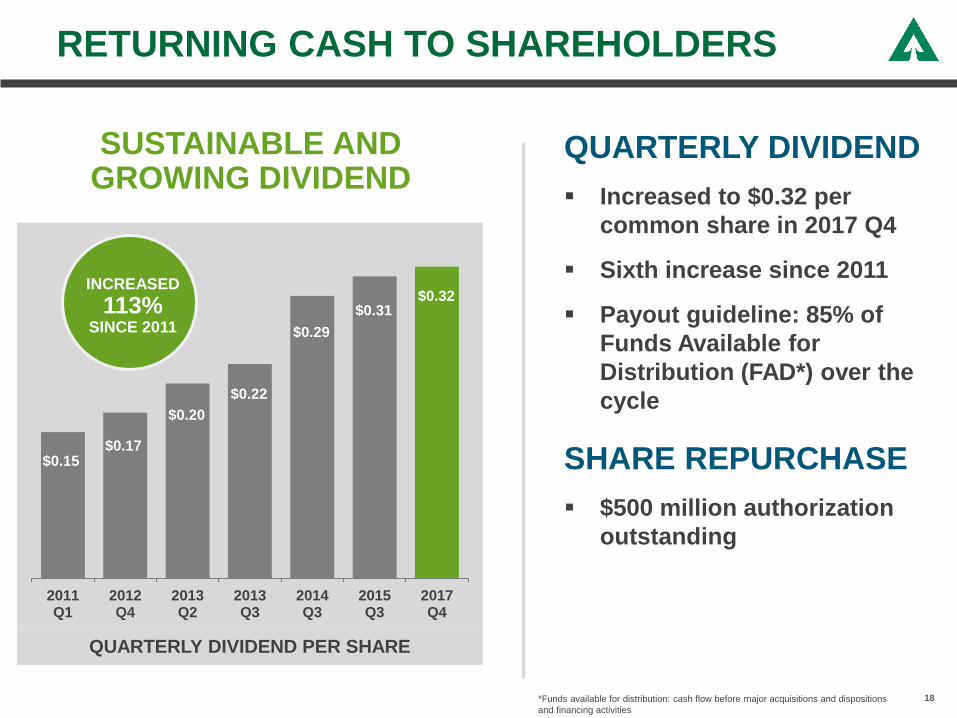
$0.15 $0.17
$0.20
$0.22
$0.29
$0.31 $0.32
2011Q1
2012Q4
2013Q2
2013Q3
2014Q3
2015Q3
2017Q4
RETURNING CASH TO SHAREHOLDERS
18
QUARTERLY DIVIDEND PER SHARE
SUSTAINABLE AND GROWING DIVIDEND
$500 MILLION
$2.0 BILLIONACCELERATED
*Funds available for distribution: cash flow before major acquisitions and dispositions
and financing activities
QUARTERLY DIVIDEND
▪ Increased to $0.32 per
common share in 2017 Q4
▪ Sixth increase since 2011
▪ Payout guideline: 85% of
Funds Available for
Distribution (FAD*) over the
cycle
SHARE REPURCHASE
▪ $500 million authorization
outstanding
INCREASED
113%SINCE 2011
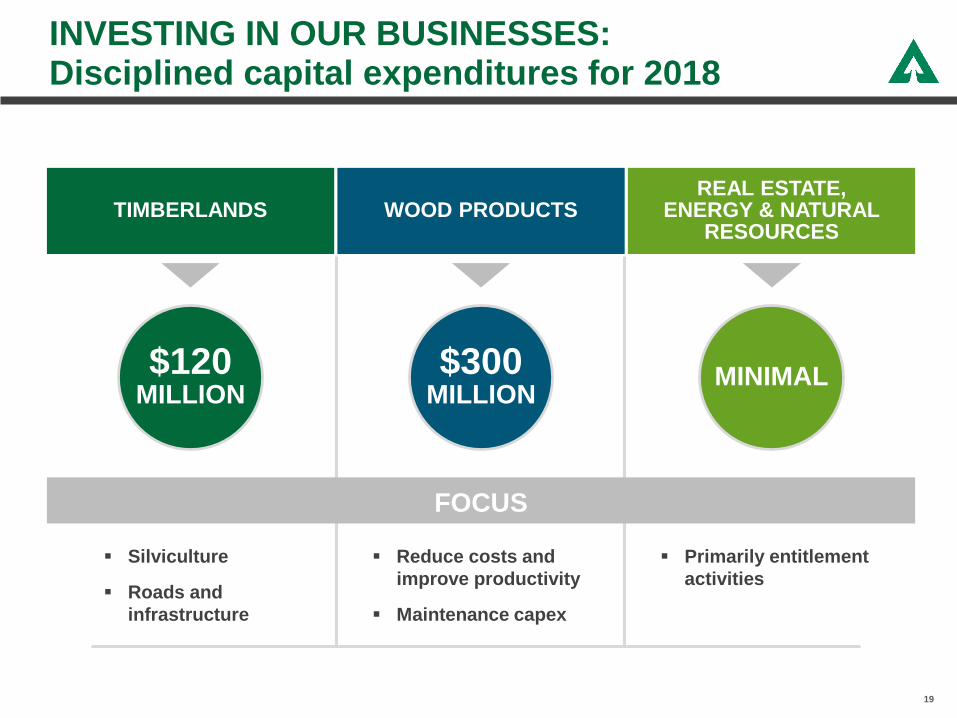
INVESTING IN OUR BUSINESSES:Disciplined capital expenditures for 2018
19
TIMBERLANDS
▪ Reduce costs and
improve productivity
▪ Maintenance capex
▪ Silviculture
▪ Roads and
infrastructure
FOCUS
WOOD PRODUCTSREAL ESTATE,
ENERGY & NATURAL RESOURCES
▪ Primarily entitlement
activities
$120MILLION
$300MILLION
MINIMAL
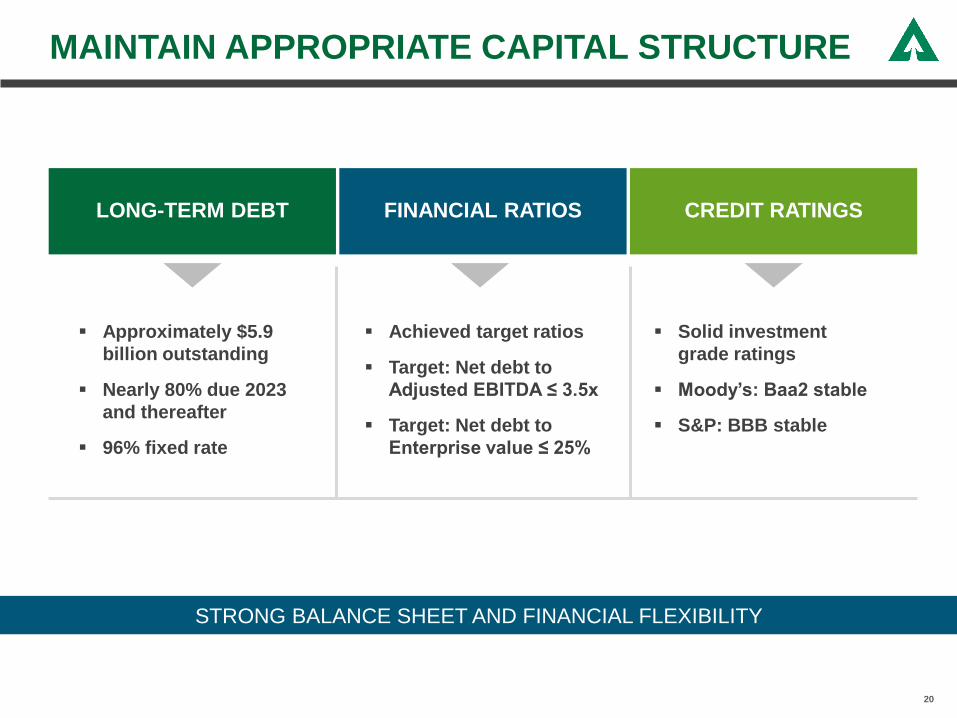
MAINTAIN APPROPRIATE CAPITAL STRUCTURE
LONG-TERM DEBT
▪ Solid investment
grade ratings
▪ Moody’s: Baa2 stable
▪ S&P: BBB stable
FOCUS
FINANCIAL RATIOS CREDIT RATINGS
▪ Achieved target ratios
▪ Target: Net debt to
Adjusted EBITDA ≤ 3.5x
▪ Target: Net debt to
Enterprise value ≤ 25%
STRONG BALANCE SHEET AND FINANCIAL FLEXIBILITY
▪ Approximately $5.9
billion outstanding
▪ Nearly 80% due 2023
and thereafter
▪ 96% fixed rate
20
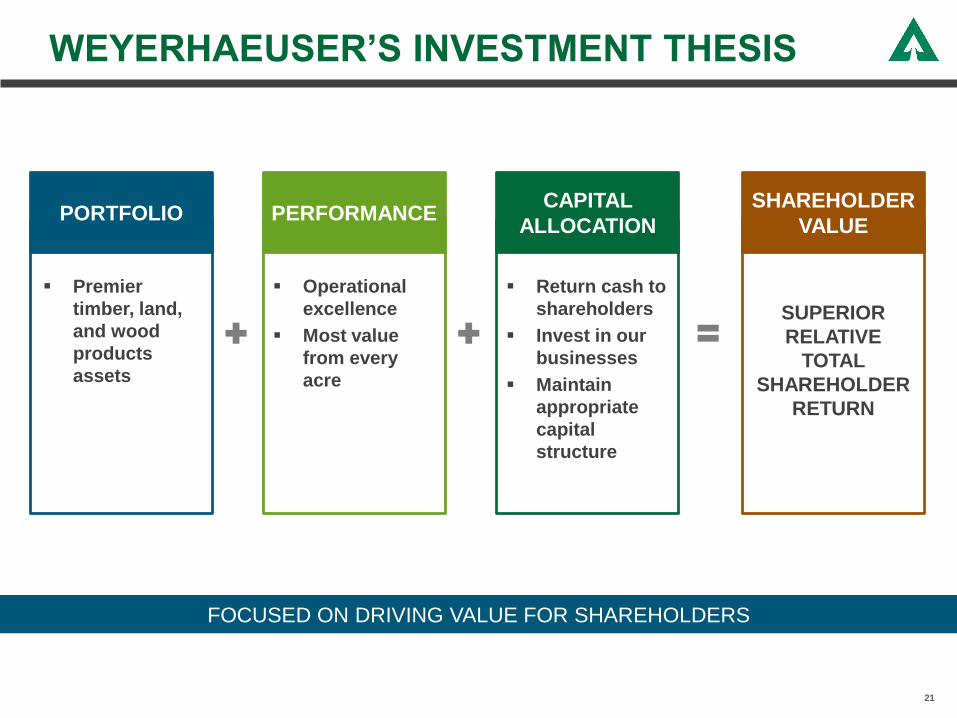
WEYERHAEUSER’S INVESTMENT THESIS
FOCUSED ON DRIVING VALUE FOR SHAREHOLDERS
▪ Operational
excellence
▪ Most value
from every
acre
▪ Return cash to
shareholders
▪ Invest in our
businesses
▪ Maintain
appropriate
capital
structure
▪ Premier
timber, land,
and wood
products
assets
SUPERIOR
RELATIVE
TOTAL
SHAREHOLDER
RETURN
PORTFOLIO PERFORMANCECAPITAL
ALLOCATION
SHAREHOLDER
VALUE
21
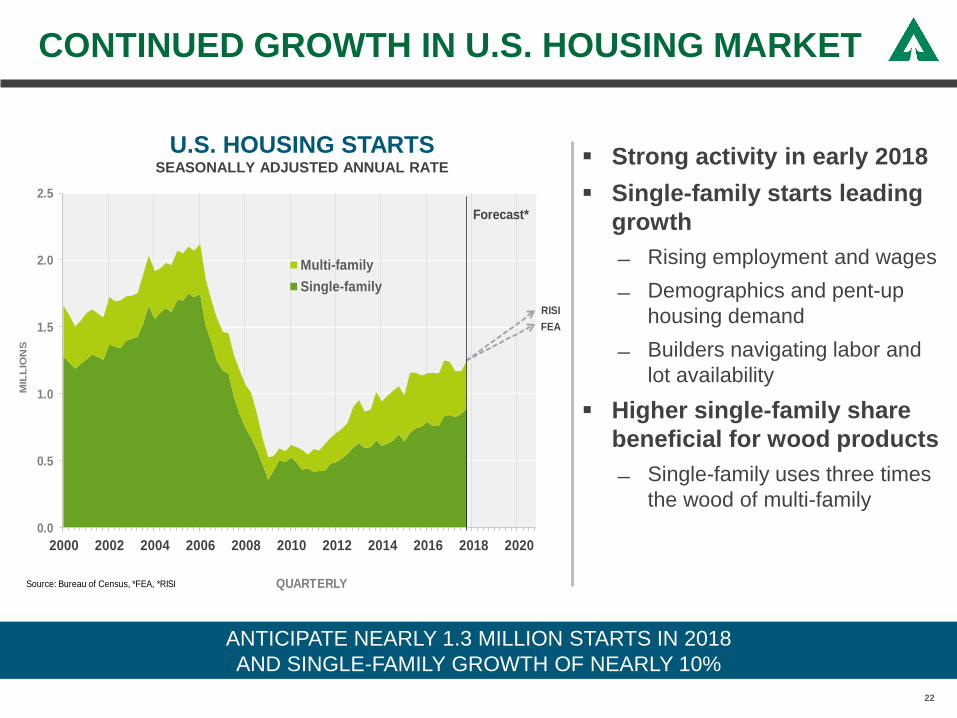
CONTINUED GROWTH IN U.S. HOUSING MARKET
22
U.S. HOUSING STARTSSEASONALLY ADJUSTED ANNUAL RATE
▪ Strong activity in early 2018
▪ Single-family starts leading
growth
Rising employment and wages
Demographics and pent-up
housing demand
Builders navigating labor and
lot availability
▪ Higher single-family share
beneficial for wood products
Single-family uses three times
the wood of multi-family
ANTICIPATE NEARLY 1.3 MILLION STARTS IN 2018
AND SINGLE-FAMILY GROWTH OF NEARLY 10%
0.0
0.5
1.0
1.5
2.0
2.5
2000 2002 2004 2006 2008 2010 2012 2014 2016 2018 2020
MIL
LIO
NS
QUARTERLY
Multi-family
Single-family
Source: Bureau of Census, *FEA, *RISI
Forecast*
RISI
FEA
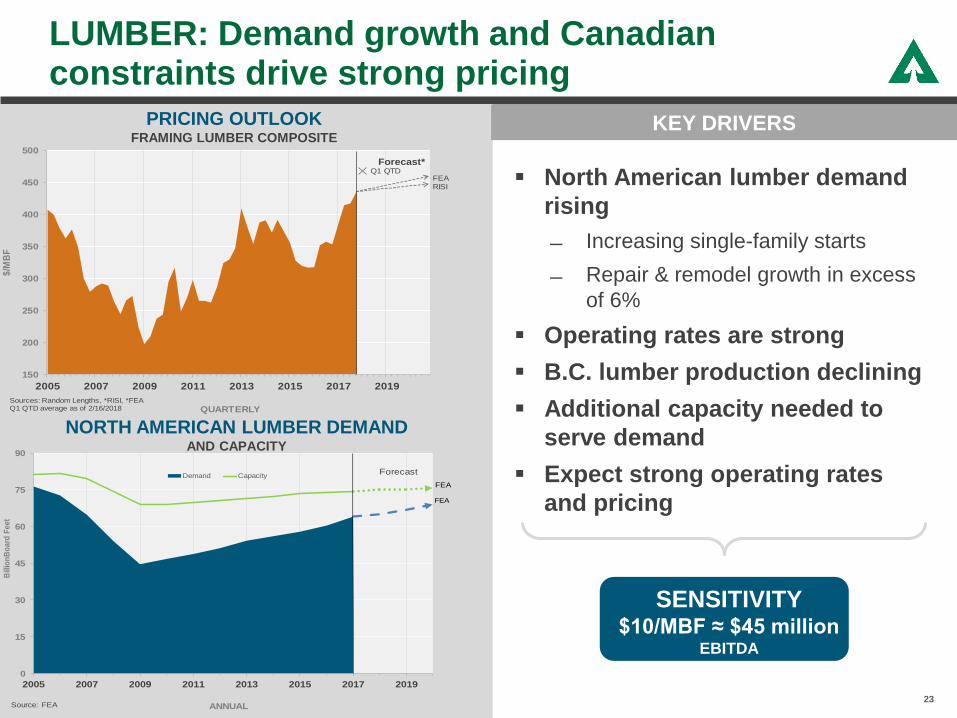
LUMBER: Demand growth and Canadian constraints drive strong pricing
23
▪ North American lumber demand
rising
Increasing single-family starts
Repair & remodel growth in excess
of 6%
▪ Operating rates are strong
▪ B.C. lumber production declining
▪ Additional capacity needed to
serve demand
▪ Expect strong operating rates
and pricing
PRICING OUTLOOKFRAMING LUMBER COMPOSITE
KEY DRIVERS
SENSITIVITY$10/MBF ≈ $45 million
EBITDA
NORTH AMERICAN LUMBER DEMANDAND CAPACITY
0
15
30
45
60
75
90
2005 2007 2009 2011 2013 2015 2017 2019
Bill
ion
Bo
ard
Fe
et
ANNUAL
Demand CapacityForecast
Source: FEA
FEA
FEA
150
200
250
300
350
400
450
500
2005 2007 2009 2011 2013 2015 2017 2019
$/M
BF
QUARTERLYSources: Random Lengths, *RISI, *FEAQ1 QTD average as of 2/16/2018
Forecast*
RISI
FEAQ1 QTD
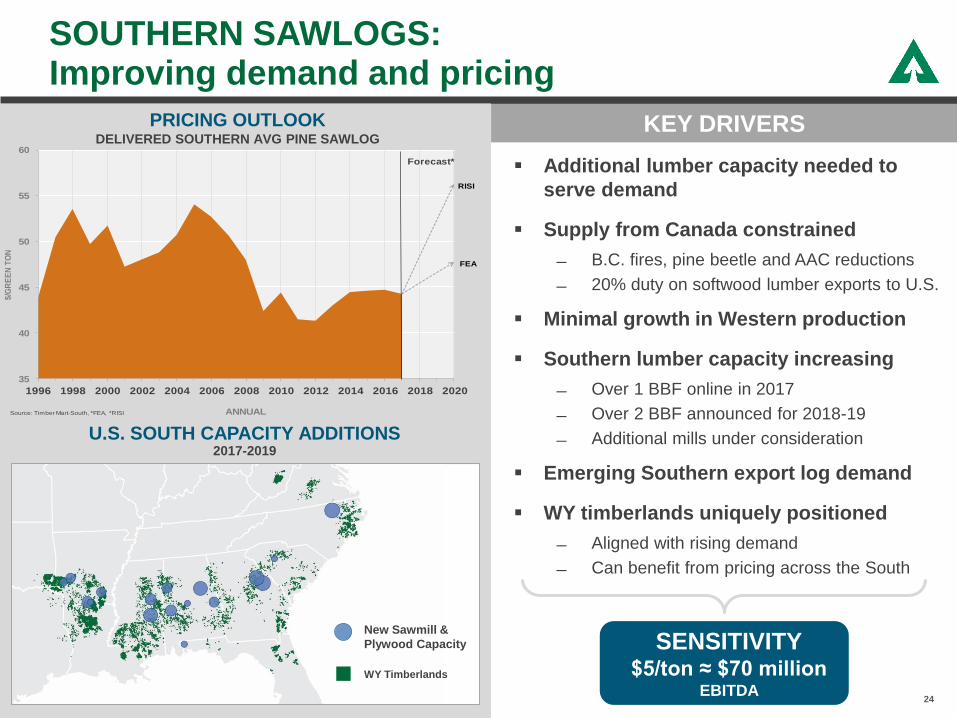
SOUTHERN SAWLOGS:Improving demand and pricing
24
KEY DRIVERS
SENSITIVITY$5/ton ≈ $70 million
EBITDA
PRICING OUTLOOKDELIVERED SOUTHERN AVG PINE SAWLOG
U.S. SOUTH CAPACITY ADDITIONS2017-2019
▪ Additional lumber capacity needed to
serve demand
▪ Supply from Canada constrained
B.C. fires, pine beetle and AAC reductions
20% duty on softwood lumber exports to U.S.
▪ Minimal growth in Western production
▪ Southern lumber capacity increasing
Over 1 BBF online in 2017
Over 2 BBF announced for 2018-19
Additional mills under consideration
▪ Emerging Southern export log demand
▪ WY timberlands uniquely positioned
Aligned with rising demand
Can benefit from pricing across the South
New Sawmill &
Plywood Capacity
WY Timberlands
35
40
45
50
55
60
1996 1998 2000 2002 2004 2006 2008 2010 2012 2014 2016 2018 2020
$/G
RE
EN
TO
N
ANNUAL
Forecast*
Source: Timber Mart-South, *FEA, *RISI
RISI
FEA
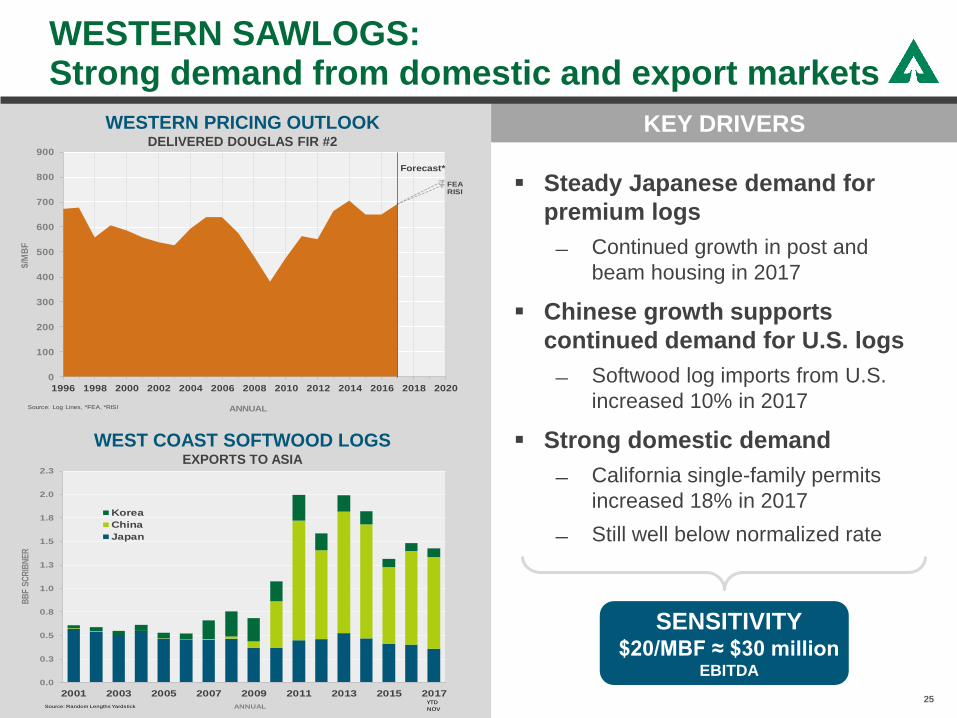
WESTERN SAWLOGS:Strong demand from domestic and export markets
25
KEY DRIVERS
▪ Steady Japanese demand for
premium logs
Continued growth in post and
beam housing in 2017
▪ Chinese growth supports
continued demand for U.S. logs
Softwood log imports from U.S.
increased 10% in 2017
▪ Strong domestic demand
California single-family permits
increased 18% in 2017
Still well below normalized rate
SENSITIVITY$20/MBF ≈ $30 million
EBITDA
WESTERN PRICING OUTLOOKDELIVERED DOUGLAS FIR #2
WEST COAST SOFTWOOD LOGSEXPORTS TO ASIA
0
100
200
300
400
500
600
700
800
900
1996 1998 2000 2002 2004 2006 2008 2010 2012 2014 2016 2018 2020
$/M
BF
ANNUAL
Forecast*
Source: Log Lines, *FEA, *RISI
RISIFEA
0.0
0.3
0.5
0.8
1.0
1.3
1.5
1.8
2.0
2.3
2001 2003 2005 2007 2009 2011 2013 2015 2017
BB
F S
CR
IBN
ER
Korea
China
Japan
Source: Random Lengths Yardstick ANNUALYTDNOV
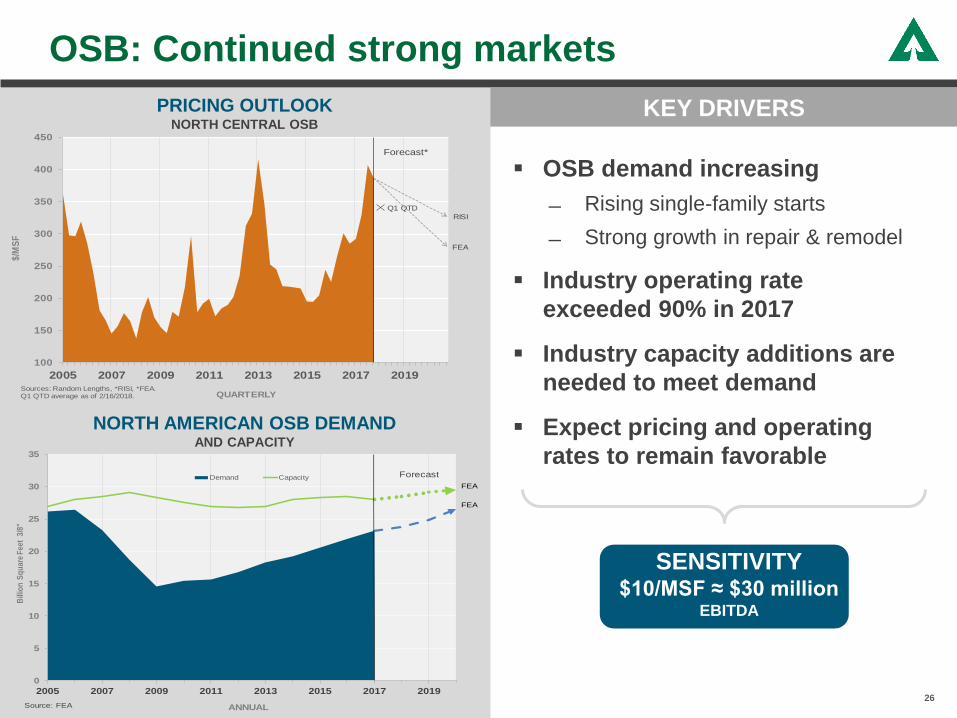
OSB: Continued strong markets
26
▪ OSB demand increasing
Rising single-family starts
Strong growth in repair & remodel
▪ Industry operating rate
exceeded 90% in 2017
▪ Industry capacity additions are
needed to meet demand
▪ Expect pricing and operating
rates to remain favorable
PRICING OUTLOOKNORTH CENTRAL OSB
SENSITIVITY$10/MSF ≈ $30 million
EBITDA
KEY DRIVERS
NORTH AMERICAN OSB DEMANDAND CAPACITY
100
150
200
250
300
350
400
450
2005 2007 2009 2011 2013 2015 2017 2019
$/M
SF
QUARTERLYSources: Random Lengths, *RISI, *FEA.Q1 QTD average as of 2/16/2018.
Forecast*
RISI
FEA
Q1 QTD
0
5
10
15
20
25
30
35
2005 2007 2009 2011 2013 2015 2017 2019
Bill
ion
Sq
uar
e F
eet
3/8
"
ANNUAL
Demand Capacity Forecast
Source: FEA
FEA
FEA

WEYERHAEUSER’S INVESTMENT THESIS
FOCUSED ON DRIVING VALUE FOR SHAREHOLDERS
▪ Operational
excellence
▪ Most value
from every
acre
▪ Return cash to
shareholders
▪ Invest in our
businesses
▪ Maintain
appropriate
capital
structure
▪ Premier
timber, land,
and wood
products
assets
SUPERIOR
RELATIVE
TOTAL
SHAREHOLDER
RETURN
PORTFOLIO PERFORMANCECAPITAL
ALLOCATION
SHAREHOLDER
VALUE
27
APPENDIX
28
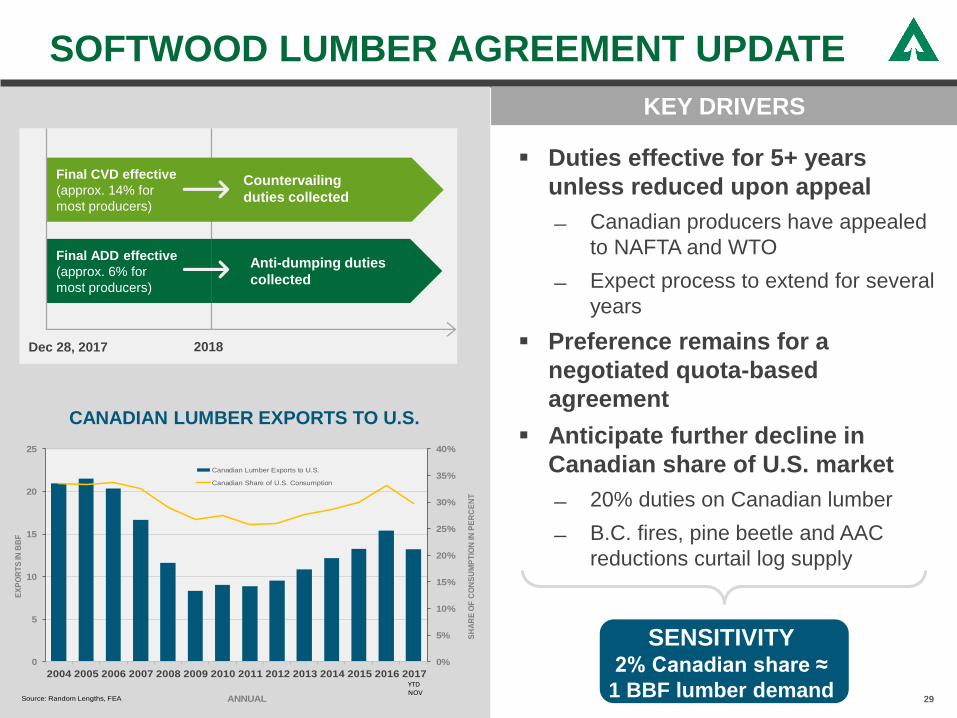
Final CVD effective
(approx. 14% for
most producers)
Final ADD effective
(approx. 6% for
most producers)
Countervailing
duties collected
Anti-dumping duties
collected
SOFTWOOD LUMBER AGREEMENT UPDATE
29
▪ Duties effective for 5+ years
unless reduced upon appeal
Canadian producers have appealed
to NAFTA and WTO
Expect process to extend for several
years
▪ Preference remains for a
negotiated quota-based
agreement
▪ Anticipate further decline in
Canadian share of U.S. market
20% duties on Canadian lumber
B.C. fires, pine beetle and AAC
reductions curtail log supply
CANADIAN LUMBER EXPORTS TO U.S.
KEY DRIVERS
SENSITIVITY2% Canadian share ≈
1 BBF lumber demand
2018Dec 28, 2017
0%
5%
10%
15%
20%
25%
30%
35%
40%
0
5
10
15
20
25
2004 2005 2006 2007 2008 2009 2010 2011 2012 2013 2014 2015 2016 2017
SH
AR
E O
F C
ON
SU
MP
TIO
N IN
PE
RC
EN
T
EX
PO
RT
S IN
BB
F
ANNUAL
Canadian Lumber Exports to U.S.
Canadian Share of U.S. Consumption
Source: Random Lengths, FEA
YTDNOV
▪ Timber REIT status preserved
▪ Dividends to shareholders remain eligible for capital gain treatment
▪ Taxable REIT subsidiary benefits from lower tax rate
▪ Corporate rate reduced to 21% from 35%
▪ Expect 2018 effective tax rate of 11-13%
▪ No limitations on interest deductibility anticipated
▪ Accelerated expensing of capital investments in
manufacturing operations
BENEFITS OF FEDERAL TAX REFORM
30
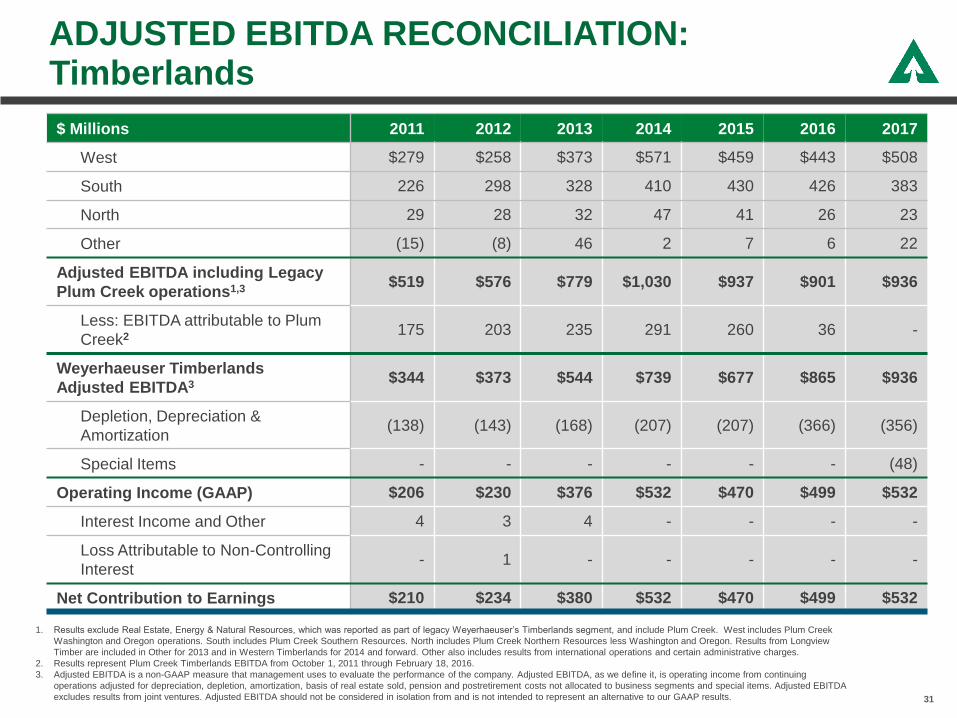
ADJUSTED EBITDA RECONCILIATION: Timberlands
31
1. Results exclude Real Estate, Energy & Natural Resources, which was reported as part of legacy Weyerhaeuser’s Timberlands segment, and include Plum Creek. West includes Plum Creek
Washington and Oregon operations. South includes Plum Creek Southern Resources. North includes Plum Creek Northern Resources less Washington and Oregon. Results from Longview
Timber are included in Other for 2013 and in Western Timberlands for 2014 and forward. Other also includes results from international operations and certain administrative charges.
2. Results represent Plum Creek Timberlands EBITDA from October 1, 2011 through February 18, 2016.
3. Adjusted EBITDA is a non-GAAP measure that management uses to evaluate the performance of the company. Adjusted EBITDA, as we define it, is operating income from continuing
operations adjusted for depreciation, depletion, amortization, basis of real estate sold, pension and postretirement costs not allocated to business segments and special items. Adjusted EBITDA
excludes results from joint ventures. Adjusted EBITDA should not be considered in isolation from and is not intended to represent an alternative to our GAAP results.
$ Millions 2011 2012 2013 2014 2015 2016 2017
West $279 $258 $373 $571 $459 $443 $508
South 226 298 328 410 430 426 383
North 29 28 32 47 41 26 23
Other (15) (8) 46 2 7 6 22
Adjusted EBITDA including Legacy
Plum Creek operations1,3$519 $576 $779 $1,030 $937 $901 $936
Less: EBITDA attributable to Plum
Creek2175 203 235 291 260 36 -
Weyerhaeuser Timberlands
Adjusted EBITDA3$344 $373 $544 $739 $677 $865 $936
Depletion, Depreciation &
Amortization(138) (143) (168) (207) (207) (366) (356)
Special Items - - - - - - (48)
Operating Income (GAAP) $206 $230 $376 $532 $470 $499 $532
Interest Income and Other 4 3 4 - - - -
Loss Attributable to Non-Controlling
Interest- 1 - - - - -
Net Contribution to Earnings $210 $234 $380 $532 $470 $499 $532
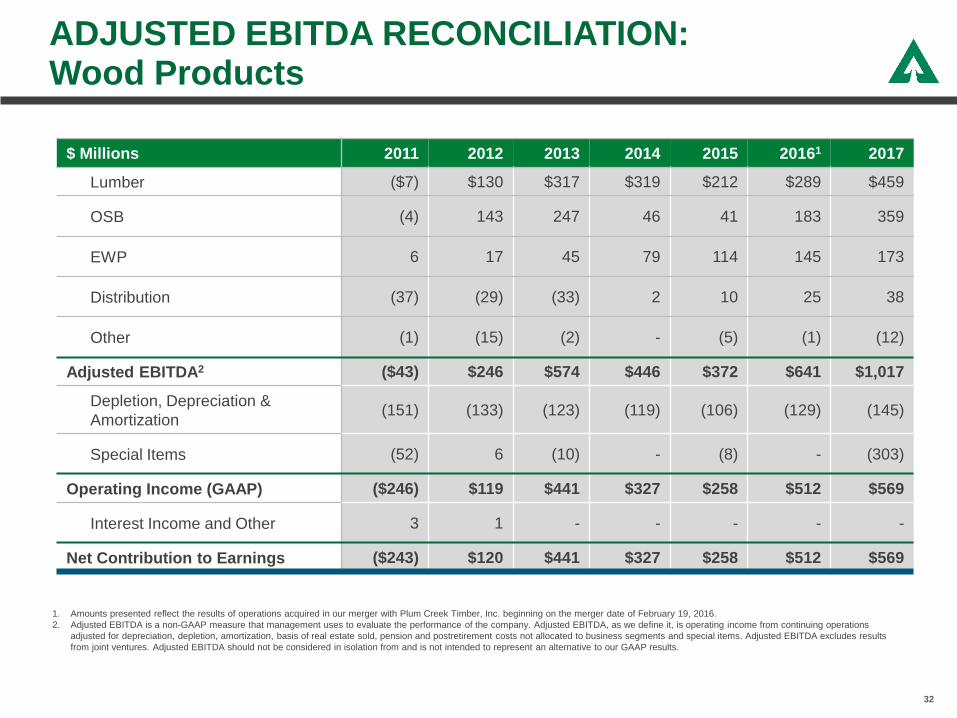
ADJUSTED EBITDA RECONCILIATION:Wood Products
32
1. Amounts presented reflect the results of operations acquired in our merger with Plum Creek Timber, Inc. beginning on the merger date of February 19, 2016.
2. Adjusted EBITDA is a non-GAAP measure that management uses to evaluate the performance of the company. Adjusted EBITDA, as we define it, is operating income from continuing operations
adjusted for depreciation, depletion, amortization, basis of real estate sold, pension and postretirement costs not allocated to business segments and special items. Adjusted EBITDA excludes results
from joint ventures. Adjusted EBITDA should not be considered in isolation from and is not intended to represent an alternative to our GAAP results.
$ Millions 2011 2012 2013 2014 2015 20161 2017
Lumber ($7) $130 $317 $319 $212 $289 $459
OSB (4) 143 247 46 41 183 359
EWP 6 17 45 79 114 145 173
Distribution (37) (29) (33) 2 10 25 38
Other (1) (15) (2) - (5) (1) (12)
Adjusted EBITDA2 ($43) $246 $574 $446 $372 $641 $1,017
Depletion, Depreciation &
Amortization(151) (133) (123) (119) (106) (129) (145)
Special Items (52) 6 (10) - (8) - (303)
Operating Income (GAAP) ($246) $119 $441 $327 $258 $512 $569
Interest Income and Other 3 1 - - - - -
Net Contribution to Earnings ($243) $120 $441 $327 $258 $512 $569
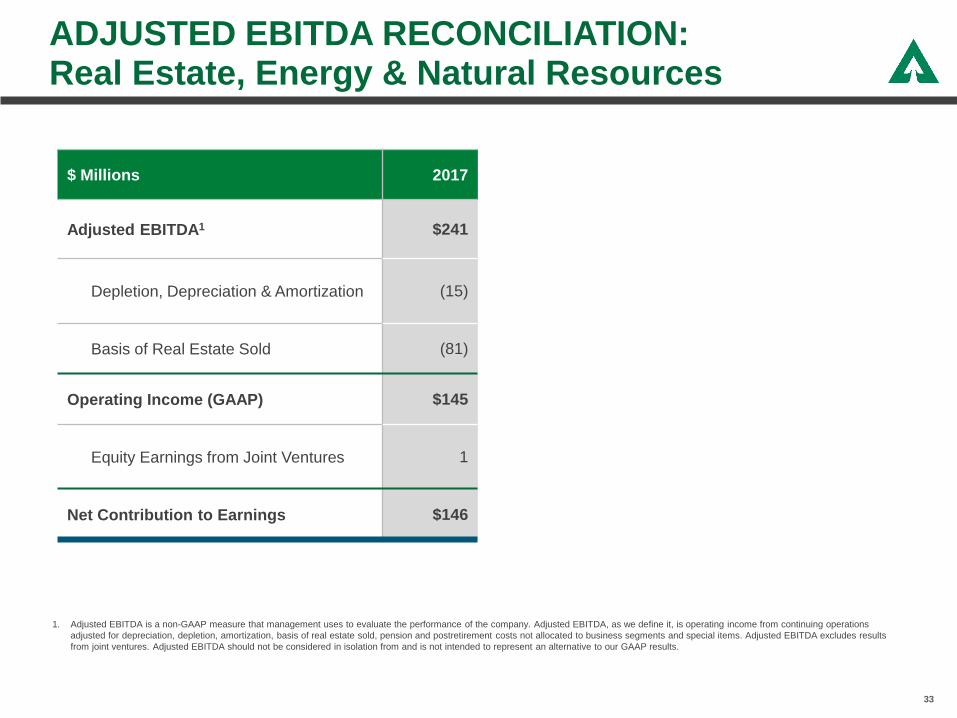
ADJUSTED EBITDA RECONCILIATION:Real Estate, Energy & Natural Resources
33
1. Adjusted EBITDA is a non-GAAP measure that management uses to evaluate the performance of the company. Adjusted EBITDA, as we define it, is operating income from continuing operations
adjusted for depreciation, depletion, amortization, basis of real estate sold, pension and postretirement costs not allocated to business segments and special items. Adjusted EBITDA excludes results
from joint ventures. Adjusted EBITDA should not be considered in isolation from and is not intended to represent an alternative to our GAAP results.
$ Millions 2017
Adjusted EBITDA1 $241
Depletion, Depreciation & Amortization (15)
Basis of Real Estate Sold (81)
Operating Income (GAAP) $145
Equity Earnings from Joint Ventures 1
Net Contribution to Earnings $146
34