Embed Size (px)
Citation preview

What are the underlying causes of poor quality and
high costs -- and what can we do about it?
Elliott S. Fisher, MD, MPH
Professor of Medicine
Dartmouth Medical School

Argument
Supply sensitive services-- discretionary visits, tests, hospital stays --
comprise the major component of health care spending -- and are
responsible for unwarranted regional variations in Medicare spending.
More isn’t better. In fact --- overuse of supply sensitive services
contributes to lower quality and worse health outcomes.
We are wasting 30% of Medicare spending.
To improve both the quality and efficiency of care, we must learn to
effectively manage the use of supply sensitive services. This will
likely entail:
Limiting capacity
Performance monitoring
Payment reform

Part 1 -- The evidence
Ongoing research project on regional variations in spending
Support from: Robert Wood Johnson Foundation
National Institute of Aging
Ann Intern Med: 2003; 138: 273-298
www.annals.org/issues/v138n4/toc.html

Motivation
The implications of regional variations in
Medicare spending
Large disparities in spending across U.S. regions
Longstanding -- first noted in early 1970s
Not due to differences in price or illness
Largely due to differences in quantity of care: overall intensity
Key Questions:
What does more spending -- greater intensity -- buy?
What are the causes of the differences we observe?

Overview of study
Study population -- Medicare enrollees
Acute myocardial infarction n = 159,393
Colorectal Cancer n = 195,429
Hip Fracture n = 614,503
Medicare Current Beneficiary Survey n = 18,190
Study design -- natural experiment
Assigned each group to quintiles of practice intensity
based on region of residence
Region defined based upon Dartmouth Atlas (n=306)
Assignment ensured no differences in illness levels
across regions

$ 3,922
$ 4,439
$ 4,940
$ 5,444
$ 6,304
Per-capita
Medicare Spending
1996 2000
Per-capita spending across intensity quintiles
Ratio: High to Low: 1.61 1.58
$ 5,229
$ 5.692
$ 6,069
$ 6,614
$ 8,283

What does higher spending buy?
Content and process of care
Effective care: evidence based care
Preference sensitive care: multiple options involved
Supply-sensitive services: utilization associated with supply

Effective Care: Ratio of Rates in Highest vs Lowest Spending Regions
1.00 1.5 2.00.5 25 3.0
1.00 1.5 2.00.5 25 3.0
Reperfusion in 12 hours for AMI
Acute MI
Lower in High Spending Regions Higher in High Spending Regions
Quintile 1 Quintile 5
55.8 49.8
Effective Care: Ratio of Rates in Highest vs Lowest Spending Regions
1.00 1.5 2.00.5 2.5 3.0
1.00 1.5 2.00.5 2.5 3.0
Reperfusion in 12 hours for AMI
Aspirin at discharge
Aspirin at admission
Beta Blocker at discharge
Beta Blocker at admission
Acute MI
Mammogram, Women 65-69
Flu shot during past year
Pap Smear, Women 65+
Pneumococcal Immuniztation (ever)
General Population
Lower in High Spending Regions Higher in High Spending Regions
ACE Inhibitor at discharge

Preference-Sensitive Care: Highest vs Lowest Spending Regions
1.00 1.5 2.00.5 2.5 3.0
1.00 1.5 2.00.5 2.5 3.0
Coronary Artery Bypass Surgery (CABG)
Coronary Angioplasty
Procedures after AMI
Cholecystectomy
Hernia Repair
Cataract Extraction
Total Hip Replacement
Major Surgery (all cohorts combined)
Total Knee Replacement
Back Surgery
Carotid Endarterectomy
Lower in High Spending Regions Higher in High Spending Regions
Angiography
Angiography among appropriate cases

Supply-Sensitive Care : Highest vs Lowest Spending Regions
1.00 1.5 2.00.5 2.5 3.0
1.00 1.5 2.00.5 2.5 3.0
Office Visits
Initial Inpatient Specialist Consultations
Inpatient Visits
Physician Visits
Electrocardiogram
Tests and Procedures
Lower in High Spending Regions Higher in High Spending Regions
CT / MRI Brain
Pulmonary Function Test
Discharges
Inpatient Days in ICU or CCU
Total Inpatient Days
Hospital Utilization
Feeding Tube Placement
Emergency Intubation
Procedures -- Last 6 months of life
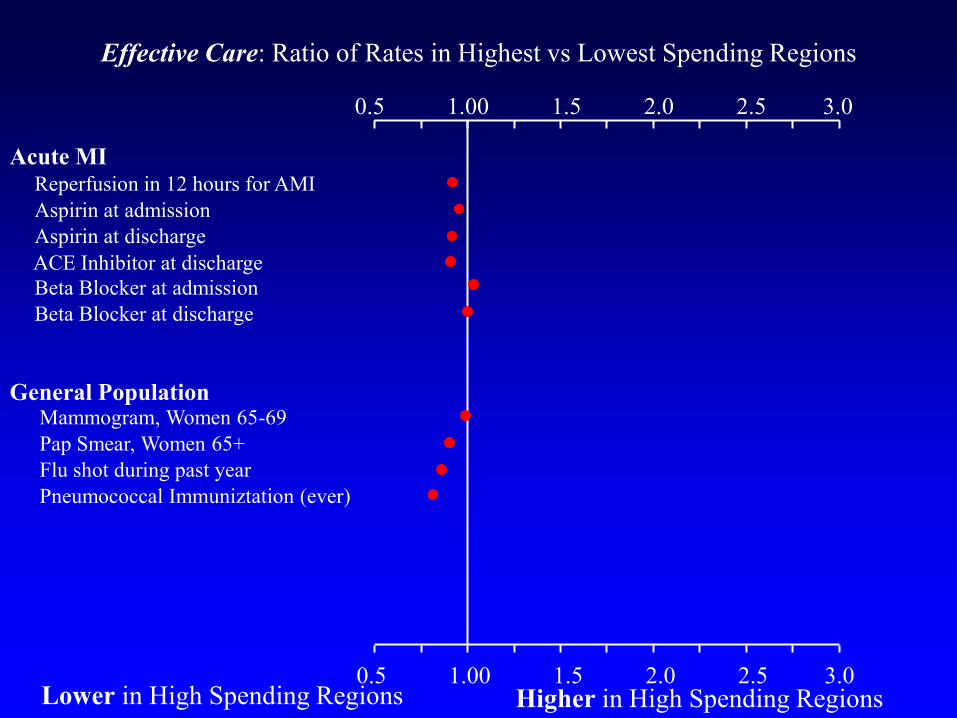
What does more spending buy?
Quality and outcomes
Quality of care
AMI quality worse
Preventive services worse
Access to CarePrimary care worse / no better
Waiting times worse
Satisfaction no better
Functional status no better
Mortality worse
Higher spending regions

The evidence -- key findings
Differences in spending are due to supply-sensitive services
More frequent visits, specialist consultations, tests, imaging
More time in the hospital
More aggressive use of services at the end of life
More isn’t better -- and may be worse.
We’re wasting about 30% of Medicare spending.

Part 2 -- what’s going on?
Why is spending higher?
Why is quality worse?

Why is spending higher?
Overuse of supply-sensitive services
These clinical decisions are highly discretionary
Scientific evidence largely non-existent
Decisions made under assumption “more is better”
Highly susceptible to capacity and incentives
Capacity:
Physicians tend to stay busy
Tend to use available resources to manage care
Incentives: pay for more, likely to get more
Constitute the major component of health care spending

About 80% of spending
on physician services is
devoted to
visits / consults
diagnostic tests
imaging
minor procedures
Regional differences in
intensity are due to
these services
Supply-sensitive services

Costs reflect the capacity of the system
Lowest
Quint ile
Highest
Quint ile
Ratio
Average Medicare Spending $3,922 $6,304 1.61
Supply of Resources
Hospital Beds / 1000 2.4 3.2 1.32
Physician Supply
Medical Subspecialists 28 44 1.65
General Internists 23 37 1.75
Family practitioner / GP 35 27 0.74
Surgeons 44 56 1.29
All other specialties 59 78 1.37
Over half of regional variation in Medicare spending is explained by the
local supply of hospital beds and medical specialists

Costs of care during first year after AMI, in
regions with high and low cardiologist supply
10000
12000
14000
16000
18000
20000
22000
24000
26000
89 90 91 92 93 94 95 96 97 98 99 2000
Highest Quintile
Lowest Quintile

Part 2 -- what’s going on?
Why is spending higher?
Supply-sensitive services represent the major component of
Medicare spending
Capacity is a powerful determinant of the use of supply
sensitive services
We’ve failed to limit the growth of capacity

Part 2 -- what’s going on?
Why is spending higher?
Supply-sensitive services represent the major component of
Medicare spending
Capacity is a powerful determinant of the use of supply
sensitive services
We’ve failed to limit the growth of capacity
Why might quality be worse?

Why might quality be worse?
Having more physicians involved in care increases
complexity and likelihood of errors.
0
5
10
15
20
25
30
35
Q1 Q2 Q3 Q4 Q5
Low <---- spending ----> High
Percent of AMI patients seeing
10 or more different MDs
Patients in high spending regions
are much more likely to have
multiple physicians involved in
their care.

Why might quality be worse?
Having more physicians involved in care increases
complexity and likelihood of errors.
Hospitals are dangerous places -- unnecessary hospital stays
could help explain the higher mortality rates.

Part 3 -- what’s to be done?
Underlying causes of poor quality and high costs
• Ignoring the problem of supply-sensitive services
• Wrong level of accountablity for quality and costs
• Inadequate information on performance
• Flawed incentives (rewarding more care)
Solutions
• Direct limits on growth of capacity
• Organizational accountability for quality and costs

Approaches: direct limits on capacity
Physician supply:
Freeze (or reduce) GME payments and positions
Freeze (or gradually reduce) number of medical licenses
Hospital / Other facilities:
Use payment system to reward reduced capacity
Capital payments broken out --- and limited
Restrict (or preclude) payments to new facilities
Reinvigorate Certificate of Need

Organizational accountability for quality and costs
What’s the right organizational level?
Integrated delivery systems
Hospital medical staffs -- and their hospital
Large medical groups
Necessary element: hospital and associated physicians
Why?
1. Large enough to support infrastructure for improvement
2. Performance measurement feasible (samples adequate)
3. It’s the level at which supply exerts its influence.

2.52.01.51.00.50.0
Yale-New Haven
St Raphael's
Mass General
Beth Israel
Brigham and Women's
Boston City
St. Elizabeth's
Boston University
Organizational accountability for costs (supply sensitive care)
Readmission rates over 3 years at Boston and New Haven
Teaching hospitals for cohorts of chronic disease patients
76.3
90.1
74.7
80.6
67.9
62.2
81.2
76.4
�Hospital
Loyalty (%)

2.52.01.51.00.50.0
Yale-New Haven
St Raphael's
Mass General
Beth Israel
Brigham and Women's
Boston City
St. Elizabeth's
Boston University
1.00
1.01
1.50
1.57
1.61
1.62
1.93
1.98
�Ratio to
Yale-NH
Organizational accountability for costs (supply sensitive care)
Readmission rates over 3 years at Boston and New Haven
Teaching hospitals for cohorts of chronic disease patients
76.3
90.1
74.7
80.6
67.9
62.2
81.2
76.4
�Hospital
Loyalty (%)

Organizational accountability for quality and costs
Define accountable care providers
Integrated delivery systems, medical groups
Hospitals and their affiliated medical staffs
Monitor their performance (using Medicare data)
Overall costs -- use of supply sensitive services
Quality -- existing measures are fine
Move beneficiaries to these providers
Allow inefficient providers to fail

Summary of the argument
Supply sensitive services-- discretionary visits, tests, hospital stays --
comprise the major component of health care spending -- and are
responsible for unwarranted regional variations in Medicare spending.
More isn’t better. In fact --- overuse of supply sensitive services
contributes to lower quality and worse health outcomes.
We are wasting 30% of Medicare spending.
To improve both the quality and efficiency of care, we must learn to
effectively manage the use of supply sensitive services. This will
likely entail:
Limiting capacity
Performance monitoring -- at the hospital / medical staff level
Payment reform