Embed Size (px)
Citation preview

Molecular Ecology (2010) 19, 3038–3051 doi: 10.1111/j.1365-294X.2010.04688.x
INVITED REVIEW
What can genetics tell us about population connectivity?
WINSOR H. LOWE* and FRED W. ALLENDORF*†
*Division of Biological Sciences, University of Montana, Missoula, MT 59812, USA, †School of Biological Sciences, Victoria
University of Wellington, Wellington, New Zealand
Corresponde
E-mail: wins
Abstract
Genetic data are often used to assess ‘population connectivity’ because it is difficult to
measure dispersal directly at large spatial scales. Genetic connectivity, however, depends
primarily on the absolute number of dispersers among populations, whereas demo-
graphic connectivity depends on the relative contributions to population growth rates of
dispersal vs. local recruitment (i.e. survival and reproduction of residents). Although
many questions are best answered with data on genetic connectivity, genetic data alone
provide little information on demographic connectivity. The importance of demographic
connectivity is clear when the elimination of immigration results in a shift from stable or
positive population growth to negative population growth. Otherwise, the amount of
dispersal required for demographic connectivity depends on the context (e.g. conserva-
tion or harvest management), and even high dispersal rates may not indicate
demographic interdependence. Therefore, it is risky to infer the importance of
demographic connectivity without information on local demographic rates and how
those rates vary over time. Genetic methods can provide insight on demographic
connectivity when combined with these local demographic rates, data on movement
behaviour, or estimates of reproductive success of immigrants and residents. We also
consider the strengths and limitations of genetic measures of connectivity and discuss
three concepts of genetic connectivity that depend upon the evolutionary criteria of
interest: inbreeding connectivity, drift connectivity, and adaptive connectivity. To
conclude, we describe alternative approaches for assessing population connectivity,
highlighting the value of combining genetic data with capture-mark-recapture methods
or other direct measures of movement to elucidate the complex role of dispersal in
natural populations.
Keywords: adaptation, demographic connectivity, drift, emigration, F-statistics, gene flow,
genetic connectivity, immigration, inbreeding, population dynamics, source–sink, spatial ecol-
ogy
Received 7 October 2009; revision received 21 April 2010; accepted 26 April 2010
The ecological paradigm remains challenging for evaluations using genetic markers, because the transition from demographic
dependence to independence occurs in a region of high migration where genetic methods have relatively little power.
Waples & Gaggiotti (2006)
Introduction
Dispersal can contribute significantly to population
growth rates, gene flow and, ultimately, species persis-
tence. Therefore, assessing the effects of dispersal is cru-
cial to understanding population biology and evolution
nce: Winsor H. Lowe, Fax: +1 406 243 4184;
in natural systems (Wright 1951; Hanski & Gilpin 1997;
Clobert et al. 2001). Likewise, effective protection of
endangered species and management of economically
important species often rely on estimates of ‘population
connectivity’ (Mills & Allendorf 1996; Monkkonen &
Reunanen 1999; Drechsler et al. 2003), a concept based
on the dispersal of individuals among discrete popula-
tions, but which can have very different meanings and
implications depending on how it is measured.
� 2010 Blackwell Publishing Ltd

Nt+1= Nt + Births – Deaths + Immigrants – Emigrants
Local recruitment Net immigration
Total recruitment
Fig. 1 Components of k, the discrete population growth rate,
where Nt is the number of individual in the population at
time t, Nt+1 is the number of individual at time t + 1 and k =
Nt+1 ⁄ Nt.
GEN ETIC A ND DEMOGRAPHI C CON NECTIVITY 3039
Genetic methods are frequently used to assess popu-
lation connectivity because it can be difficult to measure
dispersal directly at scales that are relevant to basic and
applied questions (Koenig et al. 1996; Leis 2002; Palum-
bi 2003; Hedgecock et al. 2007). But in most applica-
tions, genetic methods provide information on genetic
connectivity, which we define as the degree to which
gene flow affects evolutionary processes within popula-
tions. Although many questions can be answered with
data on genetic connectivity, genetic methods alone pro-
vide little information on demographic connectivity,
which we define as the degree to which population
growth and vital rates are affected by dispersal. Demo-
graphic connectivity is of central importance to basic
population biology (Gotelli 1991; Nichols et al. 2000;
Runge et al. 2006) and to species persistence in human-
modified systems (Kauffman et al. 2004; Griffin & Mills
2009; Peery et al. 2010).
Genetic indices of connectivity are invaluable for
assessing gene flow and the evolutionary consequences
of dispersal (e.g. Rieseberg & Burke 2001; Postma &
van Noordwijk 2005). We are concerned, however,
about important misconceptions associated with the use
of genetic indices to provide information about popula-
tion connectivity, which can lead to misinterpretation of
patterns of genetic connectivity to make inferences
about demographic connectivity. Our goals are to clar-
ify the difference between genetic and demographic
connectivity so that misinterpretation can be avoided
and to suggest methods for assessing the demographic
effects of dispersal for cases when that information is
needed. Current misconceptions may cause scientists
to undervalue these other methods for measuring
dispersal and demographic connectivity, such as cap-
ture-mark-recapture (CMR) approaches, and to underes-
timate the cumulative insight that comes from
combining these approaches with genetic analyses.
For this discussion, we define dispersal as (i) move-
ment of individuals between spatially discrete popula-
tions, and (ii) permanent or long-term settlement in the
new population. This definition is consistent with the
use of ‘migration’ in the population genetics literature,
where it implies both the movement of individuals
between populations and residence for enough time to
contribute to the gene pool of the new population
(Wright 1951; Crow & Kimura 1970). Genetic and demo-
graphic effects of dispersal can occur without permanent
settlement in the new population, but some minimum
residence time is necessary to distinguish dispersal from
temporary movements associated with foraging and
other daily activities (Clobert et al. 2001; Delgado &
Penteriani 2008; Peery et al. 2010). Our definition distin-
guishes dispersal from ‘migration’ as that term is used
in ecology and population biology, where it describes
� 2010 Blackwell Publishing Ltd
movements of animals in large numbers from one place
to another and is usually restricted to regular, periodic
movements of populations (Begon et al. 1990).
We have three specific objectives in this paper. First,
we hope to clarify the distinction between genetic and
demographic connectivity, drawing on general theory
and specific examples to do so. Second, we consider the
strengths and limitations of genetic measures of connec-
tivity in order to encourage careful interpretation of
these measures. Third, we describe other approaches
for assessing dispersal and population connectivity,
highlighting the value of combining genetic measures
with these complementary approaches to assess the
overall role of dispersal in natural populations.
Demographic connectivity
Demographically connected populations are those in
which population growth rates (k, r) or specific vital
rates (survival and birth rates) are affected by immigra-
tion or emigration (Hanski & Gilpin 1997; Runge et al.
2006; Mills 2007). Demographic connectivity is generally
thought to promote population stability (e.g. k ‡ 1.0)
and this stabilizing effect can occur at two different
scales. In individual populations, demographic connec-
tivity can promote stability by providing an immigrant
subsidy that compensates for low survival or birth rates
of residents [i.e. low local recruitment (Fig. 1); Pulliam
1988; Runge et al. 2006; ]. Demographic connectivity
can also promote the stability of metapopulations by
increasing colonization of unoccupied patches (i.e. dis-
crete subpopulations), even when the extinction rate of
occupied patches is high (Levins 1970; Gotelli 1991;
Hanski 1998).
Unlike genetic connectivity, which is primarily a
function of the absolute number of dispersers (see
below), demographic connectivity is a function of the
relative contribution of net immigration (i.e. immigra-
tion–emigration) to total recruitment in a focal popula-
tion (Figs 1 and 2). Total recruitment is the number of
‘new’ individuals at time t + 1 that were not present at
time t because they were born in the intervening inter-
val without being offset by deaths, or immigrated

NeSmall Large
mLo
wH
igh Intermediate
Intermediate
Intermediate
Inte
rmed
iate
Inte
rmed
iate
Inte
rmed
iate
High
Low
Low
Low
High
High
FST
Demogra
phic
indep
enden
ce
Local r
ecru
itmen
t
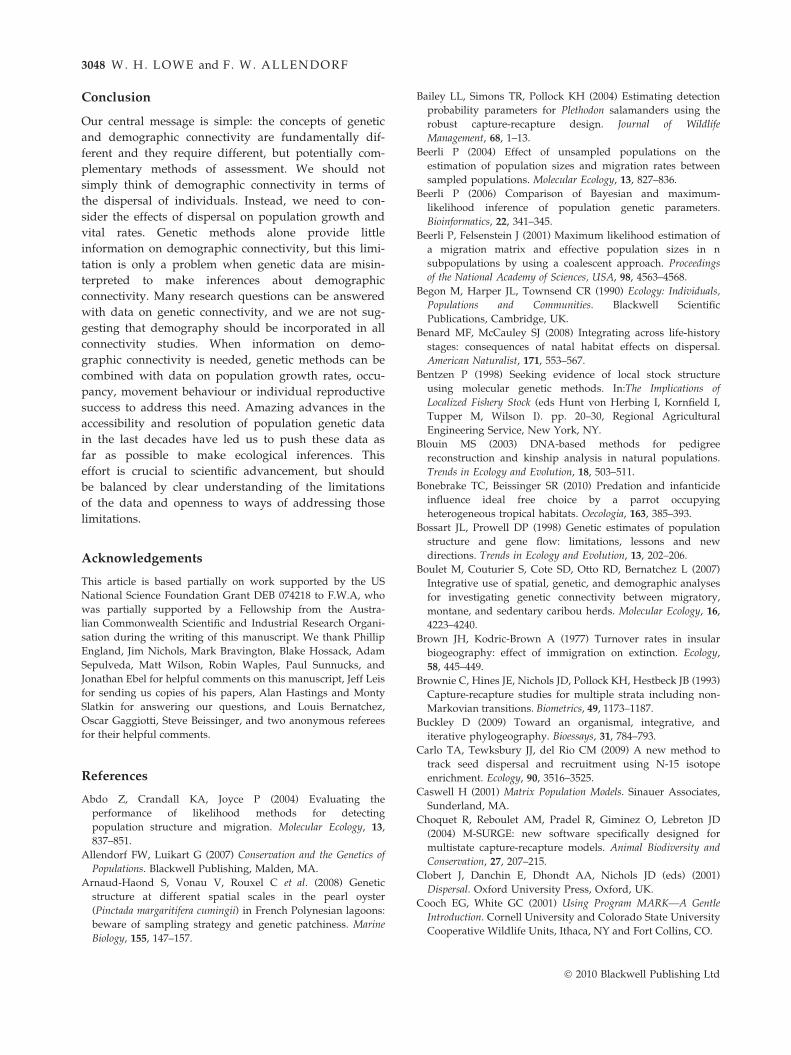
Fig. 2 Combinations of migration rate (m), effective popula-
tion size (Ne) and local recruitment resulting in different
expected values of genetic divergence (FST) and demographic
independence. Local recruitment is determined by births and
deaths of resident individuals (Fig. 1). Genetic divergence is
primarily a function of Nm, while demographic connectivity is
primarily a function of m relative to local recruitment.
3040 W . H . L O W E and F . W . A L L EN D O R F
during that time without being offset by emigrants.
Therefore, information on the extrinsic contribution of
dispersal and the intrinsic demographic rates of the
focal population are required to assess demographic
connectivity, and conclusions about the importance of
demographic connectivity should be qualified with
information on those intrinsic rates.
In rapidly growing populations (Nt+1 > > Nt), net
immigration can be very high in absolute terms, but rep-
resent a small proportion of total recruitment. Likewise,
low net immigration values may represent a large pro-
portion of total recruitment when populations are near
extinction (e.g. the ‘rescue effect’; Brown & Kodric-Brown
1977) or when population growth rates are low (Nt+1 >
Nt). Net immigration can compensate for negative local
recruitment in stable populations (Nt+1 = Nt; Fig. 1) and
can have this same compensatory effect in declining pop-
ulation (Nt+1 < Nt), slowing the rate of decline. More
generally, demographic connectivity (like genetic connec-
tivity) is highly sensitive to non-equilibrium population
dynamics (Kareiva 1990; Harrison 1991). If net immigra-
tion or local recruitment varies over time, then demo-
graphic connectivity will also vary and any broad
conclusions about the demographic importance of dis-
persal must acknowledge this temporal variability.
In the absence of other disturbances or strong out-
breeding depression, increasing demographic connectiv-
ity is unlikely to destabilize local populations and
metapopulations, but this does not mean that demo-
graphic connectivity is required for stability. Directional
bias has been documented repeatedly in empirical stud-
ies of animal movement (e.g. Skalski & Gilliam 2000;
Pe’er et al. 2004; Macneale et al. 2005; Bonebrake &
Beissinger 2010). Directionally-biased movement can
produce asymmetrical rates of interpopulation dis-
persal, where, according to the broad definitions used
by Kawecki & Holt (2002), ‘sources’ are net producers
of emigrants and ‘sinks’ are net recipients of immi-
grants. Sinks are commonly assumed to benefit from
immigration (reviewed in Runge et al. 2006), but uncer-
tainties about the demographic consequences of asym-
metrical dispersal challenge this assumption.
Immigration can be critical to the persistence of sinks
by compensating for low local recruitment. However,
Watkinson & Sutherland (1995) showed that this is not
the case in ‘pseudo-sinks’, where local recruitment is
density dependent and immigration causes it to drop
below the replacement level. Like ‘true sinks’, net immi-
gration is a significant component of total recruitment
in pseudo-sinks, but unlike true sinks, it is not neces-
sary for persistence. In a related scenario, the demo-
graphic contribution of immigrants may be low when
local density and competition for recruitment are high,
and increase as local density and competition decrease
(Kumar et al. 1993; Gomulkiewicz et al. 1999). Conse-
quently, the same immigration rate may have very dif-
ferent demographic implications as species density and
related interactions fluctuate in recipient populations.
These cases illustrate the central importance of informa-
tion on local demographic rates and the mechanisms
regulating those rates for assessing demographic con-
nectivity (Fig. 2).
Demographic connectivity is likely to be sensitive to
the attributes of dispersing individuals if vital rates
vary with dispersal status, body size, age or life history
stage. For example, juvenile dispersal is common in
many species (Johnson & Gaines 1990; Clobert et al.
2001), yet juveniles often have low survival rates inde-
pendent of dispersal status (Caswell 2001; Mills 2007).
Dispersers may also have lower survival or reproduc-
tive rates than non-dispersers due to pre-dispersal fac-
tors, costs incurred during dispersal or negative
interactions with residents after settlement (Stamps
et al. 2005; Benard & McCauley 2008; Hall et al. 2009).
The possibility that survival rate or reproductive poten-
tial varies with age, stage, dispersal status or other indi-
vidual attributes reinforces the importance of assessing
connectivity within the larger demographic context of
the focal population. Without that context, measures
of dispersal—whether from genetic or observational
data—are descriptive and cannot tell us whether and
by what mechanisms populations are linked.
� 2010 Blackwell Publishing Ltd

GEN ETIC A ND DEMOGRAPHI C CON NECTIVITY 3041
Even when demographic connectivity is necessary for
population persistence, benefits of connectivity to recipi-
ent populations must be weighed against the costs to
donor populations, risks to dispersers themselves, and
possible negative effects on other species. For example,
when dispersal is limited to corridors of once-continuous
habitat, resulting in dispersal rates that are high and
asymmetrical, emigration may overwhelm local recruit-
ment in donor populations (Cronin 2007; Fahrig 2007).
Also, dispersers often experience increased mortality and
negative interactions with other species (Johnson &
Gaines 1990; Morris 1992; Stamps et al. 2005) and can be
important vectors in the spread of disease (Mundt et al.
2009). The benefits of increasing demographic connectiv-
ity may generally outweigh these risks, but demographic
connectivity is no different from genetic connectivity in
its complexities and potential costs.
Delimiting demographic connectivity
If the elimination of immigration results in a shift from
stable or positive population growth (k ‡ 1.0) to nega-
tive population growth (k < 1.0), then the importance
of demographic connectivity is clear (Pulliam 1988).
Otherwise, thresholds of demographic connectivity are
context-dependent. Leis (2006) has defined demographic
connectivity as ‘the movement of individuals between
populations in numbers large enough to be demograph-
ically significant’. He also points out that ‘significance’
will depend upon the context. While we believe that a
definition of demographic connectivity needs to
acknowledge its continuity, as in the definition we pro-
pose in the introduction, the observation that it is con-
text-dependent is also extremely important. A small
contribution of net immigration to total recruitment
may be of significance to someone interested in basic
population ecology. However, much greater contribu-
tions of net immigration may be required for a manager
to consider two harvested stocks demographically con-
nected. A conservation biologist may have different cri-
teria for demographic connectivity depending on the
threats to a population or metapopulation of interest.
Table 1 gives definitions for three types of demographic
connectivity depending upon the context of use.
Table 1 Definitions for three types of demographic connectivity dep
threshold for connectivity
Ecological connectivity Con
Criterion Elimination of dispersal
reduces population growth rate
Elim
de
m low me
� 2010 Blackwell Publishing Ltd
Waples & Gaggiotti (2006) have suggested based on
Hastings (1993) that the transition from demographic
dependence to independence generally occurs when the
fraction of immigrants in a subpopulation falls below
10%. Hastings (1993) identifies the 10% threshold as
the point where population dynamics in two patches
transition from behaving independently to behaving as
a single population, with similar population sizes and
growth rates. This threshold influences demographic
similarity and synchrony in the model, but not the
demographic interdependence of the patches. Neverthe-
less, an assumption of demographic interdependence is
often implicit when this threshold is cited. Also, as Has-
tings emphasizes, predictions are contingent on all
model parameters. Therefore, any effect of the exchange
parameter (D) on population dynamics in the two-patch
system must be interpreted in the context of other
model parameters, particularly intrinsic population
growth rates (r). This is cause for extreme caution in
applying the results of Hastings (1993) or other theoreti-
cal studies to real systems where other demographic
parameters are unknown (Fig. 1).
Interpretation of demographic connectivity in geneticstudies
Explicit and implicit definitions of demographic connec-
tivity in the population genetics literature are consistent
with the ecological definition of populations described
by Waples & Gaggiotti (2006). This definition empha-
sizes ‘co-occurrence in space and time so that individu-
als have the opportunity to interact demographically
(competition, social and behavioural interactions, etc.)’.
By extension, it implies that demographic connectivity
is the degree to which dispersal promotes co-occurrence
and interactions between individuals from different
populations, independent of its effects on population
growth or vital rates. For example, Howeth et al. (2008)
contrast genetic and demographic connectivity in the
endangered Coahuilan box turtle (Terrapene coahuila).
Their measure of demographic connectivity, however, is
based only on movement of individuals among popula-
tions. They do not consider the effects of immigration
on population growth or vital rates.
ending upon the context of use. Criteria are for the minimum
servation connectivity Harvest connectivity
ination of dispersal
creases population viability
Elimination of dispersal
decreases yield
dium high

3042 W . H . L O W E and F . W . A L L EN D O R F
Changes in population growth or vital rates can be
caused by direct interactions between dispersers and
residents, but defining demographic connectivity based
on the possibility of these interactions gives the con-
cept a false murkiness, highlighting its symptoms as
opposed to its ultimate consequences. This is not
unlike defining genetic connectivity based on the
behavioural and physical interactions associated with
mating and not its ultimate evolutionary outcome: the
incorporation of dispersers’ genes into the local gene
pool.
The use of interaction-based definitions of demo-
graphic connectivity has two primary effects on how
we interpret and conduct research on spatial population
processes. Most obviously, these definitions misrepre-
sent the true meaning of demographic connectivity and
the very basic importance of interactions among popu-
lations that affect population growth and vital rates.
These definitions also promote misconceptions of the
utility of genetic methods for assessing population con-
nectivity. By emphasizing what genetic methods can
quantify (the co-occurrence of immigrants and resi-
dents) and not what genetic methods alone cannot
quantify (the contribution of dispersal to local popula-
tion growth), they incorrectly imply that genetic meth-
ods reveal everything we need to and can know about
population connectivity.
The secondary effects of nebulous definitions of
demographic connectivity are equally detrimental. By
encouraging reliance on genetic methods alone for
assessing connectivity, they can misdirect management
efforts through imprecise conclusions about the role of
dispersal in population persistence and productivity.
They also obscure the limitations of what we do know
about the effects of dispersal, thereby discouraging
novel approaches that could expand our understanding
of this fundamental process.
Genetic connectivity
We define genetic connectivity as the degree to which
gene flow affects evolutionary processes within subpop-
ulations. Researchers often use FST to assess gene flow,
the standard measure of divergence at individual loci
among subpopulations defined by Wright (1943), where
FST ¼r2
qð1� qÞ
and where q and r2 are the mean and variance of allelic
frequencies among subpopulations. Lower values of FST
indicate less genetic divergence; see Holsinger & Weir
(2009) for a recent review of defining, estimating and
interpreting FST.
In the island model, Wright (1951) considered a large
number of equal-size subpopulations in which genetic
drift produces genetic divergence among the subpopu-
lations at a rate inversely proportional to the local effec-
tive population size (Ne), which is assumed to equal the
census size, N. A proportion m of the individuals in
each subpopulation are immigrants from outside that
subpopulation and the allele frequency in immigrant
individuals is the average allele frequency in all sub-
populations. This model leads to the surprisingly sim-
ple result that at equilibrium the amount of divergence
among subpopulations for reasonably small values of m
is approximately
FST �1
4Nmþ 1ð1Þ
Note that because m is the proportion of immigrants and
N is the local subpopulation size, Nm is the actual num-
ber of immigrants entering a subpopulation each genera-
tion. Therefore, the expected divergence among
subpopulations is a function of the number of immi-
grants (Nm), rather than the proportion (m). For example,
we expect the same amount of divergence among sub-
populations of size 1000 with 2.5% migration as we do
among subpopulations of size 50 with 50% migration; in
both cases there are 25 immigrants per generation.
Delimiting genetic connectivity
Different amounts of dispersal are required to bring
about ‘genetic connectivity’ depending upon the evolu-
tionary consequences of interest (Table 2). The original
concept of genetic connectivity is from Sewall Wright
(1951) who concluded that very small amounts of gene
flow are sufficient to avoid harmful effects of genetic
drift and inbreeding which could lead to adaptive
decline (Equation 1 and Fig. 3). Wright’s (1951) obser-
vation that even Nm values of as low as one are suffi-
cient to avoid harmful effects of genetic drift and
inbreeding led to the one-migrant-per-generation rule
(OMPG; Mills & Allendorf 1996), which has been used
as a criterion for fragmentation in defining threatened
species categories of the World Conservation Union
(Mace & Lande 1991). There is no actual threshold at
which there will be no harmful effects of local inbreed-
ing. Rather the OMPG rule is based on the expectation
that even as little as one immigrant per generation is
sufficient for inbreeding connectivity – a significant reduc-
tion in the harmful effects of inbreeding (Table 2).
One immigrant per generation is sufficient to ensure
that the same alleles will be shared among populations
over long periods of evolutionary time. But one immi-
grant per generation is not sufficient to maintain nearly
� 2010 Blackwell Publishing Ltd
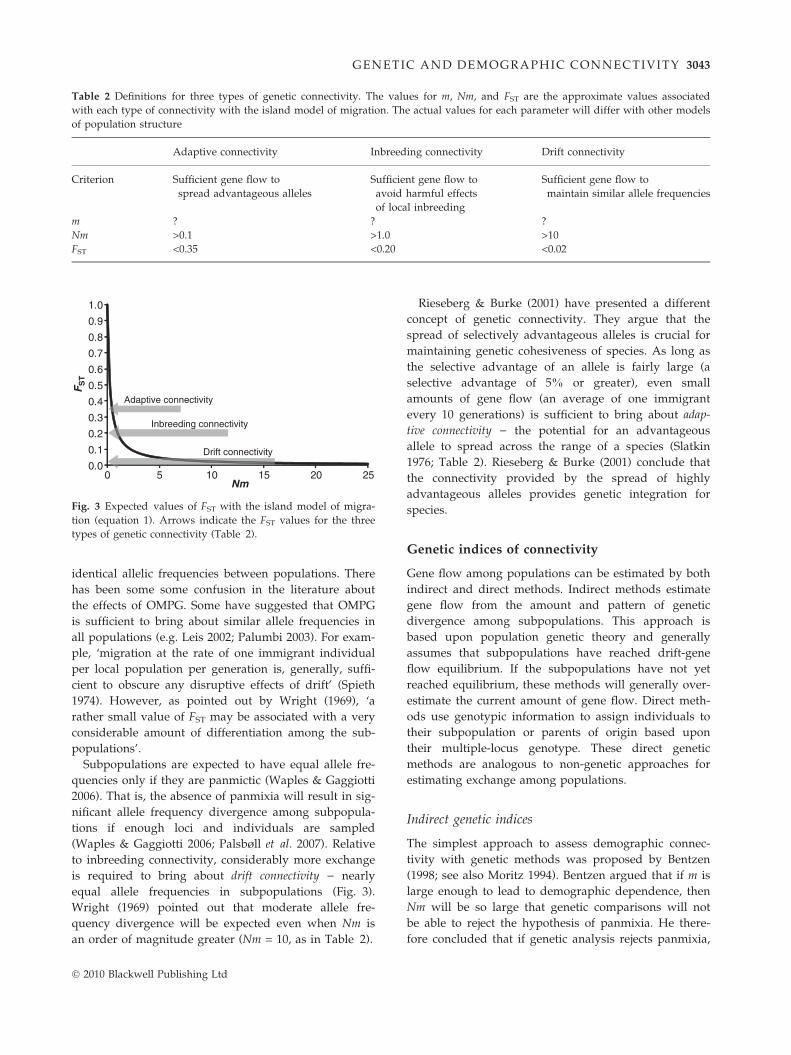
Table 2 Definitions for three types of genetic connectivity. The values for m, Nm, and FST are the approximate values associated
with each type of connectivity with the island model of migration. The actual values for each parameter will differ with other models
of population structure
Adaptive connectivity Inbreeding connectivity Drift connectivity
Criterion Sufficient gene flow to
spread advantageous alleles
Sufficient gene flow to
avoid harmful effects
of local inbreeding
Sufficient gene flow to
maintain similar allele frequencies
m ? ? ?
Nm >0.1 >1.0 >10
FST <0.35 <0.20 <0.02
0.0
0.1
0.2
0.3
0.4
0.5
0.6
0.7
0.8
0.9
1.0
0 5 10 15 20 25
FS
T
Nm
Adaptive connectivity
Inbreeding connectivity
Drift connectivity
Fig. 3 Expected values of FST with the island model of migra-
tion (equation 1). Arrows indicate the FST values for the three
types of genetic connectivity (Table 2).
GEN ETIC A ND DEMOGRAPHI C CON NECTIVITY 3043
identical allelic frequencies between populations. There
has been some some confusion in the literature about
the effects of OMPG. Some have suggested that OMPG
is sufficient to bring about similar allele frequencies in
all populations (e.g. Leis 2002; Palumbi 2003). For exam-
ple, ‘migration at the rate of one immigrant individual
per local population per generation is, generally, suffi-
cient to obscure any disruptive effects of drift’ (Spieth
1974). However, as pointed out by Wright (1969), ‘a
rather small value of FST may be associated with a very
considerable amount of differentiation among the sub-
populations’.
Subpopulations are expected to have equal allele fre-
quencies only if they are panmictic (Waples & Gaggiotti
2006). That is, the absence of panmixia will result in sig-
nificant allele frequency divergence among subpopula-
tions if enough loci and individuals are sampled
(Waples & Gaggiotti 2006; Palsbøll et al. 2007). Relative
to inbreeding connectivity, considerably more exchange
is required to bring about drift connectivity ) nearly
equal allele frequencies in subpopulations (Fig. 3).
Wright (1969) pointed out that moderate allele fre-
quency divergence will be expected even when Nm is
an order of magnitude greater (Nm = 10, as in Table 2).
� 2010 Blackwell Publishing Ltd
Rieseberg & Burke (2001) have presented a different
concept of genetic connectivity. They argue that the
spread of selectively advantageous alleles is crucial for
maintaining genetic cohesiveness of species. As long as
the selective advantage of an allele is fairly large (a
selective advantage of 5% or greater), even small
amounts of gene flow (an average of one immigrant
every 10 generations) is sufficient to bring about adap-
tive connectivity ) the potential for an advantageous
allele to spread across the range of a species (Slatkin
1976; Table 2). Rieseberg & Burke (2001) conclude that
the connectivity provided by the spread of highly
advantageous alleles provides genetic integration for
species.
Genetic indices of connectivity
Gene flow among populations can be estimated by both
indirect and direct methods. Indirect methods estimate
gene flow from the amount and pattern of genetic
divergence among subpopulations. This approach is
based upon population genetic theory and generally
assumes that subpopulations have reached drift-gene
flow equilibrium. If the subpopulations have not yet
reached equilibrium, these methods will generally over-
estimate the current amount of gene flow. Direct meth-
ods use genotypic information to assign individuals to
their subpopulation or parents of origin based upon
their multiple-locus genotype. These direct genetic
methods are analogous to non-genetic approaches for
estimating exchange among populations.
Indirect genetic indices
The simplest approach to assess demographic connec-
tivity with genetic methods was proposed by Bentzen
(1998; see also Moritz 1994). Bentzen argued that if m is
large enough to lead to demographic dependence, then
Nm will be so large that genetic comparisons will not
be able to reject the hypothesis of panmixia. He there-
fore concluded that if genetic analysis rejects panmixia,
3044 W . H . L O W E and F . W . A L L EN D O R F
then this provides strong evidence that the populations
are demographically independent. However, Palsbøll
et al. (2007) found that departures from panmixia can
be detected consistently, even with migration rates as
high as 20%, if many highly variable genetic markers
are used. In general, dataset size and choice of statistical
methods appear to strongly affect detection of depar-
tures from panmixia (Patterson et al. 2006; Reich et al.
2008). Although these findings are specific to the simula-
tion parameters used, they suggest that departure from
panmixia is, at best, subjective evidence of demographic
independence. Departure from panmixia can also result
from stochastic spatial and temporal variance in repro-
ductive success and origin of recruits, further complicat-
ing interpretations of demographic connectivity using
this method (Johnson & Black 1984; Gonzalez-
Wanguemert et al. 2007; Arnaud-Haond et al. 2008).
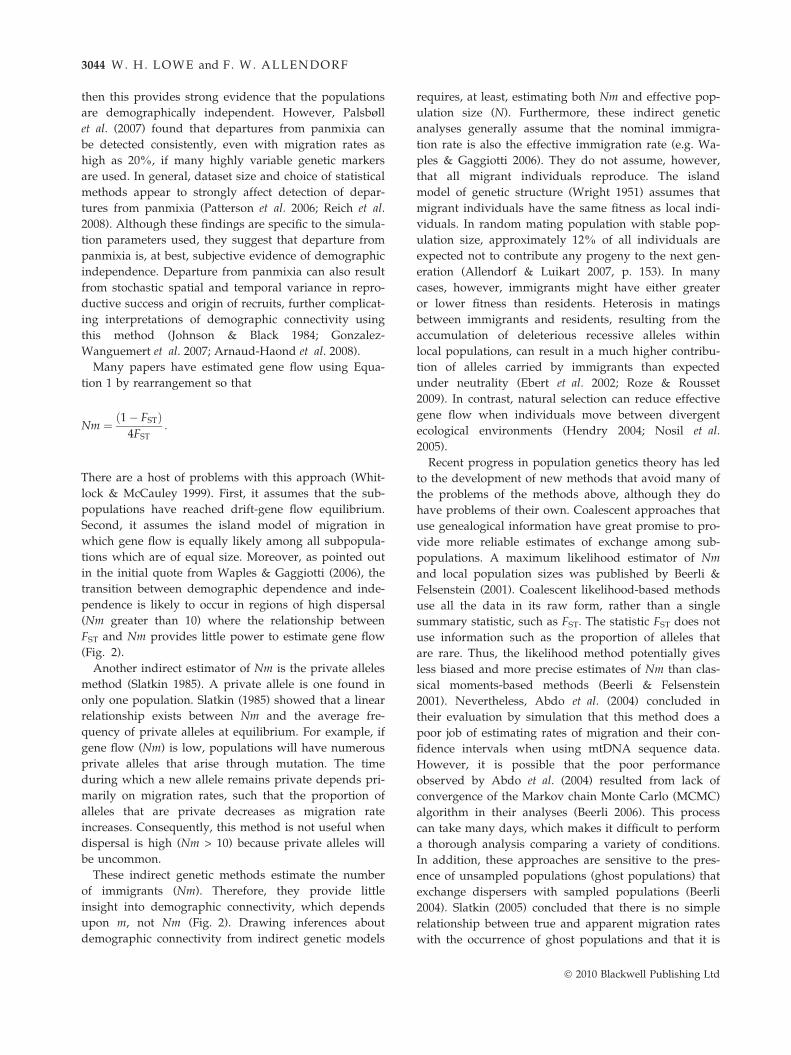
Many papers have estimated gene flow using Equa-
tion 1 by rearrangement so that
Nm ¼ ð1� FSTÞ4FST
:
There are a host of problems with this approach (Whit-
lock & McCauley 1999). First, it assumes that the sub-
populations have reached drift-gene flow equilibrium.
Second, it assumes the island model of migration in
which gene flow is equally likely among all subpopula-
tions which are of equal size. Moreover, as pointed out
in the initial quote from Waples & Gaggiotti (2006), the
transition between demographic dependence and inde-
pendence is likely to occur in regions of high dispersal
(Nm greater than 10) where the relationship between
FST and Nm provides little power to estimate gene flow
(Fig. 2).
Another indirect estimator of Nm is the private alleles
method (Slatkin 1985). A private allele is one found in
only one population. Slatkin (1985) showed that a linear
relationship exists between Nm and the average fre-
quency of private alleles at equilibrium. For example, if
gene flow (Nm) is low, populations will have numerous
private alleles that arise through mutation. The time
during which a new allele remains private depends pri-
marily on migration rates, such that the proportion of
alleles that are private decreases as migration rate
increases. Consequently, this method is not useful when
dispersal is high (Nm > 10) because private alleles will
be uncommon.
These indirect genetic methods estimate the number
of immigrants (Nm). Therefore, they provide little
insight into demographic connectivity, which depends
upon m, not Nm (Fig. 2). Drawing inferences about
demographic connectivity from indirect genetic models
requires, at least, estimating both Nm and effective pop-
ulation size (N). Furthermore, these indirect genetic
analyses generally assume that the nominal immigra-
tion rate is also the effective immigration rate (e.g. Wa-
ples & Gaggiotti 2006). They do not assume, however,
that all migrant individuals reproduce. The island
model of genetic structure (Wright 1951) assumes that
migrant individuals have the same fitness as local indi-
viduals. In random mating population with stable pop-
ulation size, approximately 12% of all individuals are
expected not to contribute any progeny to the next gen-
eration (Allendorf & Luikart 2007, p. 153). In many
cases, however, immigrants might have either greater
or lower fitness than residents. Heterosis in matings
between immigrants and residents, resulting from the
accumulation of deleterious recessive alleles within
local populations, can result in a much higher contribu-
tion of alleles carried by immigrants than expected
under neutrality (Ebert et al. 2002; Roze & Rousset
2009). In contrast, natural selection can reduce effective
gene flow when individuals move between divergent
ecological environments (Hendry 2004; Nosil et al.
2005).
Recent progress in population genetics theory has led
to the development of new methods that avoid many of
the problems of the methods above, although they do
have problems of their own. Coalescent approaches that
use genealogical information have great promise to pro-
vide more reliable estimates of exchange among sub-
populations. A maximum likelihood estimator of Nm
and local population sizes was published by Beerli &
Felsenstein (2001). Coalescent likelihood-based methods
use all the data in its raw form, rather than a single
summary statistic, such as FST. The statistic FST does not
use information such as the proportion of alleles that
are rare. Thus, the likelihood method potentially gives
less biased and more precise estimates of Nm than clas-
sical moments-based methods (Beerli & Felsenstein
2001). Nevertheless, Abdo et al. (2004) concluded in
their evaluation by simulation that this method does a
poor job of estimating rates of migration and their con-
fidence intervals when using mtDNA sequence data.
However, it is possible that the poor performance
observed by Abdo et al. (2004) resulted from lack of
convergence of the Markov chain Monte Carlo (MCMC)
algorithm in their analyses (Beerli 2006). This process
can take many days, which makes it difficult to perform
a thorough analysis comparing a variety of conditions.
In addition, these approaches are sensitive to the pres-
ence of unsampled populations (ghost populations) that
exchange dispersers with sampled populations (Beerli
2004). Slatkin (2005) concluded that there is no simple
relationship between true and apparent migration rates
with the occurrence of ghost populations and that it is
� 2010 Blackwell Publishing Ltd

GEN ETIC A ND DEMOGRAPHI C CON NECTIVITY 3045
not possible to place an upper bound on the potential
effects of ghost populations.
In contrast to the island model of migration, nearby
individuals are more likely to mate with one another in
isolation by distance models. In the original isolation by
distance model (IBD; Wright 1943), individuals are con-
tinuously distributed across the landscape; neighbour-
hoods of individuals exist that are areas within which
panmixia occurs and across which genetic differentia-
tion occurs due to isolation by distance. The spatial
scale over which IBD develops is proportional to the
scale of gene flow. This approach has been used to esti-
mate dispersal rate by examining the relatedness of
individuals (Watts et al. 2007). We believe that such
‘landscape genetics’ approaches are even more difficult
to combine with a demographic perspective. Other than
cases where individuals can be assigned back to parents
at a known location (discussed below), making the
jump from individual relatedness to demographic con-
nectivity seems like a huge stretch because relatedness
is likely to be very sensitive to individual behaviours
and chance breeding among individuals. It is a big step
from here to conclude anything about what is happen-
ing at the demographic level.
Direct genetic indices
Analysis of many genetic loci makes it possible to
assign individuals to their subpopulation of origin
based upon their multiple-locus genotypes (assignment
tests; Manel et al. 2005). Assignment tests use genotypic
information to identify individuals who did not origi-
nate in the subpopulation in which they were sampled
in a way that is analogous to non-genetic approaches
for estimating immigrants among populations (e.g.
marking individuals). Assigning individuals to the cor-
rect local population requires the presence of genetic
divergence among subpopulations. Therefore, in gen-
eral, assignment methods do not work well at high lev-
els of gene flow. However, the amount of divergence
required cannot be generalized because the power to
identify immigrants also depends upon the sample size
of individuals, as well as the number and variability of
loci sampled. With large sample sizes and numbers of
variable loci, individuals can be correctly assigned even
with low genetic divergence (Paetkau et al. 2004; Hall
et al. 2009). The standard assignment test approach has
also been extended to identify individuals with immi-
grant ancestry within the last generation or two (Manel
et al. 2005).
Assignment methods originally assumed Hardy-
Weinberg proportions and gametic equilibrium among
loci (Rannala & Mountain 1997; Pritchard et al. 2000),
but a more recent approach uses multilocus genotype
� 2010 Blackwell Publishing Ltd
data and gametic disequilibrium to estimate local
inbreeding coefficients and contemporary migration
rates among subpopulations (e.g. BAYESASS; Wilson &
Rannala 2003). A thorough simulation evaluation of the
performance of this approach (Faubet et al. 2007) has
concluded that it can provide accurate estimation of
migration rates (m) even when m is fairly high
(m = 0.10) if genetic differentiation is not too low (FST >
0.05). This scenario is most likely when N is low. When
N is high, m must be lower than 0.10 for accurate esti-
mation. Faubet et al. (2007) conclude that BAYESASS is
unlikely to be useful for identifying demographically
independent subpopulations for borderline cases when
m is near 10%. However, we believe that any assess-
ment of demographic independence is risky without
information on local demographic rates, regardless of
m.
Single-generation dispersal distances can also be esti-
mated using multi-locus genotypes to identify the par-
ents of individuals, assuming that offspring were born
at or near the location of the parents when sampling
occurred (Blouin 2003). This approach does not depend
upon the presence of genetic divergence among local
populations to identify immigrants. However, it does
require sampling all, or almost all, of the potential par-
ents, or the use of resampling simulations to estimate
the true diversity of parental genotypes from a sub-
sample. Parentage analysis has been used to estimate
dispersal distances and distribution of raccoons (Procyon
lotor; Cullingham et al. 2008), large-scale dispersal in
water voles (Arvicola terrestris; Telfer et al. 2003), and
precapture dispersal in banner-tailed kangaroo rats
(Dipodomys spectabilis; Waser et al. 2006).
In an innovative application, Peery et al. (2008) used
parentage analysis and population simulation to assess
demographic connectivity in marbled murrelets (Brachy-
ramphus marmotus). Specifically, they compared the
observed number of parent–offspring dyads in a sub-
population to the number expected by chance assuming
a closed population to estimate the annual effective
(breeding) immigration rate. With information on local
demographic parameters, k was then estimated with
and without effective immigration to assess its impact
on population growth. Estimates of effective immigra-
tion are not as informative as estimates of net immigra-
tion because they do not account for emigration or
direct numerical effects of immigrants (Fig. 1). Never-
theless, it is clear from Peery et al. (2008) that effective
immigration rates can provide important insight on
demographic connectivity.
Hall et al. (2009) used a combination of assignment
tests and parentage analysis to show that immigrants
were less likely to breed than residents in a population
of marbled murrelets. This finding illustrates the

3046 W . H . L O W E and F . W . A L L EN D O R F
potential disconnect between numerical and breeding
effects of immigration. Like the approach of Peery et al.
(2008), it also underscores the value of combining
genetic and demographic information to assess popula-
tion connectivity. In cases like the one described by Hall
et al. (2009), count-based demographic estimates might
show a stable population supported by immigration,
whereas genetic data would show an isolated popula-
tion with small N and at risk of inbreeding depression.
In addition to these demographic and genetic implica-
tions, assessing the relative fitness of immigrants vs.
residents is crucial to understanding how dispersal is
maintained in natural populations (Johnson & Gaines
1990; Ronce 2007; Lowe in press).
Other approaches for assessing dispersal andpopulation connectivity
In the last decade there have been important advances
in tracking dispersal directly (Holden & Blackburn
2006; Wikelski et al. 2006; Ovaskainen et al. 2008) and
in methods for linking those data to population-level
processes (Nichols et al. 2000; Cooch & White 2001;
MacKenzie et al. 2006). Here we provide an overview
of direct approaches to assessing demographic connec-
tivity and dispersal, with particular emphasis on how
information gained from these approaches can comple-
ment data on genetic connectivity. We recognize that
there are many taxa for which direct estimates of demo-
graphic connectivity are not feasible (e.g. many plants,
invertebrates, marine fishes) and we conclude this sec-
tion with a discussion of non-genetic approaches for
assessing dispersal in these groups.
Arguably, the most significant advances in our under-
standing of the details of demographic exchange have
come from improvements in capture-mark-recapture
(CMR) models and the software for implementing those
models. In particular, multistate models (Brownie et al.
1993; Schwarz et al. 1993) allow the estimation of sur-
vival (S) and recapture probabilities (p) in multiple popu-
lations and transition probabilities among populations
(W). Estimates of S and W can then be used to calculate
survival ⁄ transition probabilities (/), representing the
probability of an animal surviving from time t to t + 1
and either moving to another population or remaining in
the same population. Recapture probability is the proba-
bility that a marked animal at risk of capture at time t is
captured at t, and thus controls for differences in detec-
tion probabilities among populations or over time. By
combining parameter estimates from multistate models
with estimates of population growth rates from other
CMR models (Pradel 1996), one can determine the rela-
tive contributions of net immigration and local recruit-
ment to population growth (e.g. Lowe 2003).
Reverse-time CMR analysis have further advanced
this area of research by providing a single modelling
framework for simultaneous estimation of net immigra-
tion and local recruitment (Nichols et al. 2000). Reverse-
time analysis uses multistate estimation methods on the
reverse capture histories of individuals to simulta-
neously estimate net immigration and local recruitment
in each of the linked study populations. Here again,
estimates of recapture probability (p) for each popula-
tion are crucial for minimizing detection bias, and these
approaches are evolving rapidly to address other poten-
tial sources of error in parameter estimation (e.g. tem-
porary emigration, uncertain species identification;
Bailey et al. 2004; Runge et al. 2007). Several software
options are available for implementing basic and
reverse-time analyses using multistate models, includ-
ing program MARK (White & Burnham 1999), MSSUR-
VIV (Hines 1994) and M-SURGE (Choquet et al. 2004).
Sandercock (2006) provides a thorough review of cur-
rent CMR models and assumptions, and Runge et al.
(2006) provide a useful conceptual framework for classi-
fying sources and sinks using parameters estimated by
these models. Peery et al. (2006) used reverse-time
CMR analysis and matrix population models to esti-
mate the contribution of immigration to lambda in mar-
bled murrelets, and Grant et al. (2010) used multistate
CMR analysis and metapopulation simulation to show
that overland dispersal is important to population sta-
bility in stream salamanders.
Rigid, spatially and temporally extensive sampling
regimes are necessary to meet the assumptions and data
requirements of multistate CMR models. For example,
if sampling is not spatially extensive enough to encom-
pass the majority of source populations, immigrants
from unsampled ‘ghost’ populations will be misclassi-
fied as local recruits, and emigrants to unsampled pop-
ulations will be misclassified as local mortalities. Also,
it is difficult to incorporate population stage or age
structure into reverse-time CMR analyses. Despite these
limitations, there is no better way to assess the contri-
bution of dispersal to local population dynamics, other
than experimentally eliminating dispersal (Diffendorfer
1998). Given the complexities of demographic connec-
tivity, the power of CMR approaches to minimize bias
in parameter estimates, and rapid improvements in the
flexibility of multistate models, it is reasonable to expect
that, in the future, conclusions regarding the demo-
graphic importance of dispersal will be supported by
CMR analyses. When it is not possible to implement
multistate models at the scale of interest, traditional
CMR methods can provide insight on lambda and local
recruitment (Fig. 1) that, by inference, elucidate the
importance of demographic connectivity in the larger
system.
� 2010 Blackwell Publishing Ltd

GEN ETIC A ND DEMOGRAPHI C CON NECTIVITY 3047
We are aware of no case where multistate CMR esti-
mates of demographic connectivity and data on genetic
connectivity are available for the same system, yet such
a study could provide valuable insight on whether and
under what conditions these two metrics of population
connectivity are correlated. Although FST is expected to
be insensitive to variation in demographic connectivity
beyond a low threshold (Fig. 2; Waples & Gaggiotti
2006), multistate CMR analyses could elucidate the spe-
cific factors influencing the position of that threshold
(e.g. relative rates of local recruitment vs. net immigra-
tion, or of immigration vs. emigration; Fig. 1). It will
always be easier to assess genetic connectivity at large
scales; therefore, better understanding of the conditions
under which pairwise FST values are correlated with
demographic connectivity would expand the inferential
scope of genetic data. As importantly, evidence that
demographic connectivity is consistently insignificant
despite variation in pairwise FST values would have the
opposite effect, forcing us to narrow our interpretations
of genetic connectivity. Genetic and demographic mea-
sures of connectivity may differ for reasons discussed
throughout this paper. When this is the case, popula-
tion simulations based on species attributes (generation
time, number of offspring, mating system) may be use-
ful for isolating the cause of this difference (e.g. non-
equilibrium population dynamics, the time lag in the
genetic data, unsampled populations; Hastings & Harri-
son 1994; Whitlock & McCauley 1999).
There are many taxa for which direct, CMR methods
are not feasible due to large population sizes that result
in low recapture rates, small body sizes that preclude
direct marking, the production of many highly-
dispersive propagules, and the logistical difficulties of
sampling long-distance dispersal events. These taxa
include many plants, terrestrial invertebrates and both
marine and freshwater invertebrates, and fish with pela-
gic larvae. Below we discuss methods for assessing
demographic connectivity and dispersal in these taxa.
Also, please refer to the section on direct measures of
genetic connectivity for other approaches combining
genetic and demographic data that may be applicable
in these taxa.
Data on patch occupancy (i.e. presence ⁄ absence) has
been used extensively to understand how colonization
and extinction rates of populations are affected by
attributes of habitat patches (e.g. size, isolation) and
the intervening landscape (e.g. specific barriers, human
activity; Hanski & Gilpin 1997; Moilanen 1999). These
occupancy-based, metapopulation approaches have
been especially useful in systems where direct, CMR-
based estimates of demographic connectivity would be
impossible, including plants (Husband & Barrett 1996;
Honnay et al. 2005), terrestrial invertebrates (Harrison
� 2010 Blackwell Publishing Ltd
et al. 1995; Schooley & Wiens 2005), marine inverte-
brates (Ellien et al. 2000; Foggo et al. 2007), and mar-
ine fishes (Man et al. 1995; Kritzer & Sale 2004).
Recent improvements in occupancy models and related
software have expanded the applicability of these
models to demographic questions (MacKenzie et al.
2006; Royle & Dorazio 2008). Harrison & Hastings
(1996) concluded that the high turnover rates of classi-
cal metapopulations (Levins 1970) should generally be
associated with low levels of among-population genetic
differentiation. However, network theory and microsat-
ellite data were used to identify subpopulations critical
for maintaining genetic connectivity in a metapopula-
tion of the threatened seagrass Posidonia oceanica
(Rozenfeld et al. 2008).
Even when analyses of demographic connectivity are
not possible, marked individuals can provide informa-
tion on movement behavior that is valuable for interpret-
ing patterns of genetic connectivity (e.g. Boulet et al.
2007; Milot et al. 2008). With information on movement
behavior from marked individuals of two sympatric
stream salamanders, Lowe et al. (2008) were able to pre-
dict opposing patterns of genetic and phenotypic diver-
gence along New Hampshire headwater streams.
Without direct data on movement, inference about the
mechanism underlying these divergence patterns would
likely have been incorrect. These movement data can
come from assignment tests and parentage analyses, in
addition to non-genetic marking methods, underscoring
the value of combining direct and indirect genetic meth-
ods to assess genetic connectivity.
Stable isotopes have been useful for assessing dis-
persal in species producing large numbers of propa-
gules that cannot be individually marked (Thorrold
et al. 2001; Macneale et al. 2005; Carlo et al. 2009; Wil-
liamson et al. 2009) and in species that disperse espe-
cially long distances (Kennedy et al. 1997; Graves et al.
2002; Sepulveda et al. 2009). Isotopes and other mass-
marking methods cannot alone reveal the demographic
context of dispersal, but they can complement measures
of genetic connectivity by providing information on
contemporary dispersal patterns. Specifically, they
allow for explicit testing of the temporal resolution of
genetic data (Bossart & Prowell 1998; Zellmer & Know-
les 2009) and can serve as an empirical foundation for
generating a priori predictions of broader patterns of
divergence and phylogeography (Kelly et al. 2005;
Buckley 2009; Templeton 2009). The combination of
mass-marking methods and genetic analyses has been
especially valuable for evaluating the importance of
connectivity in marine systems, where many species
produce large numbers of small propagules that cannot
be individually marked (Jones et al. 2005; Cowen &
Sponaugle 2009; Weersing & Toonen 2009).
3048 W . H . L O W E and F . W . A L L EN D O R F
Conclusion
Our central message is simple: the concepts of genetic
and demographic connectivity are fundamentally dif-
ferent and they require different, but potentially com-
plementary methods of assessment. We should not
simply think of demographic connectivity in terms of
the dispersal of individuals. Instead, we need to con-
sider the effects of dispersal on population growth and
vital rates. Genetic methods alone provide little
information on demographic connectivity, but this limi-
tation is only a problem when genetic data are misin-
terpreted to make inferences about demographic
connectivity. Many research questions can be answered
with data on genetic connectivity, and we are not sug-
gesting that demography should be incorporated in all
connectivity studies. When information on demo-
graphic connectivity is needed, genetic methods can be
combined with data on population growth rates, occu-
pancy, movement behaviour or individual reproductive
success to address this need. Amazing advances in the
accessibility and resolution of population genetic data
in the last decades have led us to push these data as
far as possible to make ecological inferences. This
effort is crucial to scientific advancement, but should
be balanced by clear understanding of the limitations
of the data and openness to ways of addressing those
limitations.
Acknowledgements
This article is based partially on work supported by the US
National Science Foundation Grant DEB 074218 to F.W.A, who
was partially supported by a Fellowship from the Austra-
lian Commonwealth Scientific and Industrial Research Organi-
sation during the writing of this manuscript. We thank Phillip
England, Jim Nichols, Mark Bravington, Blake Hossack, Adam
Sepulveda, Matt Wilson, Robin Waples, Paul Sunnucks, and
Jonathan Ebel for helpful comments on this manuscript, Jeff Leis
for sending us copies of his papers, Alan Hastings and Monty
Slatkin for answering our questions, and Louis Bernatchez,
Oscar Gaggiotti, Steve Beissinger, and two anonymous referees
for their helpful comments.
References
Abdo Z, Crandall KA, Joyce P (2004) Evaluating the
performance of likelihood methods for detecting
population structure and migration. Molecular Ecology, 13,
837–851.
Allendorf FW, Luikart G (2007) Conservation and the Genetics of
Populations. Blackwell Publishing, Malden, MA.
Arnaud-Haond S, Vonau V, Rouxel C et al. (2008) Genetic
structure at different spatial scales in the pearl oyster
(Pinctada margaritifera cumingii) in French Polynesian lagoons:
beware of sampling strategy and genetic patchiness. Marine
Biology, 155, 147–157.
Bailey LL, Simons TR, Pollock KH (2004) Estimating detection
probability parameters for Plethodon salamanders using the
robust capture-recapture design. Journal of Wildlife
Management, 68, 1–13.
Beerli P (2004) Effect of unsampled populations on the
estimation of population sizes and migration rates between
sampled populations. Molecular Ecology, 13, 827–836.
Beerli P (2006) Comparison of Bayesian and maximum-
likelihood inference of population genetic parameters.
Bioinformatics, 22, 341–345.
Beerli P, Felsenstein J (2001) Maximum likelihood estimation of
a migration matrix and effective population sizes in n
subpopulations by using a coalescent approach. Proceedings
of the National Academy of Sciences, USA, 98, 4563–4568.
Begon M, Harper JL, Townsend CR (1990) Ecology: Individuals,
Populations and Communities. Blackwell Scientific
Publications, Cambridge, UK.
Benard MF, McCauley SJ (2008) Integrating across life-history
stages: consequences of natal habitat effects on dispersal.
American Naturalist, 171, 553–567.
Bentzen P (1998) Seeking evidence of local stock structure
using molecular genetic methods. In:The Implications of
Localized Fishery Stock (eds Hunt von Herbing I, Kornfield I,
Tupper M, Wilson I). pp. 20–30, Regional Agricultural
Engineering Service, New York, NY.
Blouin MS (2003) DNA-based methods for pedigree
reconstruction and kinship analysis in natural populations.
Trends in Ecology and Evolution, 18, 503–511.
Bonebrake TC, Beissinger SR (2010) Predation and infanticide
influence ideal free choice by a parrot occupying
heterogeneous tropical habitats. Oecologia, 163, 385–393.
Bossart JL, Prowell DP (1998) Genetic estimates of population
structure and gene flow: limitations, lessons and new
directions. Trends in Ecology and Evolution, 13, 202–206.
Boulet M, Couturier S, Cote SD, Otto RD, Bernatchez L (2007)
Integrative use of spatial, genetic, and demographic analyses
for investigating genetic connectivity between migratory,
montane, and sedentary caribou herds. Molecular Ecology, 16,
4223–4240.
Brown JH, Kodric-Brown A (1977) Turnover rates in insular
biogeography: effect of immigration on extinction. Ecology,
58, 445–449.
Brownie C, Hines JE, Nichols JD, Pollock KH, Hestbeck JB (1993)
Capture-recapture studies for multiple strata including non-
Markovian transitions. Biometrics, 49, 1173–1187.
Buckley D (2009) Toward an organismal, integrative, and
iterative phylogeography. Bioessays, 31, 784–793.
Carlo TA, Tewksbury JJ, del Rio CM (2009) A new method to
track seed dispersal and recruitment using N-15 isotope
enrichment. Ecology, 90, 3516–3525.
Caswell H (2001) Matrix Population Models. Sinauer Associates,
Sunderland, MA.
Choquet R, Reboulet AM, Pradel R, Giminez O, Lebreton JD
(2004) M-SURGE: new software specifically designed for
multistate capture-recapture models. Animal Biodiversity and
Conservation, 27, 207–215.
Clobert J, Danchin E, Dhondt AA, Nichols JD (eds) (2001)
Dispersal. Oxford University Press, Oxford, UK.
Cooch EG, White GC (2001) Using Program MARK—A Gentle
Introduction. Cornell University and Colorado State University
Cooperative Wildlife Units, Ithaca, NY and Fort Collins, CO.
� 2010 Blackwell Publishing Ltd

GEN ETIC A ND DEMOGRAPHI C CON NECTIVITY 3049
Cowen RK, Sponaugle S (2009) Larval dispersal and marine
population connectivity. Annual Review of Marine Science, 1,
443–466.
Cronin JT (2007) From population sources to sieves: the matrix
alters host-parasitoid source–sink structure. Ecology, 88,
2966–2976.
Crow JF, Kimura M (1970) An Introduction to Population
Genetics Theory. The Blackburn Press, Caldwell, NJ.
Cullingham CI, Pond BA, Kyle CJ et al. (2008) Combining
direct and indirect genetic methods to estimate dispersal for
informing wildlife disease management decisions. Molecular
Ecology, 17, 4874–4886.
Delgado MD, Penteriani V (2008) Behavioral states help
translate dispersal movements into spatial distribution
patterns of floaters. American Naturalist, 172, 475–485.
Diffendorfer JE (1998) Testing models of source–sink dynamics
and balanced dispersal. Oikos, 81, 417–433.
Drechsler M, Frank K, Hanski I, O’Hara RB, Wissel C (2003)
Ranking metapopulation extinction risk: from patterns in
data to conservation management decisions. Ecological
Applications, 13, 990–998.
Ebert D, Haag C, Kirkpatrick M et al. (2002) A selective
advantage to immigrant genes in a Daphnia metapopulation.
Science, 295, 485–488.
Ellien C, Thiebaut E, Barnay AS et al. (2000) The influence of
variability in larval dispersal on the dynamics of a marine
metapopulation in the eastern Channel. Oceanologica Acta, 23,
423–442.
Fahrig L (2007) Non-optimal animal movement in human-
altered landscapes. Functional Ecology, 21, 1003–1015.
Faubet P, Waples RS, Gaggiotti OE (2007) Evaluating the
performance of a multilocus Bayesian method for the
estimation of migration rates. Molecular Ecology, 16, 1149–1166.
Foggo A, Bilton DT, Rundle SD (2007) Do developmental
mode and dispersal shape abundance-occupancy
relationships in marine macroinvertebrates? Journal of Animal
Ecology, 76, 695–702.
Gomulkiewicz R, Holt RD, Barfield M (1999) The effects of
density dependence and immigration on local adaptation
and niche evolution in a black-hole sink environment.
Theoretical Population Biology, 55, 283–296.
Gonzalez-Wanguemert N, Perez-Ruzafa A, Canovas F, Garcia-
Charton JA, Marcos C (2007) Temporal genetic variation in
populations of Diplodus sargus from the SW Mediterranean
Sea. Marine Ecology-Progress Series, 334, 237–244.
Gotelli NJ (1991) Metapopulation models: the rescue effect, the
propagule rain, and the core-satellite hypothesis. American
Naturalist, 138, 768–776.
Grant EHC, Nichols JD, Lowe WH, Fagan WF (2010) Use of
multiple dispersal pathways facilitates amphibian
persistence in stream networks. Proceedings of the National
Academy of Sciences, USA, 107, 6936–6940.
Graves GR, Romanek CS, Navarro AR (2002) Stable isotope
signature of philopatry and dispersal in a migratory
songbird. Proceedings of the National Academy of Sciences, USA,
99, 8096–8100.
Griffin PC, Mills LS (2009) Sinks without borders: snowshoe
hare dynamics in a complex landscape. Oikos, 118, 1487–1498.
Hall LA, Palsbøll PJ, Beissinger SR et al. (2009) Characterizing
dispersal patterns in a threatened seabird with limited
genetic structure. Molecular Ecology, 18, 5074–5085.
� 2010 Blackwell Publishing Ltd
Hanski I (1998) Metapopulation dynamics. Nature, 396, 41–49.
Hanski I, Gilpin ME (eds) (1997) Metapopulation Biology:
Ecology, Genetics, and Evolution. Academic Press, San Diego,
CA.
Harrison S (1991) Local extinction in a metapopulation context:
an empirical evaluation. Biological Journal of the Linnean
Society, 42, 73–88.
Harrison S, Hastings A (1996) Genetic and evolutionary
consequences of metapopulation structure. Trends in Ecology
and Evolution, 11, 180–183.
Harrison S, Thomas C, Lewinsohn T (1995) Testing a
metapopulation model of coexistence in the insect
community on ragwort (Senecio jacobaea). American Naturalist,
145, 546–562.
Hastings A (1993) Complex interactions between dispersal and
dynamics: lessons from coupled logistic equations. Ecology,
74, 1362–1372.
Hastings A, Harrison S (1994) Metapopulation dynamics and
genetics. Annual Review of Ecology and Systematics, 25, 167–188.
Hedgecock D, Barber PH, Edmands S (2007) Genetic
approaches to measuring connectivity. Oceanography, 20, 70–
79.
Hendry AP (2004) Selection against migrants contributes to the
rapid evolution of ecologically dependent reproductive
isolation. Evolutionary Ecology Research, 6, 1219–1236.
Hines JE (1994) MSSURVIV User’s Manual. The Patuxent
Environmental Science Center, Laurel, MD.
Holden C, Blackburn L (2006) Tag team. Science, 313, 780–781.
Holsinger KE, Weir BS (2009) Genetics in geographically
structured populations: defining, estimating and interpreting
FST. Nature Reviews Genetics, 10, 639–650.
Honnay O, Jacquemyn H, Bossuyt B, Hermy M (2005) Forest
fragmentation effects on patch occupancy and population
viability of herbaceous plant species. New Phytologist, 166,
723–736.
Howeth JG, McGaugh SE, Hendrickson DA (2008) Contrasting
demographic and genetic estimates of dispersal in the
endangered Coahuilan box turtle: a contemporary approach
to conservation. Molecular Ecology, 17, 4209–4221.
Husband BC, Barrett SCH (1996) A metapopulation
perspective in plant population biology. Journal of Ecology,
84, 461–469.
Johnson MS, Black R (1984) Pattern beneath the chaos: the
effect of recruitment on genetic patchiness in an intertidal
limpet. Evolution, 38, 1371–1383.
Johnson ML, Gaines MS (1990) Evolution of dispersal:
theoretical models and empirical tests using birds and
mammals. Annual Review of Ecology and Systematics, 21, 449–
480.
Jones GP, Planes S, Thorrold SR (2005) Coral reef fish larvae
settle close to home. Current Biology, 15, 1314–1318.
Kareiva P (1990) Population dynamics in spatially complex
environments—theory and data. Philosophical Transactions of
the Royal Society of London Series B: Biological Sciences, 330,
175–190.
Kauffman MJ, Pollock JF, Walton B (2004) Spatial structure,
dispersal, and management of a recovering raptor
population. American Naturalist, 164, 582–597.
Kawecki TJ, Holt RD (2002) Evolutionary consequences of
asymmetric dispersal rates. American Naturalist, 160, 333–
347.

3050 W . H . L O W E and F . W . A L L EN D O R F
Kelly JF, Ruegg KC, Smith TB (2005) Combining isotopic and
genetic markers to identify breeding origins of migrant
birds. Ecological Applications, 15, 1487–1494.
Kennedy BP, Folt CL, Blum JD, Chamberlain CP (1997)
Natural isotope markers in salmon. Nature, 387, 766–767.
Koenig WD, VanVuren D, Hooge PN (1996) Detectability,
philopatry, and the distribution of dispersal distances in
vertebrates. Trends in Ecology and Evolution, 11, 514–517.
Kritzer JP, Sale PF (2004) Metapopulation ecology in the sea:
from Levins’ model to marine ecology and fisheries science.
Fish and Fisheries, 5, 131–140.
Kumar BK, Parthasarathy PR, Sharafali M (1993) Density-
dependent birth and death processes with controlled
immigration. Stochastic Analysis and Applications, 11, 181–
196.
Leis JM (2002) Pacific coral-reef fishes: the implications of
behaviour and ecology of larvae for biodiversity and
conservation, and a reassessment of the open population
paradigm. Environmental Biology of Fishes, 65, 199–208.
Leis JM (2006) Are larvae of demersal fishes plankton or
nekton? Advances in Marine Biology, 51, 57–141.
Levins RA (1970) Extinction. In:Some Mathematical Questions in
Biolog (ed Gerstenhaber M). pp. 75–107, The American
Mathematical Society, Providence, RI.
Lowe WH (2003) Linking dispersal to local population
dynamics: a case study using a headwater salamander
system. Ecology, 84, 2145–2154.
Lowe WH (In press) Explaining long-distance dispersal: effects
of dispersal distance on survival and growth in a stream
salamander. Ecology, In press.
Lowe WH, McPeek MA, Likens GE, Cosentino BJ (2008)
Linking movement behavior to dispersal and divergence in
plethodontid salamanders. Molecular Ecology, 17, 4459–4469.
Mace GM, Lande R (1991) Assessing extinction
threats—toward a reevaluation of IUCN threatened species
categories. Conservation Biology, 5, 148–157.
MacKenzie DI, Nichols JD, Royle JA et al. (2006) Occupancy
Estimation and Modeling: Inferring Patterns and Dynamics of
Species Occurrence. Academic Press, San Diego, CA.
Macneale KH, Peckarsky BL, Likens GE (2005) Stable
isotopes identify dispersal patterns of stonefly populations
living along stream corridors. Freshwater Biology, 50, 1117–
1130.
Man A, Law R, Polunin NVC (1995) Role of marine reserves in
recruitment to reef fisheries—a metapopulation model.
Biological Conservation, 71, 197–204.
Manel S, Gaggiotti OE, Waples RS (2005) Assignment methods:
matching biological questions with appropriate techniques.
Trends in Ecology and Evolution, 20, 136–142.
Mills LS (2007) Conservation of Wildlife Populations: Demography,
Genetics, and Management. Blackwell, Malden, MA.
Mills LS, Allendorf FW (1996) The one-migrant-per-generation
rule in conservation and management. Conservation Biology,
10, 1509–1518.
Milot E, Weimerskirch H, Bernatchez L (2008) The seabird
paradox: dispersal, genetic structure and population
dynamics in a highly mobile, but philopatric albatross
species. Molecular Ecology, 17, 1658–1673.
Moilanen A (1999) Patch occupancy models of metapopulation
dynamics: efficient parameter estimation using implicit
statistical inference. Ecology, 80, 1031–1043.
Monkkonen M, Reunanen P (1999) On critical thresholds in
landscape connectivity: a management perspective. Oikos, 84,
302–305.
Moritz C (1994) Defining ‘evolutionarily significant units’ for
conservation. Trends in Ecology and Evolution, 9, 373–375.
Morris DW (1992) Scales and costs of habitat selection in
heterogeneous landscapes. Evolutionary Ecology, 6, 412–
432.
Mundt CC, Sackett KE, Wallace LD, Cowger C, Dudley JP
(2009) Long-distance dispersal and accelerating waves of
disease: empirical relationships. American Naturalist, 173,
456–466.
Nichols JD, Hines JE, Lebreton JD, Pradel R (2000) Estimation
of contributions to population growth: a reverse-time
capture-recapture approach. Ecology, 81, 3362–3376.
Nosil P, Vines TH, Funk DJ (2005) Reproductive isolation
caused by natural selection against immigrants from
divergent habitats. Evolution, 59, 705–719.
Ovaskainen O, Smith AD, Osborne JL et al. (2008) Tracking
butterfly movements with harmonic radar reveals an effect
of population age on movement distance. Proceedings of the
National Academy of Sciences, USA, 105, 19090–19095.
Paetkau D, Slade R, Burden M, Estoup A (2004) Genetic
assignment methods for the direct, real-time estimation of
migration rate: a simulation-based exploration of accuracy
and power. Molecular Ecology, 13, 55–65.
Palsbøll PJ, Berube M, Allendorf FW (2007) Identification of
management units using population genetic data. Trends in
Ecology and Evolution, 22, 11–16.
Palumbi SR (2003) Population genetics, demographic
connectivity, and the design of marine reserves. Ecological
Applications, 13, S146–S158.
Patterson N, Price AL, Reich D (2006) Population structure and
eigenanalysis. Plos Genetics, 2, 2074–2093.
Pe’er G, Saltz D, Thulke HH, Motro U (2004) Response to
topography in a hilltopping butterfly and implications for
modelling nonrandom dispersal. Animal Behaviour, 68, 825–
839.
Peery MZ, Becker BH, Beissinger SR (2006) Combining
demographic and count-based approaches to identify
source–sink dynamics of a threatened seabird. Ecological
Applications, 16, 1516–1528.
Peery MZ, Beissinger SR, House RF et al. (2008) Characterizing
source–sink dynamics with genetic parentage assignments.
Ecology, 89, 2746–2759.
Peery MZ, Hall LA, Sellas A et al. (2010) Genetic analyses of
historic and modern marbled murrelets suggest decoupling
of migration and gene flow after habitat fragmentation.
Proceedings of the Royal Society Series B: Biological Sciences, 277,
697–706.
Postma E, van Noordwijk AJ (2005) Gene flow maintains a
large genetic difference in clutch size at a small spatial scale.
Nature, 433, 65–68.
Pradel R (1996) Utilization of capture-mark-recapture for the
study of recruitment and population growth rate. Biometrics,
52, 703–709.
Pritchard JK, Stephens M, Donnelly P (2000) Inference of
population structure using multilocus genotype data.
Genetics, 155, 945–959.
Pulliam HR (1988) Sources, sinks, and population regulation.
American Naturalist, 132, 652–661.
� 2010 Blackwell Publishing Ltd

GEN ETIC A ND DEMOGRAPHI C CON NECTIVITY 3051
Rannala B, Mountain JL (1997) Detecting immigration by using
multilocus genotypes. Proceedings of the National Academy of
Sciences, USA, 94, 9197–9201.
Reich D, Price AL, Patterson N (2008) Principal component
analysis of genetic data. Nature Genetics, 40, 491–492.
Rieseberg LH, Burke JM (2001) A genic view of species
integration. Journal of Evolutionary Biology, 14, 883–886.
Ronce O (2007) How does it feel to be like a rolling stone? Ten
questions about dispersal evolution. Annual Review of Ecology
Evolution and Systematics, 38, 231–253.
Royle JA, Dorazio RM (2008) Hierarchical Modeling and Inference
in Ecology: The Analysis of Data from Populations,
Metapopulations and Communities. Academic Press, Boston,
MA.
Roze D, Rousset F (2009) Strong effects of heterosis on the
evolution of dispersal rates. Journal of Evolutionary Biology,
22, 1221–1233.
Rozenfeld AF, Arnaud-Haond S, Hernandez-Garcia E et al.
(2008) Network analysis identifies weak and strong links in a
metapopulation system. Proceedings of the National Academy of
Sciences, USA, 105, 18824–18829.
Runge JP, Runge MC, Nichols JD (2006) The role of local
populations within a landscape context: defining and
classifying sources and sinks. American Naturalist, 167, 925–
938.
Runge JP, Hines JE, Nichols JD (2007) Estimating species-
specific survival and movement when species identification
is uncertain. Ecology, 88, 282–288.
Sandercock BK (2006) Estimation of demographic parameters
from live-encounter data: a summary review. Journal of
Wildlife Management, 70, 1504–1520.
Schooley RL, Wiens JA (2005) Spatial ecology of cactus bugs:
area constraints and patch connectivity. Ecology, 86, 1627–
1639.
Schwarz CJ, Schweigert JF, Arnason AN (1993) Estimating
migration rates using tag-recovery data. Biometrics, 49, 177–
193.
Sepulveda AJ, Colyer WT, Lowe WH, Vinson MR (2009) Using
nitrogen stable isotopes to detect long-distance movement in
a threatened cutthroat trout. Canadian Journal of Fisheries and
Aquatic Sciences, 66, 672–682.
Skalski GT, Gilliam JF (2000) Modeling diffusive spread in a
heterogeneous population: a movement study with stream
fish. Ecology, 81, 1685–1700.
Slatkin M (1976) The rate of spread of an advantageous allele
in a subdivided population. In:Population Genetics and Ecolog
(eds Karlin S, Nevo E). pp. 767–780, Academic Press, New
York, NY.
Slatkin M (1985) Rare alleles as indicators of gene flow.
Evolution, 39, 53–65.
Slatkin M (2005) Seeing ghosts: the effect of unsampled
populations on migration rates estimated for sampled
populations. Molecular Ecology, 14, 67–73.
� 2010 Blackwell Publishing Ltd
Spieth PT (1974) Gene flow and genetic differentiation.
Genetics, 78, 961–965.
Stamps JA, Krishnan VV, Reid ML (2005) Search costs and
habitat selection by dispersers. Ecology, 86, 510–518.
Telfer S, Piertney SB, Dallas JF et al. (2003) Parentage
assignment detects frequent and large-scale dispersal in
water voles. Molecular Ecology, 12, 1939–1949.
Templeton AR (2009) Statistical hypothesis testing in
intraspecific phylogeography: nested clade
phylogeographical analysis vs. approximate Bayesian
computation. Molecular Ecology, 18, 319–331.
Thorrold SR, Latkoczy C, Swart PK, Jones CM (2001) Natal
homing in a marine fish metapopulation. Science, 291, 297–299.
Waples RS, Gaggiotti O (2006) What is a population? An
empirical evaluation of some genetic methods for identifying
the number of gene pools and their degree of connectivity.
Molecular Ecology, 15, 1419–1439.
Waser PM, Busch JD, McCormick CR, DeWoody JA (2006)
Parentage analysis detects cryptic precapture dispersal in a
philopatric rodent. Molecular Ecology, 15, 1929–1937.
Watkinson AR, Sutherland WJ (1995) Sources, sinks and
pseudo-sinks. Journal of Animal Ecology, 64, 126–130.
Watts PC, Rousset F, Saccheri IJ et al. (2007) Compatible
genetic and ecological estimates of dispersal rates in insect
(Coenagrion mercuriale: Odonata: Zygoptera) populations:
analysis of ‘neighbourhood size’ using a more precise
estimator. Molecular Ecology, 16, 737–751.
Weersing K, Toonen RJ (2009) Population genetics, larval
dispersal, and connectivity in marine systems. Marine
Ecology-Progress Series, 393, 1–12.
White GC, Burnham KP (1999) Program MARK: survival
estimation from populations of marked animals. Bird Study,
46, 120–139.
Whitlock MC, McCauley DE (1999) Indirect measures of gene
flow and migration: FST „ 1 ⁄ (4Nm+1). Heredity, 82, 117–125.
Wikelski M, Moskowitz D, Adelman JS et al. (2006) Simple
rules guide dragonfly migration. Biology Letters, 2, 325–329.
Williamson DH, Jones GP, Thorrold SR (2009) An experimental
evaluation of transgenerational isotope labelling in a coral
reef grouper. Marine Biology, 156, 2517–2525.
Wilson GA, Rannala B (2003) Bayesian inference of recent
migration rates using multilocus genotypes. Genetics, 163,
1177–1191.
Wright S (1943) Isolation by distance. Genetics, 28, 114–138.
Wright S (1951) The genetical structure of natural populations.
Annals of Eugenics, 15, 323–354.
Wright S (1969) Evolution and the Genetics of Populations, Vol. 2.
University of Chicago Press, Chicago, IL.
Zellmer AJ, Knowles LL (2009) Disentangling the effects of
historic vs. contemporary landscape structure on population
genetic divergence. Molecular Ecology, 18, 3593–3602.
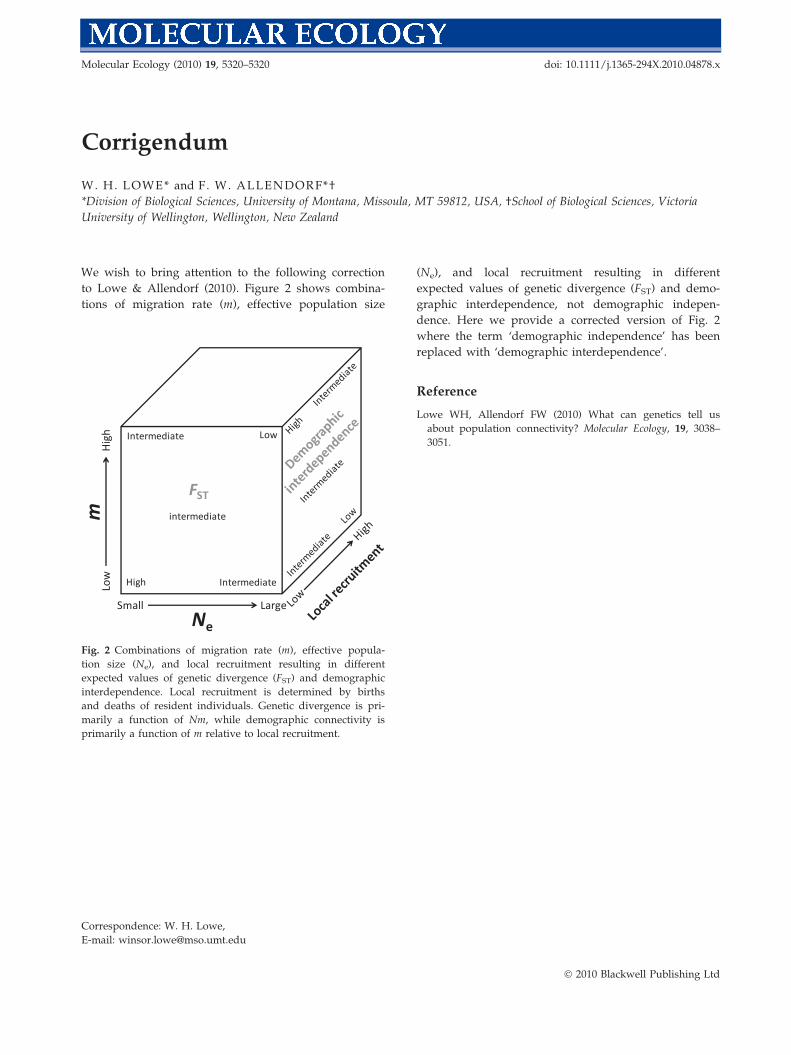
Corrigendum
W. H. LOWE* and F. W. ALLENDORF*†
*Division of Biological Sciences, University of Montana, Missoula, MT 59812, USA, †School of Biological Sciences, Victoria
University of Wellington, Wellington, New Zealand
We wish to bring attention to the following correction
to Lowe & Allendorf (2010). Figure 2 shows combina-
tions of migration rate (m), effective population size
(Ne), and local recruitment resulting in different
expected values of genetic divergence (FST) and demo-
graphic interdependence, not demographic indepen-
dence. Here we provide a corrected version of Fig. 2
where the term ‘demographic independence’ has been
replaced with ‘demographic interdependence’.
Reference
Lowe WH, Allendorf FW (2010) What can genetics tell us
about population connectivity? Molecular Ecology, 19, 3038–
3051.
Ne
Small Large Low
High
mHigh
Low
Intermediate
Intermediate
Intermediate
Low
Intermediate
Intermediate
intermediate
High
High
Low
FST
Fig. 2 Combinations of migration rate (m), effective popula-
tion size (Ne), and local recruitment resulting in different
expected values of genetic divergence (FST) and demographic
interdependence. Local recruitment is determined by births
and deaths of resident individuals. Genetic divergence is pri-
marily a function of Nm, while demographic connectivity is
primarily a function of m relative to local recruitment.
Correspondence: W. H. Lowe,
E-mail: [email protected]
� 2010 Blackwell Publishing Ltd
Molecular Ecology (2010) 19, 5320–5320 doi: 10.1111/j.1365-294X.2010.04878.x