Embed Size (px)
Citation preview

What Can Test ScoresTell You about the
State of Your School?
CRCT DIBELS
Dr.Michael McKennaGeorgia Southern University
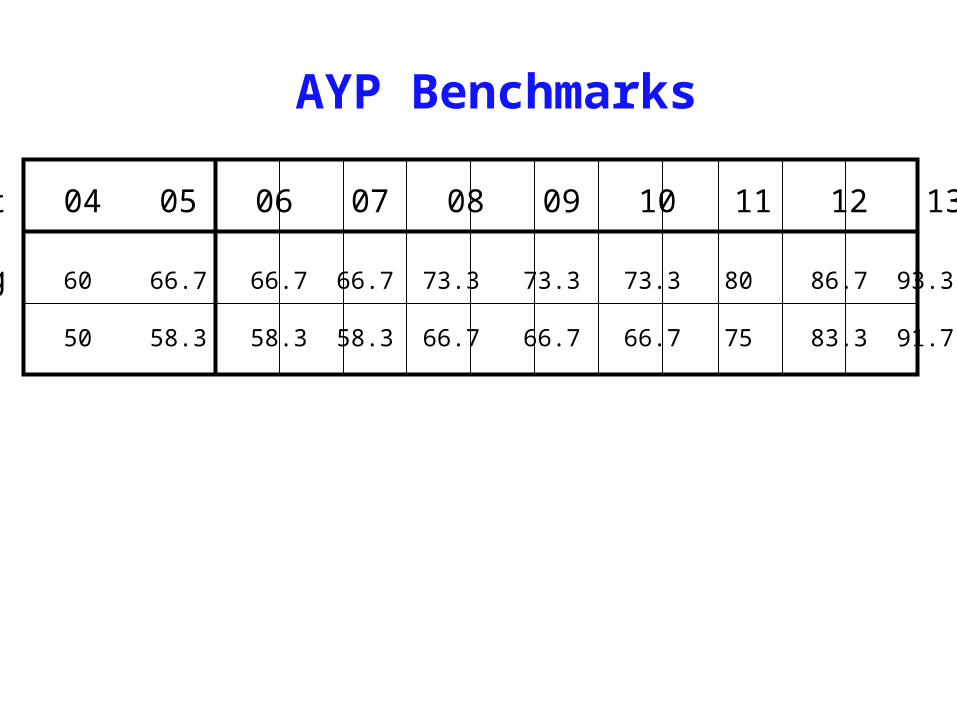
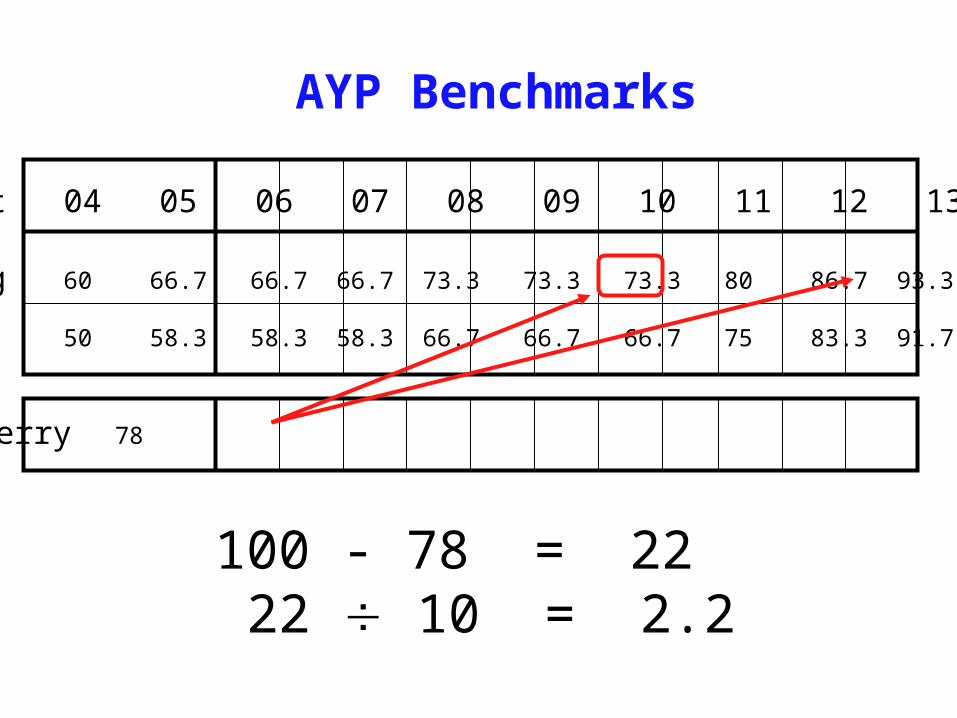
AYP Benchmarks
Subject 04 05 06 07 08 09 10 11 12 13 14
Rdg/Eng 60 66.7 66.7 66.7 73.3 73.3 73.3 80 86.7 93.3 100
Math 50 58.3 58.3 58.3 66.7 66.7 66.7 75 83.3 91.7 100
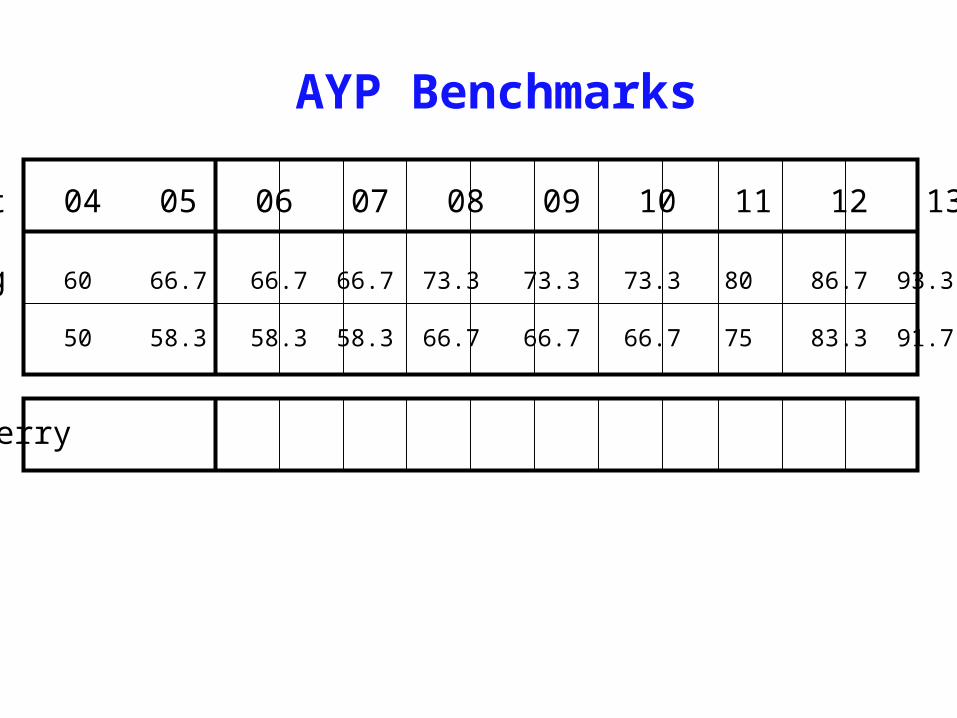
AYP Benchmarks
Subject 04 05 06 07 08 09 10 11 12 13 14
Rdg/Eng 60 66.7 66.7 66.7 73.3 73.3 73.3 80 86.7 93.3 100
Math 50 58.3 58.3 58.3 66.7 66.7 66.7 75 83.3 91.7 100
Kashinkerry 78 80.2 82.4 84.6 86.8 89.0 91.2 93.4 95.6 97.8 100
AYP Benchmarks
Subject 04 05 06 07 08 09 10 11 12 13 14
Rdg/Eng 60 66.7 66.7 66.7 73.3 73.3 73.3 80 86.7 93.3 100
Math 50 58.3 58.3 58.3 66.7 66.7 66.7 75 83.3 91.7 100
Kashinkerry 78 80.2 82.4 84.6 86.8 89.0 91.2 93.4 95.6 97.8 100
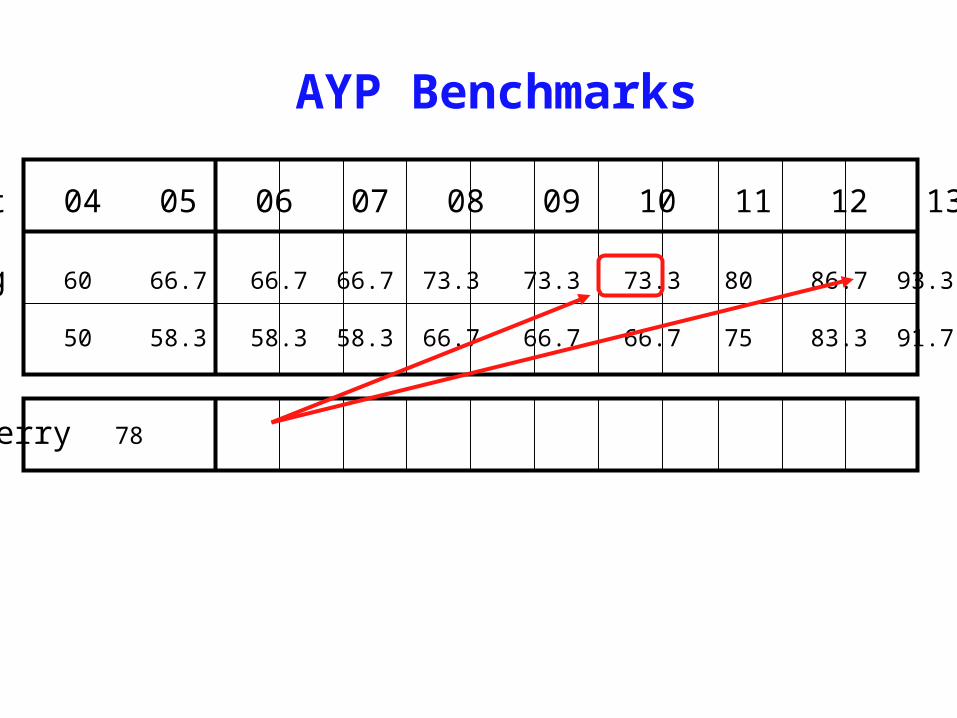
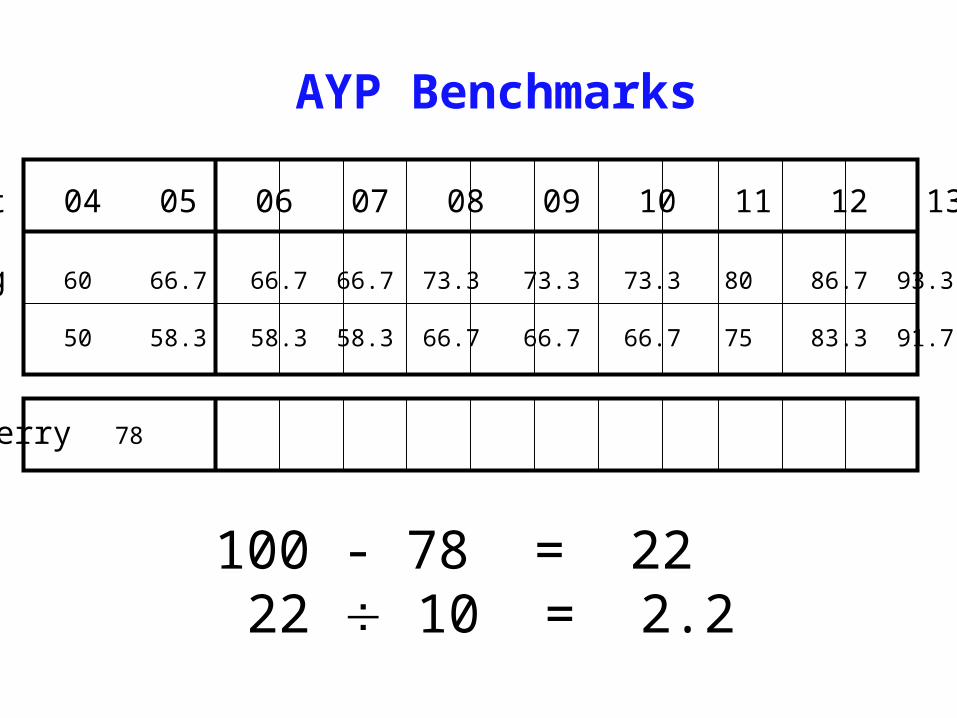
AYP Benchmarks
Subject 04 05 06 07 08 09 10 11 12 13 14
Rdg/Eng 60 66.7 66.7 66.7 73.3 73.3 73.3 80 86.7 93.3 100
Math 50 58.3 58.3 58.3 66.7 66.7 66.7 75 83.3 91.7 100
Kashinkerry 78 80.2 82.4 84.6 86.8 89.0 91.2 93.4 95.6 97.8 100
100 - 78 = 22
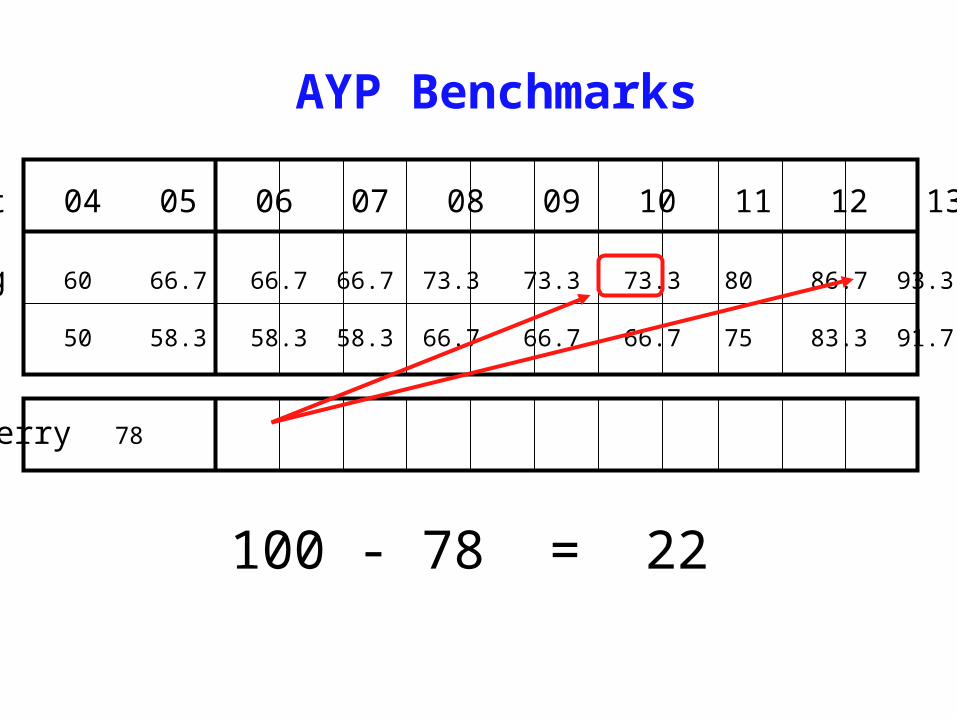
AYP Benchmarks
Subject 04 05 06 07 08 09 10 11 12 13 14
Rdg/Eng 60 66.7 66.7 66.7 73.3 73.3 73.3 80 86.7 93.3 100
Math 50 58.3 58.3 58.3 66.7 66.7 66.7 75 83.3 91.7 100
Kashinkerry 78 80.2 82.4 84.6 86.8 89.0 91.2 93.4 95.6 97.8 100
100 - 78 = 22 22 10 = 2.2
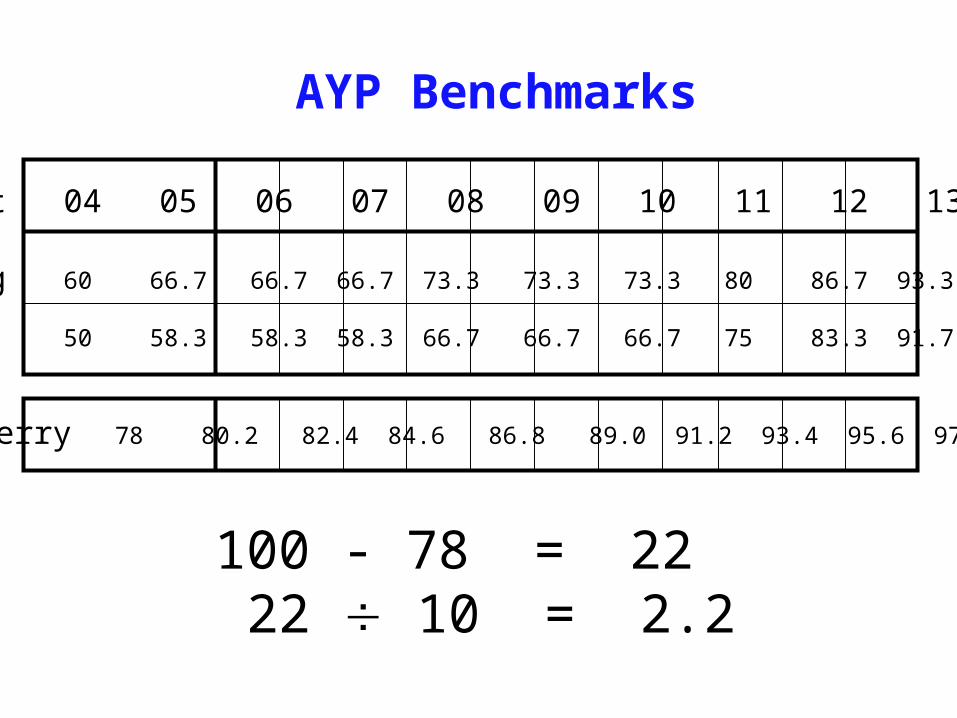
AYP Benchmarks
Subject 04 05 06 07 08 09 10 11 12 13 14
Rdg/Eng 60 66.7 66.7 66.7 73.3 73.3 73.3 80 86.7 93.3 100
Math 50 58.3 58.3 58.3 66.7 66.7 66.7 75 83.3 91.7 100
Kashinkerry 78 80.2 82.4 84.6 86.8 89.0 91.2 93.4 95.6 97.8 100
100 - 78 = 22 22 10 = 2.2
AYP Benchmarks
Subject 04 05 06 07 08 09 10 11 12 13 14
Rdg/Eng 60 66.7 66.7 66.7 73.3 73.3 73.3 80 86.7 93.3 100
Math 50 58.3 58.3 58.3 66.7 66.7 66.7 75 83.3 91.7 100
Kashinkerry 78 80.2 82.4 84.6 86.8 89.0 91.2 93.4 95.6 97.8 100
100 - 78 = 22 22 10 = 2.2

Looking Back
Grade 2001 2002 2003 2004
1 60 70
2 65 68 71
3 61 76
4 74 70 75 80
5 69 78
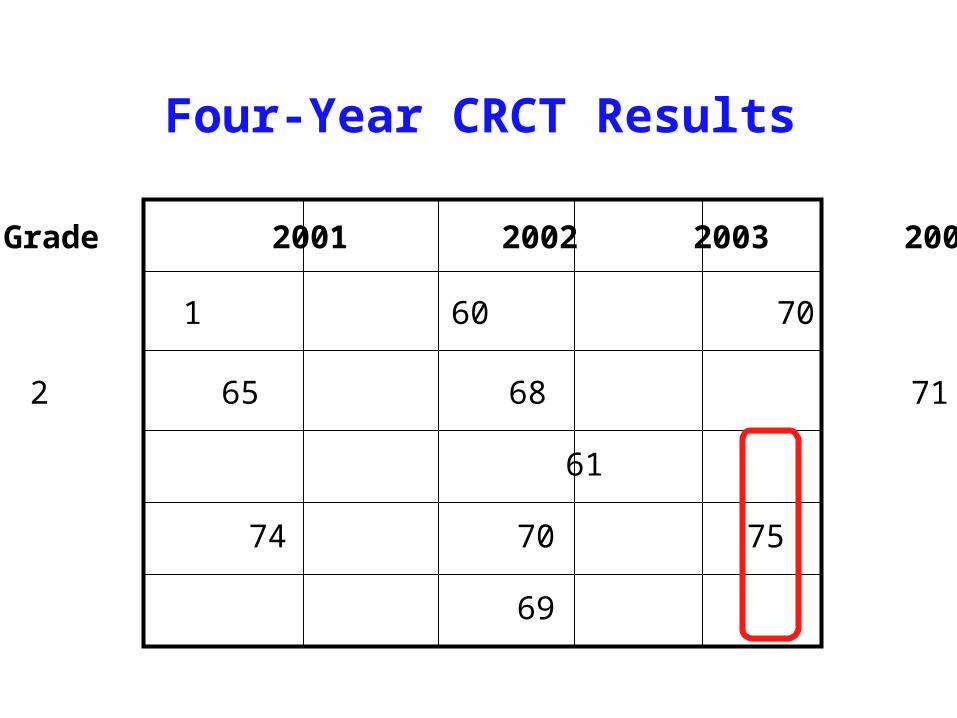
Four-Year CRCT Results
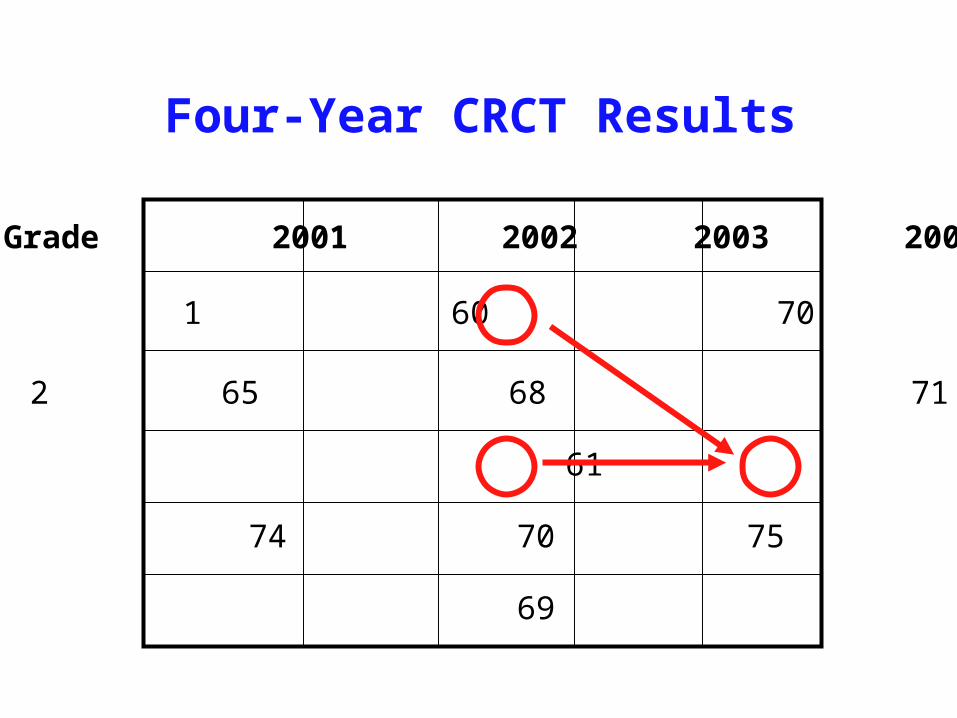
Grade 2001 2002 2003 2004
1 60 70
2 65 68 71
3 61 76
4 74 70 75 80
5 69 78
Four-Year CRCT Results
CRCT Cautions
Same-Grade Comparisons Vertical Scaling Year-to-Year Continuity

Looking Ahead
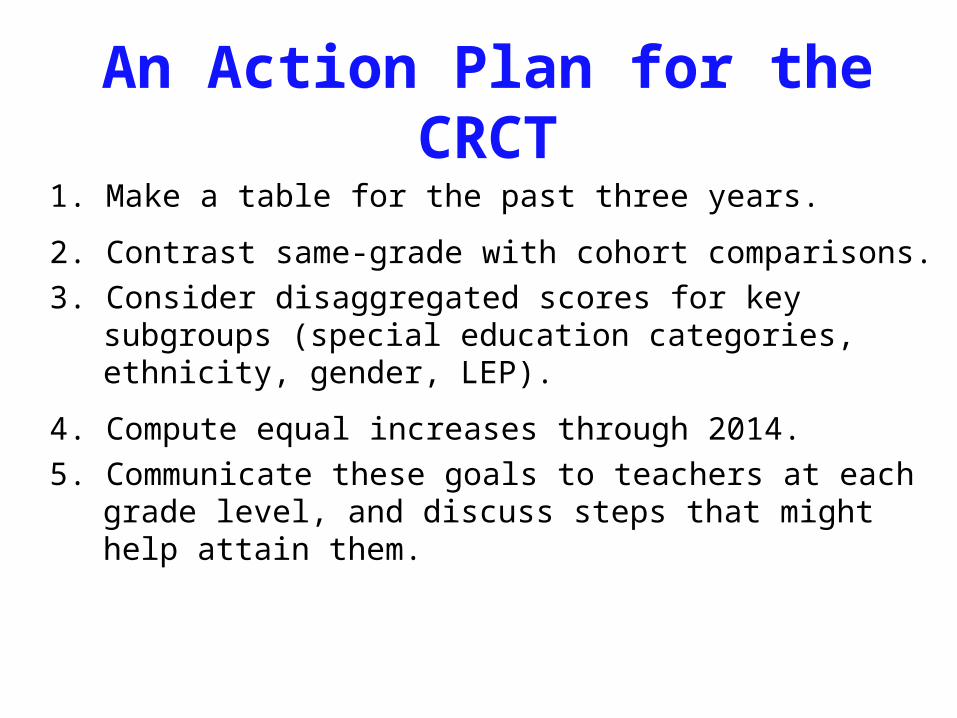
An Action Plan for the CRCT
1. Make a table for the past three years.
2. Contrast same-grade with cohort comparisons.
3. Consider disaggregated scores for key subgroups (special education categories, ethnicity, gender, LEP).
4. Compute equal increases through 2014.
5. Communicate these goals to teachers at each grade level, and discuss steps that might help attain them.
What about DIBELS?
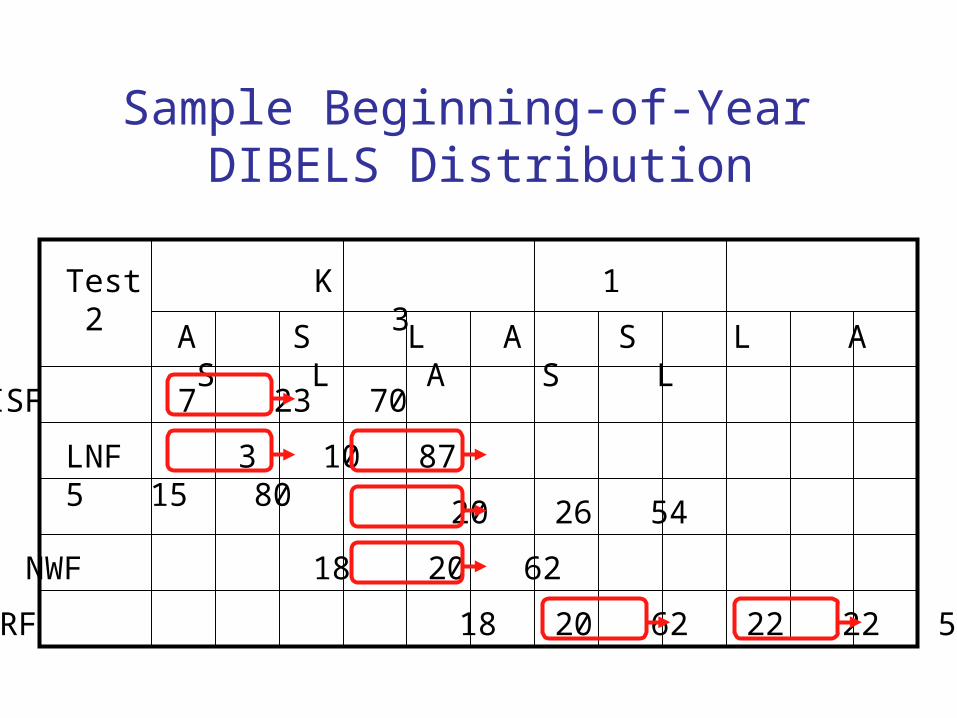
Test K 1 2 3
A S L A S L A S L A S L
ISF 7 23 70
LNF 3 10 87 5 15 80
PSF 20 26 54
NWF 18 20 62
ORF 18 20 62 22 22 56
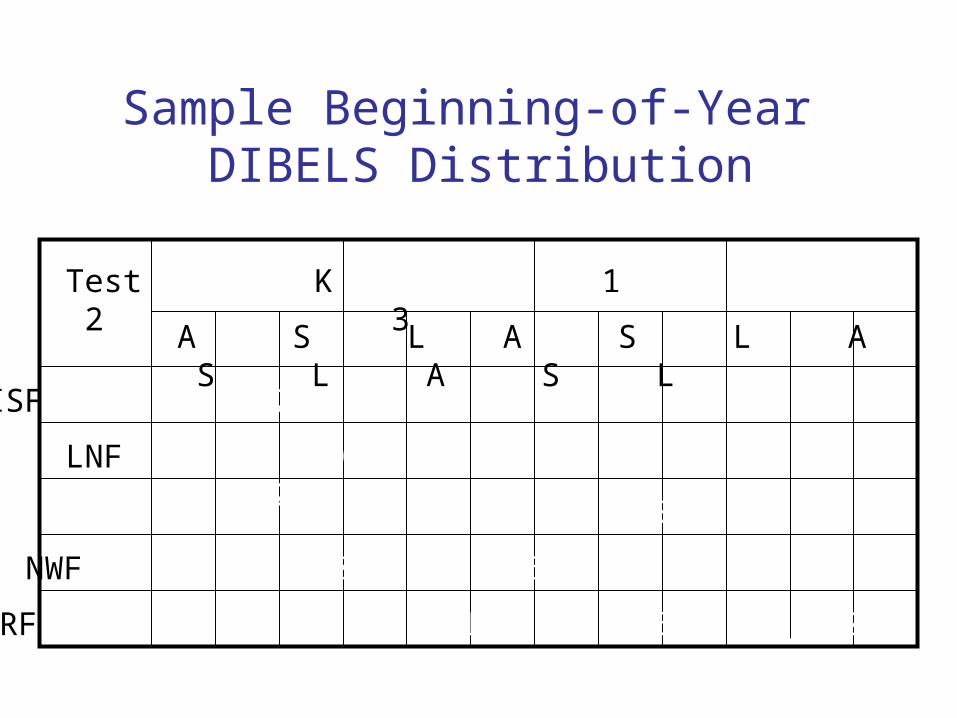
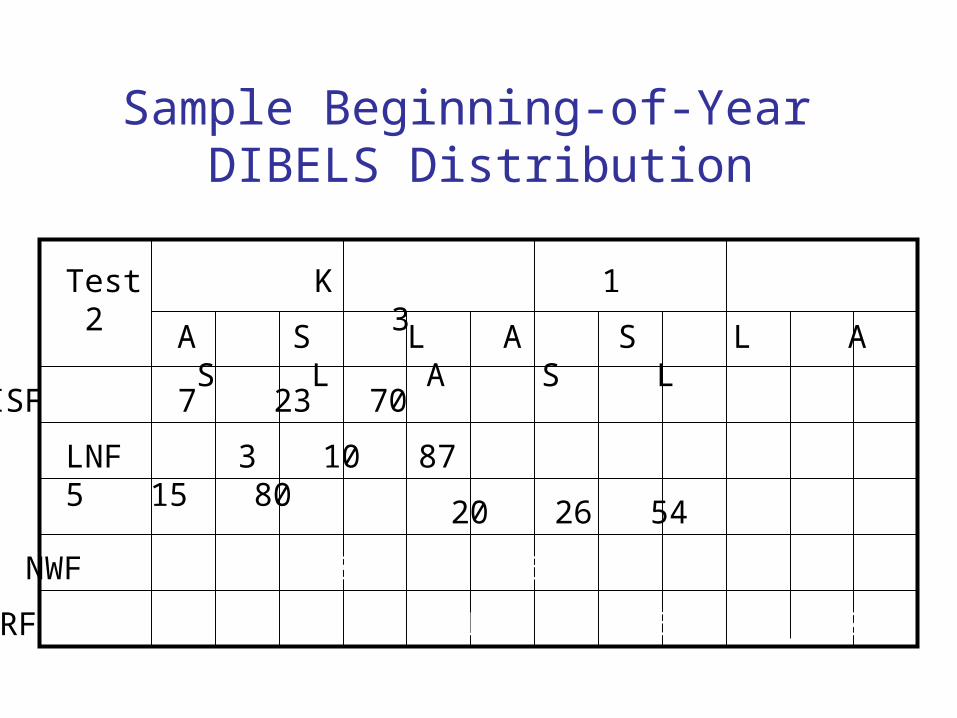
Sample Beginning-of-Year DIBELS Distribution
Test K 1 2 3
A S L A S L A S L A S L
ISF 7 23 70
LNF 3 10 87 5 15 80
PSF 20 26 54
NWF 18 20 62
ORF 18 20 62 22 22 56
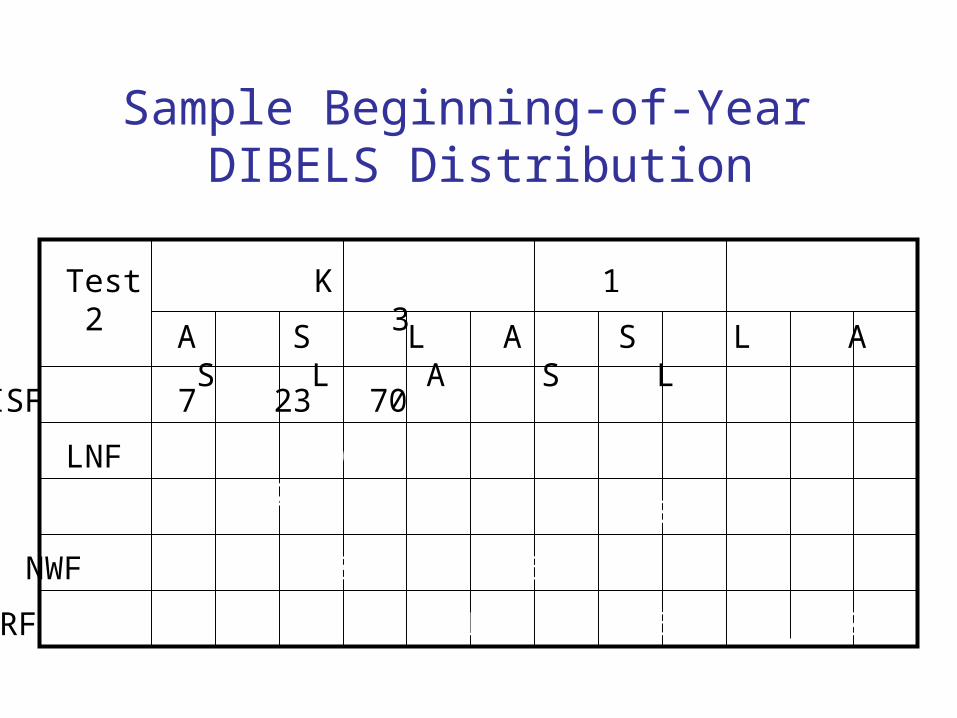
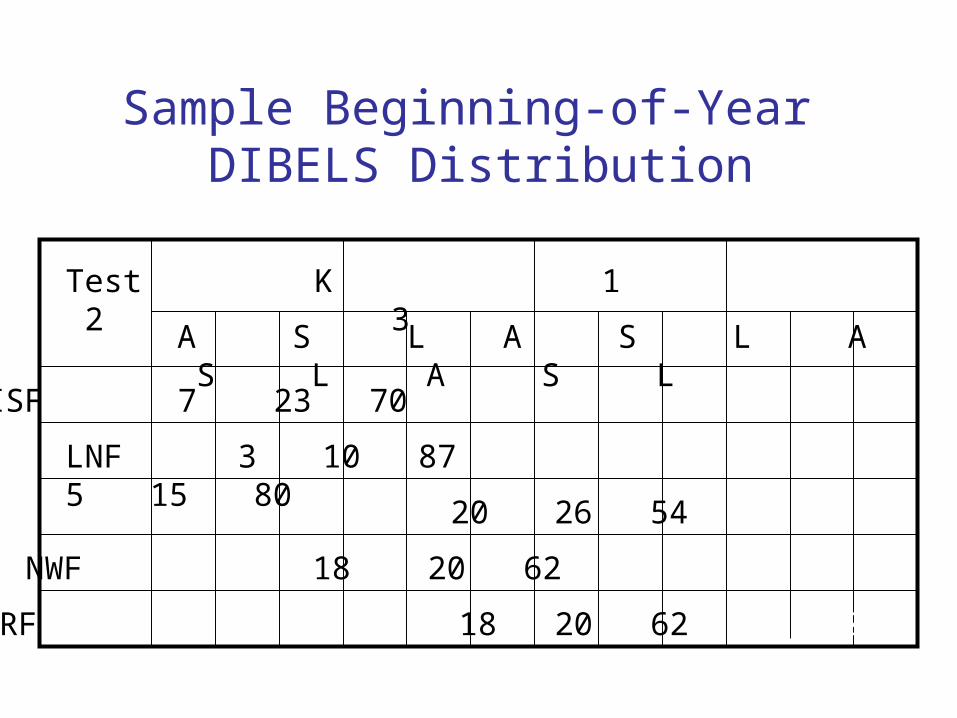
Sample Beginning-of-Year DIBELS Distribution
Test K 1 2 3
A S L A S L A S L A S L
ISF 7 23 70
LNF 3 10 87 5 15 80
PSF 20 26 54
NWF 18 20 62
ORF 18 20 62 22 22 56
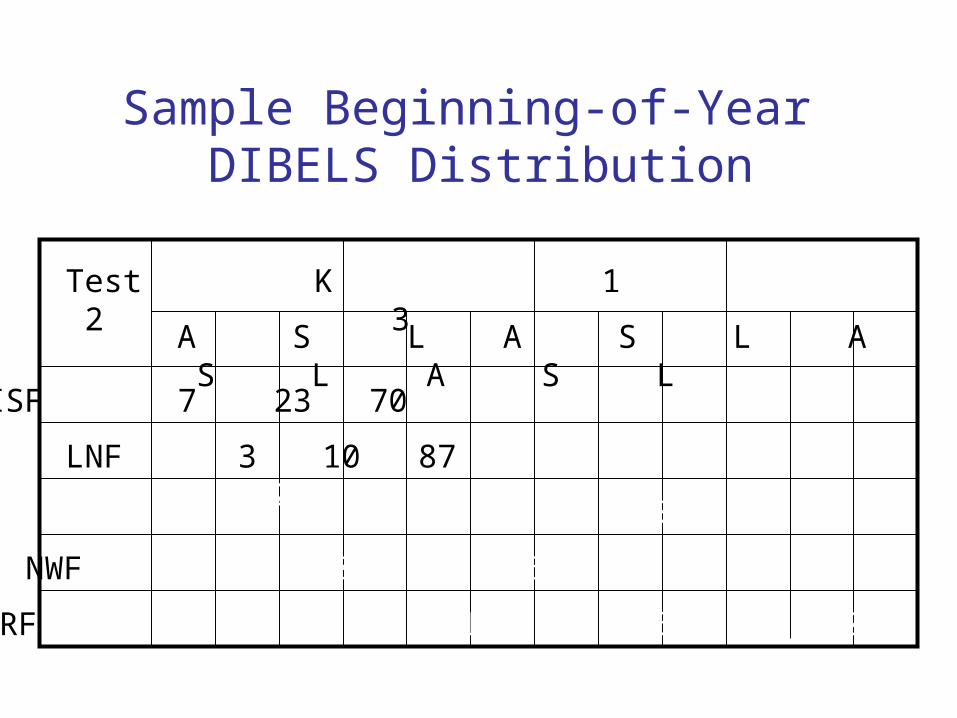
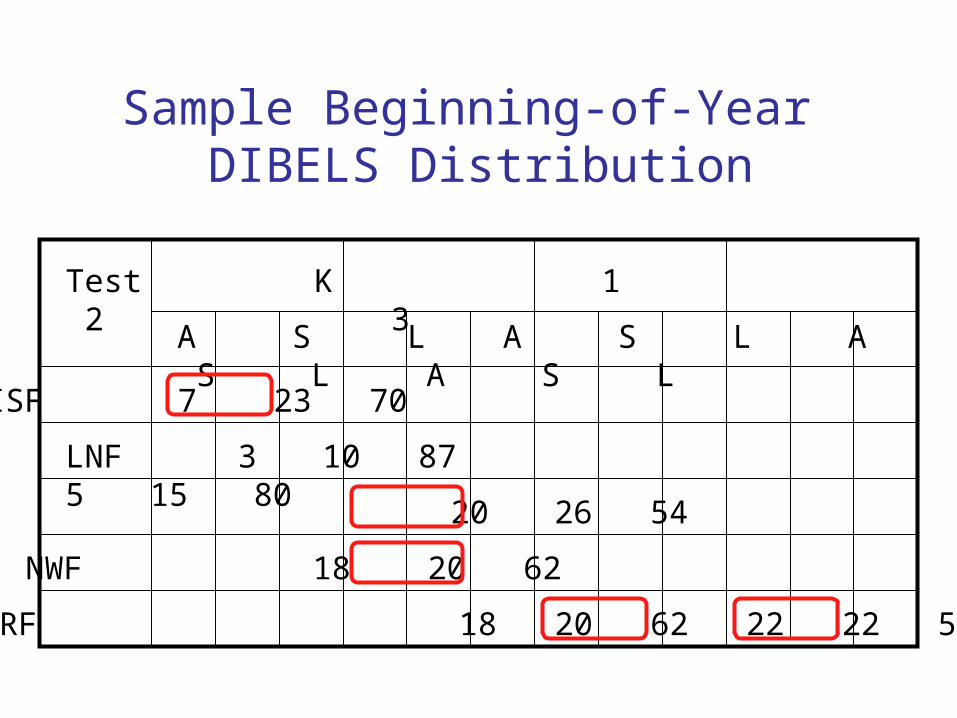
Sample Beginning-of-Year DIBELS Distribution
Test K 1 2 3
A S L A S L A S L A S L
ISF 7 23 70
LNF 3 10 87 5 15 80
PSF 20 26 54
NWF 18 20 62
ORF 18 20 62 22 22 56
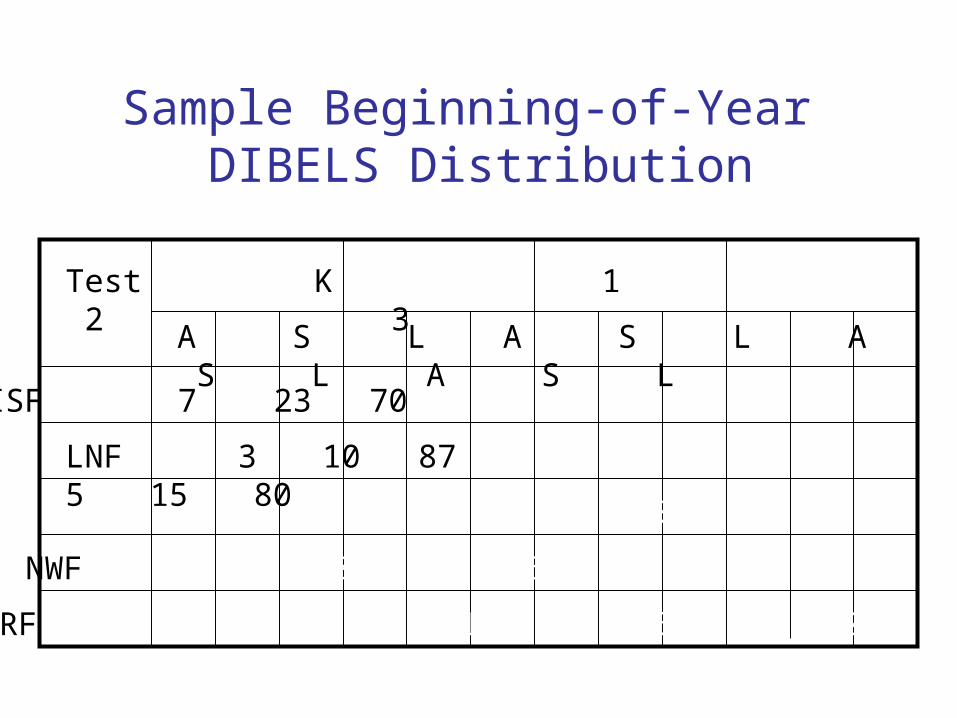
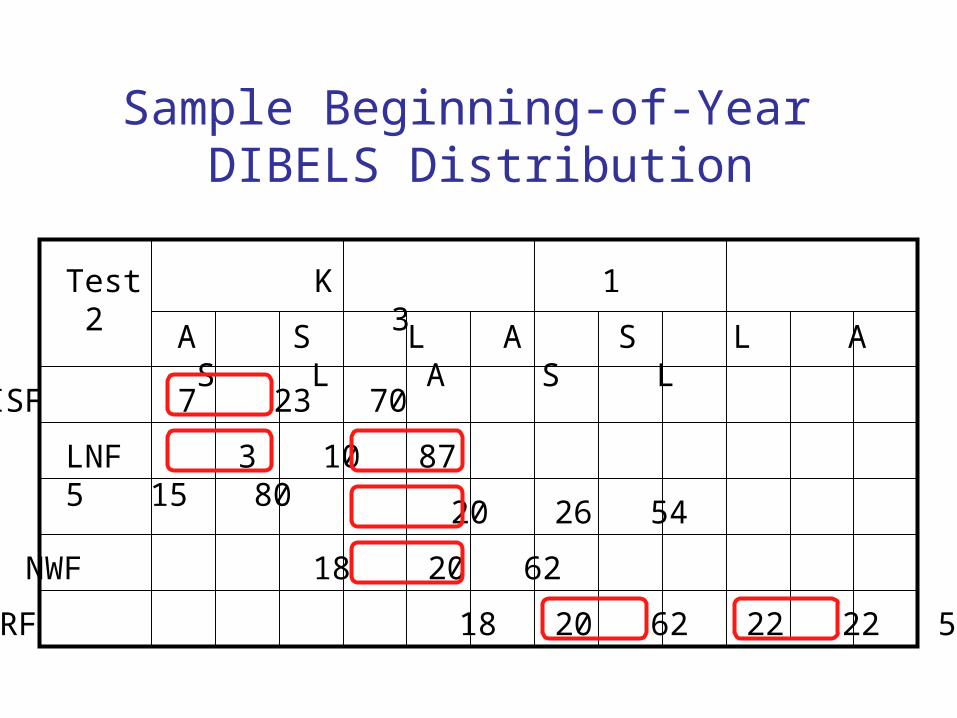
Sample Beginning-of-Year DIBELS Distribution
Test K 1 2 3
A S L A S L A S L A S L
ISF 7 23 70
LNF 3 10 87 5 15 80
PSF 20 26 54
NWF 18 20 62
ORF 18 20 62 22 22 56
Sample Beginning-of-Year DIBELS Distribution

Test K 1 2 3
A S L A S L A S L A S L
ISF 7 23 70
LNF 3 10 87 5 15 80
PSF 20 26 54
NWF 18 20 62
ORF 18 20 62 22 22 56
Sample Beginning-of-Year DIBELS Distribution
Test K 1 2 3
A S L A S L A S L A S L
ISF 7 23 70
LNF 3 10 87 5 15 80
PSF 20 26 54
NWF 18 20 62
ORF 18 20 62 22 22 56
Sample Beginning-of-Year DIBELS Distribution
Test K 1 2 3
A S L A S L A S L A S L
ISF 7 23 70
LNF 3 10 87 5 15 80
PSF 20 26 54
NWF 18 20 62
ORF 18 20 62 22 22 56
Sample Beginning-of-Year DIBELS Distribution
Test K 1 2 3
A S L A S L A S L A S L
ISF 7 23 70
LNF 3 10 87 5 15 80
PSF 20 26 54
NWF 18 20 62
ORF 18 20 62 22 22 56
Sample Beginning-of-Year DIBELS Distribution
Test K 1 2 3
A S L A S L A S L A S L
ISF 7 23 70
LNF 3 10 87 5 15 80
PSF 20 26 54
NWF 18 20 62
ORF 18 20 62 22 22 56
Sample Beginning-of-Year DIBELS Distribution
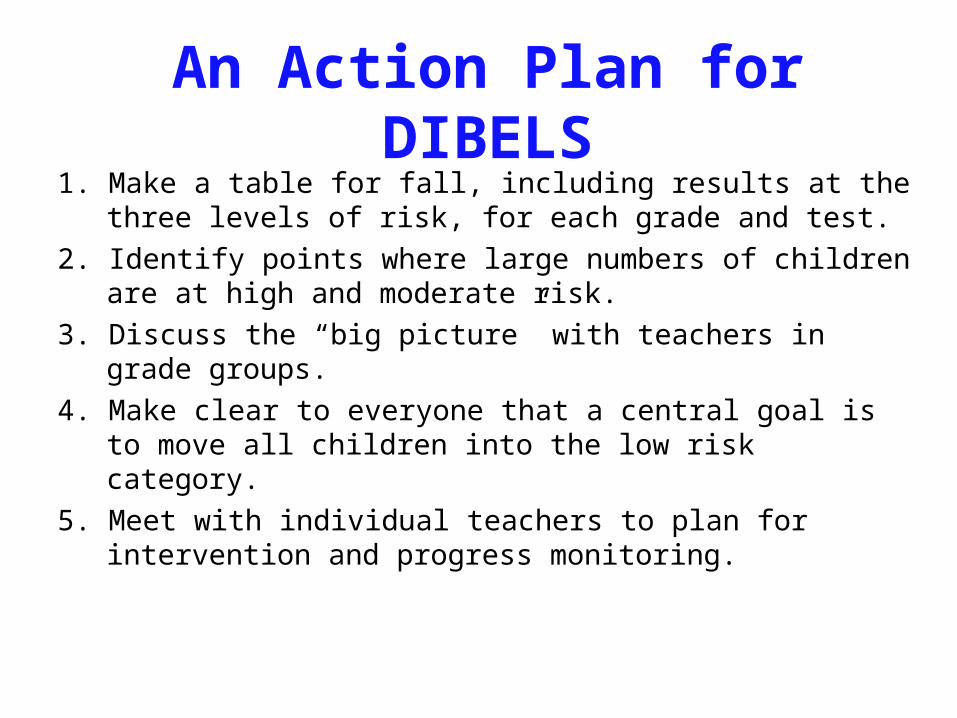
An Action Plan for DIBELS1. Make a table for fall, including results at the three levels
of risk, for each grade and test.
2. Identify points where large numbers of children are at high and moderate risk.
3. Discuss the “big picture” with teachers in grade groups.
4. Make clear to everyone that a central goal is to move all children into the low risk category.
5. Meet with individual teachers to plan for intervention and progress monitoring.