Embed Size (px)
Citation preview

What can we learn and predict when we model the brain as a graph?
Jonas [email protected] - http://richiardi.net
Lausanne University HospitalRadiology Department
Advanced Clinical Imaging Technologies
MAIN2017 18/11/2017

DisclaimerThe information and views set out in this talk are those of the author and do not necessarily reflect the official
opinion of the CHUV or Siemens Healthineers.

AgendaGraphs as representation of the brain What can we learn from graphs?
What can machines learn from graphs? Applications in clinical neuroscience
Graph topological features correspond to clinically relevant subtypes
Applications in basic neuroscience
Functional networks have strong genetic underpinnings

Graphs as representation of the brain

Broad theories of brain organisation
Wernicke’s associationism: higher functions emerge by integration between specialised, segregated brain regions
5
Geschwind’s model of cross-modal association, from [Catani and Ffytche, Brain,2005]
1885 1965
higher function needs parallel, distributed, bidirectional processing
Current
e.g. [Mesulam, Brain, 1998]e.g. [Wernicke, Fortschr Med, 1885]

Brain networks: physical
“default mode network”: coordinated deactivation
61[Raichle et al., PNAS, 2001]
PET 15O blood flow, mass-univariate meta-analysis, N=1321,2
2[Shulman et al., J. Cog. Neurosci., 1997]
WM tractography of arcuate fasciclus
[Catani and Thiebaut de Schotten, Cortex, 2008]
We can see in-vivo, non-invasive evidence of distributed activation…
…supported by an underlying white matter connectome

Brain graphs: mathematical modelsfMRI: from voxels to vertices2
7
Entities are not to be multiplied without necessity (Occam)make the model as simple as possible, but no simpler / Everything should be made as simple as possible, but no simpler
all models are wrong, but some are useful (Box, 1976)
2[Richiardi et al., IEEE Sig. Proc. Mag., 2013]
1
2 3 4 ...
36...
2
1
343
1 2
5 6 4
2
4
1 23 4
36
...
...
43
1 2
5 6
43
1 2
Staining: from tracts to edges1
1Literature-based macaque connectome from [Felleman & Van Essen, Cer. Cortex, 1991]
g = (V,E,�,⇥)
V: the set of vertices (voxels, ROIs, ICA components, sources...)
E: the set of edges
α: vertex labelling function (returns a scalar or vector for each vertex)
β: edge labelling function (returns a scalar, or vector for each edge)

What can we learn from graphs?

Brain graphs for cognitive neuroscience
9
afte
r [B
ullm
ore
and
Bass
ett,
Ann
u. R
ev. C
lin. P
sych
ol ,
2011
]
brain organisation graph property
balance between integration and segregation small-worldness
composition of subsystems (e.g. Hubel & Wiesel) modularity
presence of hubs fat-tailed degree distribution
Many essential aspects of brain organisation can be captured by graph topological properties1
1e.g.[Sporns, Ann. N.Y. Acad. Sci., 2011][Rubinov & Sporns, Neuroimage, 2010]

Brain graphs for clinical neuroscience
10
Similar brains have similar network communities
Disease progresses along network connections
Disease targets network hubs

More precisely…
11[Fornito et al., Nature Rev. neuroci., 2015]

Graphs as interlingua for neuroimaging
12[Plis et al., Comp. Bio. Med, 2011]
oddball in fMRI and MEG
[Richiardi, Altmann et al., Science, 2015]
mouse axonal connectivity vs transcriptional similarity

What can machines learn from graphs?

Learning and prediction with graphs
Clinical neuroscienceDiagnosis (CAD, Dx, DDx,
subtyping…)
Prognosis (clinical scores, stratification…)
Treatment planning (responders…)
Basic neuroscienceUnderstand (molecular) biology of
networks
What we’d like to do How stats and ML can help
Classification
Hypothesis testing
Regression
Clustering
Factorization/representation learning

Overview of approaches
Stats
mass-univariate, non-parametric, relaxed/two-step
Network science
community structures
Machine Learning
embeddings, kernels, neural nets
matrix statstopological properties
topological properties
[Richiardi et al., IEEE Sig. Proc. Mag., 2013] [Richiardi & Ng, GlobalSIP, 2013]

ML approaches on graphs
Kernels
substructure, global
Neural nets
Spectral, topological filters
Embeddings
direct, algebraic, tangent space
dissim
ilarit
y embe
dding
1D vector input to NN
graph kernel CNNs

Applications in clinical neuroscience
Graph topological features correspond to clinically relevant subtypes

Diagnosis from graphs

Minimally-disabled MS diagnosisCan resting-state functional connectivity serve as a surrogate marker of MS ?
Data: 14 HC, 22 MS (EDSS 1.5-2.5), 450 volumes @ TR 1.1s, 3T scannerGraph: AAL 90, 0.06-0.11 HzPerformance: 82% sens (CI 62-93%)86% spec (CI 60-96%)
[Richiardi et al., NeuroImage, 2012]
0 0.2 0.4 0.6 0.8 10
0.2
0.4
0.6
0.8
1
reduced connectivity index
incre
ased
conn
ectiv
ity in
dex
controls (N=14)patients (N=22)
discriminative projection correlates with WM lesion load
(r=0.61, p < 0.001)

Diagnosis is only the first stepBrain graph classification now yields useful accuracies for several diseases1, although sample sizes are generally small:
Depression: 99%-100% sens / 90%-100% spec
Schizophrenia: 67%-94% sens / 64%-100% spec
also MS, Psychosis, MCI, AD…
But
- this is only as good as the gold standard the model is trained with - a clinical diagnosis
- HC vs disease not very useful in clinic, where DDx is more common
Nevertheless, it is a good sanity check for a new method
Prognosis applications, e.g. recovery of function in stroke2, or conversion in MCI, look very promising
201[Castellanos et al.,NeuroImage, 2013] [Arbabshirani et al, NeuroImage, 2017]
3[Carter et al.,NeuroImage, 2012]

Prognosis from graphs

Survival prognosisPrediction of ALS survival time-frame (short/medium/long)
N=135 (eval: 32!)
Algo: embedding (direct) + MLP, stack imaging and clinical
22[van der Burgh et al., NeuroImage: clinical, 2017]

Preemies development prognosis
Predict pre-term infants cog/motor scores @ 18m from 90-nodes DTI connectivity @ birth:
N=115 (total 168 scans)
Best result ρ=0.31 (<10% var. exp.)
Much better than direct embedding + SVM (ρ=0.18)
231[Kawahara et al., NeuroImage, 2017]

Lesion clinical impact predictionSample: 30 brain injury (19+11) + 120 HC
voxel-level 16 FNs from 120 HC, colourised by nFNs
lesions in high-density regions should impact more domains
[Warren et al., PNAS, 2014]
consistent results with participation coeff on 264-vertices graph, infomap for edge
communities

Treatment planning from graphs

Depression subtyping and responsiveness
[Drysdale et al., Nature Medicine, 2016]
Sample: training (multisite 333D + 378HC), replication (multisite 125D + 352 HC)Algorithm: LogReg / LDA / SVC on CCA loadings
4 subtypes defined from CCA of connectivity (258 vertices)
and HAMD items
group
rTMS response prediction from subtypes (N=124)
individuals
Applications in basic neuroscience
Functional networks have strong genetic underpinnings

Is intrinsic brain activity brain related to genetics?
In humans and lower mammals, spatially consistent, synchronised, intrinsic activity is observed reproducibly across the lifespan
281[Biswal et al., PNAS, 2010]
Are there genetic correlates to this consistency?
BOLD fMRI, ICA(K=20), N=1093, C=24

Functional connectivity genes
29
N=15, 18-29 y.o. in vivo
fMRI data(ICA-defined networks)
N=6 (1777 samples), 24-57 y.o. post-mortem~17,000 genes
Gene expression microarray data
xy
xy
xz
yz
dDMNSalience
VisuospatialSensorimotor
A B
[Richiardi, Altmann et al., Science, 2015]

30
Is gene expression ‘similar’ in functional networks ?
Gene expression per region Regions grouped as belongingto FNs (1) or rest of brain (0)
4.4
4.6
4.8
5
5.2
5.4
5.6
5.8
6x 10
−3
stre
ngth
Fra
ctio
n
grouped by networks
random groupings
p < 0.001
I 1 1 0 0
Sg =
P1P
1+0 �P
1
Holds with distance-corrected data, distance-preserving
permutation

Putative ‘genes of connectivity’
31
A few well-known genes like SNAP25 or GABRA5Many potassium channels (KCN*)Significant enrichment for voltage-gated ion channels
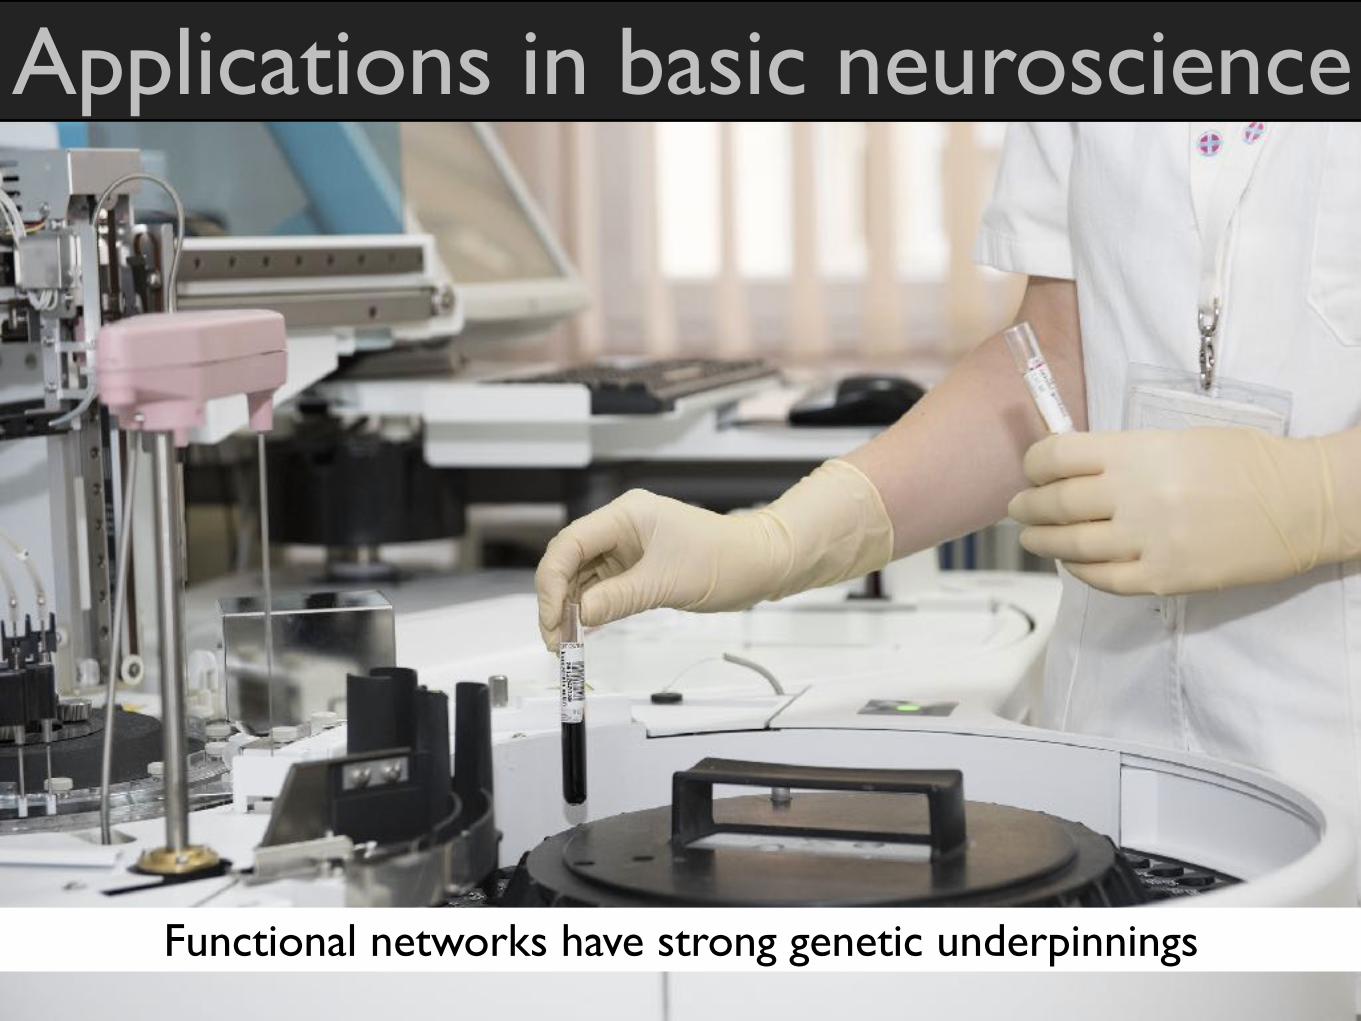
Do SNPs modulate FNs in vivo?Except in some cases (e.g. epilepsy resection), brain gene expression is measured post mortem
Gene expression levels can be influenced by single mutations (SNPs) in (or around) the gene
Opposite approach: define strength fraction Sf on fMRI connectivity, see how it is modulated by SNPs of our list
32
Sf =
P1P
1+0 �P
1
I 1 1 0 0

Mouse orthologs relate to axonal connectivity
Compare connectivity and transcriptional similarity graphs
Test strength of association between connectivity graph and transcriptional similarity graph via modified Mantel test (use only significant edges). Null model: random selection of 57 genes.
331[Oh et al., 2014]
Structural connectivity Transcriptional similarity Permutation test0
0.05
0.1
0.15
0.2
0.25
0.3
0.35
0.4
0.45
Sp
ea
rma
n c
orr
ela
tion
p=0.01

More gene-connectivity associationsSome genes individually modulate DMN slow activity1
Common: IL13RA2, NECAB2, NEFH, PVALB, SCN1B, SYT2 (6/38)
342[Krienen et al., PNAS, 2016]
Functional network topography matches transcriptional similarity2
Common:NEFH, SCN4B, SV2C, SYT2 (4/19)
1[W
ang
et a
l., N
euro
n, 2
015]
Gene expression correlates with ECoG connectivity in all bands3
Common: ontology results: ion channels; our genes
predict above whole-genome
3[Be
tzel
et
al., A
rXiV
, 201
7]

Network imaging genomics for stratification
[Rudie et al.,, Neuron, 2012]
MET genotype: CC lowers PCC↔MPFC conn
CC CG GG ∑TD 9 15 9 33
ASD 7 24 7 38∑ 16 39 16 71
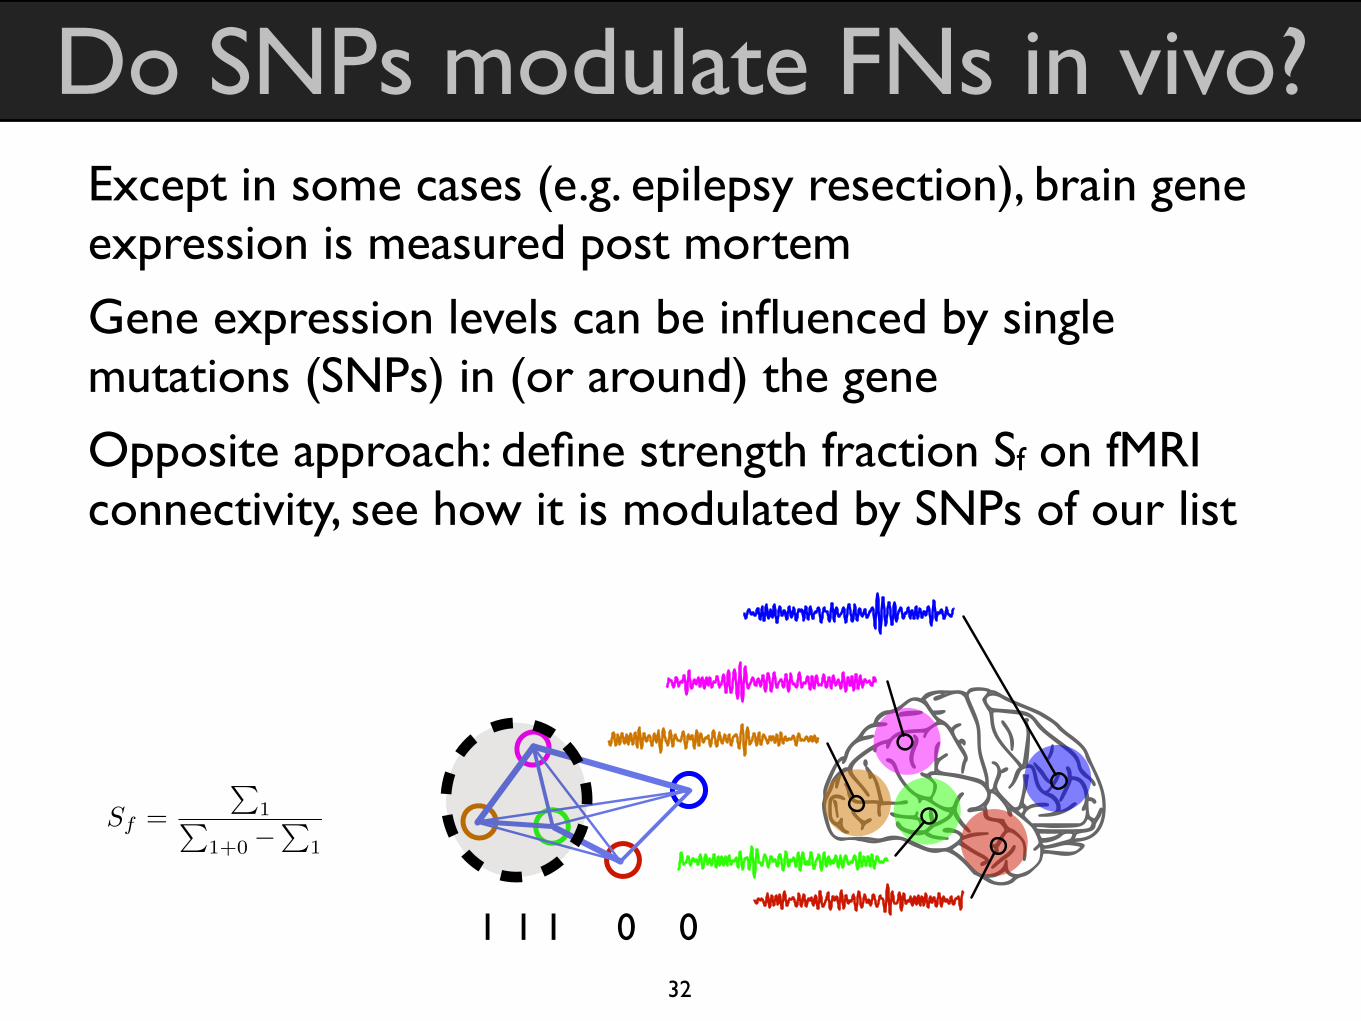
Vertical view of brain disease
[XX
X]
[Dendrou et al., Nat. Rev. Neurol. 2016]

Challenges

ChallengesMotion (mostly in fMRI)
Progress in acquisition (prospective MoCo), correction, analysis, but still major confound
Annotated data still small
Especially ICD-10 subcategories, especially non-structural
How to decide between sensitivity and specificity?
Cost of false positive / false negatives differs widely across diseases
How to integrate data across scanners?
Most theory is for IID case. fMRI connectivity quite sensitive.
[Pow
er e
t al
, Neu
roIm
age,
2012
]

Edge weight distributions
39[Castrillon et al., 2014]
ABIDE
fBIRN

ConclusionsApplications of predictive modelling of connectivity are starting to show robustness: connectivity should be considered when looking
for a sensitive marker
Methodological advances, especially in kernels and neural nets, together with large open datasets, are driving prediction
performance upwards rapidly across the board
The biological and molecular bases of functional connectivity are being uncovered, with many contributions by “dry lab” scientists

ThanksAllen Institute
C.K. Lee
IMAGEN consortium
41
Modelling and Inference on Brain networks for Diagnosis, MC IOF #299500
MIPLab, EPFL/UNIGE
D. Van De Ville, N. Leonardi
Kelp Lab, UCSCC. Otter
DataAllen Institute
http://brain-map.orgIMAGEN Consortium
http://imagen-europe.com
Funding
UNIGEP. Vuilleumier, M. Gscwhind, C. Quairaux
Collaborators
FINDLab, StanfordM. Greicius
TIG, UCLA. Altmann
CHUVP. Hagmann
BerkeleyJB Poline
Bavaria-California Technology Center

Further readingCalhoun et al. (eds), NeuroImage special issue on Individual Subject Prediction, 2017Fox and Greicius, Clinical applications of resting-state functional connectivity, Front. Sys. Neurosci., 2010 Castellanos et al., Clinical applications of the functional connectome, Neuroimage, 2013 Rao et al., Predictive modelling using neuroimaging data in the presence of confounds, NeuroImage, 2017Shen et al., Whole genome association study of brain-wide imaging phenotypes for identifying quantitative trait loci in MCI and AD: A study of the ADNI cohort, NeuroImage, 2010Miller et al., Multimodal population brain imaging in the UK Biobank prospective epidemiological study, Nature Neuroscience, 2016