Embed Size (px)
Citation preview

What Did and Did Not Cause Collapse of World Trade CenterTwin Towers in New York?
Zdeněk P. Bažant, Hon.M.ASCE1; Jia-Liang Le2; Frank R. Greening3; and David B. Benson4
Abstract: Previous analysis of progressive collapse showed that gravity alone suffices to explain the overall collapse of the World TradeCenter Towers. However, it remains to be determined whether the recent allegations of controlled demolition have any scientific merit.The present analysis proves that they do not. The video record available for the first few seconds of collapse is shown to agree with themotion history calculated from the differential equation of progressive collapse but, despite uncertain values of some parameters, it istotally out of range of the free fall hypothesis, on which these allegations rest. It is shown that the observed size range �0.01–0.1 mm� ofthe dust particles of pulverized concrete is consistent with the theory of comminution caused by impact, and that less than 10% of the totalgravitational energy, converted to kinetic energy, sufficed to produce this dust �whereas, more than 150 t of TNT per tower would haveto be installed, into many small holes drilled into concrete, to produce the same pulverization�. The air ejected from the building bygravitational collapse must have attained, near the ground, the speed of almost 500 miles per hour �or 223 m /s, or 803 km /h� on average,and fluctuations must have reached the speed of sound. This explains the loud booms and wide spreading of pulverized concrete and otherfragments, and shows that the lower margin of the dust cloud could not have coincided with the crushing front. The resisting upwardforces due to pulverization and to ejection of air, dust, and solid fragments, neglected in previous studies, are indeed found to be negligibleduring the first few seconds of collapse but not insignificant near the end of crush-down. The calculated crush-down duration is found tomatch a logical interpretation of seismic record, while the free fall duration grossly disagrees with this record.
DOI: 10.1061/�ASCE�0733-9399�2008�134:10�892�
CE Database subject headings: Collapse; Structural dynamics; Buildings, high-rise; Towers; New York; New York City; Terrorism.
Introduction
To structural engineers, the collapse of the World Trade Center�WTC� Towers on September 11, 2001 came as the greatest sur-prise since the collapse of Tacoma Narrows Bridge in 1940. Im-mediately after the aircraft impact, the structural frame behavedas expected, but not after the fire.
To explain the collapse, it was proposed �on September 13,2001� �Bažant 2001; Bažant and Zhou 2002� that viscoplasticbuckling of heated and overloaded columns caused the top part oftower to fall through the height of at least one story, and thenshowed that the kinetic energy of the impact on the lower partmust have exceeded the energy absorption capacity of the lowerpart by an order of magnitude. A meticulous investigation of un-
1McCormick Institute Professor and W. P. Murphy Professor of CivilEngineering and Materials Science, Northwestern Univ., 2145 SheridanRd., CEE/A135, Evanston, IL 60208 �corresponding author�. E-mail:[email protected]
2Graduate Research Assistant, Northwestern Univ., 2145 SheridanRd., CEE, Evanston, IL 60208.
3Engineering Consultant, 12 Uplands Ave., Hamilton, Ontario,Canada L8S 3X7.
4Professor Emeritus, School of Electrical Engineering and ComputerScience, Washington State Univ., Pullman, WA 99164.
Note. Associate Editor: George Z. Voyiadjis. Discussion open untilMarch 1, 2009. Separate discussions must be submitted for individualpapers. The manuscript for this paper was submitted for review and pos-sible publication on January 3, 2008; approved on February 22, 2008.This paper is part of the Journal of Engineering Mechanics, Vol. 134,No. 10, October 1, 2008. ©ASCE, ISSN 0733-9399/2008/10-892–906/
$25.00.892 / JOURNAL OF ENGINEERING MECHANICS © ASCE / OCTOBER 2008
precedented scope and detail, conducted by S. Shyam Sunder’steam at the National Institute of Standards and Technology �NIST2005�, supports this explanation. Although NIST did not analyzethe overall process of dynamic progressive collapse below the firezone, it verified a sequence of effects that triggered the collapse:�1� scraping of much of steel insulation by flying objects duringaircraft impact �without which the towers would not have col-lapsed, as concluded by NIST�; �2� cutting of many columns, anddamage with large deflections of others during aircraft impact; �3�subsequent load redistributions among columns; �4� sagging ofheated floor trusses and their catenary action, evidenced by mul-tistory inward bowing of perimeter columns; and �5� viscoplasticbuckling of heated, damaged, and overloaded columns.
Universally though has the foregoing explanation of collapsebeen accepted by the communities of structural engineers andstructural mechanics researchers, some outside critics have nev-ertheless exploited various unexplained observations to dissemi-nate allegations of controlled demolition. The objective of thispaper, based on the report by Bažant et al. �2007�, is to examinewhether those allegations might be scientifically justifiable, and toshow that the concept of gravity-driven collapse does not conflictwith any observations.
NIST examined paint cracking on 16 perimeter columns andonly three of them showed evidence of temperature �250°C.From annealing studies, the microstructures of recovered steelsamples show no evidence of exposure to temperature above600°C for any significant time �NIST 2005, part NCSTAR 1-3,p.132� �i.e., �15 min�. Nevertheless, evidence of very high tem-perature �around 800°C� was found in one unidentified steel col-umn, though it is unlikely that this column was located in the fire
stories and experienced high temperature prior to the collapse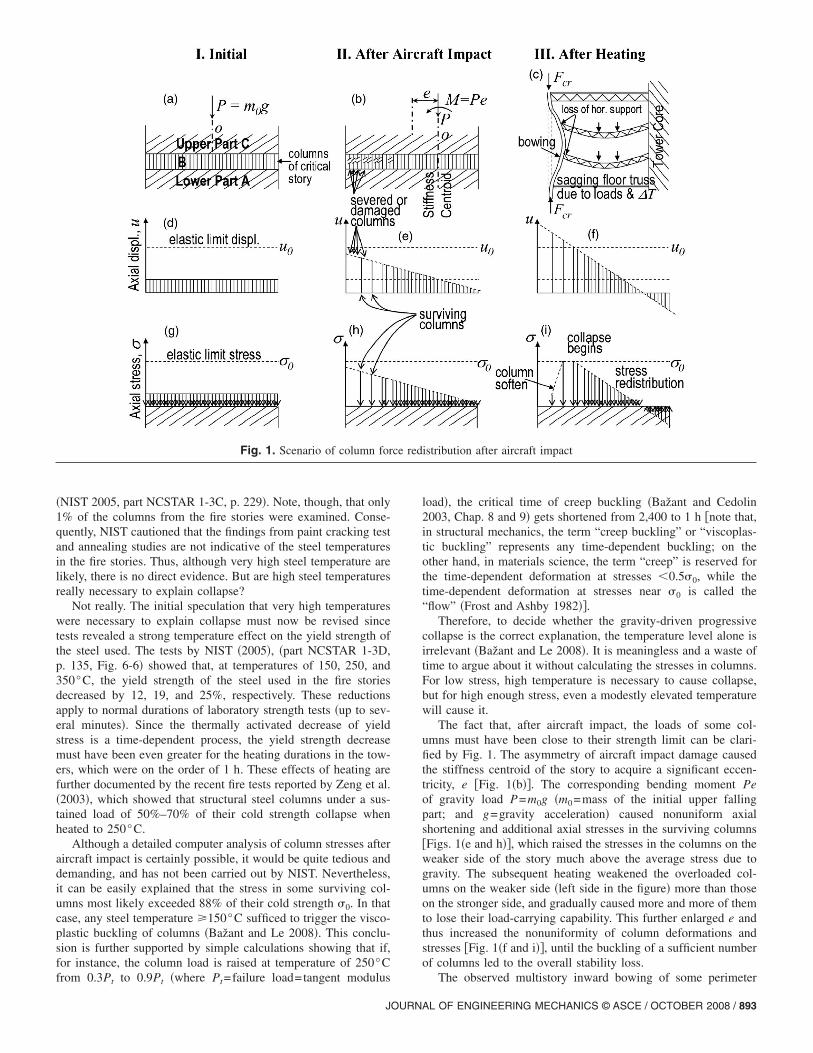
�NIST 2005, part NCSTAR 1-3C, p. 229�. Note, though, that only1% of the columns from the fire stories were examined. Conse-quently, NIST cautioned that the findings from paint cracking testand annealing studies are not indicative of the steel temperaturesin the fire stories. Thus, although very high steel temperature arelikely, there is no direct evidence. But are high steel temperaturesreally necessary to explain collapse?
Not really. The initial speculation that very high temperatureswere necessary to explain collapse must now be revised sincetests revealed a strong temperature effect on the yield strength ofthe steel used. The tests by NIST �2005�, �part NCSTAR 1-3D,p. 135, Fig. 6-6� showed that, at temperatures of 150, 250, and350°C, the yield strength of the steel used in the fire storiesdecreased by 12, 19, and 25%, respectively. These reductionsapply to normal durations of laboratory strength tests �up to sev-eral minutes�. Since the thermally activated decrease of yieldstress is a time-dependent process, the yield strength decreasemust have been even greater for the heating durations in the tow-ers, which were on the order of 1 h. These effects of heating arefurther documented by the recent fire tests reported by Zeng et al.�2003�, which showed that structural steel columns under a sus-tained load of 50%–70% of their cold strength collapse whenheated to 250°C.
Although a detailed computer analysis of column stresses afteraircraft impact is certainly possible, it would be quite tedious anddemanding, and has not been carried out by NIST. Nevertheless,it can be easily explained that the stress in some surviving col-umns most likely exceeded 88% of their cold strength �0. In thatcase, any steel temperature �150°C sufficed to trigger the visco-plastic buckling of columns �Bažant and Le 2008�. This conclu-sion is further supported by simple calculations showing that if,for instance, the column load is raised at temperature of 250°C
Fig. 1. Scenario of column for
from 0.3Pt to 0.9Pt �where Pt=failure load=tangent modulus
JOURN
load�, the critical time of creep buckling �Bažant and Cedolin2003, Chap. 8 and 9� gets shortened from 2,400 to 1 h �note that,in structural mechanics, the term “creep buckling” or “viscoplas-tic buckling” represents any time-dependent buckling; on theother hand, in materials science, the term “creep” is reserved forthe time-dependent deformation at stresses �0.5�0, while thetime-dependent deformation at stresses near �0 is called the“flow” �Frost and Ashby 1982��.
Therefore, to decide whether the gravity-driven progressivecollapse is the correct explanation, the temperature level alone isirrelevant �Bažant and Le 2008�. It is meaningless and a waste oftime to argue about it without calculating the stresses in columns.For low stress, high temperature is necessary to cause collapse,but for high enough stress, even a modestly elevated temperaturewill cause it.
The fact that, after aircraft impact, the loads of some col-umns must have been close to their strength limit can be clari-fied by Fig. 1. The asymmetry of aircraft impact damage causedthe stiffness centroid of the story to acquire a significant eccen-tricity, e �Fig. 1�b��. The corresponding bending moment Peof gravity load P=m0g �m0=mass of the initial upper fallingpart; and g=gravity acceleration� caused nonuniform axialshortening and additional axial stresses in the surviving columns�Figs. 1�e and h��, which raised the stresses in the columns on theweaker side of the story much above the average stress due togravity. The subsequent heating weakened the overloaded col-umns on the weaker side �left side in the figure� more than thoseon the stronger side, and gradually caused more and more of themto lose their load-carrying capability. This further enlarged e andthus increased the nonuniformity of column deformations andstresses �Fig. 1�f and i��, until the buckling of a sufficient numberof columns led to the overall stability loss.
istribution after aircraft impact
ce redThe observed multistory inward bowing of some perimeter
AL OF ENGINEERING MECHANICS © ASCE / OCTOBER 2008 / 893

columns �Fig. 1�c��, which reached 1.40 m, must have been asignificant factor in stability loss, since, e.g., the tripling of buck-ling length reduces the column capacity nine times. As noted byNIST, the bowing must have been caused by sagging of heatedfloor trusses, due to their viscoplastic deformation �however, aspointed out by Bažant and Le �2008�, the differential thermalexpansion could not have been the main cause of bowing since atemperature difference of above 1000°C across the floor trusswould be needed to cause a curvature for which the truss spangets shortened by 1.40 m�.
Inabsorbable Kinetic Energy
First, let us review the basic argument �Bažant 2001; Bažant andZhou 2002�. After a drop through at least the height h of one storyheated by fire �stage 3 in Fig. 2 top�, the mass of the upper part ofeach tower has lost enormous gravitational energy, equal to m0gh.Because the energy dissipation by buckling of the hot columnsmust have been negligible by comparison, most of this energymust have been converted into kinetic energy K=m0v2 /2 of theupper part of the tower, moving at velocity v. Calculation ofenergy Wc dissipated by the crushing of all columns of the under-lying �cold and intact� story showed that, the kinetic energy ofimpact K� �8.4Wc �Eq. �3� of Bažant and Zhou �2002��.
It is well known that, in inelastic buckling, the deformation
Fig. 2. �Top� Scenario of collapse; �bottom� crush-down and crush-ucrushed debris; and �C� intact moving �upper� part
must localize into inelastic hinges �Bažant and Cedolin 2003,
894 / JOURNAL OF ENGINEERING MECHANICS © ASCE / OCTOBER 2008
Sec. 7.10�. To obtain an upper bound on Wc, the local bucklingof flanges and webs, as well as possible steel fracture, was ne-glected �which means that the ratio K /Wc was at least 8.4�. Whenthe subsequent stories are getting crushed, the loss m0gh of gravi-tational energy per story exceeds 8.4 Wc an ever increasing mar-gin, and so the velocity v of the upper part must increase fromone story to the next. This is the basic characteristic of progres-sive collapse, well known from many previous disasters withcauses other than fire �internal or external explosions, earthquake,lapses in quality control� �see, e.g., Levy and Salvadori �1992�and Bažant and Verdure �2007��.
Merely to be convinced of the inevitability of gravity drivenprogressive collapse, further analysis is, for a structural engineer,superfluous. Further analysis is nevertheless needed to dispel falsemyths, and to acquire full understanding that would allow assess-ing the danger of progressive collapse in other situations.
Generalization of Differential Equationof Progressive Collapse
The gravity-driven progressive collapse of a tower consists of twophases—the crush-down, followed by crush-up �Fig. 2 bottom�—each of which is governed by a different differential equation�Bažant and Verdure 2007, 312–313�. During the crush-downphase, the falling upper part of the tower �C in Fig. 2 bottom�,
ses of collapse; �A� intact stationary �lower� part; �B� dense layer of
p phahaving a compacted layer of debris at its bottom �zone B�, crushes
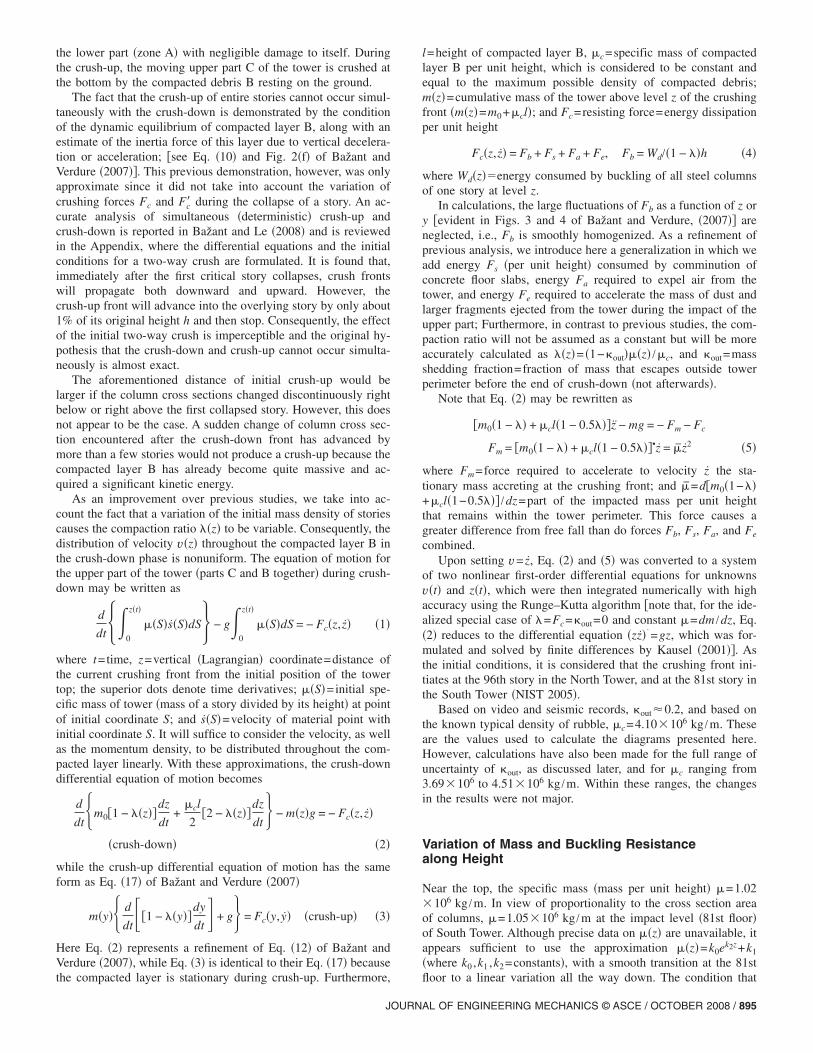
the lower part �zone A� with negligible damage to itself. Duringthe crush-up, the moving upper part C of the tower is crushed atthe bottom by the compacted debris B resting on the ground.
The fact that the crush-up of entire stories cannot occur simul-taneously with the crush-down is demonstrated by the conditionof the dynamic equilibrium of compacted layer B, along with anestimate of the inertia force of this layer due to vertical decelera-tion or acceleration; �see Eq. �10� and Fig. 2�f� of Bažant andVerdure �2007��. This previous demonstration, however, was onlyapproximate since it did not take into account the variation ofcrushing forces Fc and Fc� during the collapse of a story. An ac-curate analysis of simultaneous �deterministic� crush-up andcrush-down is reported in Bažant and Le �2008� and is reviewedin the Appendix, where the differential equations and the initialconditions for a two-way crush are formulated. It is found that,immediately after the first critical story collapses, crush frontswill propagate both downward and upward. However, thecrush-up front will advance into the overlying story by only about1% of its original height h and then stop. Consequently, the effectof the initial two-way crush is imperceptible and the original hy-pothesis that the crush-down and crush-up cannot occur simulta-neously is almost exact.
The aforementioned distance of initial crush-up would belarger if the column cross sections changed discontinuously rightbelow or right above the first collapsed story. However, this doesnot appear to be the case. A sudden change of column cross sec-tion encountered after the crush-down front has advanced bymore than a few stories would not produce a crush-up because thecompacted layer B has already become quite massive and ac-quired a significant kinetic energy.
As an improvement over previous studies, we take into ac-count the fact that a variation of the initial mass density of storiescauses the compaction ratio ��z� to be variable. Consequently, thedistribution of velocity v�z� throughout the compacted layer B inthe crush-down phase is nonuniform. The equation of motion forthe upper part of the tower �parts C and B together� during crush-down may be written as
d
dt��0
z�t�
��S�s�S�dS� − g�0
z�t�
��S�dS = − Fc�z, z� �1�
where t=time, z=vertical �Lagrangian� coordinate=distance ofthe current crushing front from the initial position of the towertop; the superior dots denote time derivatives; ��S�=initial spe-cific mass of tower �mass of a story divided by its height� at pointof initial coordinate S; and s�S�=velocity of material point withinitial coordinate S. It will suffice to consider the velocity, as wellas the momentum density, to be distributed throughout the com-pacted layer linearly. With these approximations, the crush-downdifferential equation of motion becomes
d
dt�m0�1 − ��z��
dz
dt+
�cl
2�2 − ��z��
dz
dt� − m�z�g = − Fc�z, z�
�crush-down� �2�
while the crush-up differential equation of motion has the sameform as Eq. �17� of Bažant and Verdure �2007�
m�y�� d
dt�1 − ��y��
dy
dt + g� = Fc�y, y� �crush-up� �3�
Here Eq. �2� represents a refinement of Eq. �12� of Bažant andVerdure �2007�, while Eq. �3� is identical to their Eq. �17� because
the compacted layer is stationary during crush-up. Furthermore,JOURN
l=height of compacted layer B, �c=specific mass of compactedlayer B per unit height, which is considered to be constant andequal to the maximum possible density of compacted debris;m�z�=cumulative mass of the tower above level z of the crushingfront �m�z�=m0+�cl�; and Fc=resisting force=energy dissipationper unit height
Fc�z, z� = Fb + Fs + Fa + Fe, Fb = Wd/�1 − ��h �4�
where Wd�z��energy consumed by buckling of all steel columnsof one story at level z.
In calculations, the large fluctuations of Fb as a function of z ory �evident in Figs. 3 and 4 of Bažant and Verdure, �2007�� areneglected, i.e., Fb is smoothly homogenized. As a refinement ofprevious analysis, we introduce here a generalization in which weadd energy Fs �per unit height� consumed by comminution ofconcrete floor slabs, energy Fa required to expel air from thetower, and energy Fe required to accelerate the mass of dust andlarger fragments ejected from the tower during the impact of theupper part; Furthermore, in contrast to previous studies, the com-paction ratio will not be assumed as a constant but will be moreaccurately calculated as ��z�= �1−�out���z� /�c, and �out=massshedding fraction=fraction of mass that escapes outside towerperimeter before the end of crush-down �not afterwards�.
Note that Eq. �2� may be rewritten as
�m0�1 − �� + �cl�1 − 0.5���z − mg = − Fm − Fc
Fm = �m0�1 − �� + �cl�1 − 0.5���•z = �z2 �5�
where Fm=force required to accelerate to velocity z the sta-tionary mass accreting at the crushing front; and �=d�m0�1−��+�cl�1−0.5��� /dz=part of the impacted mass per unit heightthat remains within the tower perimeter. This force causes agreater difference from free fall than do forces Fb, Fs, Fa, and Fe
combined.Upon setting v= z, Eq. �2� and �5� was converted to a system
of two nonlinear first-order differential equations for unknownsv�t� and z�t�, which were then integrated numerically with highaccuracy using the Runge–Kutta algorithm �note that, for the ide-alized special case of �=Fc=�out=0 and constant �=dm /dz, Eq.�2� reduces to the differential equation �zz�˙=gz, which was for-mulated and solved by finite differences by Kausel �2001��. Asthe initial conditions, it is considered that the crushing front ini-tiates at the 96th story in the North Tower, and at the 81st story inthe South Tower �NIST 2005�.
Based on video and seismic records, �out�0.2, and based onthe known typical density of rubble, �c=4.10106 kg /m. Theseare the values used to calculate the diagrams presented here.However, calculations have also been made for the full range ofuncertainty of �out, as discussed later, and for �c ranging from3.69106 to 4.51106 kg /m. Within these ranges, the changesin the results were not major.
Variation of Mass and Buckling Resistancealong Height
Near the top, the specific mass �mass per unit height� �=1.02106 kg /m. In view of proportionality to the cross section areaof columns, �=1.05106 kg /m at the impact level �81st floor�of South Tower. Although precise data on ��z� are unavailable, itappears sufficient to use the approximation ��z�=k0ek2z+k1
�where k0 ,k1 ,k2=constants�, with a smooth transition at the 81st
floor to a linear variation all the way down. The condition thatAL OF ENGINEERING MECHANICS © ASCE / OCTOBER 2008 / 895

�0H��z�dz be equal to the total mass of tower �known to be
roughly 500,000 t� gives �=1.46106 kg /m at the base. Thereare various local complexities whose possible effects were esti-mated in calculations �e.g., the fact that 16 of 47 core columnsat the bottom were much more massive than the rest�. How-ever, they appeared to have no appreciable effect on the overallresponse, particularly on the diagram of z�t� and the collapseduration.
The total energy dissipation per unit height, which representsthe resisting force Fc, consists not only of energy Fb dissipated bythe inelastic hinges formed during column buckling, but also ofenergy Fs required for comminuting concrete floor slabs, energyFa required for expelling air from the tower, and energy Fe re-quired for ejecting particles and fragments. Based on Fig. 5 andEq. �8� of Bažant and Zhou �2002�, on Fig. 3 of Bažant andVerdure �2007�, and on Bažant and Cedolin �2003, Sec 8.6�, wehave, for three-hinge column buckling
Fb =�0
uf F�u�du
h, F�u� =
i=1
N2�Mai�i� + Mbi�i���
Li sin i
i = arccos�1 −u
Li� �6�
where F=axial force resultant of all the columns in the story;u=vertical relative displacement between column ends; uf =finalu value; i�=2i; i ,i�=hinge rotations at the ends and middle ofcolumn i, which are functions of u; Mai ,Mbi=bending momentsin inelastic hinges at the ends and middle of column i, as func-tions of i or i�; and Li=initial clear length of columns i. Forplate-type four-hinge buckling �Fig. 2�c� in Bažant and Zhou2002�, similar simple expressions apply.
Although some core columns were rectangular, their plasticbending moments Mp were nearly proportional to the columncross-section areas because, in the weak buckling direction,most core columns had the same width as the perimeter col-umns. Thus the curve F�u� corresponding to perfect plasticity�Mai=Mbi=Mpi� is not difficult to estimate from the weight of allthe columns in a story.
However, three effects doubtless intervened to reduce F�u�: �1�multistory buckling of some columns; �2� softening due to localplastic flange buckling; and �3� fracture of steel in inelastic hinges�the last two likely occurred only at large buckling deflections forwhich F�u� is small�. The available data are insufficient to makean accurate estimate of these effects, and even the data on theflange thicknesses in the perimeter and core columns of all thestories are missing. So we simply apply to Fb an empirical cor-rection factor � ��1� which is reasonably expected to lie withinthe range �0.5, 0.8� for normal structural steel �yield limit250 MPa�, but in the range �0.1, 0.3� for the high-strength steel�yield limit 690 MPa� which was used for perimeter columns inthe lower stories and is more brittle.
The high-strength steel has a much lower ductility, which musthave caused fractures �with a drop of axial force to zero� veryearly during buckling, and must have been the cause of formationof large multistory fragments seen to fall from the lower part ofthe tower. Consequently, the energy dissipated �which is equal tothe area under the load-displacement curve of the column� wasprobably about the same for high- and normal-strength columns.
The effect of uncertainty in Fb, i.e., �= �0.5,0.8�, on the col-lapse time is shown in Fig. 8. The remaining diagrams are calcu-lated with ��2 /3 for the stories with a normal-strength column,
while for high-strength columns, � is taken as 0.24, which gives896 / JOURNAL OF ENGINEERING MECHANICS © ASCE / OCTOBER 2008
about the same Fb as for normal-strength columns. But, for thestories with high-strength perimeter columns, the strength of corecolumns is 290 MPa �i.e., only slightly higher than for structuralsteel of normal strength�. So we use ��0.2 for these stories andexpect the uncertainty range �0.1, 0.3�. The full range of � willlater be considered in estimating the uncertainty of response.
To estimate Fb, we consider that each perimeter column had abox cross section, almost square, with the width of 356 mm andweb thickness varying from 7.5 mm near the top of tower to125 mm near the bottom, while at the aircraft impact level theweb was 10 mm thick �Wierzbicki and Teng 2003; Hart et al.1985�. The core columns had a rectangular box cross section fromthe tower base up to almost the top, where they had an I-section.The size of core columns was not uniform even for a single story.Near the base, some reached 1371 mm559 mm, with wallthickness 127 mm �“Worlds tallest towers . . .” 1970�. The cross-section dimensions can be estimated, albeit only crudely, fromrecently released architectural blueprints.
Based on the area under the buckling curve in Fig. 3 of Bažantand Verdure �2007�, the energy dissipation due to column buck-ling at the impact zone of the North Tower �96th story� isFb�1−��h=0.51 GJ �or approximately 0.5 GJ, as estimated byBažant and Zhou 2002�. For other stories, this quantity is scaledaccording to the approximate cross-section area of columns. Forthe sake of computational effectiveness, and because Eq. �2� is thecontinuum approximation of a difference equation, the variationof Wd /h is considered to be smooth, following an equation similarto that of ��z�.
Velocity of Air Ejected from Tower
An upper bound on the area through which the air initially con-tained within every story gets expelled �Fig. 3�a�� is Aw=4 ahc,where 4ahc=area of one perimeter wall, a=64 m=width of theside of square cross section of tower; hc=3.69 m=clear height ofone story=distance from the bottom of a story slab to the topof the underlying slab; and =vent ratio=ratio of unobstructed�open� area of the perimeter walls to their total area � �1�.The initial mass of air within one story is ma=�aa2hc, where�a=1.225 kg /m3=mass density of air at atmospheric pressure androom temperature. Just outside the tower perimeter, the air jettingout �Fig. 3�a�� must regain the atmospheric pressure as soon as itexits �White 1999, p. 149�, and its temperature must be roughlyequal to the initial temperature �this is a well-known general fea-ture of exhausts, e.g., from jet engines �White 1999, p. 149� orpipes �Munson et al. 2006��. So, the mass density of exiting air���a.
The time during which the top slab collapses onto the lowerslab ��t=hc / z=time during which the air is expelled out �whichis only about 0.07 s for stories near the ground�. Conservation ofthe mass of air during the collapse of one story requires that�Aw�va�t�=�Va. Solving this equation gives the average velocityof escaping air just outside the tower perimeter
va =Va
Aw�t=
az
4 hc�7�
Since the velocity of the crushing front near the end of the NorthTower crush-down is, according to the solution of Eq. �2�,z=47.34 m /s �106 miles per hour�, the velocity of escaping air
near the end of crush-down is
va =64 m 47.34 m/s
4 3.69 m
= �205 m/s�459 mi/h or 0.60 Mach� for = 1
340 m/s�761 mi/h or 1.00 Mach� for = 0.604� �8�
The vent ratio �which is �1� is hard to estimate. It surelyvaries from story to story, and also during the crushing of onestory. Its effective, or average, value could be much less than 1�because some of the perimeter area is doubtless still obstructedearly in the crushing of one story, and because much of the airescapes only after the story height has been reduced greatly�. Inspite of these uncertainties, it is clear that the exit air speed is onthe order of 500 miles per hour and that its fluctuations mustreach the speed of sound. This must, of course, create sonicbooms, which are easily mistaken for explosions �supersonicspeeds are virtually impossible since the venting would require anorifice shaped similarly to a convergent-divergent nozzle�.
There are other phenomena that can cause va to differ from theestimate in Eq. �8�. The air pressure surely exhausts the loadcapacity of the floor slab for a few microseconds before it isimpacted by the layer of compacted debris. So, the floor slab mustcrack before the story height is reduced to �h, and the air mustbegin to leak through the cracked floor slab into the underlyingstory, thus increasing the air mass in that story. Obviously someair must also leak into the ceiling which behaves as a porous layerof compacted gravel �it is impossible for the ceiling and the floorto remain flat and leak no air since otherwise the air pressure
Fig. 3. �a� Air jets from collapsing story; �b� just before end ofcrush-down, and after crush-up
would tend to infinity as the ceiling impacts the floor�.
JOURN
All these complex interstory interactions must cause rapid andlarge random fluctuations of internal air pressure and exiting airvelocity. On average, however, what matters is the simple factthat the air must, in one way or another, get expelled from eachstory of the tower within a very short time interval, which is only0.07 s near the end of crush-down of the North Tower. This factinevitably leads to the average exit velocity estimate in Eq. �7�.The high velocity of air jetting out also explains why a largeamount of pulverized concrete, drywalls and glass was ejected toa distance of several hundred meters from the tower �Fig. 3�a��.
Resisting Forces due to Ejecting Air and Solids
The air mass within the confines of one story, which is �aa2hc,gets accelerated from 0 to velocity va as it exits the tower perim-eter. The kinetic energy acquired by the escaping air of one storyjust outside the tower perimeter is Ka=�va
2�a2hc�/2, where a2hc
=initial volume of air within the story.The energy dissipated by viscosity of flowing air and by
boundary friction is estimated to be negligible. Therefore, virtu-ally all of the kinetic energy of escaping air must be supplied bygravity, and since the spatial derivative of energy is a force �calledthe material force or configurational force�, the vertical resistingforce caused by air ejection is
Fa�z, z� =Ka
h=
�aa4
32 2hchz2 �9�
The solution of Eq. �2� shows that, at the end of the NorthTower crush-down, Fa�103 MN, which represents about 8.01%of the total resisting force Fc at the end of crush-down. When thefirst story under the aircraft impact zone gets smashed, Fa con-tributes only 2.75% of Fc. During the crush-down, the ratio Fa /Fc
increases and reaches the maximum of 12.79% when the 83rdstory becomes impacted, and then decreases due to the increase ofFb at lower stories. Fa�5% of Fc up to the third story crushed,and �10% up to the seventh story crushed �by contrast, in build-ing demolitions, which are conducted in the crush-up mode, thecrush-up motion begins with zero velocity, and Fa�5% of Fc forbuildings up to about 20 stories tall, in which case the air resis-tance can be neglected�. The maximum of Fa /Fc is 30.27%,which occurs during the crush-up phase in which Fb is small andthe velocity high.
The average overpressure of air within the tower is �pa
=Fa /a2 above the atmospheric pressure, which gives, for theNorth Tower, 7.55 kPa �0.075 atm�, 14.31 kPa �0.141 atm�, and25.15 kPa �0.248 atm�, respectively, during the crushing of the80th story, 50th story, and at the end of crush-down, respectively.The last pressure value is enough to break up the floor slab. Thepressure peaks near the end of squeezing of a story are doubtlessmuch higher, as already mentioned, and thus must contribute tothe breakup of many floor slabs �theoretically, the pressure in athin layer of viscous gas between two colliding parallel flat slabsapproaches infinity at the end�.
The mass that is shed from the tower, characterized by empiri-cal parameter �out, exits at various velocities ranging from nearly0 to almost either the air ejection velocity, for fine dust, or toroughly z, for large steel pieces. Instead of complicating ourmodel by some distribution of these velocities, we will simplyassume that a certain fraction, �e�out, characterized by empiricalparameter �e, gets ejected in any direction �horizontal, inclined
˙
downward or upward, or almost vertical� at velocity z, while theAL OF ENGINEERING MECHANICS © ASCE / OCTOBER 2008 / 897
remaining mass �1−�e��out is shed at nearly vanishing velocity.For a certain empirical value of �e, this will be energeticallyequivalent to considering the actual distribution of velocities ofejected solids. As the crushing front advances by dz, the mass ofsolids �dust plus large fragments� that is ejected at velocity z is�e�out��z�dz and has kinetic energy �e�out��z�dz�z2 /2�. This mustbe equal to Fedz, i.e., to the work of the resisting force Fe overdistance dz. It follows that
Fe = 12�e�out��z�z2 �10�
The computation results shown in figures have been run for �e
=0.2; however, a broad range of �e has been considered in com-putations, as discussed later. For the crush-up, �e must be ignoredbecause the compacted layer is stationary.
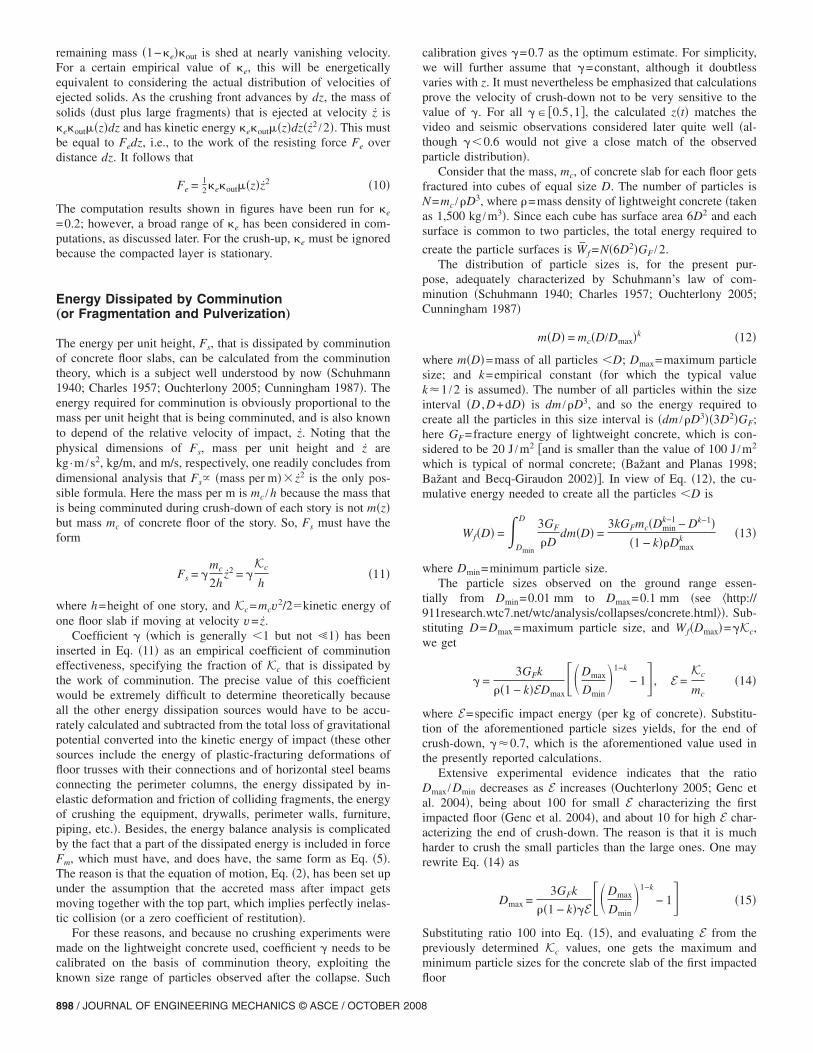
Energy Dissipated by Comminution„or Fragmentation and Pulverization…
The energy per unit height, Fs, that is dissipated by comminutionof concrete floor slabs, can be calculated from the comminutiontheory, which is a subject well understood by now �Schuhmann1940; Charles 1957; Ouchterlony 2005; Cunningham 1987�. Theenergy required for comminution is obviously proportional to themass per unit height that is being comminuted, and is also knownto depend of the relative velocity of impact, z. Noting that thephysical dimensions of Fs, mass per unit height and z arekg·m /s2, kg/m, and m/s, respectively, one readily concludes fromdimensional analysis that Fs� �mass per m� z2 is the only pos-sible formula. Here the mass per m is mc /h because the mass thatis being comminuted during crush-down of each story is not m�z�but mass mc of concrete floor of the story. So, Fs must have theform
Fs = �mc
2hz2 = �
Kc
h�11�
where h=height of one story, and Kc=mcv2/2�kinetic energy ofone floor slab if moving at velocity v= z.
Coefficient � �which is generally �1 but not �1� has beeninserted in Eq. �11� as an empirical coefficient of comminutioneffectiveness, specifying the fraction of Kc that is dissipated bythe work of comminution. The precise value of this coefficientwould be extremely difficult to determine theoretically becauseall the other energy dissipation sources would have to be accu-rately calculated and subtracted from the total loss of gravitationalpotential converted into the kinetic energy of impact �these othersources include the energy of plastic-fracturing deformations offloor trusses with their connections and of horizontal steel beamsconnecting the perimeter columns, the energy dissipated by in-elastic deformation and friction of colliding fragments, the energyof crushing the equipment, drywalls, perimeter walls, furniture,piping, etc.�. Besides, the energy balance analysis is complicatedby the fact that a part of the dissipated energy is included in forceFm, which must have, and does have, the same form as Eq. �5�.The reason is that the equation of motion, Eq. �2�, has been set upunder the assumption that the accreted mass after impact getsmoving together with the top part, which implies perfectly inelas-tic collision �or a zero coefficient of restitution�.
For these reasons, and because no crushing experiments weremade on the lightweight concrete used, coefficient � needs to becalibrated on the basis of comminution theory, exploiting the
known size range of particles observed after the collapse. Such898 / JOURNAL OF ENGINEERING MECHANICS © ASCE / OCTOBER 2008
calibration gives �=0.7 as the optimum estimate. For simplicity,we will further assume that �=constant, although it doubtlessvaries with z. It must nevertheless be emphasized that calculationsprove the velocity of crush-down not to be very sensitive to thevalue of �. For all �� �0.5,1�, the calculated z�t� matches thevideo and seismic observations considered later quite well �al-though ��0.6 would not give a close match of the observedparticle distribution�.
Consider that the mass, mc, of concrete slab for each floor getsfractured into cubes of equal size D. The number of particles isN=mc /�D3, where �=mass density of lightweight concrete �takenas 1,500 kg /m3�. Since each cube has surface area 6D2 and eachsurface is common to two particles, the total energy required to
create the particle surfaces is Wf =N�6D2�GF /2.The distribution of particle sizes is, for the present pur-
pose, adequately characterized by Schuhmann’s law of com-minution �Schuhmann 1940; Charles 1957; Ouchterlony 2005;Cunningham 1987�
m�D� = mc�D/Dmax�k �12�
where m�D�=mass of all particles �D; Dmax=maximum particlesize; and k=empirical constant �for which the typical valuek�1 /2 is assumed�. The number of all particles within the sizeinterval �D ,D+dD� is dm /�D3, and so the energy required tocreate all the particles in this size interval is �dm /�D3��3D2�GF;here GF=fracture energy of lightweight concrete, which is con-sidered to be 20 J /m2 �and is smaller than the value of 100 J /m2
which is typical of normal concrete; �Bažant and Planas 1998;Bažant and Becq-Giraudon 2002��. In view of Eq. �12�, the cu-mulative energy needed to create all the particles �D is
Wf�D� =�Dmin
D 3GF
�Ddm�D� =
3kGFmc�Dmink−1 − Dk−1�
�1 − k��Dmaxk �13�
where Dmin=minimum particle size.The particle sizes observed on the ground range essen-
tially from Dmin=0.01 mm to Dmax=0.1 mm �see �http://911research.wtc7.net/wtc/analysis/collapses/concrete.html��. Sub-stituting D=Dmax=maximum particle size, and Wf�Dmax�=�Kc,we get
� =3GFk
��1 − k�EDmax�Dmax
Dmin�1−k
− 1, E =Kc
mc�14�
where E=specific impact energy �per kg of concrete�. Substitu-tion of the aforementioned particle sizes yields, for the end ofcrush-down, ��0.7, which is the aforementioned value used inthe presently reported calculations.
Extensive experimental evidence indicates that the ratioDmax /Dmin decreases as E increases �Ouchterlony 2005; Genc etal. 2004�, being about 100 for small E characterizing the firstimpacted floor �Genc et al. 2004�, and about 10 for high E char-acterizing the end of crush-down. The reason is that it is muchharder to crush the small particles than the large ones. One mayrewrite Eq. �14� as
Dmax =3GFk
��1 − k��E�Dmax
Dmin�1−k
− 1 �15�
Substituting ratio 100 into Eq. �15�, and evaluating E from thepreviously determined Kc values, one gets the maximum andminimum particle sizes for the concrete slab of the first impacted
floor
North Tower
Dmax � 14.24 mm, Dmin � 0.142 mm �16�
South Tower
Dmax � 12.76 mm, Dmin � 0.128 mm �17�
Another important result of comminution theory, supported byextensive experiments �Davis and Ryan 1990�, is that Dmax de-pends only on the specific impact energy E, and in particular that
Dmax � AE−p �18�
Here A , p=positive constants, which may be calibrated on thebasis of the maximum particle sizes of the first impacted story andof the last story at the end of crush-down. Substitution of Eq. �18�into Eq. �12� then yields the particle-size distribution for any im-pacted floor slabfor North Tower
m�D� = 0.021E0.708mc�D �19�
for South Tower
m�D� = 0.020E0.712mc�D �20�
Fig. 4�a� presents the calculated particle-size distributions forthe impacts on three different stories of each tower. Fig. 4�b�shows that the calculated minimum and maximum particle sizesproduced by comminution of floor slabs decrease rapidly as thecrushing front propagates down, and so does the size range. Theratio of the calculated mass of dust �defined here as the particles�0.1 mm� to the slab mass increases with time until the end ofcrush-down �Fig. 4�c��. About 67% of the mass of all slabs getspulverized into dust during the crush-down, which explains thedust clouds seen jetting out. Fig. 4�d� gives the ratio of the cu-mulative plot of the energy dissipated by comminution to the lossof gravitational potential, as a function of time or story number.The jump at impact of compacted layer on the ground �founda-tion� is due to further comminution of particles previously com-minuted to larger sizes.
Fig. 5�a� presents a plot of the calculated ratio of four compo-nents of the resisting force to the total resisting force Fc as afunction of both time and story number. Fs, Fe, and Fa as frac-tions of Fc are initially negligible and then increase, due to in-creasing velocity of the falling mass. Afterwards, despiteincreasing velocity, the increase of Fb offsets the increase ofFa, Fe, and Fs. Consequently, fractions Fs, Fe, and Fa begin todrop and, near the end of crush-down, Fs+Fa+Fe�0.30Fb. Atthe same time, the falling mass becomes so huge that the effectof changes in Fs, Fa, and Fe on the collapse duration becomessmall. During the crush-up phase, the fraction of Fs+Fa is sig-nificant at first, due to high velocity and low Fb of upper storiesbut afterwards it decreases as the falling mass decelerates�Fs+Fa�2.17Fb on average, while Fe=0 for crush-up�. Fig. 5�b�shows the variation of Fc and Fm; due to increasing velocity, Fm
becomes dominant despite increasing Fs, Fe, and Fa.Fig. 5�c� shows the calculated ratio of the comminution energy
to the kinetic energy of the falling mass. During the crush-down,the ratio decreases, which is explained by the accretion of fallingmass. During the crush-up, this ratio increases since the fallingmass is decreasing, and ends up with 70% as the last slab �i.e., theroof slab� impacts the pile on the ground.
Fig. 5�d� shows the calculated ratio of the total resisting force
to the weight of the upper falling part. For the North Tower, thisJOURN
ratio remains almost constant up to the 83rd story, as the massaccretion and the increase of Fc balance each other due to increas-ing velocity, and then increases because the resistance to columnbuckling overcomes the resistance due to mass accretion. Thisratio is nevertheless much less than 1 during crush-down, whileduring crush-up it increases, causing the moving part to deceler-
Fig. 4. �a� Particle-size distributions due to concrete comminution atdifferent heights; �b� variation of maximum and minimum fragmentsizes with height; �c� variation of fraction of dust mass �size�0.1 mm� within total fragment mass; and �d� loss of gravitationalpotential and comminution energy
ate �a continuum model will give an infinite ratio at the end be-
AL OF ENGINEERING MECHANICS © ASCE / OCTOBER 2008 / 899

cause the mass tends to 0�. For the South Tower, the trend issimilar except that this ratio at first also increases. The reason isthat, compared to the North Tower, the calculated velocity of thecrushing front in the South Tower increases faster, due to its
Fig. 5. Variation of force and energy quantities along height
larger falling mass, causing the resisting force to grow faster than
900 / JOURNAL OF ENGINEERING MECHANICS © ASCE / OCTOBER 2008
the mass accretion rate of the upper falling part at the beginningof crush-down.
Energy Required to Produce All of PulverizedConcrete
Let us now check whether the gravitational energy deliveredby impact sufficed to produce the large amount of concretedust on the ground. The dust particles generally ranged fromDmin=0.01 mm to Dmax=0.1 mm. Substituting D=Dmax intoEq. �13�, and considering, as an upper bound, that all of the con-crete of both towers �about Md=14.6107 kg� was pulverized,lying on the ground, we can calculate an upper bound on the totalimpact energy Kt required to produce all these particles, for bothtowers
Kt =3MdGF
�Dmax0.5 �Dmin
−0.5 − Dmax−0.5� �21�
=3 �14.6 107� kg 20 J/m2
1,500 kg/m3 �100 �m�0.5 ��10 �m�−0.5 − �100 �m�−0.5�
= 12.63 1010 J �22�
Eq. �21� indicates the dissipation of about 865 J /kg of pulverizedconcrete, which is a realistic value.
The total gravitational potential energy �g released byone tower is calculated as the tower weight multiplied by thedistance between the mass centroid of the tower and the masscentroid of the rubble heap on the ground, and is approximately�g=8.251011 J. Eq. �21� represents only about 7.65% of 2�g
�both towers�. So there is far more impact energy than necessary.Hence, the kinetic energy of gravity-driven collapse can perfectlyexplain the pulverization seen on the ground. The remaining en-ergy is dissipated by frictional and plastic deformations, and ejec-tion of air and other debris.
Eq. �21� includes the comminution energy during the crush-down and crush-up. The energy dissipated exclusively during theimpact on the foundation can be calculated by subtracting thefollowing three energy quantities from Eq. �21�: �1� the commi-nution energy of particles �0.1 mm produced by impacts on thefloor slabs prior to the end of crush-down; �2� the comminutionenergy of particles �0.1 mm produced during crush-down whichare comminuted to sizes �0.1 mm during the impact on the foun-dation; and �3� the comminution energy of particles �0.1 mmproduced during the crush-up �which is small because the im-pact energies during crush-up are much smaller and lead to largefragments�.
The kinetic energy of the impact, Kt, can alternatively be cal-culated from the final velocity v f of the compacted layer of rubbleas it hits the foundation at the bottom of the “bathtub.” Accordingto the crush-down differential equation, it was v f �47.34 m /s forthe North Tower, and v f �48.33 m /s for the South Tower, fromwhich
Kt = 12 �M0 + �1 − �out��MT − M0��v f
2 �23�
North Tower
Kt = 1 4.32 108 47.342 = 4.84 1011 J �24�
2
South Tower
Kt = 12 4.44 108 48.332 = 5.19 1011 J �25�
Again we see that the available energy is far higher than requiredfor all of the comminution.
It is nevertheless interesting to check the amount of explosivesthat would be required to produce all of the pulverized concretedust found on the ground. Explosives are notoriously inefficientas a comminution tool. At most 10% of their explosive energygets converted into the fracture energy of comminution, and onlyif the explosive charges are installed in small holes drilled into thesolid to be comminuted. Noting that 1 kg of TNT chemicallyreleases about 4 MJ of energy, the total mass of TNT required topulverize 14.6107 kg concrete material into dust of the sizesfound on the ground would be 316 t. So, in order to achieve thedocumented degree of concrete pulverization, solely by explo-sives about 1.36 t of TNT per story would have to be installedinto small holes drilled into the concrete slab of each story, andthen wired to explode in a precise time sequence to simulate freefall.
Given the uncertainty of input parameters, computer calcula-tions have been run for the full range of their realistic values. Incomparison with all these calculations, the claim that the ob-served fineness, extent, and spread of pulverized dust could beexplained only by planted explosives has been found to be absurd.Only gravity driven impact could have produced the concrete dustas found on the ground.
Analysis of Video-Recorded Motion and Correctionfor Tilt
Some critics believe that the bottom of the advancing dust cloudseen in the video represented the crushing front. However, thisbelief cannot be correct because the compressed air exiting thetower is free to expand in all directions, including the downwarddirection. This must have caused the dust front to move ahead ofthe crushing front �the only way to prevent the air from jetting outin all directions would be to shape the exit from each floor as adiverging nozzle of a rocket, which was obviously not the case�.
Video records in which the motion of the tower top can betracked are available for the first few seconds, until the tower topgets shrouded by a cloud of dust and smoke �Fig. 7�. The timehistory of the vertical displacement �or drop� �m of the tower topwas simply identified by measurements with a ruler on a largecomputer screen, which had an error of up to �1.0 m �measuringpixel locations would have been more accurate, but for thepresent purpose it would make little difference�. A correction wasmade for the varying inclination � of the line of sight from thevertical, and for this purpose the distance of the camera from thetower ��1 mile� and altitude �roughly 150 m� had to be esti-mated. This correction was found to be insignificant �about 0.5%.�Because the towers were tilting, what can be seen in the video isa top corner, which is the northeast corner for the South Towerand the northwest corner for the North Tower. With the notationsin Fig. 6�a�, the height of these corners above the ground may beexpressed as
X�t� = H − Y�t� + �1c�t� − �2c�t� �26�
Y�t� =�z
z�t�
�1 − ��S��dS �27�
0JOURN
�1c�t� =1
2a�sin st − sin si − sin et + sin ei� �28�
�2c�t� = 12H1��cos si − cos st� + �cos ei − cos et�� �29�
where Y�t�=drop of the centroid of the upper falling mass; �1c,�2c=corrections for tilting; si, st=initial and current tilt anglestoward the south; and ei, et=those toward the east �these anglesare taken as positive when the displacement is downward on thesouth and east sides, respectively; Fig. 6�a��.
For the South Tower, H1�110 m. It is found that, during thefirst 2 s, the tilt towards the east increased from 2.8° to 6.9°. Inbetween, the rate of rotation may be considered to be approxi-mately uniform. According to NIST �2005�, the tilt towards thesouth reached 4° within approximately 2 s. For the initial tiltangle towards the south, no information exists except that it couldnot have been large, and so it is taken as zero. For the duration ofvideo record, the foregoing equations give the correction ofheight due to tilt, which attains 0.48 m at 2 s �the video recordactually extends up to 4 s, at which time, according to NIST, thetilt angle to the East was 25° and to the South probably remainedsmall�. Thus the tilt after 2 s is too high for comparing the presentone-dimensional model to the video, although this model appearsadequate for the overall collapse.
For the North Tower, it was assumed in the calculations thatthe tilt in the south direction varied during the first 5 s from 2.8°to 8° �which is the angle reported by NIST �2005��, and that it
Fig. 6. �a� Tilting of upper part of tower, with notations; �b�–�e�possible and impossible collapse of tilting top
was zero in the east direction.
AL OF ENGINEERING MECHANICS © ASCE / OCTOBER 2008 / 901

The motion of the centroid of the tower tops identified in thismanner is shown Fig. 7. The vertical error bars indicate the rangeof uncertainty in the interpretation of the video.
Comparisons of Calculated Motion with VideoRecord
The corrections for tilt in Eqs. �26�–�29� are taken into account inthe calculations. Since there are uncertainties in the values ofspecific mass of compacted layer �c and the mass shedding ratio�out, calculations are run for many values within their possibleranges. For �c, the uncertainty range is 4.10106�0.410106 kg /m, based on regarding the compacted rubble as gravel,for which the realistic value of porosity is well known fromsoil mechanics. As for �out, the fits of the video and seismicrecords are optimal for 0.2, but the optimum is not sharp. For�out� �0.05,0.5�, the results are within the error bars if �c is set to4.10106 kg /m. If both �c and �out are considered to vary,then the results remain within the error bars if �out� �0.1,0.3�.The range plotted in Fig. 7 corresponds to �c� �3.69106 ,4.51106� �kg/m� and �out� �0.1,0.3�.
Fig. 7. Circle points: motion history of upper part identified fromvideo record, with uncertainty range shown by vertical errorbars; �solid curves� solution of crush-down differential Eq. �2�; anddashed curves: error range due to uncertainty in compaction andmass-shedding ratios
The range of the possible motion histories, calculated from
902 / JOURNAL OF ENGINEERING MECHANICS © ASCE / OCTOBER 2008
Eq. �2� for the uncertainty ranges of video interpretation and of �c
and �out values �discussed later� is shown as the shaded band inFig. 7. Within the short duration of the video record, the resis-tance due to comminuting concrete and ejecting air and otherdebris is found to be so small that the difference is not visuallyperceptible in the graph.
Note in Fig. 7 that the motion identified from the videos isgenerally seen to pass well inside the predicted band of uncer-tainty of the motion calculated from Eq. �2�. This fact supportsthe present analysis. The main point to note is that the curveidentified from the video record grossly disagrees with the freefall curve for each tower. The belief that the towers collapsed atthe rate of free fall has been a main argument of the critics claim-ing controlled demolition. The video record alone suffices toprove this argument false.
For the South Tower, the difference between the free fall curveand the curve calculated from Eq. �2� is less pronounced than it isfor the North Tower. The reason is clear by comparing the dia-grams in Fig. 5�d�, which show that the ratio of resisting force tofalling mass weight is slightly less for the South Tower.
The agreement of the video record with the calculated propa-gation of the crushing front permits us to conclude that the struc-tural system within the top parts of the WTC Towers was able,on average, to dissipate the energy of Fb�0.1 GJ /m, per unitheight of tower. This amounts to the energy dissipation capabilityof D�4.23 kJ /kg of column steel.
In design, it is desirable to maximize D. As proposed inBažant and Verdure �2007�, the values of D characterizing vari-ous kinds of structural systems could be determined by accuratemonitoring of the motion history in building demolitions.
Comparison of Collapse Duration with SeismicRecord
Calculations show that the duration of the entire crush-downphase exceeds the free fall duration by 65.5% for the NorthTower, and by 47.3% for the South Tower �Fig. 8�. This is asignificant difference, which can be checked against seismicrecords registered at Lamont-Doherty Earth Observatory ofColumbia University ��http://www.ldeo.columbia.edu/LCSN/Eq/WTC_20010911.html��, shown in Fig. 8. In a detailed seismicanalysis at Columbia University, Kim et al. �2001� report that,because of short travel distance and shallow excitation, the re-corded seismic waves were short-period Rayleigh surface waves�which generally travel within the upper few kilometers of Earthcrust�. No pressure and shear waves were registered.
The first tremor in Fig. 8, which is weak �and is marked as a�,is assumed to represent t=0, i.e., the moment of impact of theupper part of the tower onto the lower part �a correction of 0.07 sis made for the delay due to the travel time of the sound wavealong the steel columns to the ground�. The sudden, though mild,displacement increase at instant b �Fig. 8� is attributed to freefalling large structure segments that hit the ground outside thetower perimeter.
The free fall times for the fragments ejected at the 96th and81st stories are 8.61 and 7.91 s, respectively �the air drag is neg-ligible for multistory pieces of the steel frame�. These times arenot the same as the free fall time shown in the Fig. 8, because theejected fragments are hitting the ground. The free fall curve inFig. 8, showing the motion history of the tower top, correspondsto the free fall of the top part of the tower, and the moment
comparable to the end of crush-down is the intersection of this
curve with the horizontal line corresponding to the end of crush-down, at which the compacted layer of debris hits the foundation�i.e., the bottom of the “bathtub”�. Note that immediately afterthis moment, the compacted layer of rubble begins to spread tothe sides because, at rest, the slope of the rubble mass cannotexceed the internal friction angle of the rubble �Fig. 3�b�� �in thecrush-up calculations of Bažant and Verdure �2007�, the lateralspreading of the compacted layer of rubble during the crush-upwas neglected, for the sake of simplicity�.
The onset of the strongest tremor, marked in the figure asinstant c, may logically be interpreted as the instant at which thecrush-down front �bottom of the layer of compacted debris� hitsthe foundation slab in the “bathtub.” Thus it ensues from the
Fig. 8. Comparisons of collapse durations with seismic records fromColumbia University
seismic records that the crush-down phase lasted 12.59�0.50 s
JOURN
for the North Tower, and 10.09�0.50 s for the South Tower. Thefact that the structure in the “bathtub” under the ground level wasessentially destroyed and mostly compacted into rubble wasdocumented during debris removal �http://www.construction.com/NewsCenter/Headlines/ENR/20011008b.asp�.
These durations match the durations of the crush-down phasecalculated from Eq. �2� reasonably well, which are 12.81 and10.47 s for the North and South Towers, under the assumptionthat the reduction factor � applied to Fb is 2 /3. If the full uncer-tainty range, �� �0.5,0.8�, is considered, the calculated mean du-rations are 12.82 and 10.49 s, respectively. This uncertainty isshown by error bars in Fig. 8.
Now note that these durations are, on the average, 65.5% and47.3% longer than those of a free fall of the upper part of eachtower, which are 7.74 s for the North Tower and 7.11 s for theSouth Tower. So, the seismic record also appears to contradict thehypothesis of progressive demolition by timed explosives.
Note that the seismic record of the South Tower shows mul-tiple large tremors at the end of crush-down. Why it does is de-batable. The reason could be the significant tilting of the top partof the tower, caused by a greater eccentricity of the aircraft im-pact. The tilt may have led to ejection of larger structural frag-ments. Or it may have caused one side of the South Tower to becrushed ahead of the other, and thus the crush-down might haveended on one side earlier than on the other. It is interesting thatnot only for the North Tower, but also for the South Tower, thecalculated collapse duration nevertheless matches the seismicrecord reasonably well. The high tilt seen on the South Tower top�about 25° after 4 s of fall, �NIST 2005�� would call for a three-dimensional model of progressive collapse. Why does the one-dimensional model nonetheless give a reasonably good match?Probably because the crushing front of compacted debris tends todevelop a flat front once it becomes thick enough �Fig. 6�e��.However, to answer this question fully, a three-dimensionalanalysis would be required.
Effect of Uncertainty of Mass SheddingFraction �out
The mass shedding fraction �out is, of course, quite uncertain anddoubtless depends on z, which is neglected. The realistic range ofpossible �out values extends at most from 0.05 to 0.5. Within thatrange, the effect of varying �out is not discernible in the video�remaining within the error bars shown�, and small on the col-lapse time �which differs up to 0.45 s�. For �out� �0.1,0.3�, thematch of both the video and seismic records is excellent.
While �out affects the resisting force, mass accretion, andcompaction ratio, �e affects only the first. An increase in �e willdelay the collapse duration. Parametric studies show that, for�e� �0.1,0.8�, the collapse duration varies about 0.31 s, whichstill matches the video and seismic records reasonably well. Anincrease in �out can have opposite effects depending on the initialmass m�z0� and on the stage of crush-down as follows:1. In the first stage of collapse, an increase in �out causes a
decrease in compaction ratio �, which reduces the accelera-tion of the crush front. The effect of �out on the resistingforce and mass accretion is not dominant in this stage. Thisgives a slower collapse;
2. For a subsequent short stage of crush-down, the effect of �out
on the resisting force Fm prevails while the effect of �out onthe mass accretion does not. This gives a faster collapse; and
3. In the late stage of crush-down, an increase in �out causes the
AL OF ENGINEERING MECHANICS © ASCE / OCTOBER 2008 / 903

accumulated mass m�z� to become significantly smaller,while the column crushing force Fb remains unchanged. Thiscauses the ratios m�z�g /Fb, and thus also m�z�g /Fc, to de-crease greatly, which gives a slower collapse.
Parametric studies show that stage �1� lasts for 2–3 s. The roleof stages �2� and �3� in the total collapse duration depends on theinitial falling mass m0. For the North Tower, because of its lowerinitial falling mass, stage �3� dominates, and so an increase in �out
always gives an increase in collapse duration. If �out is increasedfrom 0.05 to 0.5, the crush-down collapse duration is longer, butnot by more than 0.45 s, which still matches the seismic recordwell enough. For the South Tower, the effect of stage �2� mildlyprevails over a considerably long period while the effects ofstages �1� and �3� are weak. The net result is to lengthen thecrush-down duration, but only a little; if �out is varied from 0.05to 0.5, the crush-down duration increases by only 0.14 s. For thefitting of the video record of the first few seconds, the velocity isso low that the effect of �out is insignificant, for both towers.
Some lay critics claim that �out should be about 95%, in the�mistaken� belief that this would give a faster collapse and thusvindicate their allegation of free fall. However, such �out valuewould actually extend the duration of the collapse of the NorthTower by about 2.11 s �and 1.50 s for �out=90%� because theeffect of stage �3� would become dominant. Agreement with theseismic record would thus be lost. This is one reason why values�out�0.5 are unrealistic.
These lay critics claim that the mass shedding fraction �out wasabout the same as the percentage of rubble found after the col-lapse outside the footprint of the tower. The maximum estimate ofthis percentage is indeed 95%. However, aside from the compari-sons with video and seismic records, there are four further reasonsindicating that a major portion of the rubble seen on the groundafter the collapse must have spread outside the tower footprintonly after the crush-down, i.e., after the impact of the fallingcompacted layer onto the ground:1. One is a physical analogy with the mechanics of rigid foams.
Compressing an object in one direction expels mass laterallyonly if the compressed object consists of a volumetricallyincompressible mass, as in compressing clay. But, if the ob-ject has much empty space, as in the case of the twin towers,one must expect a similar behavior as in penetration of a hardmissile into a rigid foam, in which case almost no mass isspread laterally;
2. The large steel fragments move virtually in a free fall, muchfaster than the dust. If �out were almost 1, many of themwould be expected to move ahead of the lower margin of thedust cloud. Yet the photographs show the density of fallingsteel fragments visible in the air to be far too small to ac-count for most of the mass of the steel frame;
3. If most of the mass were falling in the air outside the towerperimeter, one would have to expect a seismic signal withcontinuous mild tremors, in which the arrival of the crushingfront to the ground would not be clearly differentiated. But itis; and
4. One may also consider the dust density in the cloud. For thefirst two stories of collapse �i.e., the first 1.3 s�, the cloudvolume seen in the photos can be approximated as the vol-ume of four half cylinders with horizontal axis and diametersequal to the height of two stories and lengths equal to thetower side. This gives about 6,000 m3. On the ground, thedust density was reported by the Environmental ProtectionAgency �EPA� to be about 339 kg /m3. But in the air, the
average dust density could not have been more than 10% of904 / JOURNAL OF ENGINEERING MECHANICS © ASCE / OCTOBER 2008
the dust density on the ground; this gives, for the dust portionof �out, at most 0.05, during the first 1.3 s of collapse.
As for the crush-up phase, �out has no effect on the equation ofmotion but affects the initial condition, which is the final velocityof the crush-down phase. It is found that increasing �out reducesthe final velocity and extends the crush-up duration.
Previously Refuted Hypotheses of Critics
Some other hypotheses have already been refuted in the discus-sions at the United States National Congress of Theoretical andApplied Mechanics in Boulder, June 2006. This includes the hy-pothesis that the structural frame was somehow brought to thebrink of strain-softening damage and then destroyed by a peculiarphenomenon called the “fracture wave,” causing the collapse tooccur at the rate of free fall �download Progre…pdf from �http://www.civil.northwestern.edu/people/bazant/PDFs/Papers/��. Thereare three serious problems with this hypothesis: �1� it treats strainsoftening as a local, rather than nonlocal, phenomenon �Bažantand Verdure 2007�; �2� it considers the structural frame to havesomehow been brought to a uniform state on the brink of strainsoftening, which is impossible because such a state is unstableand localizes as soon as the strain softening threshold at any place�Bažant and Cedolin 2003, Sec 13�B��; and �3� the “fracturewave” is supposed to cause comminution of concrete but the en-ergy required for comminution cannot be delivered by this wave.
Another previously refuted hypothesis of the lay critics is that,without explosives, the towers would have had to topple like atree, pivoting about the base �Bažant and Zhou 2002� �Fig. 6�b� or6�c��. This hypothesis was allegedly supported by the observedtilt of the upper part of the tower at the beginning of collapse�Fig. 6�a��. However, rotation about a point at the base of theupper part �Fig. 6�c�� would cause a horizontal reaction approxi-mately 10.3 greater than the horizontal shear capacity of thestory, and the shear capacity must have been exceeded already atthe tilt of only 2.8° �Bažant and Zhou 2002�. Thereafter, the toppart must have been rotating essentially about its centroid, whichmust have been falling almost vertically. The rotation rate musthave decreased during the collapse as further stationary mass ac-creted to the moving block. So, it is no surprise at all that thetowers collapsed essentially on their footprint. Gravity alone musthave caused just that �Bažant and Zhou 2002�.
In the structural engineering community, one early speculationwas that, because of a supposedly insufficient strength of the con-nections between the floor trusses and the columns, the floors“pancaked” first, leaving an empty framed tube, which lost stabil-ity only later. This hypothesis, however, was invalidated at NISTby careful examination of the photographic record, which showssome perimeter columns to be deflected by up to 1.4 m inward.This cannot be explained by a difference in thermal expansion ofthe opposite flanges of the column. NIST explains this deflectionby a horizontal pull from catenary action of sagging floor trusses,the cause of which has already been discussed. This pull wouldhave been impossible if the floor trusses disconnected from theperimeter columns.
Other critics claimed sightings of “pools of molten metal”within the rubble pile, purportedly produced by planted thermite-based incendiary devices. But all of the supposed evidence isentirely anecdotal, and is refuted by the facts in the NIST �2005�report. It was asserted that the presence of thermite residues wasevidenced by sulfur, copper, and zinc detected in the WTC dust
samples. But these elements were to be expected since they were
contained in gypsum wallboard, electrical wiring, galvanizedsheet steel, etc.
Conclusions
Several of the parameters of the present mathematical model havea large range of uncertainty. However, the solution exhibits smallsensitivity to some of them, and the values of others can be fixedon the basis of observations or physical analysis. One and thesame mathematical model, with one and the same set of param-eters, is shown to be capable of matching all of the observations,including: �1� the video records of the first few seconds of motionof both towers; �2� the seismic records for both towers; �3� themass and size distributions of the comminuted particles of con-crete; �4� the energy requirement for the comminution that oc-curred; �5� the wide spread of the fine dust around the tower; �6�the loud booms heard during collapse; �7� the fast expansion ofdust clouds during collapse; and �8� the dust content of the cloudimplied by its size. At the same time, the alternative allegations ofsome kinds of controlled demolition are shown to be totally out ofrange of the present mathematical model, even if the full range ofparameter uncertainties is considered.
These conclusions show the allegations of controlled demoli-tion to be absurd and leave no doubt that the towers failed due togravity-driven progressive collapse triggered by the effects of fire.
Acknowledgments
Partial financial support for the energetic theory of progressivecollapse was obtained from the U.S. Department of Transporta-tion through Grant No. 0740-357-A210 of the InfrastructureTechnology Institute of Northwestern University. Richard M.Lueptow, professor at Northwestern University, and Pierre-Normand Houle of Montreal, are thanked for useful comments.
Appendix. Can Crush-Up Proceed Simultaneouslywith Crush-Down?
To appraise the accuracy of the simplifying assumption ofone-way crushing, a two-way progressive collapse will now beanalyzed mathematically. Consider that both crush-up and crush-down fronts appeared after the collapse of the critical story.Denote: x�t� ,z�t�=coordinates of the mass points at thesefronts before the collapse began �Lagrangian coordinates�;q�t�=current coordinate of the tower top; and v1 ,v2= initial ve-locities of the downward and upward crushing fronts �positive ifdownward�. These velocities may be calculated from the condi-tions of conservation of momentum and of energy, which read asfollows �Bažant and Le 2008�:
m0�1 − ��v0 + 12m1��1 − ��v0 + v0�
= 12 �m1 + 2mc��v1 + v2� + �m0 − mc − m2�v3 + 1
2m2�v1 + v2�
�30�
12m0��1 − ��v0�2 + 1
2m1� 12 �2 − ��v0�2 = 1
2 �m1 + 2mc�� 12 �v1 + v2��2
+ 12 �m0 − mc − m2�v3
2 + 12m2� 1
2 �v1 + v2��2 + �Ec �31�
Here v3= q= �1−���v1+vcu� where vcu= ��1−��v1−v2� /�=initial
crush-up velocity �positive if upwards�; mc=mass of one floorJOURN
slab; m0 ,m1=masses of the upper part C and of the story thatwas the first to collapse �not including the floor slab masses�;m2=mass of a single story; and �Ec=energy loss due to commi-nution of materials, predominantly concrete, into small fragmentsduring impact, which has been calculated as 0.35mc�v1
2+vcu2 �
using the theory of comminution �i.e., �Ec=0.5�mcv2 where�=0.7�. In Eqs. �30� and �31�, we assume that the momentumdensity varies linearly throughout the compacted layer and that,when the crushing front starts to propagate upwards, the fallingpart C moves downwards as a rigid body except that its bottomlayer of one story height has a linearly varying momentum den-sity due to the crush-up front.
During impact, �=0.2 for the North Tower and 0.205 for theSouth Tower, as calculated from the mass of the impactedstory and the debris density. For the North or South Tower:m0=54.18·106 or 112.80·106 kg, m1=2.60·106 or 2.68·106 kg,m2=3.87·106 or 3.98·106 kg, and mc=0.627·106 kg for both. Fora fall through the height of the critical story, by solving Eq. �2�,one obtains the crush-front velocity v0=8.5 m /s for the NorthTower and 8.97 m /s for the South Tower. The solution ofEqs. �30� and �31� yields the following velocities after impact:v1=6.43 or 6.8 m /s, v2=4.70 or 4.94 m /s, and vcu=2.23 or2.25 m /s for the North or South Towers, respectively. These dataare used as initial conditions for the differential equations of mo-tion of the upper part C and of the compacted layer B. Theseequations represent generalizations of Eqs. �2� and �3�, and can beshown to have the form �Bažant and Le 2008�
�c d���2 − ��z��z + ��x�x�l� = �c lg + Fc� − Fc �32�
Time (s)0 0.01 0.02 0.03
0
2
4
6
8
0 0.005 0.01 0.0150
2
4
6
8
Crush-up ends
Crush-up ends
Crush-down
continues Crush-down
continues
Crus
hfro
ntve
locity
(m/s)
NORTHTOWER
SOUTHTOWER
Time (s)0 0.01 0.02 0.03
0
2
4
6
8
0 0.005 0.01 0.0150
2
4
6
8
Crush-up ends
Crush-up ends
Crush-down
continues Crush-down
continues
Crus
hfro
ntve
locity
(m/s)
NORTHTOWER
0 0.01 0.02 0.030
2
4
6
8
0 0.005 0.01 0.0150
2
4
6
8
Crush-up ends
Crush-up ends
Crush-down
continues Crush-down
continues
Crus
hfro
ntve
locity
(m/s)
NORTHTOWER
SOUTHTOWER
Colum
nFor
ceP
(MN)
Displacement (m)0 0.05 0.1 0.15
400
800
1200 NORTHTOWER
Crush-upends m0 g
0 0.04 0.08 0.12500
1000
1500
2000
2500
Crush-upends
m0 g
SOUTHTOWER
Colum
nFor
ceP
(MN)
Displacement (m)0 0.05 0.1 0.15
400
800
1200 NORTHTOWER
Crush-upends m0 g
0 0.04 0.08 0.12500
1000
1500
2000
2500
Crush-upends
m0 g
SOUTHTOWER
Fig. 9. Evolution of initial simultaneous crush-up and crush-down
2 dt
AL OF ENGINEERING MECHANICS © ASCE / OCTOBER 2008 / 905

d
dt�m�x���1 − ��z��z − �1 − ��x��x� +
m2
2x� = m�x�g − Fc�
�33�
where l=�xz��S�dS=current height of the compacted layer of
rubble; m�x�=�0x��S�dS=all the mass above level x; and Fc and
Fc�=normal forces in the crush-down and crush-up fronts calcu-lated according to Eq. �4�. The actual resisting column force isused in the calculations. The cold steel strength is used for thestory below the critical one, and a 15% reduction in steel strengthdue to heating is assumed for the story above the critical one.
Fig. 9 shows the calculated evolution of velocity in the two-way crush. As seen, the crush-up stops �i.e. �x� drops to zero�when the first overlying story is squashed by only 1% of its origi-nal height for the North Tower, and only 0.7% for the SouthTower �these values are, respectively, about 11 or eight timesgreater than the elastic limit of column deformation�. The differ-ence between the South and North Towers is very small, in spiteof the fact that the upper falling part of the South Tower wasmuch more massive. This is mainly because the columns at thecritical story of the South Tower are much stronger, roughly inproportion to the overlying mass. Since the initial crush-up phaseterminates at a very small axial deformation, it must be concludedthat the simplifying hypothesis of one-way crushing is perfectlyjustified and causes only an imperceptible difference in results�Bažant and Le 2008�.
If random fluctuation of column strength is taken into account,the crush-up resisting force Fc� in the first overlying story may belower or higher than indicated by the foregoing deterministicanalysis. If it is lower, the crush-up will penetrate deeper. Buteven for the maximum imaginable standard deviation of the av-erage column strength in a story, the crush-up will be arrestedbefore it penetrates the full story height.
References
Bažant, Z. P. �2001�. “Why did the World Trade Center collapse?”SIAM J. Math. Anal., SIAM News �Society for Industrial and AppliedMathematics� 34�8�, October, 1 and 3.
Bažant, Z. P., and Becq-Giraudon, E. �2002�. “Statistical prediction offracture parameters of concrete and implications for choice of testingstandard.” Cem. Concr. Res., 32�4�, 529–556.
Bažant, Z. P., and Cedolin, L. �2003�. Stability of structures: Elastic,inelastic, fracture and damage theories, 2nd Ed., Dover, New York.
Bažant, Z. P., and Le, J.-L. �2008�. “Closure to ‘Mechanics of progressivecollapse: Learning from World Trade Center and building demoli-tions’ by Zdeněk P. Bažant and Mathieu Verdure.” J. Eng. Mech.,134�10�, 917–923.
Bažant, Z. P., Le, J.-L., Greening, F. R., and Benson, D. B. �2007�.
“Collapse of World Trade Center Towers: What did and did not cause906 / JOURNAL OF ENGINEERING MECHANICS © ASCE / OCTOBER 2008
it.” Structural Engrg. Rep. No. 07-05/C605c, Northwestern Univ.,Evanston, Ill.
Bažant, Z. P., and Planas, J. �1998�. Fracture and size effect in concreteand other quasibrittle materials, CRC, Boca Raton, Fla.
Bažant, Z. P., and Verdure, M. �2007�. “Mechanics of progressive col-lapse: Learning from World Trade Center and building demolitions.”J. Eng. Mech., 133�3�, 308–319.
Bažant, Z. P., and Zhou, Y. �2002�. “Why did the World Trade Centercollapse?—Simple analysis.” J. Eng. Mech., 128�1�, 2–6; with Ad-dendum, March �No. 3�, 369–370.
Charles, R. J. �1957�. “Energy-size reduction relationships in comminu-tion.” Min. Eng., 9, 80–88.
Cunningham, C. V. B. �1987�. “Fragmentation estimation and theKuz-Ram model—Four years on.” Proc., 2nd Int. Symp. on RockFragmentation by Blasting, W. L. Fourney and R. D. Dick, eds., So-ciety of Experimental Mechanics �SEM�, Colo., 475–487.
Davis, D. R., and Ryan, E. V., �1990�. “On collisional disruption: Experi-mental results and scaling law.” Icarus, 83, 156–182.
Frost, H. J., and Ashby, M. F. �1982�. Deformation-mechanism maps: Theplasticity and creep of metals and ceramics, Pergamon, New York,Sec. 8.
Genc, O., Ergün, L., and Benzer, H. �2004�. “Single particle impactbreakage characterization of materials by drop testing.” Physicochem.Probl. Miner. Process., 38, 214–255.
Hart, F., Henn, W., and Sontag, H. �1985�. Multi-story buildings in steel,Cambridge University Press, Cambridge, U.K.
Kausel, E. �2001�. “Inferno at the World Trade Center.” Tech Talk (Sept.23), MIT, Cambridge, Mass.
Kim, W.-Y., et al. �2001�. “Seismic waves generated by aircraft impactsand building collapses at World Trade Center, New York City.” EOSTrans. Am. Geophys. Union, 82�47�, 565–573.
Levy, M., and Salvadori, M. �1992�. Why buildings fall down: How struc-tures fail, W. W. Norton, New York.
Munson, B. R., Young, D. F., and Okiishi, T. F. �2006�. Fundamentals offluid mechanics, 5th Ed., Wiley, Hoboken, N.J.
NIST. �2005�. “Final report on the collapse of the World Trade CenterTowers.” S. Shyam Sunder, Lead Investigator, Rep., Gaithersburg,Md.
Ouchterlony, F. �2005�. “The Swebrec function: Linking fragmentationby blasting and crushing.” Min. Technol., 114, A29–A44.
Schuhmann, R., Jr. �1940�. “Principles of comminution. I: Size distribu-tion and surface calculation.” The American Institute of Mining, Met-allurgical, and Petroleum Engineers (AIME) Technical PublicationNo. 1189, New York.
White, F. M. �1999�. Fluid mechanics, 4th Ed., WCB/McGraw-Hill, Bos-ton, 149.
Wierzbicki, T., and Teng, X. �2003�. “How the airplane wing cut throughthe exterior columns of the World Trade Center.” Int. J. Impact Eng.,28, 601–625.
“World’s tallest towers begin to show themselves on New York Cityskyline.” �1970�. Engineering News Record, Jan 1.
Zeng, J. L., Tan, K. H., and Huang, Z. F. �2003�. “Primary creep buckling
of steel columns in fire.” J. Constr. Steel Res., 59, 951–970.