Embed Size (px)
Citation preview

What Did We Learnfrom the Minnesota Test Road?
by
Mark B. Snyder, Ph.D., P.E.Engineering Consultant
prepared for
The Indiana Chapter of ACPA2009 PCCP Workshop
and Expo
Indianapolis, IndianaJanuary 27, 2009
Acknowledgments
MnDOT’s Office of Materials (for providing somepresentation materials, all raw data, referencereports, etc.), especially:
Ben Worel, Tom Burnham, Tim Clyne, Maureen Jensen,Glenn Engstrom
Concrete Paving Association of Minnesota
American Concrete Pavement Association
North Central Cement Council
Portland Cement Association
MnROAD Background
Location and Environment
History of Test SectionsOriginal PCC Paving
• Mainline 5-year (1992)
• Mainline 10-year (1993)
• LVR (1993)
1994-2006 Additional Cells• Whitetopping (1997)
• Add’l LVR Cells (2000)
• Whitetopping Reconst. (2004)
• Pervious Concrete Driveway(2005)
Mn/ROAD LessonsLearned:
Low-Volume RoadConcrete Pavement Design
and Performance
LVR Design Layout and Background
Original LVR Concrete Cells: 36-40
3-yr/100,000 ESAL Design
110mm [4.2-in] design increased to MnDOTminimum of 150mm [6 in]
Low-Volume Road PCC Test Cell Features
CellNominal Slab
Thickness(mm)
As-BuiltAvg SlabThickness
(mm)
JointSpacing
(m)
Dowel Dia.(mm)
SubbaseType and
Thick(mm)
Other
36 150 165/166 4.6 25125mm
cl5sp/1.85m sand
37 150 167/162 3.7 N/A300mm
cl5sp/1.68m sand
38 150 163/164 4.6 25125mm
cl5sp
39 150 168/165 6.1 25125mm
cl5sp
40 178/140/178 170/180 4.6 N/A125mm
cl5spThickened
Edge
Subgrade Stiffness: R-value = 12 (MR ~ 28 MPa [4000 psi])

Subbase and Concrete Mixture Details
Cl5sp subbase = 25mm max size, dense-gradedaggregate with 10-15% crushed particlesConcrete mixture:
Coarse Aggregate• (3/4-in-plus [19-mm-plus]: 922 lb/yd3 [548 kg/m3]• (3/4-in-minus [19-mm-minus] : 908 lb/yd3 [540 kg/m3]
Sand (SSD condition): 1211 lb/yd3 [720 kg/m3]Type I Cement: 511 lb/yd3 [304 kg/m3]Class C Fly Ash: 86 lb/yd3 [51 kg/m3]
• Resulting water-cementitious materials ratio (w/(c+p)) = 0.46
Air-entraining admixture (target air content of 5.5percent)
Mn/ROAD 5-axle Tractor-Trailer355-kN Inside Lane = 4 days/week453-kN Outside Lane = 1 day/week
MnROAD LVR Traffic Loadings
Est. Cumulative ESALs (through 2006):Inside Lane PCC: 330,000 ESALs
Outside Lane PCC: 310,000 ESALs
LVR General Performance Trends
Good ride quality (in context of loads,pavement class)
Very little distress
Little significant maintenance
LVR 355-kN Lane IRI History
0.00
0.50
1.00
1.50
2.00
2.50
1993 1994 1995 1996 1997 1998 1999 2000 2001 2002 2003 2004 2005 2006 2007 2008
Date
IRI
(m/k
m)
Cell 36
Cell 37
Cell 38
Cell 39
Cell 40
Typical MnDOT Highway Performance Threshold IRI = 2.16 m/km
LVR 453-kN IRI History
0.00
0.50
1.00
1.50
2.00
2.50
1993 1994 1995 1996 1997 1998 1999 2000 2001 2002 2003 2004 2005 2006 2007 2008
Date
IRI
(m/k
m)
Cell 36
Cell 37
Cell 38
Cell 39
Cell 40
Typical MnDOT Highway Performance Threshold IRI = 2.16 m/km
IRI Observations
After 12 years, 300,000+ ESALs:
Rates of deterioration vary between sections
0.024 – 0.068 m/km/yr [1.5 – 4.3 in/mi/yr]
Linear projection: 17-62 years of service
500,000 – 1,600,000 ESALs
Thinner sections (100 – 125mm) may haveproven adequate, even for heavy trucks
Cell 32 – 5-in pavement constructed in 2000

IRI Observations
Design details correlated with IRI for LVRpavements
Strong influence of dowels
Modest influence of foundation design, panellength, etc.
Example:
Cell 40 (no dowels, std subbase) had highestinitial IRI, highest rate of IRI increase
Cell 37 (dowels, thicker subbase, sand subcut)had lowest initial IRI, lowest rate of IRI increase
LVR 355-kN Lane IRI History
0.00
0.50
1.00
1.50
2.00
2.50
1993 1994 1995 1996 1997 1998 1999 2000 2001 2002 2003 2004 2005 2006 2007 2008
Date
IRI
(m/k
m)
Cell 36
Cell 37
Cell 38
Cell 39
Cell 40
Typical MnDOT Highway Performance Threshold IRI = 2.16 m/km
IRI Observations (continued)
Initial IRI strongly influences long-termservice life for PCC pavements
IRI vs time slope ~ constant for each studypavement
PCC pavement service life can often beextended by decreasing initial IRI (throughconstruction practices of diamond grinding)
Performance projections suggest that improving initial IRI by just
0.16m/km [10 in/mi] will increase time to terminal IRI by 2 to 7 years.
LTE History for Doweled LVR Cells(355-kN [80-kip] lanes)
0
10
20
30
40
50
60
70
80
90
100
Jan-93 Jan-96 Jan-99 Jan-02 Jan-05 Jan-08
Test Date
LT
E,%
Cell 36
Cell 38
Cell 39
LTE History for Undoweled LVR Cells(355-kN [80-kip] lanes)
0
10
20
30
40
50
60
70
80
90
100
1/93 1/96 1/99 1/02 1/05 1/08
Test Date
LT
E,%
Cell 37
Cell 40
Deflection Test Data, Mar-Apr 2007
Test Cell
AverageLoaded JointDeflection,
mm
AverageTransverse
Joint LTE, %
AverageDifferential
Deflection, mm
36 (deepfoundation,doweled)
0.17/0.17 89/86 0.018/0.023
37 (deepfoundation,undoweled)
0.30/0.31 42/42 0.17/0.18
38 (std foundation,doweled)
0.36/0.37 85/87 0.054/0.048
39 (std foundation,doweled)
0.32/0.34 92/89 0.026/0.038
40 (std foundation,undoweled)
0.42/0.29 53/83 0.20/0.049

Deflection Testing Observations
Significant impact of dowels on deflectionsand LTE, even for thin pavements
Other design enhancements had little impacton performance of the study sections.
For undoweled pavements, deep free-drainingfoundation and shorter panels (3.7m vs. 4.6m)provided higher LTE, lower deflections andless distress.
Cost-effective?
LVR PCCP Distress Summary
As of June 2006:Cells 36 – 37: No significant distressCell 38:
1 panel (of 33) medium-severity; 2 panels high-severity10m longitudinal cracking
Cell 391 panel (of 25) high-severity
Cell 401 panel (of 33) high-severity1 high-severity corner breakUp to 47% joint sealant damage
Transverse cracking is over utility trenches.Possibly accelerated by long panels (L/t > 24)
LVR Faulting Measures (11/2006)
Test CellAverage JointFaulting (mm)
Maximum JointFaulting (mm)
Std. Dev. JointFaulting (mm)
36 (doweled) 0.43/0.46 1.1/1.6 0.58/0.32
37 (undoweled) 0.61/0.33 1.5/0.89 0.61/0.38
38 (doweled) 0.15/0.48 1.2/1.2 0.61/0.46
39 (doweled) 0.41/0.30 2.1/1.2 0.76/0.58
40 (undoweled) 2.64/1.50 5.0/4.3 1.1/1.3
Typical failure criterion for faulting = 6mm for short panels
MAINTENANCE LOG
No significant maintenance or rehabilitation hasbeen performed on any of the original
MnROAD low volume road concrete pavementtest cells.
All other original cells on the low-volume roadtest loop have required significant maintenance
or reconstruction (some more than once).
Performance Prediction
One objective of MnROAD: validatepavement design procedures.
Burnham and Pirkl (1997) used as-builtparameters with several design procedures topredict service life of MnROAD test cells.
This study updated that work using MEPDGand current IRI trends.
Serviceability Life Predictions
TestCell
Current Avg.IRI Increase
per Year(355-kN lane)/
ProjectedTotal Life
Mn/DOTDesignMethod
AASHTO1993 Method
(50% and75%
Reliability)
MEPDGv1.000 (50%
and 75%Reliability)
1984 PCAMethod*
36 0.045/28 43.5 43.4/23.7 25/17 125.8
37 0.034/41 37.5 39.3/21.4 19/12 41.7
38 0.063/21 33.5 40.9/22.3 25/17 101.9
39 0.067/20 24.5 27.0/14.8 13/8 97.1
40 0.061/17 50.0 54.6/29.8 11/4 65.7
Service life estimates based on 7,000 80-k passes/year, terminal PSR = 2.5, 15% slab cracking.
*Service life is for cracking criterion only, not for erosion criterion.

Serviceability Life Prediction Variance
TestCell
ProjectedTotal Life
based on IRITrends
Mn/DOTDesignMethod
AASHTO 1993Method
(50% and 75%Reliability)
MEPDGv1.000 (50%
and 75%Reliability)
1984 PCAMethod*
36 28 55% 55% / -15% -11% / -39% 350%
37 41 -9% -4% / -48% -54% / -71% 2%
38 21 60% 95% / 6% 19% / -19% 385%
39 20 22% 35% / -26% -35% / -60% 385%
40 17 194% 220% / 75% -35% / -76% 286%
AVG 64% 80% / -2% -23% / - 53% 282%
STD DEV 77% 86% / 47% 28% / 24% 161%
Effects of Design and ConstructionVariables on Performance
Many design variables in MnROAD LVRPCC Cells
Panel length, use of dowels, foundation design,thickened edge section
Drawbacks:
No two cells differ by only one variable.
No replicate cells
Limited Inferences!
Effects of Design and ConstructionVariables on Performance
Panel Geometry:
No cracking in cell with shortest panels
Longest panels did not have the most cracking
Transverse cracking associated with utility cuts
Dowels
Highly effective in reducing deflections,increasing LTE
Undoweled pavements had higher deflections,lower LTE, and more seasonal variability inmeasurements.
Effects of Design and ConstructionVariables on Performance
Foundation Design
Thick foundations (and associated drainageimprovements) produced modest performanceimprovements on the LVR.
• This was not true for the mainline pavements, but that’s adifferent presentation!
Design used on Cells 36 and 37 (total pavement thicknessof 2.1m) is probably not cost-effective for LVRapplications.
Data may suggest performance differences for differentin situ foundation support.
Effects of Design and ConstructionVariables on Performance
Thickened Edge:
Not effective on this project (combined with no dowelsand std foundation).
Implications for Design and Construction
Concrete pavements with D < 150mm canprovide good long-term performance, even inthe presence of heavy loads.
The use of contractor incentives should beevaluated as a tool to reduce initial pavementIRI.
Steps should be taken to avoid curl/warp inconcrete pavement construction – especiallyfor thin pavements.

Implications for Design and Construction
Designers should be aware of the apparentaccuracy and precision of current designprocedures for thin concrete pavements.
In this study, the MEPDG at 50% reliabilitypredicted observed and projected IRI trendsmost accurately and precisely.
5-in [125mm] ConcretePavement Study
1993 Construction
1996 Reconstruction2000 Reconstruction
Class 1 Agg Surf
Class 1c Agg Base
PCC Surface
Class 1c Agg Base
Class 2
Agg Shldr
Class 2
Agg Shldr
Class 1 Agg Surf
Cell 32 Profile: Then and Now … MnROAD Cell 32 – 5-inch PCC
Nominally 127mm [5-in] PCC
Behind paver: 121 – 140 mm (avg. 130mm)
Coring: 120 – 150 mm (avg. 140mm)
178mm [7 in] Class 1/1c subbase
Subgrade R = 12 (MR = 28 MPa [4000 psi])
3.0m x 3.7m [10 ft x 12 ft] undoweled panels
127mm [5-in] aggregate shoulders
Hot-poured asphalt joint sealant
Heavy traffic for more than six years:
355-kN [80-kip] vehicles inside lane, 4 days/week
453-kN [102-kip] outside lane 1 day/week
Cell 32 Foundation Aggregate
Sieve Size% Passing
Class 1 Class 1c (special)
19mm [¾ in] 100 100
9.5 mm [3/8 in] 65 – 95 65 – 90
4.75 mm [#4] 40 – 85 40 – 70
2.00 mm [#10] 25 – 70 25 – 50
425mm [#40] 10 – 45 10 – 30
75 mm [#200] 8 – 15 4 – 12
PI 0 – 6 max
CrushingCrushed particles
not allowed.
Concrete Mixture
Coarse Aggregate: 1026 kg/m3 [1735 lb/yd3](3/4-in-plus [19-mm-plus]): 615 lb/yd3 [366 kg/m3](3/4-in-minus [19-mm-minus]): 760 lb/yd3 [452 kg/m3](#7): 360 lb/yd3 [208 kg/m3]
Sand : 817 kg/m3 [1390 lb/yd3]#1: 950 lb/yd3 [565 kg/m3]#2 (“safety grit): 440 lb/yd3 [262 kg/m3]
Type I Cement: 384 lb/yd3 [228 kg/m3]GGBF Slag: 206 lb/yd3 [122 kg/m3]Water: 218 lb/yd3 [130 kg/m3]
w/c = 0.57 ; (w/(c+p)) = 0.37
Water reducer5 oz/100 lb cement (325 ml/100kg cement)

Concrete Mixture Strength
Compressive Strength (f’c):3-day: 14.2 MPa [2057 psi];7-day: 18.8 MPa [2729 psi];28-day: 27.5 MPa [3988 psi];
Flexural Strength (f’r):3-day: 3.0 MPa [441 psi]7-day: 3.9 MPa [564 psi]28-day: 4.9 MPa [714 psi]
Cell 32 Performance to Date
IRI History – Cell 32
0.00
0.50
1.00
1.50
2.00
2.50
3.00
3.50
2000 2001 2002 2003 2004 2005 2006 2007 2008
Date
IRI
(m/k
m)
Cell 32 - 355 kN [80 kips]
Cell 32 - 453 kN [102 kips]
Typical MnDOT Highway Performance ThresholdIRI = 2.16 m/km [138 in/mile]
MnROAD Cell 32 Distresses
No significant distress until 2005…
MnROAD Cell 32 Distresses(as of October-November 2006)
Inside (80-k) Lane:3m [8 ft] of medium-severitylongitudinal cracking in 1panels
No transverse cracking (46panels)
2.5 mm [0.1 in] averagefaulting (Nov 2006)
1 small low-severity joint spall
Outside (102-k) Lane:10m [30 ft] of low- andmedium-severity longitudinalcracking in 3 panels
2 low-severity transversecracks in 46 panels (not yetfull-width)
0.8 mm [0.1 in] averagefaulting (Nov 2006)
1 small low-severity joint spall
….and no rutting or potholes!
How much better with performance-enhancing features
(i.e., stabilized foundation, curb and gutter, drains, small dowels, etc.)???

Cell 32 Faulting History
-0.5
0
0.5
1
1.5
2
2.5
3
3.5
Jul-00 Jul-01 Jul-02 Jul-03 Jul-04 Jul-05 Jul-06 Jul-07
Date
Fau
ltin
g,
mm
355-kN [80-kip] Lane, 0.3-m [1-ft] offset
453-kN [102-kip] Lane, 0.3-m [1-ft] offset
25.4 mm = 1 in
Cell 32 Maintenance
None
(through 2006).
Relating Cell 32 to “The Real World”
Vehicles per DayTime to 170,000ESALs, years
School Bus Transit Bus Garbage Truck Tractor Semi-TrailerOther Heavy
Trucks
Typ.Max.Load
Typ.Load
ResidentialStreet
4 per day, 5days per wk
0 2 per week 1 per week 1 per week 50.9 123.0
Collector8 per day, 5days/week
0 4 per week 2 per week 25 per day 6.7 16.7
Arterial20 per day. 5days/week
20/day, 7days/week
4 per day 50 per day 100 per day 0.8 1.8
County Road4 per day, 5days per wk
0 0 100 per day 300 per day 0.5 1.2
Validation of LVR Design Procedures
1993 AASHTO LVR Design for 50k-300k ESALs:
Doweled joints, 150mm [6-in] subbase, f’r = 4.1MPa[600 psi], plus …
• 50% Reliability: 130mm [5 in] PCC
• 75% Reliability: 130 – 150 mm [5 – 6 in] PCC
Cell 32:
Undoweled, 180mm [7-in] subbase, f’r = 4.9MPa [720psi], 170k ESALs to date, little distress, acceptable IRIfor LVR
Validation of LVR Design Procedures
Cell 32 may show 1993 AASHTO LVR Design tobe conservative
Important, however, to remember “acceleratedloading” nature of MnROAD LVR …
Reduced opportunity for environmental effects andinteraction
Validation of LVR Design Procedures
PCA Simplified Design Procedure:
Developed for local roads where axle load dataunavailable
Fatigue consumption and erosion criteria
Assumes f’r = 4.5MPa [650 psi], medium subbasesupport, no dowels, no shoulder or curb, 20 years
• 125 – 140 mm [5.0 – 5.5 in] PCC for residential applicationsand 3k – 55k heavy trucks
• 150 mm [6 in] PCC for collector/rural road applications andup 15k heavy trucks

Validation of LVR Design Procedures
Cell 32:
355-kN [80-kip] lane has carried more than 46k heavy truckswithout significant distress or sign of failure.
• Exceeds PCA expectations for 125-mm [5-in] residentialpavement [5840 trucks over 20 years]
• Exceeds PCA expectations for 150-mm [6-in] collector/ruralpavement [<30000 trucks over 20 years]
Cell 32 appears to show PCA Simplified Design to beconservative
Must consider accelerated nature of MnROAD LVR test and“built-in” reliability of PCA Simplified Design
MnROAD (125mm [5-in]) PCC - What have we learned?
Thin (125-mm [5-in]) PCC pavements can bebuilt successfully on lower volume roads, evenwhen some heavy loads are expected.
Quality of materials and construction must begood.
Short panels may be key to good performance.
Generally accepted concrete pavement designprocedures may significantly underestimateperformance life (or overestimate requiredthickness) for thinner concrete pavements.
MnROAD (125mm [5-in]) PCC - What have we learned?
Many thin concrete pavements (e.g., 125 –150mm) were built on residential streets and otherlower-volume roads throughout the U.S. in the1940s, 50s and 60s and are still in service today.
Minor design enhancements (e.g., small dowels,edge support) may further improve performanceof thinner concrete pavements.
MnROAD (125mm [5-in]) PCC:What have we learned?
5 inches ofconcrete road …
… carries the load!
Whitetopping Design,Construction,
Performance andRehabilitation
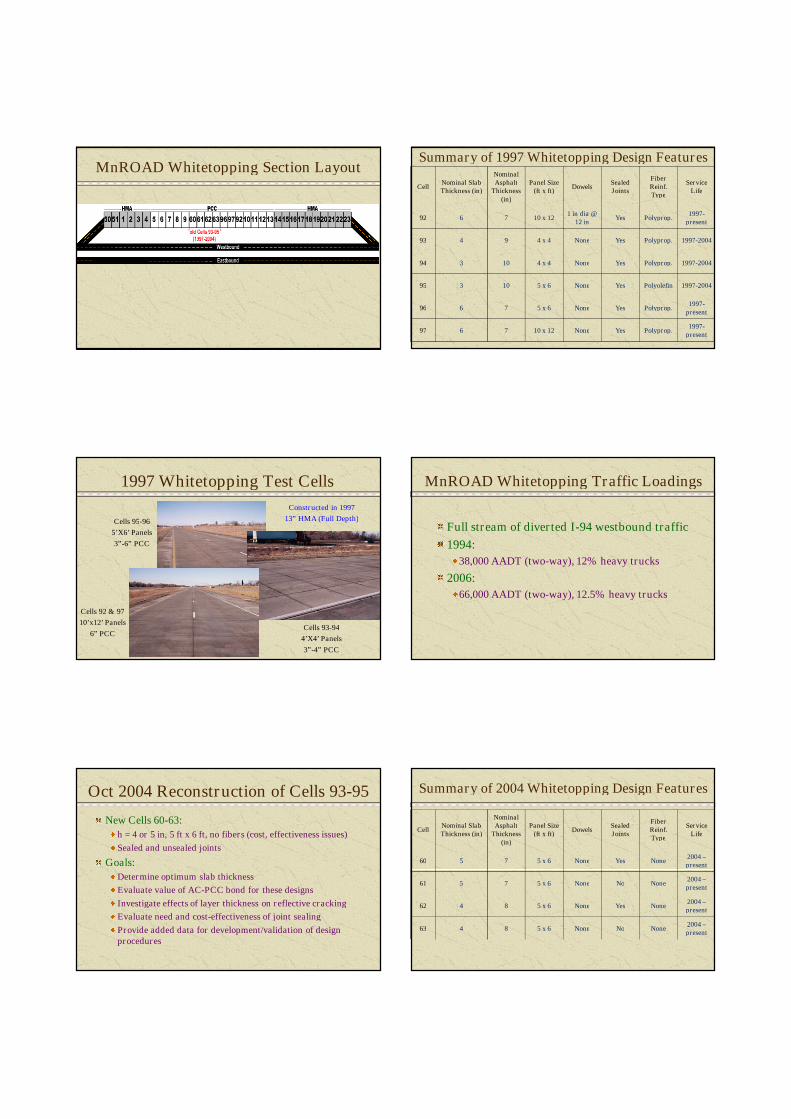
MnROAD Whitetopping Section LayoutSummary of 1997 Whitetopping Design Features
CellNominal SlabThickness (in)
NominalAsphalt
Thickness(in)
Panel Size(ft x ft)
DowelsSealedJoints
FiberReinf.Type
ServiceLife
92 6 7 10 x 121 in dia @
12 inYes Polyprop.
1997-present
93 4 9 4 x 4 None Yes Polyprop. 1997-2004
94 3 10 4 x 4 None Yes Polyprop. 1997-2004
95 3 10 5 x 6 None Yes Polyolefin 1997-2004
96 6 7 5 x 6 None Yes Polyprop.1997-
present
97 6 7 10 x 12 None Yes Polyprop.1997-
present
1997 Whitetopping Test Cells
Cells 95-96
5’X6’ Panels
3”-6” PCC
Cells 92 & 97
10’x12’ Panels
6” PCCCells 93-94
4’X4’ Panels
3”-4” PCC
Constructed in 1997
13” HMA (Full Depth)
MnROAD Whitetopping Traffic Loadings
Full stream of diverted I-94 westbound traffic
1994:
38,000 AADT (two-way), 12% heavy trucks
2006:
66,000 AADT (two-way), 12.5% heavy trucks
Oct 2004 Reconstruction of Cells 93-95
New Cells 60-63:
h = 4 or 5 in, 5 ft x 6 ft, no fibers (cost, effectiveness issues)
Sealed and unsealed joints
Goals:
Determine optimum slab thickness
Evaluate value of AC-PCC bond for these designs
Investigate effects of layer thickness on reflective cracking
Evaluate need and cost-effectiveness of joint sealing
Provide added data for development/validation of designprocedures
Summary of 2004 Whitetopping Design Features
CellNominal SlabThickness (in)
NominalAsphalt
Thickness(in)
Panel Size(ft x ft)
DowelsSealedJoints
FiberReinf.Type
ServiceLife
60 5 7 5 x 6 None Yes None2004 –present
61 5 7 5 x 6 None No None2004 –present
62 4 8 5 x 6 None Yes None2004 –present
63 4 8 5 x 6 None No None2004 –present

Concrete Mixture DetailsCells 92-94, 96-97 Cell 95 Cells 60-63
Water/Cementitious Ratio 0.38 0.41 0.40
Cement, lb/yd3 (kg/m3) 650 (386) 650 (386) 400 (238)
Class C Fly Ash, lb/yd3 (kg/m3) 0 0 170 (101)
Fine Aggregate, lb/yd3 (kg/m3) 1187 (704) 1287 (764) 1206 (716)
CA (1.5-in minus), lb/yd3 (kg/m3) 0 0 1059 (629)
CA (3/4-in minus), lb/yd3 (kg/m3) 1600 (949) 1500 (890) 866 (514)
CA (3/8-in minus), lb/yd3 (kg/m3) 277 (164) 277 (164) 0
Fiber Content, lb/yd3 (kg/m3),% Vol (measured from samples
3 (2), 0.059% 25 (15), 0.53% 0, 0%
Admixtures, oz/100lb CM(ml/100kg CM)
Conchem AirPolyheed N
Conchem AirPolyheed N
KB-1000, 34.0(22.1)
VR, 11.5 (7.5)
Measured Air, percent 5.75 7.2 7.6
Measured Slump, in (mm) 2.5 (65) 2 (50) 1.5 (38)
28-day Compressive Strength, psi(MPa)
6100 (42.1) 5300 (36.5) 4085 (28.1)
MnROAD Whitetopping Traffic Loadings
Cells 92, 96-97(1997 - 2007)
Cells 93-95(1997 – 2004)
Cells 60 -63(1997 - 2007)
Passing Lane 2.8 1.6 0.6
Driving Lane 11.7 6.4 2.8
Time to 2.8M ESALs, yrs Time to 6.4M ESALs, yrs Time to 11.7M ESALs, yrs
Typ MaxLoad
Typ WorkingLoad
Typ MaxLoad
Typ WorkingLoad
Typ MaxLoad
Typ WorkingLoad
ResidentialStreet
>50 >50 >50 >50 >50 >50
Collector >50 >50 >50 >50 >50 >50
Arterial 13 30 29 >50 >50 >50
CountyRoad
7 19 17 44 31 >50
1997 Whitetopping IRI Histories
0.00
50.00
100.00
150.00
200.00
250.00
1997 1998 1999 2000 2001 2002 2003 2004 2005 2006 2007
Date
IRI
(in
/mile)
Cell 92, Driving Lane
Cell 93, Driving Lane
Cell 94, Driving Lane
Cell 95, Driving Lane
Cell 96, Driving Lane
Cell 97, Driving Lane
Typical MnDOT Performance
Threshold IRI = 138 in/mile
1997 Whitetopping IRI Histories
Initial IRI is good
Increases generallyproportional to PCC thicknessand traffic
Exceptions for Cells 95 and 93due to joint placement
Cells 92 and 96 still good
Use of dowels (92) andsmaller panels (96) to reducecurl/warp
IRI irregularities due to repairs
0.00
50.00
100.00
150.00
200.00
250.00
1997 1998 1999 2000 2001 2002 2003 2004 2005 2006 2007
Date
IRI(i
n/m
ile)
Cell 92, Driving Lane
Cell 93, Driving Lane
Cell 94, Driving Lane
Cell 95, Driving Lane
Cell 96, Driving Lane
Cell 97, Driving Lane
Typical MnDOT PerformanceThreshold IRI = 138 in/mile
2004 Whitetopping IRI Histories
0.00
50.00
100.00
150.00
200.00
250.00
2004 2005 2006 2007
Date
IRI
(in
/mil
e)
Cell 60, Driving Lane
Cell 61, Driving Lane
Cell 62, Driving Lane
Cell 64, Driving LaneTypical MnDOT Performance
Threshold IRI = 138 in/mile
Development and Measurement ofPavement Distress
Measured 4-6x annually using LTPP protocol
First cracks observed in June 1998 (cells 93-95) – mostlycorner breaks
Some transverse cracking in Jan 1999 (-40F!)
Greatest amount in cell 94 (3-in PCC, 4-ft panels)
>70% of early cracking was reflective of AC cracks
No cracking in 6-in slabs until 2001 (4 years, 3M ESALs)

Cell 93 Crack Development History
Source: Vandenbossche and Fagerness, 2002
Cell 94 Crack Development History
Source: Vandenbossche and Fagerness, 2002
Cell 95 Crack Development History
Source: Vandenbossche and Fagerness, 2002
Whitetopping Distress
Transverse Cracking
Corner Breaks andTransverse Cracking
Corner Breaks
Source: Vandenbossche and Fagerness, 2002
Source: Burnham, 2005
Cell 93 Reflection Crack, April 2001
Source: Vandenbossche and Fagerness, 2002
Source: Burnham, 2005
Cell 95, November 2003

Cell 94, November 2003
Source: Burnham, 2005
Cell 94, September 2004
Source: Burnham, 2005
2004 Cracking Summary
Source: Burnham, 2005
Oct 2006 Distress Summary forSurviving 1997 Cells
Oct 2006 Distress Summary forSurviving 2004 Cells Distress Observations/Lessons
Joint location influences cracking
Longitudinal placement w.r.t. wheel paths
Transverse placement w.r.t. asphalt cracks
3-in 5x6 panels outperformed 4-in 4x4 panels
Panel size influences cracking
3-in 10x12 panels have much more cracking than 3-in5 x 6 panels
No significant impact to date from dowels
Too early to comment on effect of joint sealing

Interlayer Bonding Studies:3 Modes of Debonding
Source: Vandenbossche, 2005
Each mode reduces slab support and increases PCC stresses. Source: Burnham, 2005
Evidence of bonding/debonding
Source: Burnham, 2005
Results of Forensic Work
Debonding alwaysoccurred at slab edgesor cracks (availablewater)
Causes of debonding:
Stripping
Freeze-thaw
Debonding led tocracking
Concrete Strain Measurements(9000-lb FWD, Cell 95
Source: Vandenbossche, 2005
Illustrates importance of considering seasonal effects in predicting performance life.
Reflection Cracking
Development = f(relative stiffnesses of AC andPCC layers, accumulated traffic loads)
Reflection cracking is most likely when DAC > DPCC
Example 1:• EPCC = 4.0 x 10⁶ psi, EAC = 4.0 x 10⁵ psi, μPCC = 0.15, μAC = 0.35
• Reflection cracking likely when hAC > 2hPCC
Example 2:• EPCC = 4.0 x 10⁶ psi, EAC = 1.5 x 10⁵ psi, μPCC = 0.15, μAC = 0.35
• Reflection cracking likely when hAC > 1.15hPCC
D = Eh3/12(1-μ)2
Source: Vandenbossche, 2005
Pre-overlay Preparation to MinimizeReflective Cracking
When feasible, place whitetopping jointsdirectly over asphalt cracks.
Alternative: prevent AC/PCC bond in vicinityof crack (reduce concentration of stress)
Asphalt-impregnated roofing paper, duct tape,fabric, silica sand, etc.

Use of fabric or “tar paper” to prevent
reflection cracking
Saw cut of longitudinal joint to prevent
bond and corner cracking due to
mismatched transverse joints.
Use of Fiber Reinforcing
Purposes:
Strengthen concrete
Reduce shrinkage cracks
Reinforce across cracks
No apparent effect ondevelopment ofcracking
Polyolefin fibers bridgedcracks
No significant benefitfrom polypropylenefibers
Source: Burnham, 2005
Rehabilitation of Whitetopping – Best Practices
Best practices (Vandenbossche, 2005)
Core to assess asphalt deterioration
AC removal to 1” below lift interface using millingmachines (opt. saw cuts) plus light jackhammers
Bondbreaker material over AC cracks
Prevent moisture loss at AC, surface
Saw joints to T/2 ASAP; saw longitudinal jointbetween mismatched transverse joints
What have we learned?- Project Selection
Good performance of thin (3 – 6 in) PCCunder years of heavy traffic is due in part togood support
All MnROAD whitetopping cells constructed overat least 7 in of good AC
Recommendations:
Minimum 3 inches sound AC after milling
Core to insure AC quality
What have we learned?- Design and Construction
Avoid placing longitudinal joints near wheel paths
Avoid reflection cracking
Consider relative stiffnesses of AC and PCC layers
Provide local debonding at AC/PCC interface nearcracks
Largest temperature gradients in thinnest PCC
Use small panels to minimize curl/warp, debonding
Polyolefin fibers provided benefit, polypropylene didn’t
Long-term benefits of joint sealing not yet determined
What have we learned?- Behavior
Load-related strains are strongly affected byseasonal variations AC modulus
Consequences of predicting life in variousclimates and environments

What have we learned?- Performance
Performance of any thickness = f(traffic volume, wheelplacement, layer bonding)
Rate of reflective cracking = f(traffic volume)
Bonding is essential for PCC < 4 in thick
After debonding, top-down cracking starts atapproach corner
Reflective cracking common for PCC < 5 in thick whenbonded to AC > 6 in thick
All test cells performed well for at least 7 years underheavy traffic (corresponding to > 50 years of typicaltraffic on lower volume roads)
What have we learned?- Maintenance and Rehab
Whitetopping panel replacement is relativelysimple.
Recommended best practices focus on:
achieving good bond,
avoiding reflective cracking,
providing good curing
Thank you foryour time and attention!