Embed Size (px)
Citation preview
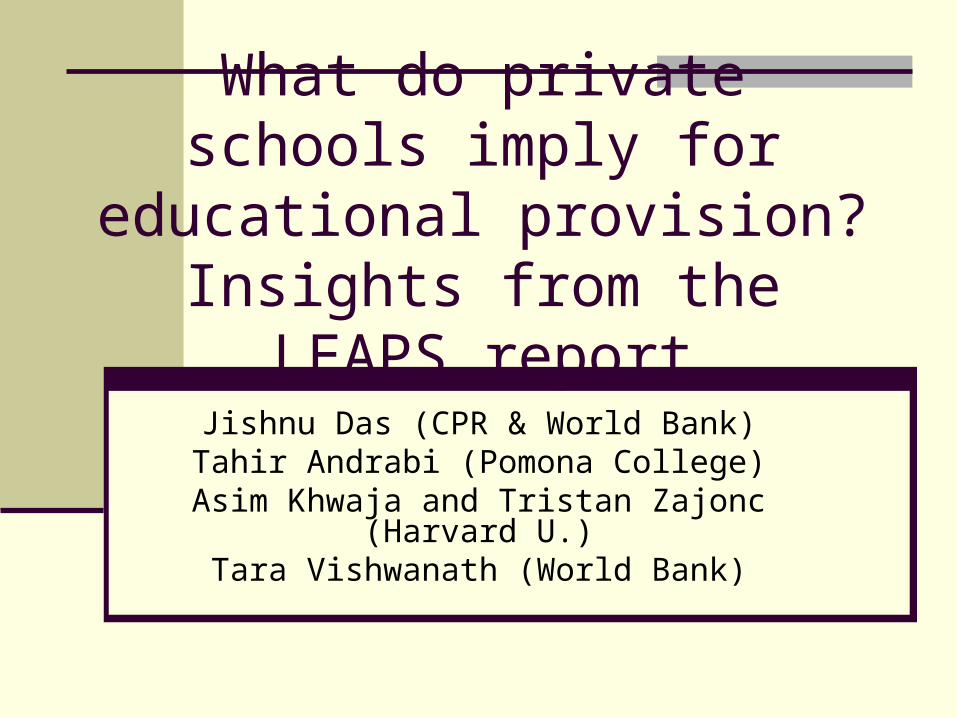
What do private schools imply for educational provision?
Insights from the LEAPS report
Jishnu Das (CPR & World Bank)Tahir Andrabi (Pomona College)
Asim Khwaja and Tristan Zajonc (Harvard U.)Tara Vishwanath (World Bank)
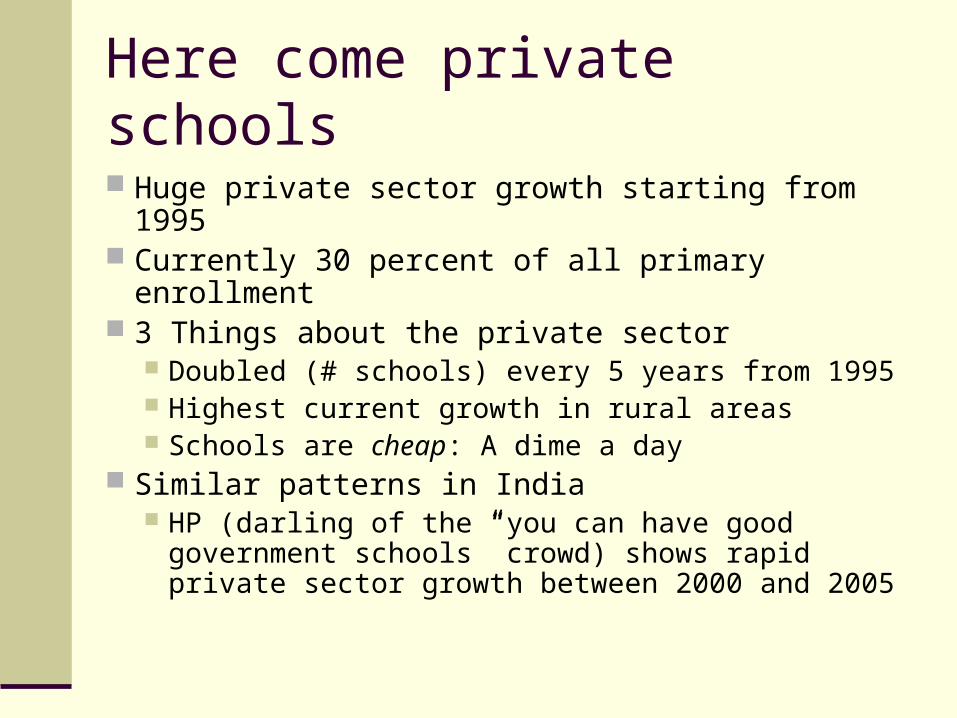
Here come private schools
Huge private sector growth starting from 1995 Currently 30 percent of all primary enrollment 3 Things about the private sector
Doubled (# schools) every 5 years from 1995 Highest current growth in rural areas Schools are cheap: A dime a day
Similar patterns in India HP (darling of the “you can have good
government schools” crowd) shows rapid private sector growth between 2000 and 2005
Question: What should policy look like in this new environment? Two issues discussed here
The grounds for regulation and certification Arguments for and against “money following
the child” (voucher schemes) (Not surprisingly, the two are related)
DATA: Pakistan LEAPS study. Multi-year study of 24,000 children over 4 years in 800 public and private schools with lots of data
LEAPS report uses only 1st year of data
Regulation and Certification
The arguments for regulation and certification “Parents cannot tell what schools are good
and what are bad: private schools are fleecing parents”
“A minimal quality standard is required since parents may not care about their children’s education”
“Private Schools earn excessive profits in a monopolistic environment”
NONE of these are true in the data
& what you need for vouchers
Parents are informed Parents care about what governments care
about The supply curve of private schools is
sufficiently elastic
#1 is probably not a problem, #2 and #3 are
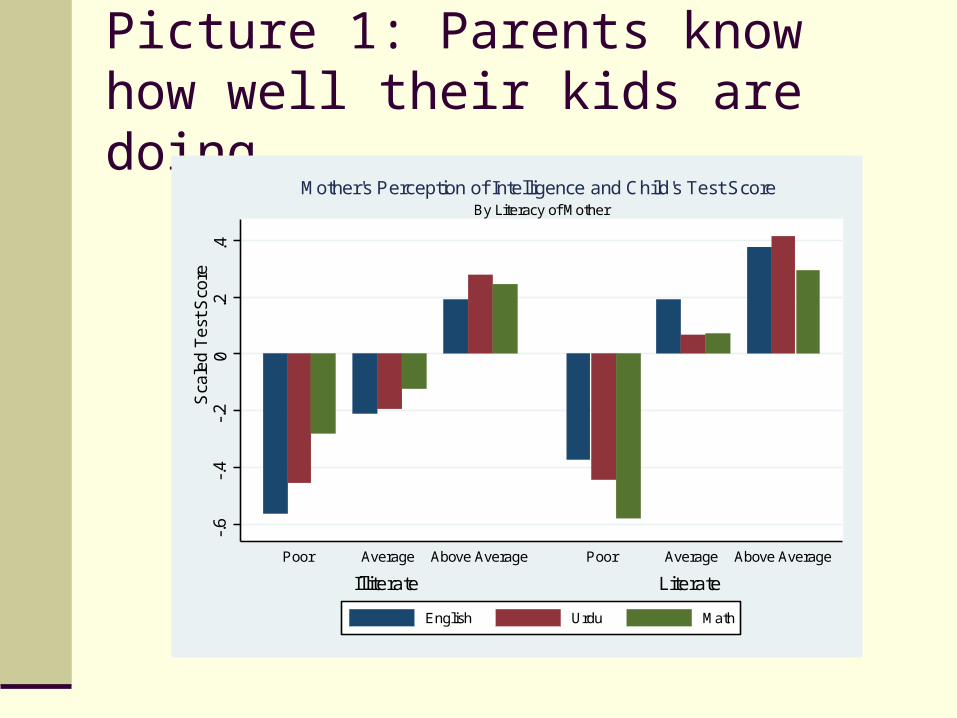
Picture 1: Parents know how well their kids are doing
-.6
-.4
-.2
0.2
.4S
cale
d T
est S
core
Illiterate Literate
Poor Average Above Average Poor Average Above Average
By Literacy of Mother
Mother's Perception of Intelligence and Child's Test Score
English Urdu Math
-.6
-.4
-.2
0.2
.4S
cale
d T
est S
core
Illiterate Literate
Poor Average Above Average Poor Average Above Average
By Literacy of Mother
Mother's Perception of Intelligence and Child's Test Score
English Urdu Math
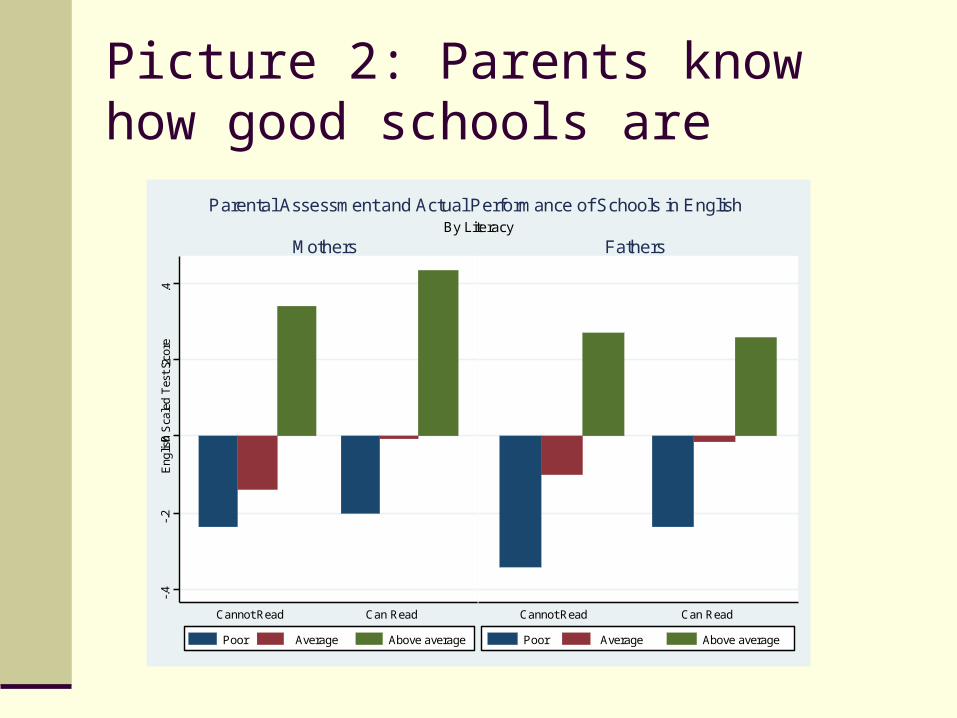
Picture 2: Parents know how good schools are
-.4
-.2
0.2
.4E
nglis
h S
cale
d T
est
Sco
re
Cannot Read Can Read
Mothers
Poor Average Above average
Cannot Read Can Read
Fathers
Poor Average Above average
By Literacy
Parental Assessment and Actual Performance of Schools in English
-.4
-.2
0.2
.4E
nglis
h S
cale
d T
est
Sco
re
Cannot Read Can Read
Mothers
Poor Average Above average
Cannot Read Can Read
Fathers
Poor Average Above average
By Literacy
Parental Assessment and Actual Performance of Schools in English
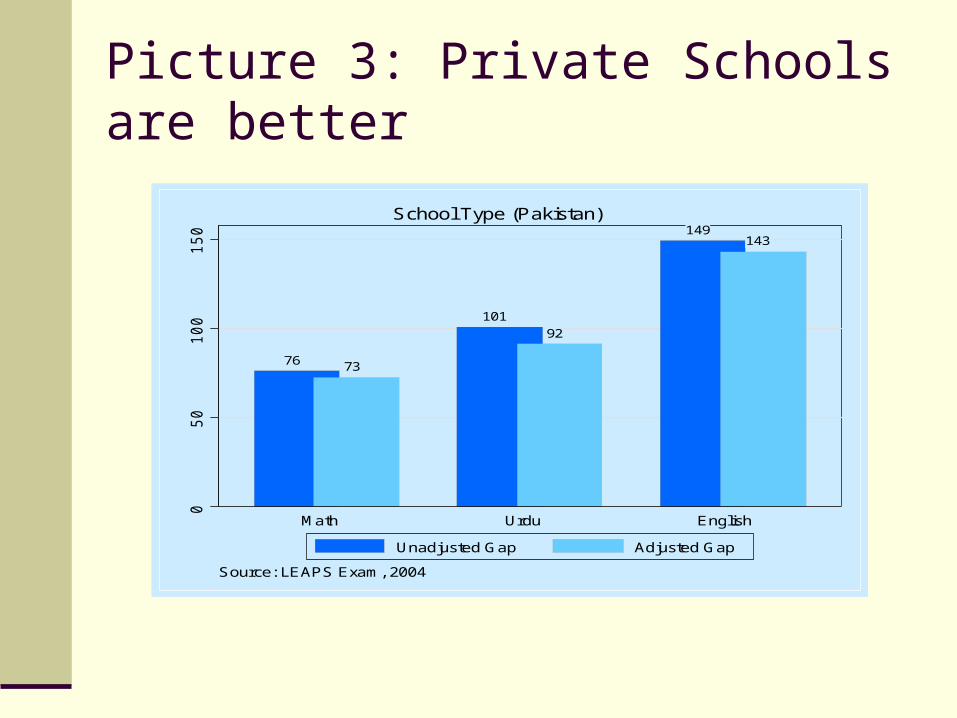
Picture 3: Private Schools are better
76 73
101
92
149143
05
01
00
15
0
Math Urdu English
Source: LEAPS Exam, 2004
School Type (Pakistan)
Unadjusted Gap Adjusted Gap
76 73
101
92
149143
05
01
00
15
0
Math Urdu English
Source: LEAPS Exam, 2004
School Type (Pakistan)
Unadjusted Gap Adjusted Gap
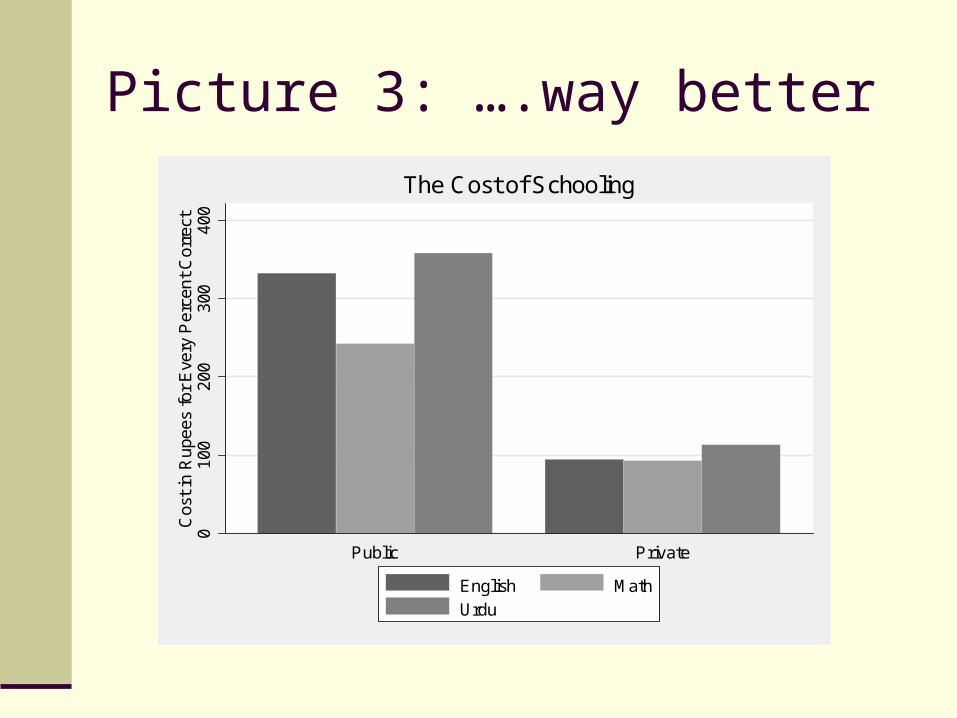
Picture 3: ….way better
010
020
030
040
0C
ost
in R
upee
s fo
r E
very
Per
cen
t C
orre
ct
Public Private
The Cost of Schooling
English MathUrdu
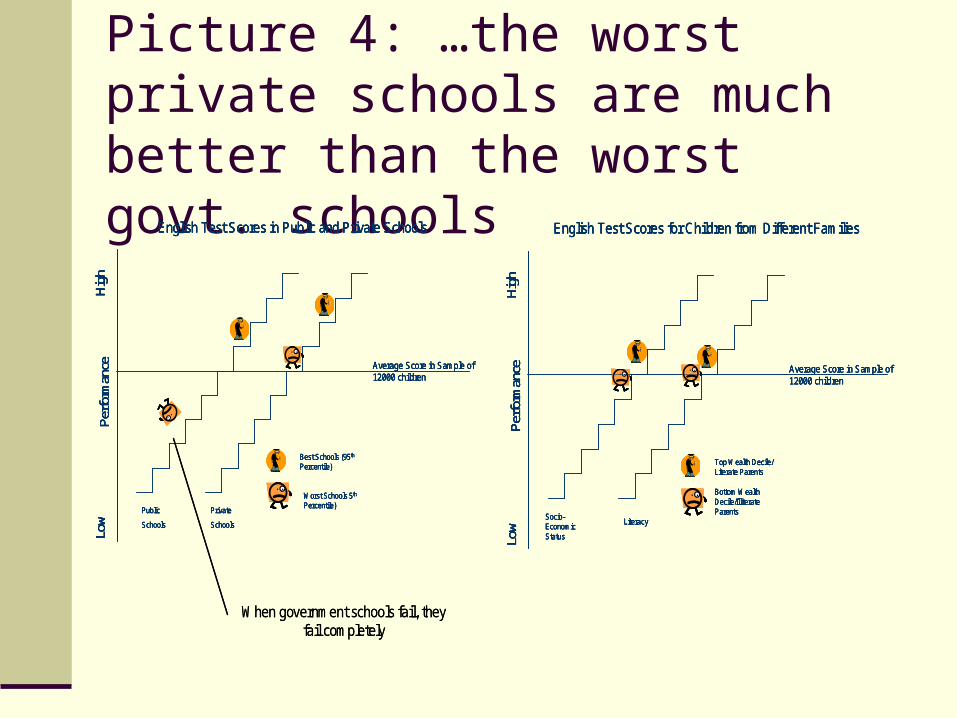
Picture 4: …the worst private schools are much better than the worst govt. schools
Public
Schools
Private
Schools
Hig
h
English Test Scores in Public and Private Schools
Best Schools (95th
Percentile)
Worst Schools 5th
Percentile)
Perfo
rman
ceLo
w
Average Score in Sample of 12000 children
Public
Schools
Private
Schools
Hig
h
English Test Scores in Public and Private Schools
Best Schools (95th
Percentile)
Worst Schools 5th
Percentile)
Perfo
rman
ceLo
w
Average Score in Sample of 12000 children
Socio-Economic Status
LiteracyH
igh
English Test Scores for Children from Different Families
Top Wealth Decile/ Literate Parents
Bottom Wealth Decile/Illiterate Parents
Perfo
rman
ceLo
w
Average Score in Sample of 12000 children
Socio-Economic Status
LiteracyH
igh
English Test Scores for Children from Different Families
Top Wealth Decile/ Literate Parents
Bottom Wealth Decile/Illiterate Parents
Perfo
rman
ceLo
w
Average Score in Sample of 12000 children
When government schools fail, they fail completely
Public
Schools
Private
Schools
Hig
h
English Test Scores in Public and Private Schools
Best Schools (95th
Percentile)
Worst Schools 5th
Percentile)
Perfo
rman
ceLo
w
Average Score in Sample of 12000 children
Public
Schools
Private
Schools
Hig
h
English Test Scores in Public and Private Schools
Best Schools (95th
Percentile)
Worst Schools 5th
Percentile)
Perfo
rman
ceLo
w
Average Score in Sample of 12000 children
Socio-Economic Status
LiteracyH
igh
English Test Scores for Children from Different Families
Top Wealth Decile/ Literate Parents
Bottom Wealth Decile/Illiterate Parents
Perfo
rman
ceLo
w
Average Score in Sample of 12000 children
Socio-Economic Status
LiteracyH
igh
English Test Scores for Children from Different Families
Top Wealth Decile/ Literate Parents
Bottom Wealth Decile/Illiterate Parents
Perfo
rman
ceLo
w
Average Score in Sample of 12000 children
When government schools fail, they fail completely
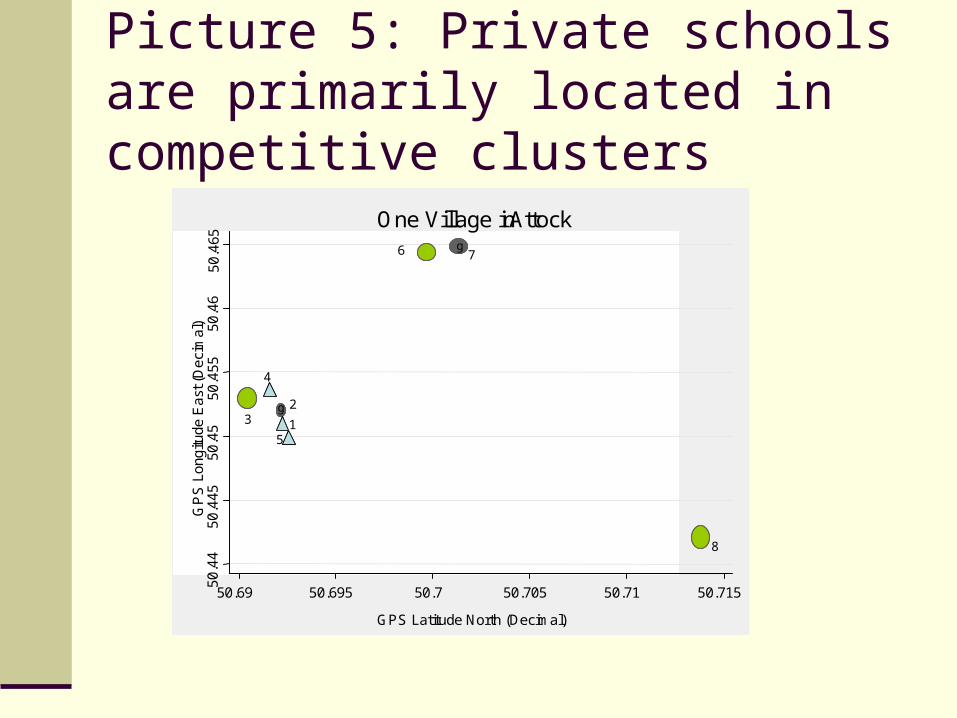
Picture 5: Private schools are primarily located in competitive clusters
1
23
4
5
11
13 21
50.4
450
.445
50.4
550
.455
50.4
650
.465
GP
S L
ong
itude
Eas
t (D
ecim
al)
50.69 50.695 50.7 50.705 50.71 50.715
GPS Latitude North (Decimal)
One Village in Attock
g
g
1
23
4
5
8
6 7
50.4
450
.445
50.4
550
.455
50.4
650
.465
GP
S L
ong
itude
Eas
t (D
ecim
al)
50.69 50.695 50.7 50.705 50.71 50.715
GPS Latitude North (Decimal)
One Village in Attock
g
g
1
23
4
5
11
13 21
50.4
450
.445
50.4
550
.455
50.4
650
.465
GP
S L
ong
itude
Eas
t (D
ecim
al)
50.69 50.695 50.7 50.705 50.71 50.715
GPS Latitude North (Decimal)
One Village in Attock
g
g
1
23
4
5
8
6 7
50.4
450
.445
50.4
550
.455
50.4
650
.465
GP
S L
ong
itude
Eas
t (D
ecim
al)
50.69 50.695 50.7 50.705 50.71 50.715
GPS Latitude North (Decimal)
One Village in Attock
g
g
So, profits are low. The median profit in a private school is the annual wage of a male teacher—this is the opportunity cost for the principal of the school
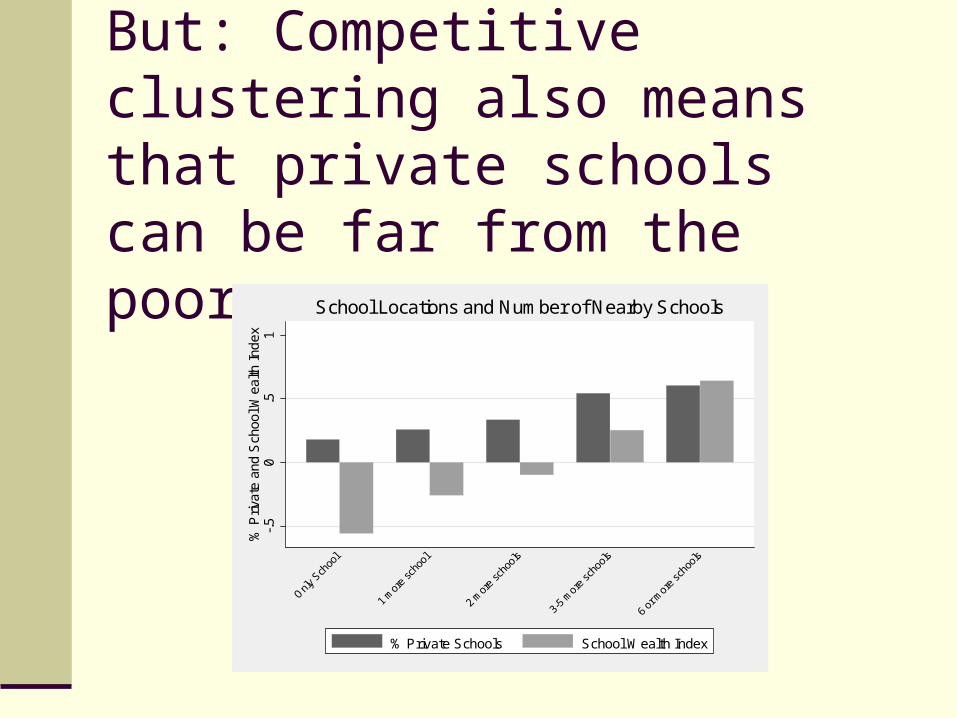
But: Competitive clustering also means that private schools can be far from the poor
-.5
0.5
1%
Priv
ate
and
Sch
ool W
ealth
Ind
ex
School Locations and Number of Nearby Schools
% Private Schools School Wealth Index
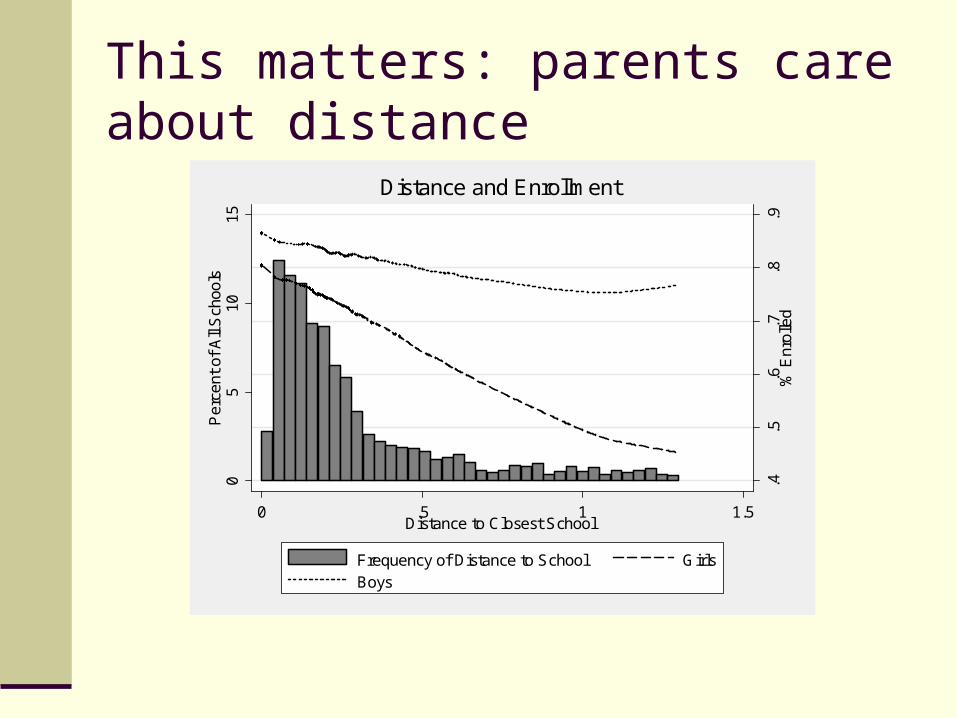
This matters: parents care about distance
.4.5
.6.7
.8.9
% E
nrol
led
05
1015
Per
cent
of
All
Sch
ools
0 .5 1 1.5Distance to Closest School
Frequency of Distance to School GirlsBoys
Distance and Enrollment
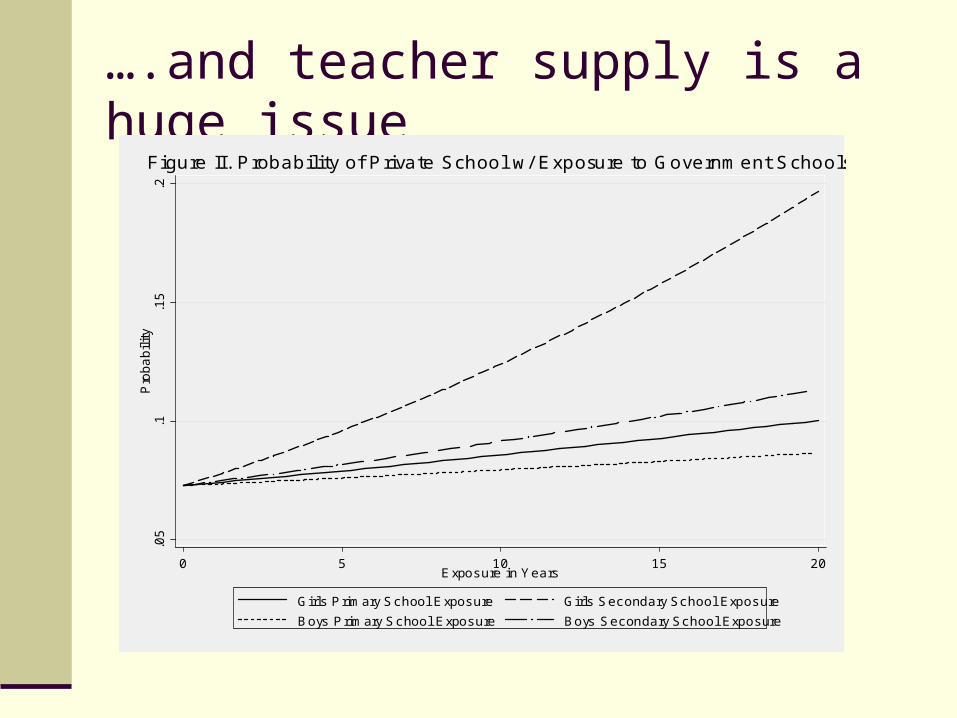
….and teacher supply is a huge issue.0
5.1
.15
.2P
rob
ab
ilit
y
0 5 10 15 20Exposure in Years
Girls Primary School Exposure Girls Secondary School Exposure
Boys Primary School Exposure Boys Secondary School Exposure
Figure II. Probabil i ty of Private School w/ Exposure to Governm ent Schools
Concluding thoughts
Find little evidence for regulating private schools
But are cautiously optimistic about vouchers… New schools will need to set up in poor areas Which may be an issue given teacher supply
constraints
A longer term plan
Vouchers, but transitioning (and perhaps permanent govt. schools)
By the way…
What should we do about those govt. schools?
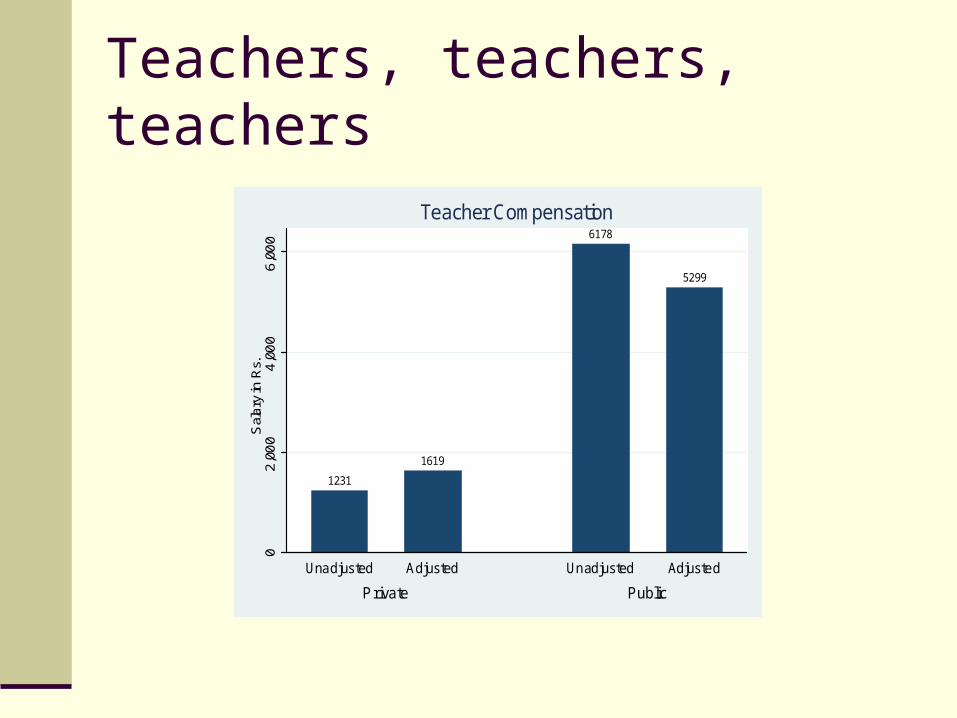
Teachers, teachers, teachers
1231
1619
6178
52990
2,0
00
4,0
00
6,0
00
Sal
ary
in R
s.
Private Public
Unadjusted Adjusted Unadjusted Adjusted
Teacher Compensation
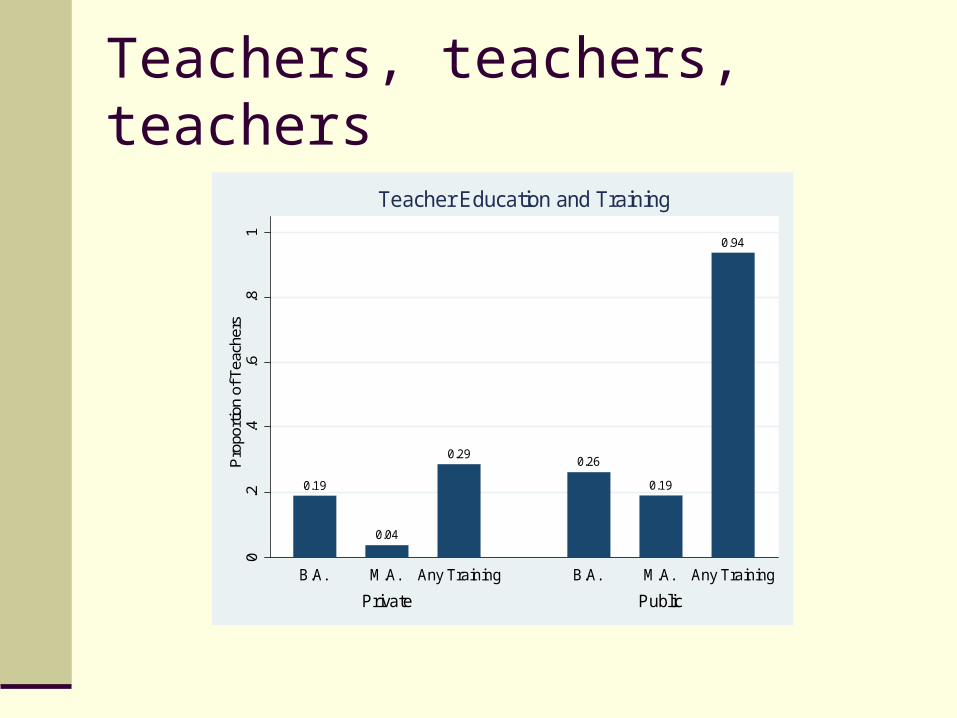
Teachers, teachers, teachers
0.19
0.04
0.290.26
0.19
0.940
.2.4
.6.8
1P
ropo
rtion
of T
each
ers
Private Public
B.A. M.A. Any Training B.A. M.A. Any Training
Teacher Education and Training
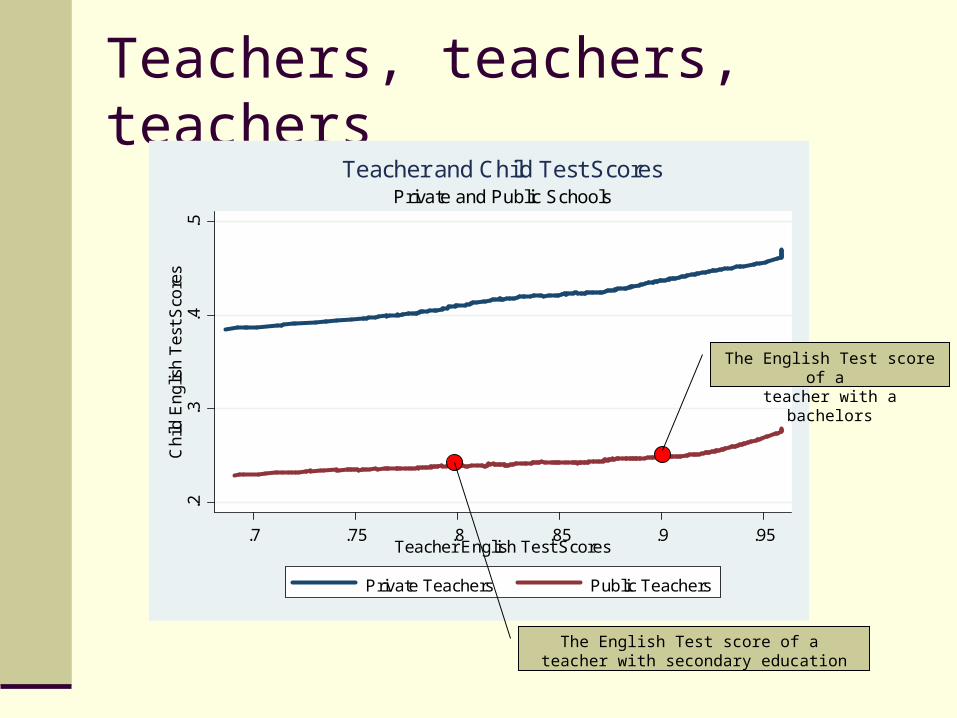
Teachers, teachers, teachers
.2.3
.4.5
Chi
ld E
ngl
ish
Tes
t Sco
res
.7 .75 .8 .85 .9 .95Teacher English Test Scores
Private Teachers Public Teachers
Private and Public SchoolsTeacher and Child Test Scores
The English Test score of a teacher with secondary education
The English Test score of a teacher with a bachelors
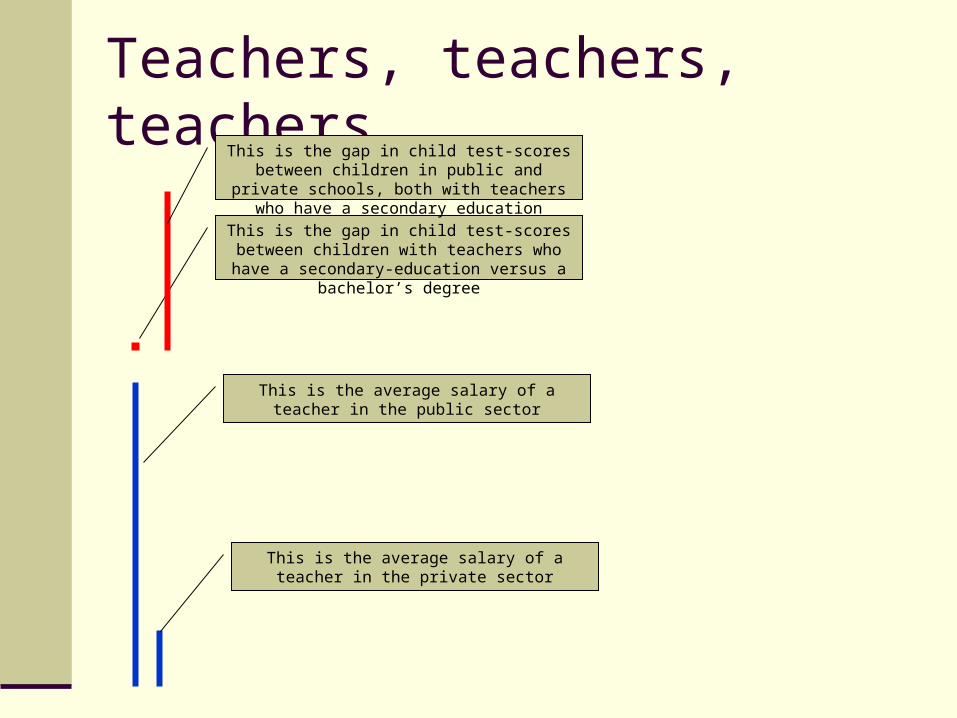
Teachers, teachers, teachers
This is the gap in child test-scores between children with teachers who have a secondary-
education versus a bachelor’s degree
This is the gap in child test-scores between children in public and private schools, both with
teachers who have a secondary education
This is the average salary of a teacher in the public sector
This is the average salary of a teacher in the private sector
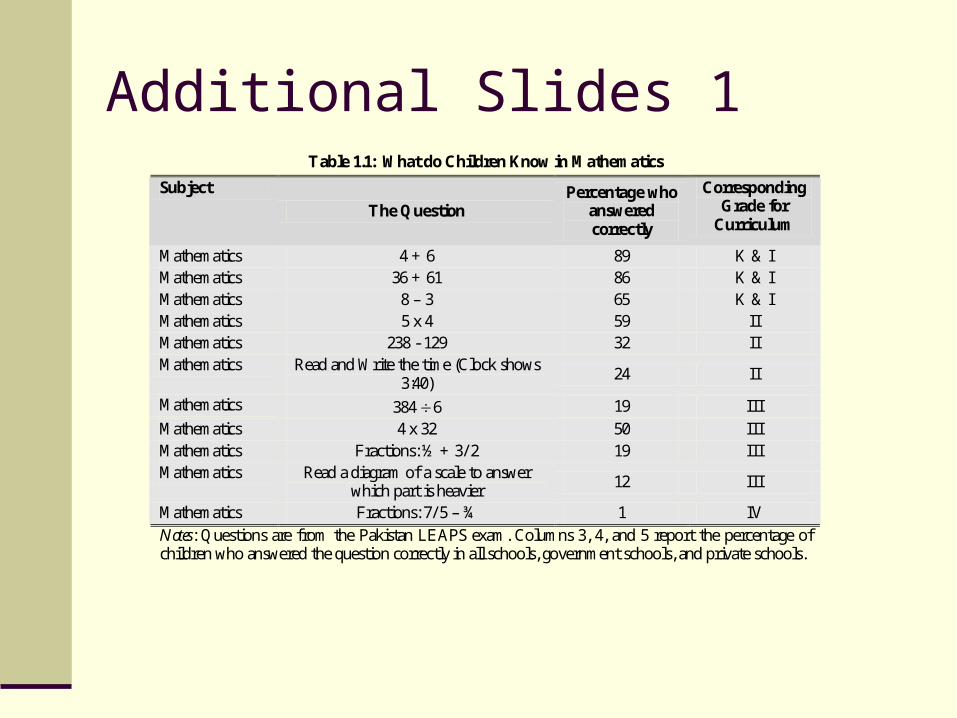
Additional Slides 1Table 1.1: What do Children Know in Mathematics
Subject The Question
Percentage who answered correctly
Corresponding Grade for
Curriculum
Mathematics 4 + 6 89 K & I Mathematics 36 + 61 86 K & I Mathematics 8 – 3 65 K & I Mathematics 5 x 4 59 II Mathematics 238 - 129 32 II Mathematics Read and Write the time (Clock shows
3:40) 24 II
Mathematics 384 6 19 III Mathematics 4 x 32 50 III Mathematics Fractions: ½ + 3/ 2 19 III Mathematics Read a diagram of a scale to answer
which part is heavier 12 III
Mathematics Fractions: 7/ 5 – ¾ 1 IV Notes: Questions are from the Pakistan LEAPS exam. Columns 3, 4, and 5 report the percentage of children who answered the question correctly in all schools, government schools, and private schools.
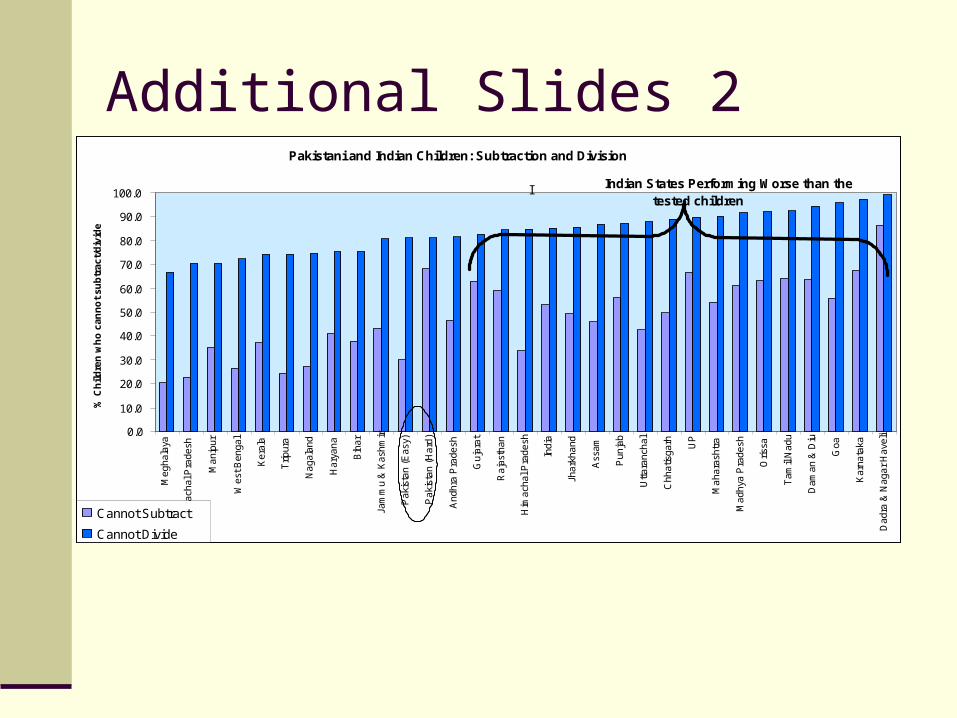
Additional Slides 2Pakistani and Indian Children: Subtraction and Division
0.0
10.0
20.0
30.0
40.0
50.0
60.0
70.0
80.0
90.0
100.0
Me
ghal
aya
Aru
nach
al P
rade
sh
Ma
nipu
r
Wes
t Ben
gal
Ker
ala
Trip
ura
Nag
alan
d
Ha
ryan
a
Bih
ar
Jam
mu
& K
ashm
ir
Pa
kist
an (
Eas
y)
Pa
kist
an (
Ha
rd)
An
dhra
Pra
desh
Guj
ara
t
Ra
jast
han
Him
acha
l Pra
des
h
Ind
ia
Jha
rkha
nd
Ass
am
Pu
njab
Utt
ara
ncha
l
Ch
hatis
garh UP
Ma
hara
shtr
a
Ma
dhya
Pra
desh
Ori
ssa
Tam
il N
adu
Dam
an
& D
iu
Goa
Ka
rna
taka
Dad
ra &
Nag
ar
Hav
eli
% C
hil
dre
n w
ho
can
no
t su
btr
act/
div
ide
Cannot Subtract
Cannot Divide
I Indian States Performing Worse than the tested children
Pakistani and Indian Children: Subtraction and Division
0.0
10.0
20.0
30.0
40.0
50.0
60.0
70.0
80.0
90.0
100.0
Me
ghal
aya
Aru
nach
al P
rade
sh
Ma
nipu
r
Wes
t Ben
gal
Ker
ala
Pakistani and Indian Children: Subtraction and Division
0.0
10.0
20.0
30.0
40.0
50.0
60.0
70.0
80.0
90.0
100.0
Me
ghal
aya
Aru
nach
al P
rade
sh
Ma
nipu
r
Wes
t Ben
gal
Ker
ala
Trip
ura
Nag
alan
d
Ha
ryan
a
Bih
ar
Jam
mu
& K
ashm
ir
Pa
kist
an (
Eas
y)
Pa
kist
an (
Ha
rd)
An
dhra
Pra
desh
Guj
ara
t
Ra
jast
han
Him
acha
l Pra
des
h
Ind
ia
Jha
rkha
nd
Ass
am
Pu
njab
Utt
ara
ncha
l
Ch
hatis
garh UP
Ma
hara
shtr
a
Ma
dhya
Pra
desh
Ori
ssa
Tam
il N
adu
Dam
an
& D
iu
Goa
Ka
rna
taka
Dad
ra &
Nag
ar
Hav
eli
% C
hil
dre
n w
ho
can
no
t su
btr
act/
div
ide
Cannot Subtract
Cannot Divide
I Indian States Performing Worse than the tested children
Pakistani and Indian Children: Subtraction and Division
0.0
10.0
20.0
30.0
40.0
50.0
60.0
70.0
80.0
90.0
100.0
Me
ghal
aya
Aru
nach
al P
rade
sh
Ma
nipu
r
Wes
t Ben
gal
Ker
ala
Trip
ura
Nag
alan
d
Ha
ryan
a
Bih
ar
Jam
mu
& K
ashm
ir
Pa
kist
an (
Eas
y)
Pa
kist
an (
Ha
rd)
An
dhra
Pra
desh
Guj
ara
t
Ra
jast
han
Him
acha
l Pra
des
h
Ind
ia
Jha
rkha
nd
Ass
am
Pu
njab
Utt
ara
ncha
l
Ch
hatis
garh UP
Ma
hara
shtr
a
Ma
dhya
Pra
desh
Ori
ssa
Tam
il N
adu
Dam
an
& D
iu
Goa
Ka
rna
taka
Dad
ra &
Nag
ar
Hav
eli
% C
hil
dre
n w
ho
can
no
t su
btr
act/
div
ide
Cannot Subtract
Cannot Divide
I Indian States Performing Worse than the tested children