Embed Size (px)
Citation preview

What do Professional, Accreditation Organizations, and Regulators Need to Assess Clinical Performance Across the Continuum?
Rebecca S. Lipner, PhDNCVHS SUBCOMMITTEE ON QUALITY
HEARINGOctober 18-19
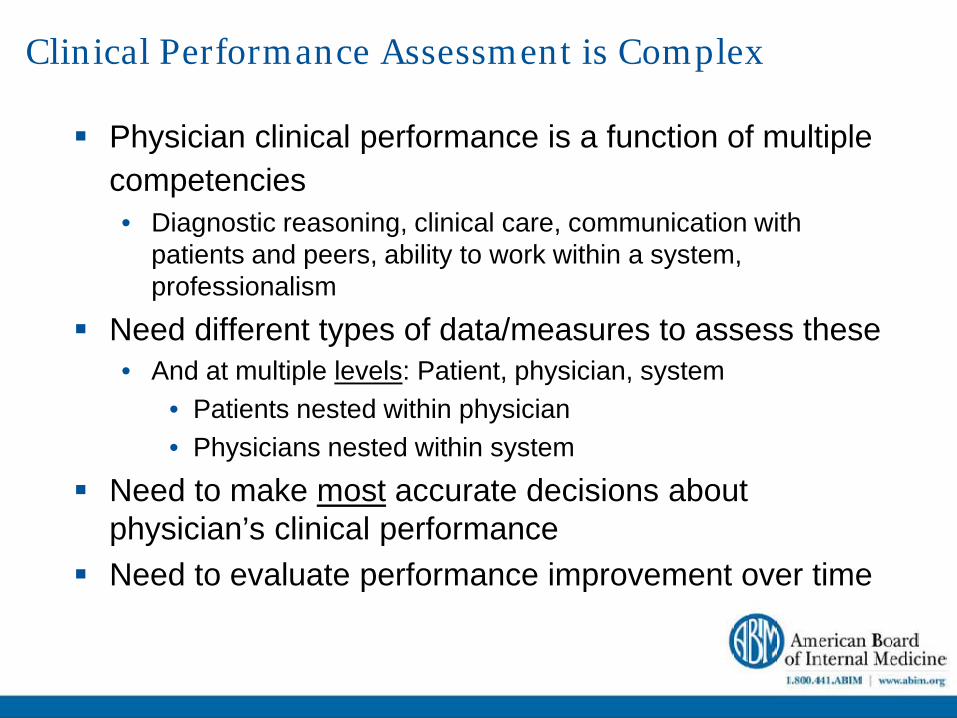
Clinical Performance Assessment is Complex
Physician clinical performance is a function of multiple competencies• Diagnostic reasoning, clinical care, communication with
patients and peers, ability to work within a system, professionalism
Need different types of data/measures to assess these• And at multiple levels: Patient, physician, system
• Patients nested within physician• Physicians nested within system
Need to make most accurate decisions about physician’s clinical performance
Need to evaluate performance improvement over time

High Quality Data and Information
Data• Accurate, complete, comparable, timely
Measures• Reliable, valid, feasible
Classifications/decisions and consequences• High classification accuracy - reproducible, valid,
meaningful and fair• Based on appropriate and planned sample design

Specific Data Elements (Examples) Clinical data
• Processes and outcomes of care• Medications, problem lists, laboratory findings• Care transitions
Patient data• Basic demographics (e.g., age)• Patient risk adjustors (e.g., insurance coverage, compliance)• Patient self-care (experience of care)
Physician data• Basic demographics (e.g., gender, specialization)• Diagnostic reasoning (e.g., errors)• Unrestricted medical license (e.g., disciplinary actions)
System data• Type of data collection (e.g., EHR)• Type of setting (e.g., ambulatory – small practice)

• Advanced Heart Failure• Cardiovascular Disease• Endocrinology, Diabetes
and Metabolism• Gastroenterology• Hematology• Infectious Disease• Medical Oncology• Nephrology• Pulmonary Disease• Rheumatology
• Adolescent Medicine• Clinical Cardiac
Electrophysiology• Critical Care Medicine• Geriatric Medicine• Hospice & Palliative Care• Interventional Cardiology• Sleep Medicine• Sports Medicine• Transplant Hepatology
ABIM’s Defines the Field of Internal Medicine

How many physicians work in your practice?
16%
26%
17% 16%
25%
0%
10%
20%
30%
40%
1 (Solo) 2 -5 6 - 10 11 - 25 Over 25
Number of physicians in practice
Results through 2009

What Motivates Physicians to Participate in a Voluntary Regulatory Program?
45%
42%
19% 23
%
10%
45%
30%
25%
4%
51%
59%
60%
61%
34%
0%
10%
20%
30%
40%
50%
60%
70%
Professionalimage
Updateknowledge
Quality patientcare or safety
Required foremployment
Professionaladvancement
Patientsatisfaction
Monetarybenefits
General Internists
Subspecialists
Lipner, Ann Int Med, 2006

Miller’s Framework for Clinical Assessment (1990)
Knows
(knowledge)
Knows How
(competence)
Shows How
(performance)
Does (action)
1
2
3
4
Diagnostic Reasoning using clinical vignettes
Performance in PracticeNarrower, less standardized
Broader, more standardized

Clinical Diagnostic Reasoning Process*
* Bowen JL, NEJM 2006;355:2217-25.
Patient’s story
Data acquisition
Accurate “problem representation”
Generation of hypothesis
Search for & selection of illness script
Diagnosis
Knowledge
Context
Experience
Assessed through secure exam using clinical vignettes

Performance in Practice (PIMSM)
Performance Report
Improvement
Chart review Patient survey
Impact
Plan
do
study
act
Practice survey
Based on Picker patient and CAHPS
surveys
Based on Wagner’s Chronic Care Model & IHI’s Idealized
Office Design
Evidence-based guidelines

Diabetes Composite Score – at Physician Level
Composite measure is more reliable than individual measures
Classification/decision based on a composite measure is more reproducible than a decision based on an individual measure (fewer false positive and negatives)
Composites allow for a more comprehensive assessment but performance feedback on individual measures is also important
Classification/decision that is based on a scientific approach to standard setting is credible and defensible
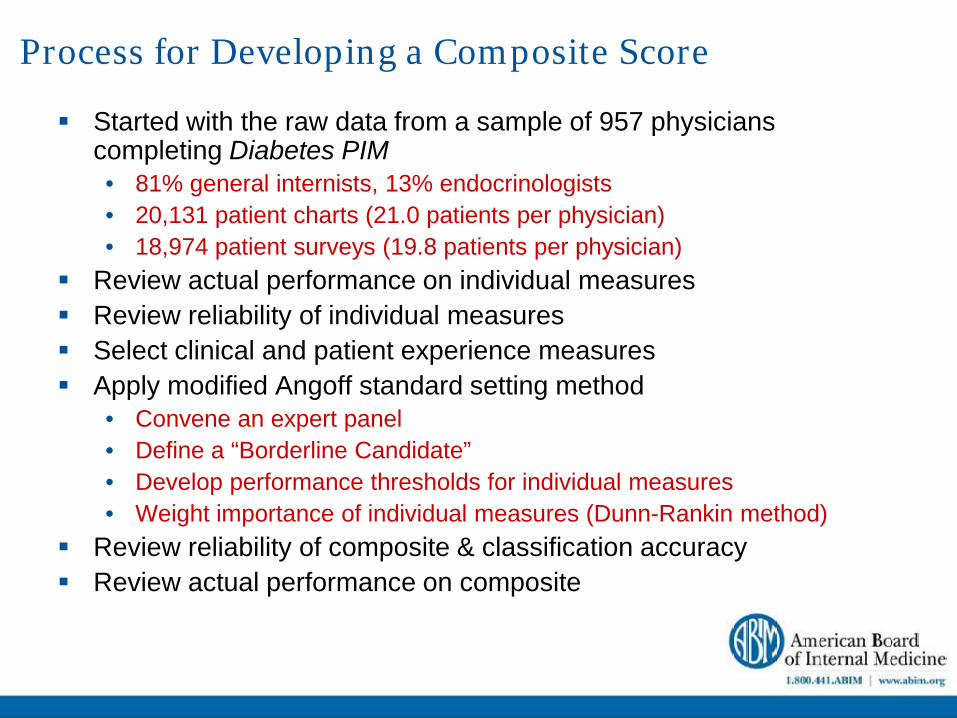
Process for Developing a Composite Score
Started with the raw data from a sample of 957 physicians completing Diabetes PIM • 81% general internists, 13% endocrinologists• 20,131 patient charts (21.0 patients per physician) • 18,974 patient surveys (19.8 patients per physician)
Review actual performance on individual measures Review reliability of individual measures Select clinical and patient experience measures Apply modified Angoff standard setting method
• Convene an expert panel• Define a “Borderline Candidate”• Develop performance thresholds for individual measures• Weight importance of individual measures (Dunn-Rankin method)
Review reliability of composite & classification accuracy Review actual performance on composite

Computation of Pass/Fail Standard for Competent Diabetes Care
* If physician is below threshold, no points are awarded
Measure ThresholdImportance
Weights Points Intermediate Outcome Measures
HgBA1c ~poor control (<= 9.0) 72.5% X 10 = 7.25Blood pressure ~poor control (<140/90) 53.7% X 10 = 5.37LDL ~poor control (<130mg/dl) 58.7% X 10 = 5.87HgBA1c at goal (<8.0 or <7.0) 36.0% X 7 = 2.52Blood pressure superior control (<130/80) 16.9% X 9 = 1.52LDL superior control (<100 mg/dl) 23.8% X 8 = 1.90
Clinical Process Measures*Eye exam 28.8% X 9 = 2.59Test for urine protein 73.1% X 10 = 7.31Foot exam 35.6% X 4 = 1.42Smoking status & cessation advice 67.5% X 7 = 4.73
Patient Experience MeasuresPatient satisfaction with diabetes care 46.3% X 7 = 3.24Patient self-care support 53.1% X 9 = 4.78
Standard (passing score) SUM = 48.51

Feedback: Dr. Smith’s Performance Score
*Below the threshold (28.8%) so no points (0.000) are awarded.
MeasurePerformance
RateImportance
Weights Points Intermediate Outcome Measures
HgBA1c ~poor control (<= 9.0) 82.6% X 10 = 8.26Blood pressure ~poor control (<140/90) 69.6% X 10 = 6.96LDL ~poor control (<130mg/dl) 87.0% X 10 = 8.70HgBA1c at goal (<8.0 or <7.0) 65.2% X 7 = 4.56Blood pressure superior control (<130/80) 34.8% X 9 = 3.13LDL superior control (<100 mg/dl) 73.9% X 8 = 5.91
Clinical Process MeasuresEye exam* 26.1% X 9 = 0.00Test for urine protein 100.0% X 10 = 10.00Foot exam 60.9% X 4 = 2.44Smoking status & cessation advice 78.3% X 7 = 5.48
Patient Experience MeasuresPatient satisfaction with diabetes care 60.0% X 7 = 4.20Patient self-care support 80.0% x 9 = 7.20
Dr. Smith’s Composite Score SUM = 66.84

How Accurate were the Classifications/Decisions?
0
100
200
300
400
500
600
700
800
900
0 10 20 30 40 50 60 70 80 90 100
Composite Measure Score
Ran
k
0.85
0.9
0.95
1
Cla
ssifi
catio
n ac
cura
cy
Hypothetical passing score

0 5 10 15 20 25 30 35 40 45 50 55 60 65 70 75 80 85 90 951000
2.5
5.0
7.5
10.0
12.5
15.0
17.5
20.0
Percent
Standard = 48.51
Mean = 71.23 (SD = 11.90)
Feedback: Distribution of Diabetes Composite
Reliability of Composite Score = 0.91*
Classification Accuracy = .98*
*Bootstrap method (Weng et al.)
Composite ScoreN=957; updated for 2,823 physicians
4% of physicians did not meet the standard

Feedback: “Your Performance Quartiles”
Low HighBottom (bottom
25th percentile)
Bottom Middle (26th-
49th percentile)
Top Middle (50th-74th percentile)
Top (top 25th
percentile)
A1C poor control xBlood pressure poor control xLDL poor control xA1C at Goal xBlood Pressure Superior Control xLDL Superior Control xEye exam xTest for urine protein xFoot exam xSmoking Status & Cessation Advice x
Overall Diabetes Care Satisfaction xPatient Self-care Support x
Total composite score x

Composite and Standard Setting
Reliability and classification accuracy – Good!Standard setting approach – Credible!Competence standard – Reasonable! but high pass
rate Composite score interpretation – Valid (meaningful)!
• Endocrinologists performed better than internists• Those classified as “incompetent”
• Scored lower on diagnostic reasoning exam• Had lower overall ratings in residency• Were more likely to be in solo practice
Weng et al., EHP, 2010; Hess et. al., JGIM, forthcoming

Comprehensive Care – Meaningful Use of Health IT 7 Chronic conditions:
• Coronary artery disease• Acute myocardial infarction• Congestive heart failure• Atrial Fibrillation• Diabetes• Hypertension• Osteoarthritis (knee and/or hip)
4 Acute care conditions:• Acute depression• Low back pain• Upper respiratory infection• Urinary tract infection
6 Preventive care measures:• Influenza and pneumococcal vaccinations• Mammography and colorectal cancer screening• Osteoporosis screening• Smoking cessation counseling
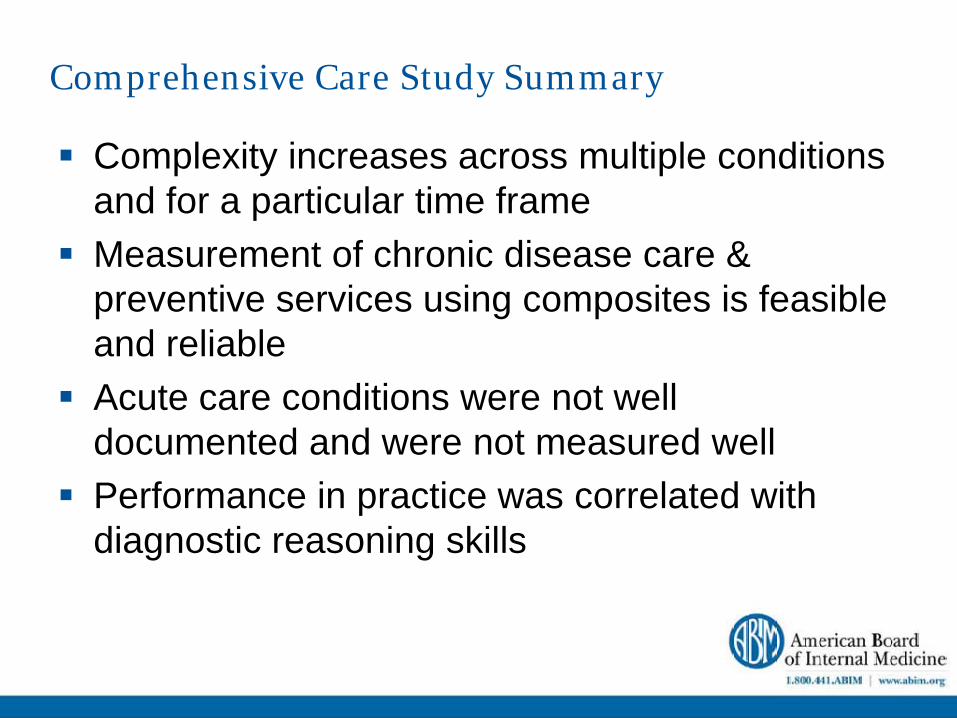
Comprehensive Care Study Summary
Complexity increases across multiple conditions and for a particular time frame
Measurement of chronic disease care & preventive services using composites is feasible and reliable
Acute care conditions were not well documented and were not measured well
Performance in practice was correlated with diagnostic reasoning skills

High Quality Clinical Assessments Should Include…
High quality data and access to raw data!! Evidence-based measures Multiple sources of data Connectivity to electronic databases Data safeguards to ensure privacy of patients Enhancements through research
• Relationships among these data should be examined through qualitative and quantitative research
Feedback to encourage quality improvement –move the curve to the right-> better patient care
Related ReferencesDiagnostic Reasoning
Lipner RS, Lucey CR. Putting the Secure Exam to the Test. JAMA, 2010;304(12):1379-1380.
Composite Scoring and Standard Setting Weng W, Hess BJ, Lynn LA, Holmboe ES, Lipner RS. Measuring Physicians'
Performance in Clinical Practice: Reliability, Classification Accuracy, and Validity. Evaluation in the Health Professions. 2010; 33(3): 302-20.
Hess BJ, Weng W, Lynn LA, Holmboe ES, Lipner RS. Setting a Fair Performance Standard for Physicians’ Quality of Patient Care. Journal of General Internal Medicine. In press, 2010.
Comprehensive Care and Systems Holmboe ES, Weng W, Arnold GK, Kaplan SH, Normand SLK, Greenfield S,
Lipner RS. Measuring Physician Performance Comprehensively in Ambulatory Practice. Health Services Research. In press; 2010.
Holmboe ES, Arnold GK, Weng W, Lipner RS. Current Yardsticks May be Inadequate for Measuring Quality Improvements From the Medical Home.Health Affairs. 2010; 29 (5): 859-66.