Embed Size (px)
Citation preview
What does NEETs mean and why is the concept so easily misinterpreted?
Technical Brief No.1
Youth Employment Programme Employment Policy
Department
Sara Elder
January 2015
Introduction
The share of youth which are neither in employment nor in education or training in the youth
population (the so-called “NEET rate”) is a relatively new indicator, but one that is given increasing
importance by international organizations and the media. The popularity of the “NEET” concept is
associated with its assumed potential to address a broad array of vulnerabilities among youth,
touching on issues of unemployment, early school leaving and labour market discouragement. These
are all issues that warrant greater attention as young people continue to feel the aftermath of the
economic crisis, particularly in advanced economies.
From a little known indicator aimed at focusing attention on the issue of school drop-out among
teenagers in the early 2000s, the indicator has gained enough weight to be proposed as the sole
youth-specific target for the post-2015 Sustainable Development Goals (SDGs) 8 to “Promote
sustained, inclusive and sustainable economic growth, full and productive employment and decent
work for all”. Within the Goal, youth are identified in two proposed targets: (i) by 2030 achieve full
and productive employment and decent work for all women and men, including for young people
and persons with disabilities, and equal pay for work of equal value, and (ii) by 2020 substantially
reduce the proportion of youth not in employment, education or training (NEET).
It is the author’s opinion that the NEET rate is an indicator that is widely misunderstood and
therefore misinterpreted. The critique which follows is intended to point out some misconceptions so
that the indicator can be framed around what it really measures, rather than what it does not. If the
indicator is to be placed within the post-2015 SDG framework then a great deal of work remains to
be done in educating policymakers, international organizations and the public as to what the NEETs
mean. This analytical brief, based on an analysis of the recent School-to-work transition surveys
(SWTS) from 28 low- and middle-income countries, hopes to contribute to a better understanding of
this ambiguous indicator.
Contents
Page
1. How to measure the NEETs .................................................................................................... 1
2. How to (mis)interpret the NEET rate ...................................................................................... 3
2.1 Conceptual interpretations ............................................................................................ 3
2.2 Analytical interpretations .............................................................................................. 4
3. Concluding remarks ................................................................................................................ 8
References ......................................................................................................................................... 10
Annex I. Additional tables................................................................................................................. 11
Tables
1. Excerpts on the NEET concept ........................................................................................ 3
Annex table 1. NEET rate and subcategories by sex (aged 15–29) .................................................. 11
Annex table 2. Discouraged youth (aged 15–29) .............................................................................. 13
Figures
1. Youth NEET rate, 28 SWTS countries and EU-27, 2012/13 ........................................... 5
2. Youth NEET rate by income and regional groupings, 2012/13 ....................................... 5
3. Youth NEET rate and composition, selected countries, 2012.......................................... 6
4. Youth NEET rate and composition by sex, selected countries, 2012 .............................. 7
5. Youth NEET rate and composition by age group, selected countries, 2012 .................... 8
The ILO School-to-work transitions surveys (SWTS) are implemented as an outcome of the Work4Youth (W4Y) project, a partnership between the ILO and The MasterCard Foundation. The project has a budget of US$14.6 million and will run for five years to mid-2016. Its aim is to “promote decent work opportunities for young men and women through knowledge and action”. The immediate objective of the partnership is to produce more and better labour market information specific to youth in developing countries, focusing in particular on transition paths to the labour market.
See the website www.ilo.org/w4y for more information.
1
1. How to measure the NEETs1
Unlike for unemployment or employment, there is no international standard for the
definition of NEETs. This in itself could hinder the job of international advisers to
countries on the new SDGs. Eurostat, the ILO and certain other organizations have adopted
the following definition of the NEET rate: the percentage of the population of a given age
group and sex who is not employed and not involved in further education or training.
The numerator of the indicator refers to persons meeting two conditions2: (i) they are
not employed (i.e. are unemployed or inactive), and (ii) they have not received any
education or training in the four weeks preceding the survey. The denominator, according
to Eurostat, is the total population of the same age and sex group, excluding respondents
who have not answered the question “Participation to regular education and training”. The
ILO puts forth the following definition (ILO, 2013a)3:
NEET rate (%) =
(Number of youth – number of youth in employment + number
of youth not in employment who are in education or training) x 100
Total number of youth
A more simplified version of the definition used in ILO analyses of the SWTS4 is:
unemployed non-students + inactive non-students / youth population. Non-respondents are
not excluded from the denominator.
Current literature frequently simplifies the measurement of NEETs to unemployed +
inactive non-students, ignoring the fact that some unemployed persons are also students
and should thus be excluded from the calculation.5 The international standards of statistics
on the labour force dictate that the activity status of current students is to be measured in
the same manner as the non-student population (Hussmanns, Mehran and Verma, 1990, p.
104). If a student worked for at least one hour in the reference week, he or she is thus
counted among the employed. If a student did not work, was available to work and actively
sought work, he or she is counted among the unemployed.
The definition change may be subtle but it does make a difference in terms of results.
Using the recently available age-disaggregated tabulations of over 50 household surveys
1 The author is the Chief Technical Advisor of the ILO Work4Youth (W4Y) Project of the Youth
Employment Programme. She would like to thank Theo Sparreboom, ILO Senior Labour
Economist, and Aurelio Parisotto, Head, Country Policy Development and Coordination Unit, for
providing insightful comments on the draft. Appreciation is also due to Yves Perardel and Yonca
Gurbuzer of the W4Y team for technical assistance on production of the data. 2 “Educational attainment and outcomes of education (edat). Reference metadata in Euro SDMX
Metadata Structure (ESMS)”, EUROSTAT:
http://epp.eurostat.ec.europa.eu/cache/ITY_SDDS/en/edat_esms.htm. 3 A more complex definition is proposed for data producers: NEET rate (%) = [(number of
unemployed youth + number of youth not in the labour force) – (number of unemployed youth who
are in education or training + number of youth not in the labour force who are in education or
training)] / total number of youth (ILO, 2013a). 4 National, thematic and regional analytical reports are available at www.ilo.org/w4y.
5 Students seeking work may be part-time students seeking part-time work, part-time students
seeking full-time work, full-time students seeking part-time work or full-time students seeking full-
time work. The point here is that there is a combination of school and seeking work
(unemployment) so that the latter subcategory of NEETs – not in education nor training – does not
apply, even if the first subcategory – not in employment – does.
2
on the ILO youthSTATs database (including the SWTS datasets), I ran a comparison of
results on youth NEETs (number and rate) in 41 developing countries using the proper
“strict” definition (excluding unemployed students) and the inaccurate “broad” one
(including all unemployed).6 Results on the number of youth NEETs were overstated in the
latter case (broad definition) by more than 10 per cent in 11 countries.7 The NEET rates
among the same countries were overstated by between 1.4 and 6.5 percentage points. The
average difference among the 41 countries between the broad and strict definitions of
NEETs in the NEET rates was 1.4 percentage points.8 It may not sound like much, but as
an indicator that will possibly serve the interest of the countries as the only youth-specific
target for the SDGs, one percentage point can be an important political statement.
Regardless, if the concept is to serve within the SDG framework, it is important to get it
right.
A final word on measurement: it has been frequently stated that NEET rate “is easily
measureable using standard surveys with questions on employment, education, and
training”.9 The “easy to measure” assessment is debatable, given the lack of an official
definition. And while it is true that the data can be derived from standard household
surveys, such as the labour force survey (run only sporadically in many lower income
countries), the level of detail needed to make the calculation – specifically, the education
status of youth (in school or out of school) cross-tabulated by labour force status
(employed, unemployed or inactive) – is rarely found without direct access to the survey
micro datasets. This means that unless the national statistics offices include the NEET rate
in their reports – bearing in mind, again, the sporadic nature of such in lower income
countries – or make the raw datasets publicly available, policy-makers and the public at
large will not have access to the information outside the countries with the most advanced
statistical capacity.10
6 The list of countries is the same as in Annex table 1.
7 Argentina, Bolivia, Brazil, Colombia, Costa Rica, Liberia, Nepal, Peru, Russian Federation, Togo
and Ukraine. These are apparently countries with a stronger tradition of combining school with
work or looking for work (as secondary activities). 8 Changes in the female NEET rates (broad and strict measures) were larger and more frequent than
in the male rates. 9 From World Bank blog: “It’s time for an ambitious Global Youth Agenda”, 25 November 2013;
http://blogs.worldbank.org/arabvoices/it-s-time-ambitious-global-youth-agenda. See also Eurofound
(2012), p. 24. 10
This is one of the reasons why most current discussions on NEETs are so heavily focused on
advanced economies, particularly OECD countries. These are the only countries where the measure
is publically available (although the new youthSTATs database can serve to overcome some of the
data gaps for developing economies). At the same time, as will be discussed later, the issues of the
NEETs are more relevant to developed than developing economies.
3
2. How to (mis)interpret the NEET rate
2.1 Conceptual interpretations
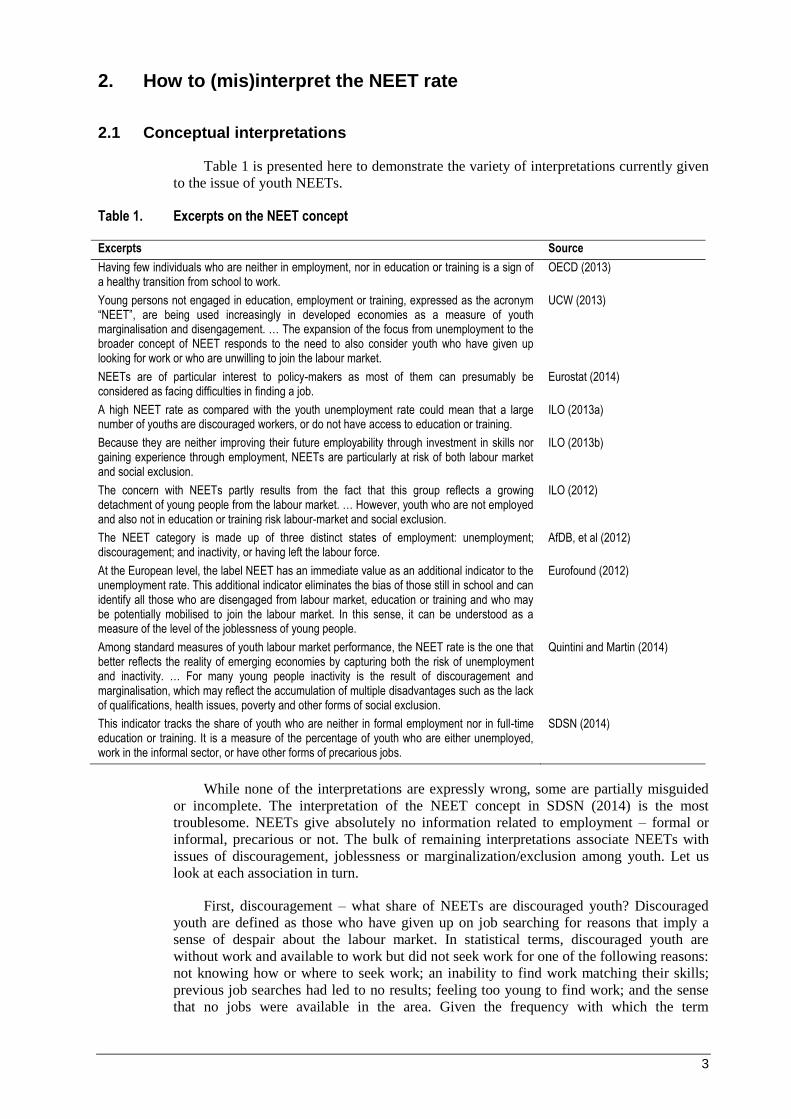
Table 1 is presented here to demonstrate the variety of interpretations currently given
to the issue of youth NEETs.
Table 1. Excerpts on the NEET concept
Excerpts Source
Having few individuals who are neither in employment, nor in education or training is a sign of a healthy transition from school to work.
OECD (2013)
Young persons not engaged in education, employment or training, expressed as the acronym “NEET”, are being used increasingly in developed economies as a measure of youth marginalisation and disengagement. … The expansion of the focus from unemployment to the broader concept of NEET responds to the need to also consider youth who have given up looking for work or who are unwilling to join the labour market.
UCW (2013)
NEETs are of particular interest to policy-makers as most of them can presumably be considered as facing difficulties in finding a job.
Eurostat (2014)
A high NEET rate as compared with the youth unemployment rate could mean that a large number of youths are discouraged workers, or do not have access to education or training.
ILO (2013a)
Because they are neither improving their future employability through investment in skills nor gaining experience through employment, NEETs are particularly at risk of both labour market and social exclusion.
ILO (2013b)
The concern with NEETs partly results from the fact that this group reflects a growing detachment of young people from the labour market. … However, youth who are not employed and also not in education or training risk labour-market and social exclusion.
ILO (2012)
The NEET category is made up of three distinct states of employment: unemployment; discouragement; and inactivity, or having left the labour force.
AfDB, et al (2012)
At the European level, the label NEET has an immediate value as an additional indicator to the unemployment rate. This additional indicator eliminates the bias of those still in school and can identify all those who are disengaged from labour market, education or training and who may be potentially mobilised to join the labour market. In this sense, it can be understood as a measure of the level of the joblessness of young people.
Eurofound (2012)
Among standard measures of youth labour market performance, the NEET rate is the one that better reflects the reality of emerging economies by capturing both the risk of unemployment and inactivity. … For many young people inactivity is the result of discouragement and marginalisation, which may reflect the accumulation of multiple disadvantages such as the lack of qualifications, health issues, poverty and other forms of social exclusion.
Quintini and Martin (2014)
This indicator tracks the share of youth who are neither in formal employment nor in full-time education or training. It is a measure of the percentage of youth who are either unemployed, work in the informal sector, or have other forms of precarious jobs.
SDSN (2014)
While none of the interpretations are expressly wrong, some are partially misguided
or incomplete. The interpretation of the NEET concept in SDSN (2014) is the most
troublesome. NEETs give absolutely no information related to employment – formal or
informal, precarious or not. The bulk of remaining interpretations associate NEETs with
issues of discouragement, joblessness or marginalization/exclusion among youth. Let us
look at each association in turn.
First, discouragement – what share of NEETs are discouraged youth? Discouraged
youth are defined as those who have given up on job searching for reasons that imply a
sense of despair about the labour market. In statistical terms, discouraged youth are
without work and available to work but did not seek work for one of the following reasons:
not knowing how or where to seek work; an inability to find work matching their skills;
previous job searches had led to no results; feeling too young to find work; and the sense
that no jobs were available in the area. Given the frequency with which the term
4
“discouraged youth” (and, even worse, the occasional sensationalized stretch to “lost
generation”) has been used to draw attention to youth issues over the course of the
economic crisis and subsequent Great Recession, it is likely that readers will be surprised
to know that across the 37 developing economies with data on discouraged workers (using
youthSTATs), the average share of discouraged youth in the labour market was at most 3.7
per cent (Annex table 2).11
Among the NEETs, discouraged youth made up 9.1 per cent of
the total, on average. Equating NEETs with discouragement is therefore a clear
exaggeration.
Are NEET status and joblessness the same? Technically yes. The first subcategory of
the NEETs is those “not in employment”, i.e. the jobless, aka the unemployed. But the “not
in education or training” (aka inactive non-students) are also included as NEETs. To
equate these inactive youth with the jobless would be erroneous. Again, technically, yes,
they are without a job, but according to the international standards, this group has indicated
that they did not actively seek work or they were not available to take up work. One cannot
assume that it is their goal to have a job. The majority in this category in almost all
countries are young women tending to the household. Even if someday they would hope to
gain employment outside of the home – ignoring cultural barriers – the reality is that at that
point in time, they were not available to work.12
Putting a negative connotation on their
home-care contributions with the label of “jobless” is a matter that requires careful
consideration.
Are NEET status and marginalization/exclusion the same? Again, technically yes.
The second subcategory of the NEETs – “not in education or training” (aka inactive non-
students) – can be considered a form of exclusion. As noted in the previous paragraph, the
majority in the subcategory are young women, many of which are excluded from
participating in the education system or in the labour market. In this regards, the
association of NEETs to marginalization/exclusion offers the best “fit” among the
numerous interpretations.
2.2 Analytical interpretations
Indicators that merge concepts make for a blurred and complex interpretation.13
In
terms of policy responses, the issue of unemployment is quite separate from the issue of
exclusion from education or training. Cross-country, income-based and regional
comparisons also become more complicated. As a means of demonstration, let me attempt
to tell the story of youth labour markets in two ways: first, using only the NEET rate, and
second, with the NEET rate and its subcategories.
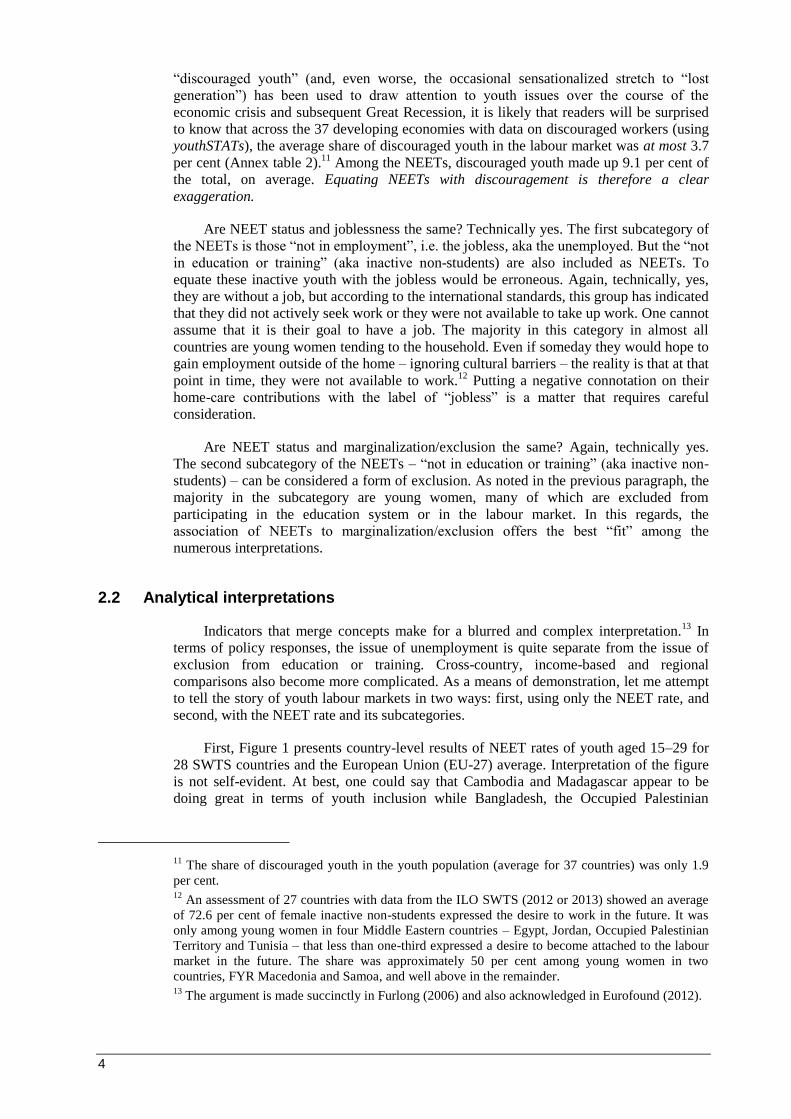
First, Figure 1 presents country-level results of NEET rates of youth aged 15–29 for
28 SWTS countries and the European Union (EU-27) average. Interpretation of the figure
is not self-evident. At best, one could say that Cambodia and Madagascar appear to be
doing great in terms of youth inclusion while Bangladesh, the Occupied Palestinian
11 The share of discouraged youth in the youth population (average for 37 countries) was only 1.9
per cent. 12
An assessment of 27 countries with data from the ILO SWTS (2012 or 2013) showed an average
of 72.6 per cent of female inactive non-students expressed the desire to work in the future. It was
only among young women in four Middle Eastern countries – Egypt, Jordan, Occupied Palestinian
Territory and Tunisia – that less than one-third expressed a desire to become attached to the labour
market in the future. The share was approximately 50 per cent among young women in two
countries, FYR Macedonia and Samoa, and well above in the remainder. 13
The argument is made succinctly in Furlong (2006) and also acknowledged in Eurofound (2012).
5
Territory, Samoa, Tanzania and Tunisia all seem to struggle, with youth NEET rates
greater than 30 per cent.
Figure 1. Youth NEET rate, 28 SWTS countries and EU-27, 2012/13
Note: Youth are defined as 15-29 years.
Sources: Authors’ calculations based on ILO school-to-work transition surveys and Eurofound (2012), table 1, for EU-27. For methodological information and reference dates of the SWTS, see http://www.ilo.org/employment/areas/WCMS_234860/lang--en/index.htm.
The youth NEET rate of the EU-27 countries was 15.4 per cent in 2012 (Eurofound,
2012). Is this the NEET rate to aim for? Again, without additional information, we are
unable to prescribe an acceptable youth NEET rate. The picture is further skewed when we
note in Figure 2 that the average youth NEET rate in low-income countries was nearly on
par with that of the high-income countries (18.1 and 15.5 per cent, respectively). It is in the
middle-income countries that countries apparently have the greatest difficulty in keeping
the youth population fully engaged.
Figure 2. Youth NEET rate by income and regional groupings, 2012/13
Notes: Youth are defined as 15-29 years. Groupings are made according to unweighted averages of country results. The high-income grouping consists of Russian Federation and the EU-27 average. The two high income data points are not included in the regional grouping Eastern Europe & Central Asia, which is thereby representative of the lower middle-income and upper middle-income countries in the region.
Sources: Authors’ calculations based on ILO school-to-work transition surveys (www.ilo.org/w4y) and Eurofound (2012), table 1, for EU-27.
15.4
05
101520253035404550
Mad
agas
car
Cam
bodi
a
Tog
o
Vie
t Nam
Nep
al
Uga
nda
Col
ombi
a (u
rban
)
EU
-27
aver
age
Kyr
gyzs
tan
Rus
sian
Fed
.
Libe
ria
Mal
awi
Per
u (u
rban
)
Ukr
aine
Bra
zil
Ben
in
Arm
enia
Zam
bia
Mol
dova
, Rep
.
Egy
pt
Jord
an
Mac
edon
ia, F
YR
Jam
aica
El S
alva
dor
Tan
zani
a
Tun
isia
Occ
upie
d P
ales
tinia
n…
Ban
glad
esh
Sam
oa
NE
ET
rat
e (%
)
18.1
26.8 25.2
15.5
23.3 24.1 23.1
31.3
18.4
0
5
10
15
20
25
30
35
Low
-inco
me
Low
er m
iddl
e-in
com
e
Upp
er m
iddl
e-in
com
e
Hig
h-in
com
e
Asi
a &
Pac
ific
Eas
tern
Eur
ope
&C
entr
al A
sia
Latin
Am
eric
a &
Car
ibbe
an
Mid
dle
Eas
t & N
orth
Afr
ica
Sub
-Sah
aran
Afr
ica
Income grouping Regional grouping
NE
ET
rat
e (%
)
6
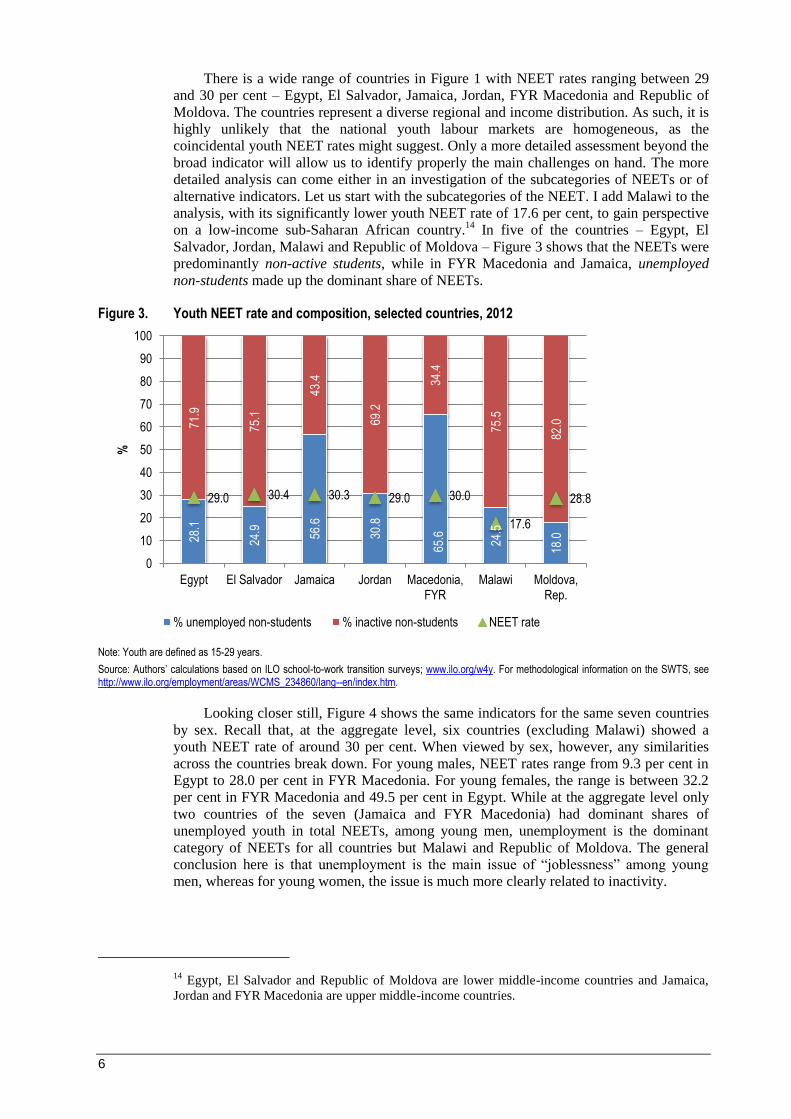
There is a wide range of countries in Figure 1 with NEET rates ranging between 29
and 30 per cent – Egypt, El Salvador, Jamaica, Jordan, FYR Macedonia and Republic of
Moldova. The countries represent a diverse regional and income distribution. As such, it is
highly unlikely that the national youth labour markets are homogeneous, as the
coincidental youth NEET rates might suggest. Only a more detailed assessment beyond the
broad indicator will allow us to identify properly the main challenges on hand. The more
detailed analysis can come either in an investigation of the subcategories of NEETs or of
alternative indicators. Let us start with the subcategories of the NEET. I add Malawi to the
analysis, with its significantly lower youth NEET rate of 17.6 per cent, to gain perspective
on a low-income sub-Saharan African country.14
In five of the countries – Egypt, El
Salvador, Jordan, Malawi and Republic of Moldova – Figure 3 shows that the NEETs were
predominantly non-active students, while in FYR Macedonia and Jamaica, unemployed
non-students made up the dominant share of NEETs.
Figure 3. Youth NEET rate and composition, selected countries, 2012
Note: Youth are defined as 15-29 years.
Source: Authors’ calculations based on ILO school-to-work transition surveys; www.ilo.org/w4y. For methodological information on the SWTS, see http://www.ilo.org/employment/areas/WCMS_234860/lang--en/index.htm.
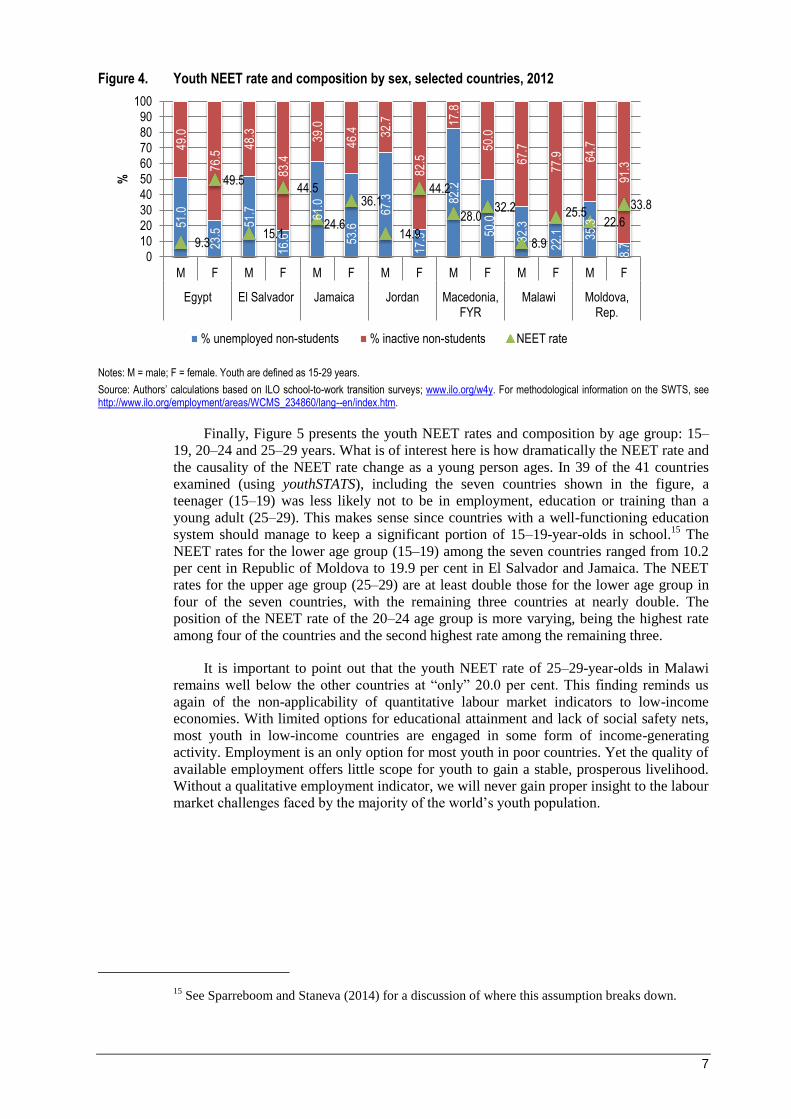
Looking closer still, Figure 4 shows the same indicators for the same seven countries
by sex. Recall that, at the aggregate level, six countries (excluding Malawi) showed a
youth NEET rate of around 30 per cent. When viewed by sex, however, any similarities
across the countries break down. For young males, NEET rates range from 9.3 per cent in
Egypt to 28.0 per cent in FYR Macedonia. For young females, the range is between 32.2
per cent in FYR Macedonia and 49.5 per cent in Egypt. While at the aggregate level only
two countries of the seven (Jamaica and FYR Macedonia) had dominant shares of
unemployed youth in total NEETs, among young men, unemployment is the dominant
category of NEETs for all countries but Malawi and Republic of Moldova. The general
conclusion here is that unemployment is the main issue of “joblessness” among young
men, whereas for young women, the issue is much more clearly related to inactivity.
14 Egypt, El Salvador and Republic of Moldova are lower middle-income countries and Jamaica,
Jordan and FYR Macedonia are upper middle-income countries.
28.1
24.9
56.6
30.8
65.6
24.5
18.0
71.9
75.1
43.4
69.2
34.4
75.5
82.0
29.0 30.4 30.3 29.0 30.0
17.6
28.8
0
10
20
30
40
50
60
70
80
90
100
Egypt El Salvador Jamaica Jordan Macedonia,FYR
Malawi Moldova,Rep.
%
% unemployed non-students % inactive non-students NEET rate
7
Figure 4. Youth NEET rate and composition by sex, selected countries, 2012
Notes: M = male; F = female. Youth are defined as 15-29 years.
Source: Authors’ calculations based on ILO school-to-work transition surveys; www.ilo.org/w4y. For methodological information on the SWTS, see http://www.ilo.org/employment/areas/WCMS_234860/lang--en/index.htm.
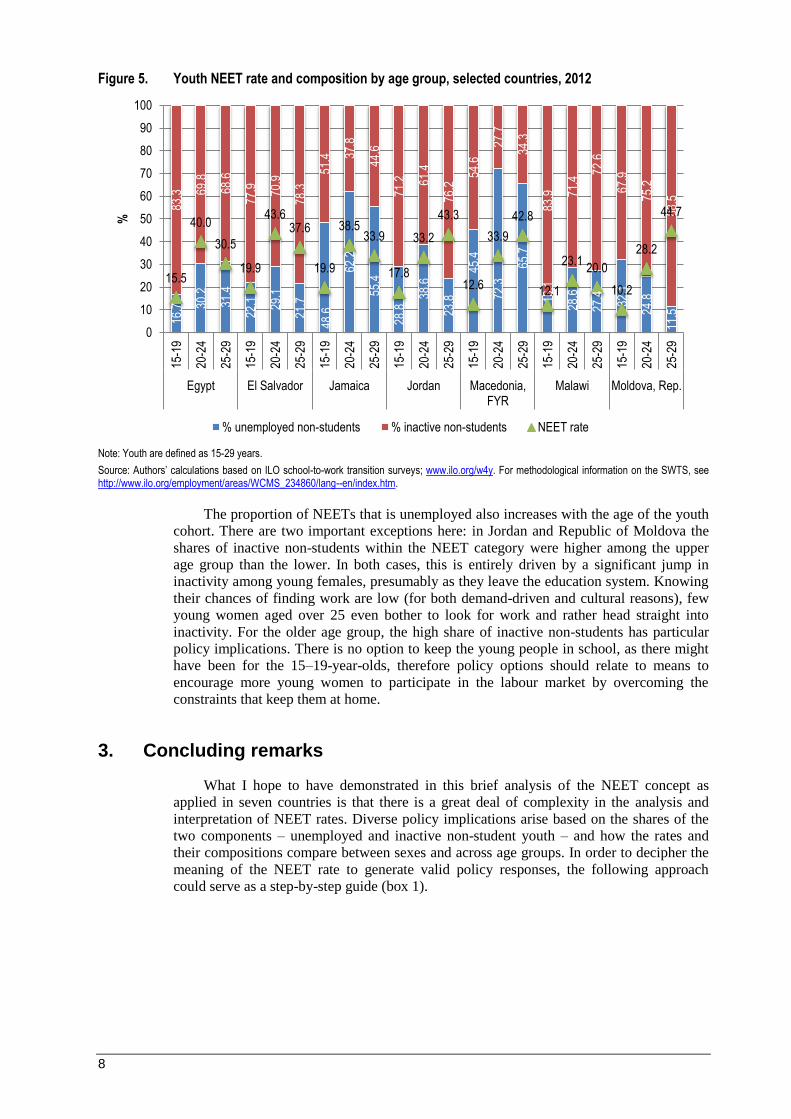
Finally, Figure 5 presents the youth NEET rates and composition by age group: 15–
19, 20–24 and 25–29 years. What is of interest here is how dramatically the NEET rate and
the causality of the NEET rate change as a young person ages. In 39 of the 41 countries
examined (using youthSTATS), including the seven countries shown in the figure, a
teenager (15–19) was less likely not to be in employment, education or training than a
young adult (25–29). This makes sense since countries with a well-functioning education
system should manage to keep a significant portion of 15–19-year-olds in school.15
The
NEET rates for the lower age group (15–19) among the seven countries ranged from 10.2
per cent in Republic of Moldova to 19.9 per cent in El Salvador and Jamaica. The NEET
rates for the upper age group (25–29) are at least double those for the lower age group in
four of the seven countries, with the remaining three countries at nearly double. The
position of the NEET rate of the 20–24 age group is more varying, being the highest rate
among four of the countries and the second highest rate among the remaining three.
It is important to point out that the youth NEET rate of 25–29-year-olds in Malawi
remains well below the other countries at “only” 20.0 per cent. This finding reminds us
again of the non-applicability of quantitative labour market indicators to low-income
economies. With limited options for educational attainment and lack of social safety nets,
most youth in low-income countries are engaged in some form of income-generating
activity. Employment is an only option for most youth in poor countries. Yet the quality of
available employment offers little scope for youth to gain a stable, prosperous livelihood.
Without a qualitative employment indicator, we will never gain proper insight to the labour
market challenges faced by the majority of the world’s youth population.
15 See Sparreboom and Staneva (2014) for a discussion of where this assumption breaks down.
51.0
23.5
51.7
16.6
61.0
53.6
67.3
17.5
82.2
50.0
32.3
22.1
35.3
8.7
49.0
76.5
48.3
83.4
39.0
46.4
32.7
82.5
17.8
50.0
67.7
77.9
64.7
91.3
9.3
49.5
15.1
44.5
24.6
36.1
14.9
44.2
28.0 32.2
8.9
25.5 22.6
33.8
0
10
20
30
40
50
60
70
80
90
100
M F M F M F M F M F M F M F
Egypt El Salvador Jamaica Jordan Macedonia,FYR
Malawi Moldova,Rep.
%
% unemployed non-students % inactive non-students NEET rate
8
Figure 5. Youth NEET rate and composition by age group, selected countries, 2012
Note: Youth are defined as 15-29 years.
Source: Authors’ calculations based on ILO school-to-work transition surveys; www.ilo.org/w4y. For methodological information on the SWTS, see http://www.ilo.org/employment/areas/WCMS_234860/lang--en/index.htm.
The proportion of NEETs that is unemployed also increases with the age of the youth
cohort. There are two important exceptions here: in Jordan and Republic of Moldova the
shares of inactive non-students within the NEET category were higher among the upper
age group than the lower. In both cases, this is entirely driven by a significant jump in
inactivity among young females, presumably as they leave the education system. Knowing
their chances of finding work are low (for both demand-driven and cultural reasons), few
young women aged over 25 even bother to look for work and rather head straight into
inactivity. For the older age group, the high share of inactive non-students has particular
policy implications. There is no option to keep the young people in school, as there might
have been for the 15–19-year-olds, therefore policy options should relate to means to
encourage more young women to participate in the labour market by overcoming the
constraints that keep them at home.
3. Concluding remarks
What I hope to have demonstrated in this brief analysis of the NEET concept as
applied in seven countries is that there is a great deal of complexity in the analysis and
interpretation of NEET rates. Diverse policy implications arise based on the shares of the
two components – unemployed and inactive non-student youth – and how the rates and
their compositions compare between sexes and across age groups. In order to decipher the
meaning of the NEET rate to generate valid policy responses, the following approach
could serve as a step-by-step guide (box 1).
16.7
30.2
31.4
22.1
29.1
21.7
48.6
62.2
55.4
28.8
38.6
23.8
45.4
72.3
65.7
16.1
28.6
27.4
32.1
24.8
11.5
83.3
69.8
68.6
77.9
70.9
78.3
51.4
37.8
44.6
71.2
61.4
76.2
54.6
27.7
34.3
83.9
71.4
72.6
67.9
75.2
88.5
15.5
40.0
30.5
19.9
43.6 37.6
19.9
38.5 33.9
17.8
33.2
43.3
12.6
33.9
42.8
12.1
23.1 20.0
10.2
28.2
44.7
0
10
20
30
40
50
60
70
80
90
100
15-1
9
20-2
4
25-2
9
15-1
9
20-2
4
25-2
9
15-1
9
20-2
4
25-2
9
15-1
9
20-2
4
25-2
9
15-1
9
20-2
4
25-2
9
15-1
9
20-2
4
25-2
9
15-1
9
20-2
4
25-2
9
Egypt El Salvador Jamaica Jordan Macedonia,FYR
Malawi Moldova, Rep.
%
% unemployed non-students % inactive non-students NEET rate
9
Box 1. How to analyse and build policy responses around the NEET rate
1. Find data on the NEET rate and its composition, by sex and age band (15-19, 20-24, 25-29). 2. Is share of unemployed non-students greater than share of inactive non-students?
Yes ►For both sexes or for one sex alone?
- Both sexes ►Suggested policy mix: active labour market policies to encourage hiring of young persons, sectoral and monetary policies to encourage job growth; social protection of the unemployed; training programmes for unemployed; aligning education system with labour demand; entrepreneurship training and incubation; employment services.16
- One sex ►Suggested policy mix targeted to one sex; for other sex, go to “No”.
For particular age band?
- Younger bands (15–19, 20–24) ► The lesser educated face higher unemployment;
requires re-training programmes; improvements in the education system; encouraging more inclusive education, including technical education; apprenticeship and mentoring programmes, etc.
- Upper age band (25–29) ► There is an issue of graduate unemployment and likely to be
structural unemployment; policies should aim at mix of policies above (to address unemployment) but with heavy concentration as well on promoting job growth.
No ► Go to 3
3. Is share of inactive non-students greater than share of unemployed non-students? Yes ► For both sexes or for one sex alone?
- Both sexes ► Sign of very limited job growth in a country, pushing young people to remain inactive at home or migrate; policies should aim at mix of policies above (to address unemployment) but with heavy concentration on promoting job growth and social protection to ensure basic needs are met.
- One sex ► Cultural or discriminatory practices exclude one sex (typically young women) from the labour market; policy responses include legal responses to promote equal opportunity, public awareness campaigns, promotion of entrepreneurship, provision of child-care solutions, widening the occupational spectrum for both sexes and perhaps even subsidizing all female enterprises or branches of enterprises.
For particular age band?
- Younger bands (15–19) ► Early school leaving is a problem. The policy mix in this
regards should be geared toward improved investment in the education system with universal access
- Upper age bands (20–24, 25–29) ► See labour market and cultural blockages identified
in response 2.
Furlong (2006) states that “the heterogeneity of NEET means that both research and
policy must begin by disaggregating so as to be able to identify the distinct characteristics
and needs of the various sub-groups”. Given the complexity of the concept and the
resulting ease of misinterpretation, I remain concerned about the growing popularity of the
NEET rate as an indicator. Would it not be better to hone in on three separate indicators
that allow us to assess the primary issues of youth in the labour market more directly? To
bring attention to those excluded from education, a useful indicator is the share of 15–19-
year-olds who are neither in the labour force nor in education or training (NLFET (15–
19), aka inactive non-students). To bring attention to the issue of unemployment among
youth, the unemployment rate is an easier indicator to understand, is more accessible and is
defined according to international standards. Finally, to draw attention to the
marginalization of the millions of youth working in poor quality employment, a quality of
employment indicator is needed such as the vulnerable employment rate or informal
employment rate.
16 The list is not all-inclusive. Eurofound (2012) offers a more comprehensive outline of policy
options, but it is important to bear in mind their limited applicability in lower income economies.
10
References
African Development Bank (AfDB); Organisation for Economic Co-operation and
Development (OECD); United Nations Development Programme (UNDP); United Nations
Economic Commission for Africa (ECA). 2012. African Economic Outlook: Promoting
youth employment.
European Foundation for the Improvement of Living and Working Conditions
(Eurofound). 2012. NEETs: Young people not in employment, education or training:
Characteristics, costs and policy responses in Europe (Dublin).
Eurostat. 2014. “Young people - education and employment patterns”, web page of the
European Commission, Eurostat, last modified: 31 March 2014;
http://epp.eurostat.ec.europa.eu/statistics_explained/index.php/Young_people_-
_education_and_employment_patterns.
Furlong, A. 2006. “Not a very NEET solution: representing problematic labour market
transitions among early school-leavers”, in Work, Employment and Society, Vol. 20, No. 3,
September.
Hussmanns, R.; Mehran, F.; Verma, V. 1990. Surveys of economically active population,
employment, unemployment and underemployment: An ILO manual on concepts and
methods (Geneva, ILO).
International Labour Organization (ILO). 2012. Global Employment Trends for Youth
2012 (Geneva).
─. 2013a. “Decent work indicators: Guidelines for producers and users of statistical and
legal framework indicators”, Second version, Draft, Geneva.
─. 2013b. Global Employment Trends for Youth 2013 (Geneva).
Organisation for Economic Co-operation and Development (OECD). 2013. “Education
indicators in focus”, 2013/04 (April).
Quintini, G.; Martin, S. “Same same but different: School-to-work transitions in emerging
and advanced economies”, OECD Social, Employment and Migration Working Papers No.
154, DELSA/ELSA/WD/SEM(2013)10.
Sparreboom, T.; Staneva, A. 2014. Is education the solution to decent work for youth in
developing economies? Identifying qualification mismatch from 28 school-to-work
transition surveys, Work4Youth Publication Series No. 23, Dec. (Geneva, ILO).
Sustainable Development Solutions Network (SDSN). 2014. “Indicators and a monitoring
framework for Sustainable Development Goals: Launching a data evolution for the SDGs”,
A report by the Leadership Council of the Sustainable Development Solutions Network,
Revised working draft, 25 July.
Understanding Childrens’ Work (UCW). 2013. NEET youth dynamics in Indonesia and
Brazil A cohort analysis, Rome.
Annex I. Additional tables
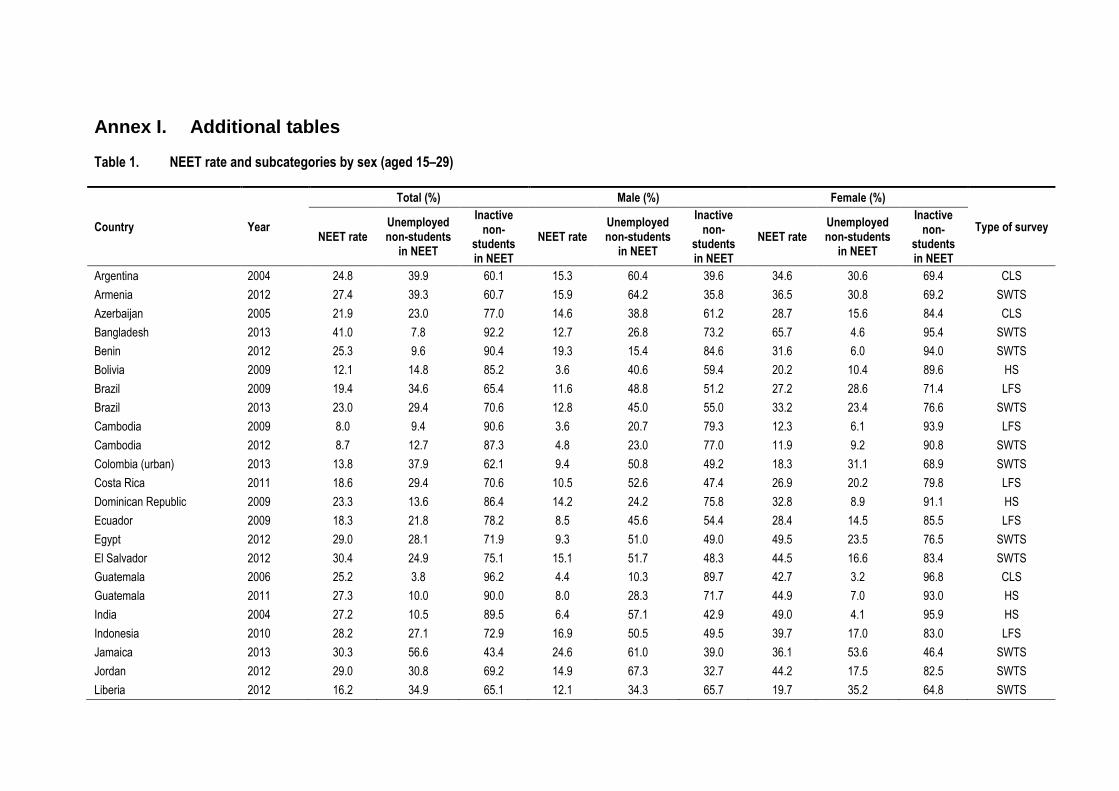
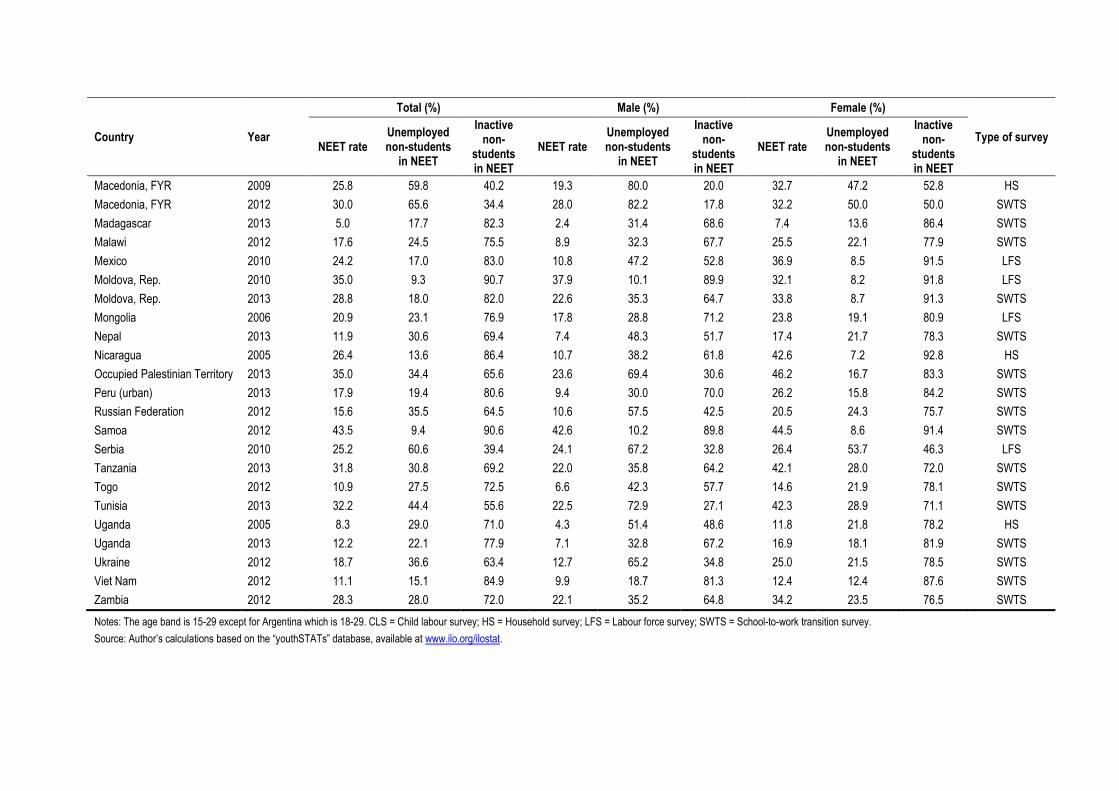
Table 1. NEET rate and subcategories by sex (aged 15–29)
Country Year
Total (%) Male (%) Female (%)
Type of survey NEET rate
Unemployed non-students
in NEET
Inactive non-
students in NEET
NEET rate Unemployed non-students
in NEET
Inactive non-
students in NEET
NEET rate Unemployed non-students
in NEET
Inactive non-
students in NEET
Argentina 2004 24.8 39.9 60.1 15.3 60.4 39.6 34.6 30.6 69.4 CLS
Armenia 2012 27.4 39.3 60.7 15.9 64.2 35.8 36.5 30.8 69.2 SWTS
Azerbaijan 2005 21.9 23.0 77.0 14.6 38.8 61.2 28.7 15.6 84.4 CLS
Bangladesh 2013 41.0 7.8 92.2 12.7 26.8 73.2 65.7 4.6 95.4 SWTS
Benin 2012 25.3 9.6 90.4 19.3 15.4 84.6 31.6 6.0 94.0 SWTS
Bolivia 2009 12.1 14.8 85.2 3.6 40.6 59.4 20.2 10.4 89.6 HS
Brazil 2009 19.4 34.6 65.4 11.6 48.8 51.2 27.2 28.6 71.4 LFS
Brazil 2013 23.0 29.4 70.6 12.8 45.0 55.0 33.2 23.4 76.6 SWTS
Cambodia 2009 8.0 9.4 90.6 3.6 20.7 79.3 12.3 6.1 93.9 LFS
Cambodia 2012 8.7 12.7 87.3 4.8 23.0 77.0 11.9 9.2 90.8 SWTS
Colombia (urban) 2013 13.8 37.9 62.1 9.4 50.8 49.2 18.3 31.1 68.9 SWTS
Costa Rica 2011 18.6 29.4 70.6 10.5 52.6 47.4 26.9 20.2 79.8 LFS
Dominican Republic 2009 23.3 13.6 86.4 14.2 24.2 75.8 32.8 8.9 91.1 HS
Ecuador 2009 18.3 21.8 78.2 8.5 45.6 54.4 28.4 14.5 85.5 LFS
Egypt 2012 29.0 28.1 71.9 9.3 51.0 49.0 49.5 23.5 76.5 SWTS
El Salvador 2012 30.4 24.9 75.1 15.1 51.7 48.3 44.5 16.6 83.4 SWTS
Guatemala 2006 25.2 3.8 96.2 4.4 10.3 89.7 42.7 3.2 96.8 CLS
Guatemala 2011 27.3 10.0 90.0 8.0 28.3 71.7 44.9 7.0 93.0 HS
India 2004 27.2 10.5 89.5 6.4 57.1 42.9 49.0 4.1 95.9 HS
Indonesia 2010 28.2 27.1 72.9 16.9 50.5 49.5 39.7 17.0 83.0 LFS
Jamaica 2013 30.3 56.6 43.4 24.6 61.0 39.0 36.1 53.6 46.4 SWTS
Jordan 2012 29.0 30.8 69.2 14.9 67.3 32.7 44.2 17.5 82.5 SWTS
Liberia 2012 16.2 34.9 65.1 12.1 34.3 65.7 19.7 35.2 64.8 SWTS
Country Year
Total (%) Male (%) Female (%)
Type of survey NEET rate
Unemployed non-students
in NEET
Inactive non-
students in NEET
NEET rate Unemployed non-students
in NEET
Inactive non-
students in NEET
NEET rate Unemployed non-students
in NEET
Inactive non-
students in NEET
Macedonia, FYR 2009 25.8 59.8 40.2 19.3 80.0 20.0 32.7 47.2 52.8 HS
Macedonia, FYR 2012 30.0 65.6 34.4 28.0 82.2 17.8 32.2 50.0 50.0 SWTS
Madagascar 2013 5.0 17.7 82.3 2.4 31.4 68.6 7.4 13.6 86.4 SWTS
Malawi 2012 17.6 24.5 75.5 8.9 32.3 67.7 25.5 22.1 77.9 SWTS
Mexico 2010 24.2 17.0 83.0 10.8 47.2 52.8 36.9 8.5 91.5 LFS
Moldova, Rep. 2010 35.0 9.3 90.7 37.9 10.1 89.9 32.1 8.2 91.8 LFS
Moldova, Rep. 2013 28.8 18.0 82.0 22.6 35.3 64.7 33.8 8.7 91.3 SWTS
Mongolia 2006 20.9 23.1 76.9 17.8 28.8 71.2 23.8 19.1 80.9 LFS
Nepal 2013 11.9 30.6 69.4 7.4 48.3 51.7 17.4 21.7 78.3 SWTS
Nicaragua 2005 26.4 13.6 86.4 10.7 38.2 61.8 42.6 7.2 92.8 HS
Occupied Palestinian Territory 2013 35.0 34.4 65.6 23.6 69.4 30.6 46.2 16.7 83.3 SWTS
Peru (urban) 2013 17.9 19.4 80.6 9.4 30.0 70.0 26.2 15.8 84.2 SWTS
Russian Federation 2012 15.6 35.5 64.5 10.6 57.5 42.5 20.5 24.3 75.7 SWTS
Samoa 2012 43.5 9.4 90.6 42.6 10.2 89.8 44.5 8.6 91.4 SWTS
Serbia 2010 25.2 60.6 39.4 24.1 67.2 32.8 26.4 53.7 46.3 LFS
Tanzania 2013 31.8 30.8 69.2 22.0 35.8 64.2 42.1 28.0 72.0 SWTS
Togo 2012 10.9 27.5 72.5 6.6 42.3 57.7 14.6 21.9 78.1 SWTS
Tunisia 2013 32.2 44.4 55.6 22.5 72.9 27.1 42.3 28.9 71.1 SWTS
Uganda 2005 8.3 29.0 71.0 4.3 51.4 48.6 11.8 21.8 78.2 HS
Uganda 2013 12.2 22.1 77.9 7.1 32.8 67.2 16.9 18.1 81.9 SWTS
Ukraine 2012 18.7 36.6 63.4 12.7 65.2 34.8 25.0 21.5 78.5 SWTS
Viet Nam 2012 11.1 15.1 84.9 9.9 18.7 81.3 12.4 12.4 87.6 SWTS
Zambia 2012 28.3 28.0 72.0 22.1 35.2 64.8 34.2 23.5 76.5 SWTS
Notes: The age band is 15-29 except for Argentina which is 18-29. CLS = Child labour survey; HS = Household survey; LFS = Labour force survey; SWTS = School-to-work transition survey.
Source: Author’s calculations based on the “youthSTATs” database, available at www.ilo.org/ilostat.
13
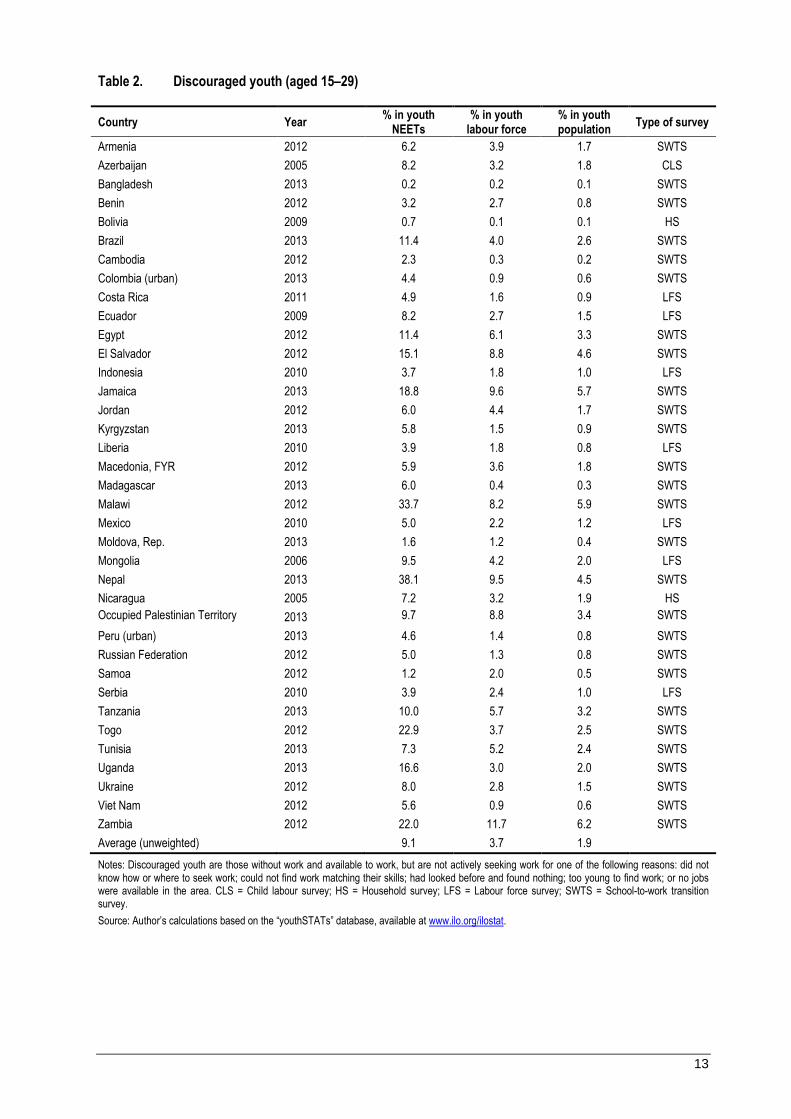
Table 2. Discouraged youth (aged 15–29)
Country Year % in youth
NEETs % in youth
labour force % in youth population
Type of survey
Armenia 2012 6.2 3.9 1.7 SWTS
Azerbaijan 2005 8.2 3.2 1.8 CLS
Bangladesh 2013 0.2 0.2 0.1 SWTS
Benin 2012 3.2 2.7 0.8 SWTS
Bolivia 2009 0.7 0.1 0.1 HS
Brazil 2013 11.4 4.0 2.6 SWTS
Cambodia 2012 2.3 0.3 0.2 SWTS
Colombia (urban) 2013 4.4 0.9 0.6 SWTS
Costa Rica 2011 4.9 1.6 0.9 LFS
Ecuador 2009 8.2 2.7 1.5 LFS
Egypt 2012 11.4 6.1 3.3 SWTS
El Salvador 2012 15.1 8.8 4.6 SWTS
Indonesia 2010 3.7 1.8 1.0 LFS
Jamaica 2013 18.8 9.6 5.7 SWTS
Jordan 2012 6.0 4.4 1.7 SWTS
Kyrgyzstan 2013 5.8 1.5 0.9 SWTS
Liberia 2010 3.9 1.8 0.8 LFS
Macedonia, FYR 2012 5.9 3.6 1.8 SWTS
Madagascar 2013 6.0 0.4 0.3 SWTS
Malawi 2012 33.7 8.2 5.9 SWTS
Mexico 2010 5.0 2.2 1.2 LFS
Moldova, Rep. 2013 1.6 1.2 0.4 SWTS
Mongolia 2006 9.5 4.2 2.0 LFS
Nepal 2013 38.1 9.5 4.5 SWTS
Nicaragua 2005 7.2 3.2 1.9 HS
Occupied Palestinian Territory 2013 9.7 8.8 3.4 SWTS
Peru (urban) 2013 4.6 1.4 0.8 SWTS
Russian Federation 2012 5.0 1.3 0.8 SWTS
Samoa 2012 1.2 2.0 0.5 SWTS
Serbia 2010 3.9 2.4 1.0 LFS
Tanzania 2013 10.0 5.7 3.2 SWTS
Togo 2012 22.9 3.7 2.5 SWTS
Tunisia 2013 7.3 5.2 2.4 SWTS
Uganda 2013 16.6 3.0 2.0 SWTS
Ukraine 2012 8.0 2.8 1.5 SWTS
Viet Nam 2012 5.6 0.9 0.6 SWTS
Zambia 2012 22.0 11.7 6.2 SWTS
Average (unweighted) 9.1 3.7 1.9
Notes: Discouraged youth are those without work and available to work, but are not actively seeking work for one of the following reasons: did not know how or where to seek work; could not find work matching their skills; had looked before and found nothing; too young to find work; or no jobs were available in the area. CLS = Child labour survey; HS = Household survey; LFS = Labour force survey; SWTS = School-to-work transition survey.
Source: Author’s calculations based on the “youthSTATs” database, available at www.ilo.org/ilostat.

Youth Employment Programme - 4 route des Morillons - CH-1211 Genève 22 - www.ilo.org/w4y
Tertgefpa èrghiésdfgkdéagjiq


![Servimos a las personas [ ] Servimos a las personas El Servicio …dgreports/@dcomm... · 2014-06-09 · nanciados con cargo a impuestos. «Los cambios en la estructura familiar se](https://img.pdfslide.net/doc/110x75/5f73f22ddf9a9603c351f089/servimos-a-las-personas-servimos-a-las-personas-el-servicio-dgreportsdcomm.jpg)