Embed Size (px)
Citation preview

toyou?
What doesproduct development
mean

2001 annual
report

W H AT D O E S P R O D U C T D E V E L O P M E N T M E A N TO YO U ?
To Our Shareholders — Competitive Advantage — Financial Results and Outlook
W H AT D O E S P R O D U C T D E V E L O P M E N T M E A N TO C U S TO M E R S ?
The Power to Create — The Power to Collaborate — The Power to Control
Customers > Ingersoll-Rand — Royal Appliance — CargoLifter
W H AT D O E S P R O D U C T D E V E L O P M E N T M E A N TO PA R T N E R S ?
Systems Integrators — Resellers — Platform and Service Partners
Partners > Accenture — Andersen — Cap Gemini Ernst & Young
CSC — Deloitte Consulting — KPMG Consulting — TRW
W H AT D O E S P R O D U C T D E V E L O P M E N T M E A N TO P TC ?
Innovation — Customer Intimacy — Operational Excellence
Directors — Officers — Shareholder Information
P TC F I N A N C I A L S F O R 2 0 01
PTC Annual Report on Form 10-K for 2001 — Appendices
2001 annual
report
In this year’s annual report, we discuss the meaning of product development to our various
constituencies: customers, partners, shareholders, and ourselves here at PTC. While each group
sees product development a bit differently depending on individual needs and opportunities,
there is one thing we can all agree on: Product Development Means BusinessTM.
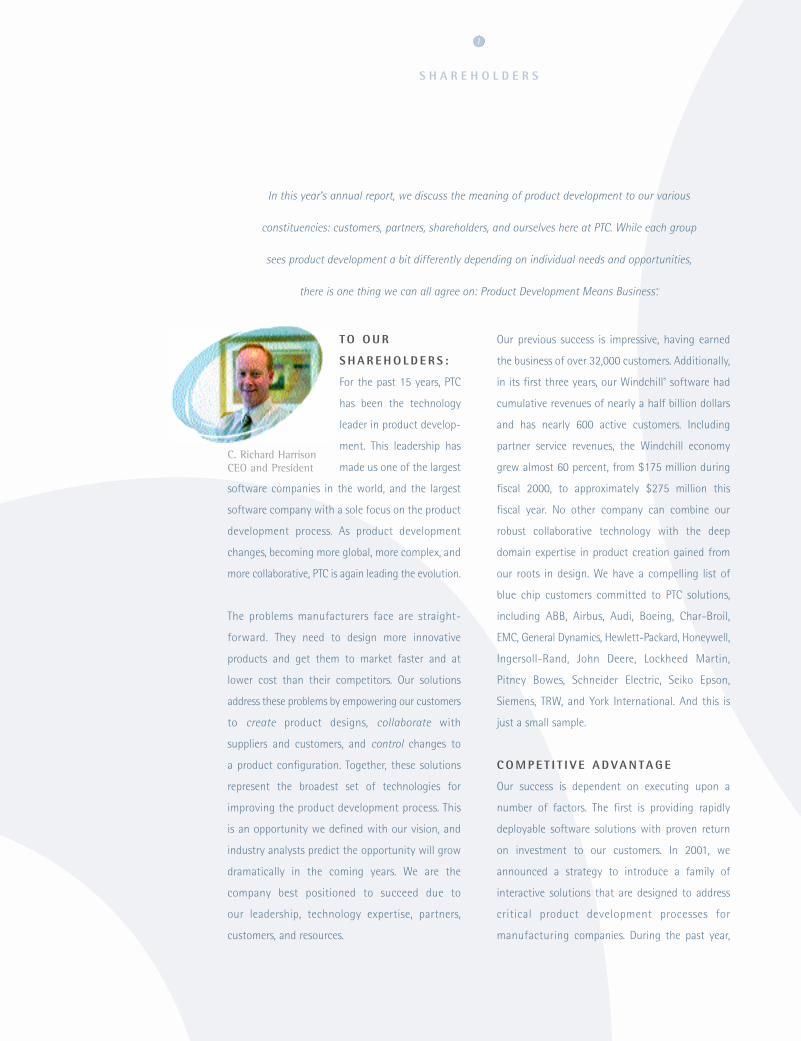
TO O U R
S H A R E H O L D E R S :
For the past 15 years, PTC
has been the technology
leader in product develop-
ment. This leadership has
made us one of the largest
software companies in the world, and the largest
software company with a sole focus on the product
development process. As product development
changes, becoming more global, more complex, and
more collaborative, PTC is again leading the evolution.
The problems manufacturers face are straight-
forward. They need to design more innovative
products and get them to market faster and at
lower cost than their competitors. Our solutions
address these problems by empowering our customers
to create product designs, collaborate with
suppliers and customers, and control changes to
a product configuration. Together, these solutions
represent the broadest set of technologies for
improving the product development process. This
is an opportunity we defined with our vision, and
industry analysts predict the opportunity will grow
dramatically in the coming years. We are the
company best positioned to succeed due to
our leadership, technology expertise, partners,
customers, and resources.
Our previous success is impressive, having earned
the business of over 32,000 customers. Additionally,
in its first three years, our Windchill® software had
cumulative revenues of nearly a half billion dollars
and has nearly 600 active customers. Including
partner service revenues, the Windchill economy
grew almost 60 percent, from $175 million during
fiscal 2000, to approximately $275 million this
fiscal year. No other company can combine our
robust collaborative technology with the deep
domain expertise in product creation gained from
our roots in design. We have a compelling list of
blue chip customers committed to PTC solutions,
including ABB, Airbus, Audi, Boeing, Char-Broil,
EMC, General Dynamics, Hewlett-Packard, Honeywell,
Ingersoll-Rand, John Deere, Lockheed Martin,
Pitney Bowes, Schneider Electric, Seiko Epson,
Siemens, TRW, and York International. And this is
just a small sample.
C O M P E T I T I V E A D VA N TA G E
Our success is dependent on executing upon a
number of factors. The first is providing rapidly
deployable software solutions with proven return
on investment to our customers. In 2001, we
announced a strategy to introduce a family of
interactive solutions that are designed to address
critical product development processes for
manufacturing companies. During the past year,
S H A R E H O L D E R S
1
C. Richard Harrison CEO and President

S H A R E H O L D E R S
2
we launched PTC® ProjectLink™ for project collab-
oration, which can be implemented in as little as 10
days and provides clearly demonstrable cost and
time savings. We also launched PTC® PartsLink™,
which enables suppliers to produce Web-based,
highly interactive catalogs of standard parts
designs and allows manufacturers to expedite their
design and sourcing processes. In December 2001,
we launched PTC® DynamicDesignLink™— our
collaborative application engineering solution,
which gives a manufacturer’s engineers, sales
reps, distributors, dealers, and even customers the
ability to customize engineered products over the
Web. In fiscal 2002, we intend to launch new PTC
solutions as well as release our enterprise
Windchill solution, version 6.2, which enables us
to meet the collaboration and control needs of
manufacturing companies of all sizes.
We also expanded the functionality and usability
of our design solutions with our release of
Pro/ENGINEER® 2001 last summer. In addition, we
introduced Pro/COLLABORATE™, a unique service
for active Pro/ENGINEER customers that enables
project collaboration with critical design partners.
Pro/COLLABORATE is PTC’s first step in more tightly
integrating our creation, collaboration, and control
solutions to deliver a unified product development
suite to global manufacturers. Our plans for a
Web-enabled Pro/ENGINEER 2002 will integrate
even more aspects of our collaboration and
control solutions. We have seen Pro/COLLABORATE
drive interest for our PTC ProjectLink solution
within our broad customer base. We expect the
Web-enabled Pro/ENGINEER 2002 solution to
further solidify customer commitment to our total
solution set.
The second success factor is sales coverage
optimization. Over the past year, we have increased
our focus on vertical industries and major accounts
and more closely aligned our accounts with our
systems integrator partner accounts. We believe we
have the strongest network of systems integrator
partners in the industry. Indeed, the top consulting
firms have built strategic initiatives around a
strategic product set that generally includes
selected companies for enterprise resource
planning and customer relationship management,
and PTC for Collaborative Product Development.
At fiscal year end, we had trained over 500 of our
partners’ consultants to plan and deploy Windchill
implementations. Moreover, Windchill-related revenue
billed directly by our systems integrator partners
exceeded $23 million in the fourth quarter and was
over $60 million for the fiscal year. And for the
fourth quarter of 2001, we estimate that partner-
influenced revenue rose to 50 percent of Windchill
license revenue. This suggests that our partner
program is helping Windchill expand its footprint
in the marketplace, and supports our belief that
our partners will help drive revenue growth in the
future. For this reason, we have invested heavily in
growing our partner program.
Over time, we believe a committed and successful
community of systems integrators will expand our
Windchill license business by shortening sales
cycles, establishing us at more senior levels within
S H A R E H O L D E R S
3
our prospects, and enhancing the credibility of our
solutions. Additionally, we have increased our sales
coverage by investing in inside sales and partnering
with resellers for small- and medium-sized customers.
These investments also improve our profitability by
lowering our cost of sales.
The third success factor is customer referenceability
and satisfaction. We are dedicated to helping our
customers grow their product development capacity
by addressing their sources of competitive advan-
tage: product innovation, customer intimacy, and
operational excellence. We are also committed to
making it easier for our customers to do business
with PTC. This includes implementing a customer
relationship management solution, improving our
technical support program, and upgrading our
financial management system. Our employees are
committed to driving our customer success and
satisfaction, which in turn will continue to drive
PTC’s success.
F I N A N C I A L R E S U LT S A N D O U T L O O K
Our financial results for 2001 reflect the effects of a
challenging economy, compounded by unfavorable
foreign currency exchange comparisons throughout
the year. While customers generally reduced
purchases of larger-scale contracts, our base
business gained momentum in this difficult selling
environment. During the fourth quarter of 2001,
we reduced our fixed cost structure by approx-
imately 10 percent. This should result in about $60
million in savings in fiscal year 2002. Our 4,300
employees remain committed to profitability and
growth, and our balance sheet reflects over $250
million in cash availability with no debt. In fiscal
2001, we repurchased approximately $132 million
worth of PTC stock.
We have made good progress as a company since I
became CEO in April 2000. I continue to be
passionate about PTC because I think the best is
yet to come. We are building a growth culture. We
seek ways to help our customers grow. We seek
ways to help our partners grow. We seek ways to
help PTC grow. And when we reach these goals,
then product development will indeed mean
business for our shareholders.
I would like to thank our employees for their efforts
and also extend our thanks to our shareholders,
directors, customers, partners, and communities,
whose loyal support contributes immeasurably to
PTC’s ongoing success.
Sincerely,
C. Richard Harrison Chief Executive Officer and President

It’s not the company that makes the product.
It’s the product that makes the company.

For manufacturers, the quest for competitive advantage has never been more intense. There are only a few
ways that companies can stay ahead: decreasing time-to-market, reducing costs, enhancing quality,
improving customer service, and creating better products. Many companies have addressed cost
and quality in physical manufacturing with enterprise resource planning initiatives and are
currently addressing service through customer relationship management initiatives. But initiatives that
reduce the costs associated with physical goods create little more than competitive parity, and customer
service initiatives work well only if the company has solid products to build a loyal customer base.
In reality, creating better products is what keeps
companies ahead of the competition. But in
a changing manufacturing environment, it’s
difficult for manufacturers to know how to
improve the design process and produce the
best products quickly and efficiently.
In the past, product development meant
“engineering" to many of the world’s largest
companies. Engineers designed products with
superior CAD tools like Pro/ENGINEER and
could simply hand over their designs to the
people on the manufacturing floor. This was
an effective solution for a company that
managed the entire product life cycle within
its own four walls.
However, over the last decade, business and
market changes such as globalization and large-
scale mergers and acquisitions have created
inefficiencies in the product development
process. More and more, manufacturers are
developing products with globally dispersed
teams, using contract manufacturers, and striving
to meet mass customization requirements. For
companies that have not addressed these
changes with new business processes and
technologies, product development means
disorder, high costs, or even headaches.
To alleviate this business pain, today’s manu-
facturer must look at product development
in a new light—as a process that can be
optimized across its entire extended value
chain: engineering, sales, marketing, suppliers,
customers, manufacturing, and support. With
an estimated 70 percent of a product’s cost
built in at the design stage, manufacturers
are discovering that they can save more
time and cost through strategic product
development initiatives than they can by
optimizing the physical manufacturing
process. To these companies, product devel-
opment means significant cost savings,
competitive advantage, increased market
share, customer loyalty, and even survival.
In short, Product Development Means Business
to today’s savvy global manufacturers.
To build an unrivaled product development
capability, manufacturers need a solution that
empowers them across three axes:
T H E P O W E R TO C R E AT ESolutions for product design must boost
productivity and make it easier to create
innovative products and overcome design
problems. These solutions must also enable
C U S TO M E R S
4
With an estimated 70 percent ofa product’s cost built in at thedesign stage, manufacturers arediscovering that they can savemore time and cost throughstrategic product developmentinitiatives than they can byoptimizing the physical manu-facturing process.

“PTC gives us CPC solutions in a native Web-
based architecture that support and complete
our enterprise direction, enabling us to build
and expand our partner collaboration. Our
decision to partner with them was driven by
their financial stability, forward-looking vision, and their technological
leadership, which will enable us to achieve sustainable competitive
advantage in the Internet age. We intend to take full advantage of the
software to improve product quality, reduce costs, and accelerate the
introduction of new, innovative products.
You can’t just throw hardware and software at problems. PTC’s deep
knowledge of engineering manufacturing best practices is invaluable.
They really helped get us thinking globally. Our implementation of the
integrated PTC solution—Pro/ENGINEER and Windchill—is proving an
unqualified success. We project annual savings of $14 million for our first
business unit to implement the full solution. This ROI is more than enough
to fund the next implementation. Our goal is to standardize the entire
global business on PTC solutions by 2004.”
George Ashley, Manager of Engineering Business ServicesIngersoll-Rand
customers?
What doesproduct
developmentmean to

“The ROI of implementing PTC’s collaborative
product commerce solution has been much
greater than our initial expectations. Since we began using
Windchill, document approvals that used to take three weeks or longer
now often take as little as two to three days. The scope of what we hope
to accomplish has grown because our teams see the potential of what
Windchill can allow them to do.”
Greg Opas, Head of Engineering SupportCargoLifter
“Our partnership with PTC and Andersen has allowed us
to set the stage for long-term growth and bring our product
development process to a new level. We are now
in a position to develop innovative new products
that will take us into new markets. This global,
Web-based product development infrastructure lets us respond to customers
by efficiently delivering better quality, more innovative products—faster
than ever before. We estimate we will save up to $2 million in annual
operating costs by implementing the PTC solution.”
Michael Merriman, President and CEORoyal Appliance
users to share and collaborate on design information via the Internet. With this
capability in place, manufacturers develop and model products faster and
with greater confidence.
T H E P O W E R TO C O L L A B O R AT EEvery supplier, partner, and customer must have consistent product information
early in the design process and have the ability to work together in real time using
that information. This helps slash engineering changes and costs and significantly
speeds time-to-market. Early-stage collaboration also allows manufacturers to quickly
assemble the right product development teams to respond to design challenges and
to create products with fewer defects and higher acceptance rates.
T H E P O W E R TO C O N T R O LThe ability to control and access product information lets manufacturers quickly develop
new designs that incorporate the learning and best elements of previous designs, thereby
avoiding unnecessary and costly re-creation. This control of digital assets also ensures
that everyone in the value chain is working from the same version of a design. Finally,
access control lets manufacturers protect intellectual property and retain a complete
history of decisions for future use.
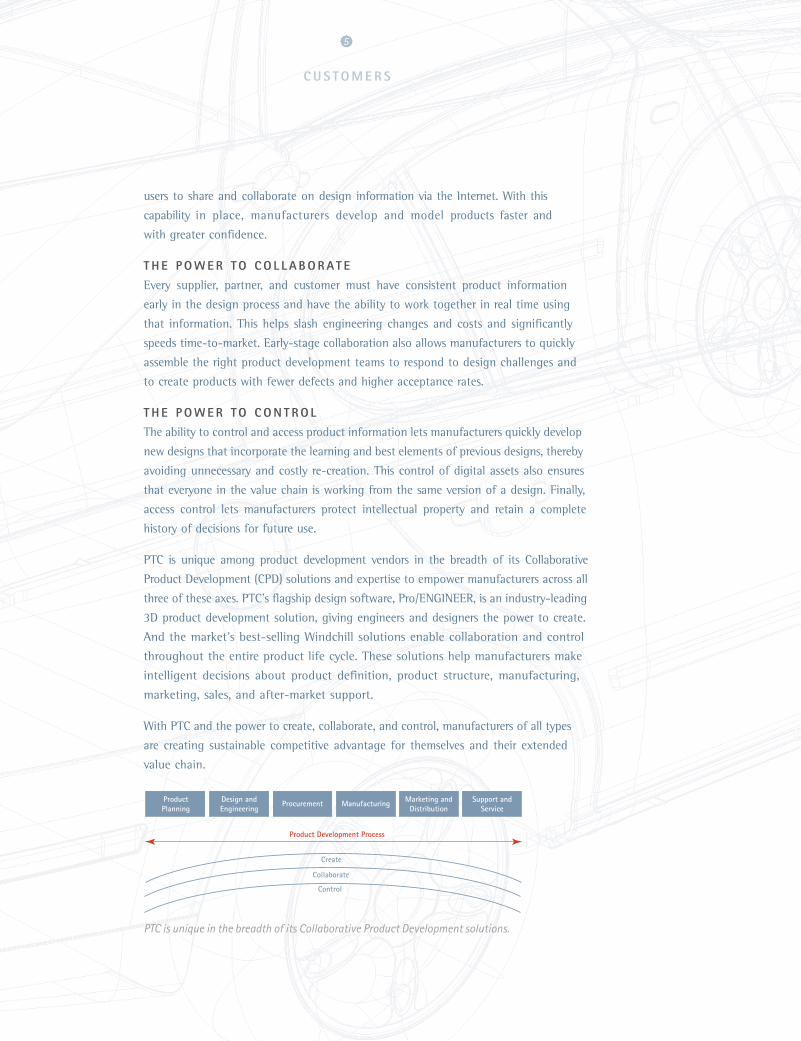
PTC is unique among product development vendors in the breadth of its Collaborative
Product Development (CPD) solutions and expertise to empower manufacturers across all
three of these axes. PTC’s flagship design software, Pro/ENGINEER, is an industry-leading
3D product development solution, giving engineers and designers the power to create.
And the market’s best-selling Windchill solutions enable collaboration and control
throughout the entire product life cycle. These solutions help manufacturers make
intelligent decisions about product definition, product structure, manufacturing,
marketing, sales, and after-market support.
With PTC and the power to create, collaborate, and control, manufacturers of all types
are creating sustainable competitive advantage for themselves and their extended
value chain.
C U S TO M E R S
5
PTC is unique in the breadth of its Collaborative Product Development solutions.

PA R T N E R S
PTC takes great pride in the broad, comprehensive solutions we supply to our customers around the world. One
of the key ingredients that makes these total solutions successful is effective strategic partnership programs
with complementary technology and service providers. PTC has established a world-class partner program,
building strong relationships with leading software and platform providers, resellers, engineering
providers, and systems integrators. We work closely with a select group of companies to smoothly integrate
leading technologies, products, and services that can be carefully tailored to each customer’s specific needs.
S Y S T E M S I N T E G R ATO R S
Product development means “opportunity"
for many of the leading global systems
integrators. These consultants are widely
recognized for identifying leading tech-
nologies and best practices that provide
significant, quantifiable business value to
their clients. Just as systems integrators
saw opportunities to consolidate targeted
ERP, CRM, and SCM technologies to form
process-oriented solutions in the last
decade, they believe product development is
the next frontier to tackle on behalf of their
manufacturing clients. They believe that
optimizing value chains early in the design
process will help their clients realize greater
value throughout the product life cycle.
Top systems integrators such as Accenture,
Andersen, Cap Gemini Ernst & Young, CSC,
Deloitte Consulting, KPMG Consulting,
PricewaterhouseCoopers, and TRW have
chosen PTC as a strategic technology
provider because of the comprehensive
nature of the Windchill solution set, our
domain expertise in product definition and
product structure, and the Windchill Net-
native architecture. Additionally, PTC has
shown an unparalleled commitment to our
systems integrator partners through our
partner-centric business model, which
requires partners to manage Windchill
implementations for large customers and
compensates our sales and service personnel
on a partner’s ability to reach its goals.
Together, PTC and its systems integrator
partners are establishing clear value
propositions for clients and delivering
greater value sooner. PTC is providing the
technology backbone systems integrators
need to build their collaborative product
development practices, and helping them to
realize faster consulting services revenue
growth through greater opportunities for
business, strategy, organization, and process
management initiatives, as well as imple-
mentation, integration, and customization
activities. Concurrently, these systems
integrator partners are helping PTC to
expand its footprint in the collaborative
product development market.
6
$25
$20
$15
$10
$5
$0Q1 Q2 Q3 Q4
SER
VIC
E R
EVEN
UE
($M
)
FY 2001
Revenue booked by PTC’s premier systems integrator
partners in FY 2001.
Including partner service rev-enues, the Windchill economygrew almost 60 percent, from$175 million during fiscal 2000,to approximately $275 millionthis fiscal year.

partners?
What doesproduct
developmentmean to
“We believe that CPC represents one of the next
significant waves of change for global business
processes. We are building our CPC practice to enable this change, utilizing
technologies like Windchill by PTC. Accenture’s focus is to address a big question
on the CEO's mind today: ‘How do I drive top-line growth while also focusing
on cost reduction, effectiveness, and productivity in my organization?’”
David B. RichGlobal Managing Partner, Electronics and High Tech
Accenture LLC
“From a success standpoint, we think CPC is going
to be table-stakes. Today’s global manufacturer
must have a product development process in place that is responsive to
customers’ needs in a rapid turnaround timeframe. PTC’s technology
solutions help us to deliver this capability to our clients.”
Brian RenstromManaging Partner, Markets Solution Practice, North America
Andersen
“Two years ago, we made a conscious decision
to partner with the dominant players in each
of our strategic marketplaces and grow those relationships to deliver truly unique
offerings. PTC is an obvious choice for our CPC practice because it shares our
global vision, and it has the scale to help us deliver on our client promises.”
Mark HauserGroup Vice President, Global Sectors and Service Lines
Cap Gemini Ernst & Young

“In our opinion, PTC has one of the industry’s best-of-
breed CPC applications. Windchill scales well to the
largest and most complex client demands, and its functionality has wide
applicability across all of our vertical markets. What we find particularly exciting is
the unique relationship TRW has with PTC, in that we are both a partner and a
customer. Consequently, we have a better understanding of the value Windchill
generates for our clients.”
Dr. Donald C. WinterPresident and CEO
TRW Systems
“Collaboration is mandatory. Its technology foundation is the
Internet and a new class of solutions like PTC’s Windchill. As
we see the Internet continuing to add velocity to collaboration, PTC's solutions as
defined by the marketplace are clearly at the forefront. We expect our relationship
with PTC to drive significant benefits for our clients as well as provide our
consultants with challenging, rewarding work.”Brad Scheller
Managing Director, Supply Chain Solution PracticeCSC
“The ability for an organization to bring innovative solutions
quickly to the marketplace, based on customer requirements,
is critical for its success. That’s why we’ve built a very significant CPC practice, and
that’s why we’ve teamed up aggressively with PTC on a go-to-market strategy.”
John SouthcottManaging Partner for Manufacturing, The Americas
Deloitte Consulting
“PTC is one of the leaders in the
Collaborative Product Commerce
market. We feel strongly about the functionality of their solution set and the depth
of their technical expertise. Through our alliance with PTC, we see
tremendous opportunity to provide CPC solutions that deliver a rapid return on
investment and provide strategic value within the industry-specific context with
which KPMG Consulting goes to market.”Bruce Culbert
Executive Vice President, CRM and SCM Global SolutionsKPMG Consulting
PA R T N E R S
7
R E S E L L E R S
Over the past year, PTC has enhanced the distribution channel for its design
software solutions through its Reseller Partner Program. The goal of the
program is to develop new market opportunities for software sales through
increased market coverage and account penetration. By partnering with
industry-leading software resellers in mechanical design, manufacturing,
simulation, and surfacing, PTC expects to be able to increase higher-margin
software license sales, more effectively support our installed base of over
32,000 customers, lower the cost of sales, and help foster a growing community
of PTC users.
To resellers, product development is the foundation of their business. The ability
to sell winning products like Pro/ENGINEER, coupled with a reseller’s technical
proficiency, enables the reseller to deliver a total solution to its customers. And
to smaller resellers, product development is synonymous with PTC, as many of
the resellers in our channel work exclusively with the Pro/ENGINEER family of
products. These resellers act as an extension of our direct sales force to provide
even the smallest design firms the attention and expertise necessary to succeed
in their businesses.
P L AT F O R M A N D
S O F T WA R E PA R T N E R S
PTC partners with many leading platform,
hardware, and software companies to
provide total solutions to our customers.
With partners such as EMC, Hewlett-
Packard, Microsoft, Oracle, and Sun, seamless interoperability for our solutions
and our customers’ existing infrastructure and software applications is
possible. In addition, strong partnerships help us to provide the highest level
of support, quality, and performance to manufacturing and design companies
that use our software solutions.
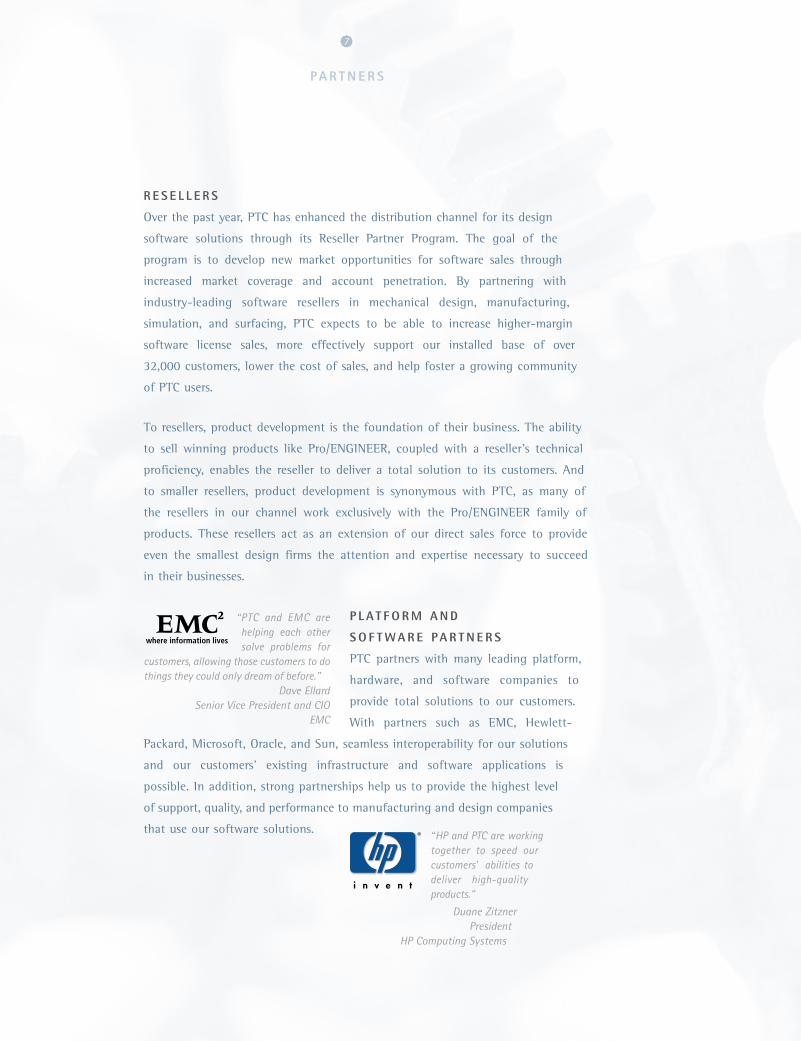
“PTC and EMC arehelping each othersolve problems for
customers, allowing those customers to dothings they could only dream of before.”
Dave EllardSenior Vice President and CIO
EMC
“HP and PTC are workingtogether to speed ourcustomers’ abilities todeliver high-qualityproducts.”
Duane ZitznerPresident
HP Computing Systems

I N N O VAT I O N
“It’s the product that makes a company,
not the other way around. Great
products hold the power to keep
existing leaders ahead and propel
new companies into market-
leading positions. Innovative
companies use Collaborative Product
Development solutions to build exciting new
products that drive brand loyalty and open up
new opportunities for revenue and growth.”
–James E. Heppelman, Executive Vice President,
Software Products, and Chief Technology Officer
C U S TO M E R I N T I M A C Y
“Improving customer satisfaction is a key ingre-
dient to a company’s success. But customer
relationship management does not begin when a
product is sold to a customer— it begins
when the product is being
designed. Opening the
product develop-
ment process
to customers
through inter-
active product catalogs and design-to-order
programs can take the relationship to new
heights.”
–Barry F. Cohen, Executive Vice President,
Marketing and Human Resources
O P E R AT I O N A L E X C E L L E N C E
“Operational excellence has become
increasingly more difficult
to achieve as design
chains become
more complex.
I m p r o v i n g
financial and
manufacturing
controls within the
enterprise no longer gives a company a
competitive edge; it only keeps a company
from falling behind. In order to attain true
operational excellence, a global manufacturer
must drive efficiencies through the entire
design chain with superior collaborative
design solutions.”
–Edwin J. Gillis, Executive Vice President,
Chief Financial Officer, and Treasurer
At PTC, we are in tune with our customers’ main business objectives. We know that in order to succeed, global
manufacturers must deliver innovative products, improve customer intimacy, and achieve operational
excellence. The product development process has the power to significantly impact all three of these objectives.
A company that fully optimizes its product development process will gain competitive advantage; those that
do not will be left behind. This is what we mean when we say, “Product Development Means Business."
P TC
8
INNOVATION
CUSTOMERINTIMACY
OPERATIONALEXCELLENCE
What doesproduct
developmentmean to
PTC?
D I R E C TO R S
Noel G. PosternakChairman of the Board of Directors, PTCSenior PartnerPosternak, Blankstein & Lund, LLP, a law firm
C. Richard HarrisonChief Executive Officer and PresidentPTC
Robert N. GoldmanChairman of the Board of DirectorseXcelon Corporation, a software developer
Donald K. GriersonExecutive DirectorABB Vetco Gray, Inc., an oil services business
Oscar B. Marx, IIIChief Executive Officer and PresidentTMW Enterprises, Inc., an auto parts business
Michael E. PorterBishop William Lawrence University ProfessorHarvard Business School, an educational institution
C O R P O R AT E O F F I C E R S
C. Richard HarrisonChief Executive Officer and President
Trenton H. BrownExecutive Vice President, International Sales
Barry F. CohenExecutive Vice President, Marketing and Human Resources
Paul J. CunninghamExecutive Vice President, Americas Sales
Edwin J. GillisExecutive Vice President, Chief Financial Officer, and Treasurer
James E. HeppelmanExecutive Vice President, Software Products, and Chief Technology Officer
Kevin P. WrennExecutive Vice President, Global Services
Thomas L. BeaudoinSenior Vice President, Finance
David R. FriedmanSenior Vice President, General Counsel, and Clerk
S H A R E H O L D E R S A N D S TO C K L I S T I N G
Our common stock is traded on the Nasdaq Stock Marketunder the symbol PMTC. On September 30, 2001, ourcommon stock was held by 6,080 shareholders of record.
D I V I D E N D S
We have not paid dividends on our common stock and have historically retained earnings for use in ourbusiness. We intend to review our policy with respect to the payment of dividends from time to time. However,there can be no assurance that any dividends will bepaid in the future.
I N V E S TO R I N F O R M AT I O N
Requests for information about PTC should be directedto: Investor Relations, PTC, 140 Kendrick Street,Needham, MA 02494-2714. Telephone: 781-370-5000. E-Mail: [email protected].
R E P O R T O N F O R M 10 - K
Stockholders may obtain additional financial informationabout PTC from our Annual Report on Form 10-K filedwith the Securities and Exchange Commission. Copies areavailable without charge upon written request.
A N N U A L M E E T I N G
The annual meeting of stockholders will be held onFebruary 14, 2002, at 9:00 a.m. at PTC headquarters, 140 Kendrick Street, Needham, MA 02494-2714.
I N T E R N E T A C C E S S
www.ptc.com
G E N E R A L C O U N S E L
Palmer & Dodge, LLP, Boston, MA
I N D E P E N D E N T A C C O U N TA N T S
PricewaterhouseCoopers LLP, Boston, MA
T R A N S F E R A G E N T A N D R E G I S T R A R
American Stock Transfer & Trust Company, New York, NY
© 2001 Parametric Technology Corporation. All rights reserved. PTC, the PTC logo, Parametric Technology Corporation, The ProductDevelopment Company, Product Development Means Business, Create Collaborate Control, Pro/ENGINEER, Pro/COLLABORATE,Windchill, PTC ProjectLink, PTC PartsLink, PTC DynamicDesignLink, and all PTC product names and logos are trademarks or registeredtrademarks of Parametric Technology Corporation or its subsidiaries in the United States and in other countries. Windows is aregistered trademark of Microsoft Corporation. All other companies and products referenced herein are trademarks or registeredtrademarks of their respective holders.

UNITED STATESSECURITIES AND EXCHANGE COMMISSION
Washington, D.C. 20549
FORM 10-K
ANNUAL REPORT UNDER SECTION 13 OR 15(d) OF THESECURITIES EXCHANGE ACT OF 1934
For the Fiscal Year Ended: September 30, 2001
Commission File Number: 0-18059
PARAMETRIC TECHNOLOGY CORPORATION(Exact name of registrant as specified in its charter)
Massachusetts 04-2866152(State or other jurisdiction ofincorporation or organization)
(I.R.S. EmployerIdentification Number)
140 Kendrick Street, Needham, MA 02494(Address of principal executive offices, including zip code)
(781) 370-5000(Registrant’s telephone number, including area code)
Securities registered pursuant toSection 12(b) of the Act:
Securities registered pursuant toSection 12(g) of the Act:
None Common Stock, $.01 par value per share(Title of Class)
Indicate by check mark whether the registrant (i) has filed all reports required to be filed by Section 13 or 15(d)of the Securities Exchange Act of 1934 during the preceding 12 months (or for such shorter period that theregistrant was required to file such reports) and (ii) has been subject to such filing requirements for the past 90days. YES È NO ‘
Indicate by check mark if disclosure of delinquent filers pursuant to Item 405 of Regulation S-K is not containedherein and will not be contained, to the best of the registrant’s knowledge, in definitive proxy or informationstatements incorporated by reference in Part III of this Form 10-K, or any amendment to this Form 10-K. È
The aggregate market value of our voting stock held by non-affiliates was approximately $1,823,291,263 onOctober 31, 2001 based on the last reported sale price of our common stock on The Nasdaq Stock Market on thatday. There were 260,537,639 shares of our common stock outstanding on that day.
DOCUMENTS INCORPORATED BY REFERENCE
Portions of the definitive Proxy Statement in connection with the Annual Meeting of Stockholders to be heldFebruary 14, 2002 (2002 Proxy Statement) are incorporated by reference into Part III.

PARAMETRIC TECHNOLOGY CORPORATION
ANNUAL REPORT ON FORM 10-K FOR FISCAL YEAR 2001
Table of ContentsPage
PART I.
Item 1. Business . . . . . . . . . . . . . . . . . . . . . . . . . . . . . . . . . . . . . . . . . . . . . . . . . . . . . . . . . . . . . . . . . . . . 1
Item 1A. Executive Officers of the Registrant . . . . . . . . . . . . . . . . . . . . . . . . . . . . . . . . . . . . . . . . . . . . . . 6
Item 2. Properties . . . . . . . . . . . . . . . . . . . . . . . . . . . . . . . . . . . . . . . . . . . . . . . . . . . . . . . . . . . . . . . . . . . 6
Item 3. Legal Proceedings . . . . . . . . . . . . . . . . . . . . . . . . . . . . . . . . . . . . . . . . . . . . . . . . . . . . . . . . . . . . 6
Item 4. Submission of Matters to a Vote of Security Holders . . . . . . . . . . . . . . . . . . . . . . . . . . . . . . . . . 7
PART II.
Item 5. Market for Registrant’s Common Equity and Related Stockholder Matters . . . . . . . . . . . . . . . . 7
Item 6. Selected Financial Data . . . . . . . . . . . . . . . . . . . . . . . . . . . . . . . . . . . . . . . . . . . . . . . . . . . . . . . . 7
Item 7. Management’s Discussion and Analysis of Financial Condition and Results of Operations . . . 7
Item 7A. Quantitative and Qualitative Disclosures about Market Risk . . . . . . . . . . . . . . . . . . . . . . . . . . . 23
Item 8. Financial Statements and Supplementary Data . . . . . . . . . . . . . . . . . . . . . . . . . . . . . . . . . . . . . . 24
Item 9. Changes in and Disagreements with Accountants on Accounting and Financial Disclosure . . . 24
PART III.
Item 10. Directors and Executive Officers of the Registrant . . . . . . . . . . . . . . . . . . . . . . . . . . . . . . . . . . . 24
Item 11. Executive Compensation . . . . . . . . . . . . . . . . . . . . . . . . . . . . . . . . . . . . . . . . . . . . . . . . . . . . . . . 25
Item 12. Security Ownership of Certain Beneficial Owners and Management . . . . . . . . . . . . . . . . . . . . . 26
Item 13. Certain Relationships and Related Transactions . . . . . . . . . . . . . . . . . . . . . . . . . . . . . . . . . . . . . 26
PART IV.
Item 14. Exhibits, Financial Statement Schedules and Reports on Form 8-K . . . . . . . . . . . . . . . . . . . . . . 26
Signatures . . . . . . . . . . . . . . . . . . . . . . . . . . . . . . . . . . . . . . . . . . . . . . . . . . . . . . . . . . . . . . . . . . . 27
Exhibit Index . . . . . . . . . . . . . . . . . . . . . . . . . . . . . . . . . . . . . . . . . . . . . . . . . . . . . . . . . . . . . . . . 28
APPENDIX A
Consolidated Financial Statements . . . . . . . . . . . . . . . . . . . . . . . . . . . . . . . . . . . . . . . . . . . . . . . F-1
Notes to Consolidated Financial Statements . . . . . . . . . . . . . . . . . . . . . . . . . . . . . . . . . . . . . . . . F-5
Report of Independent Accountants . . . . . . . . . . . . . . . . . . . . . . . . . . . . . . . . . . . . . . . . . . . . . . . F-23
Five Year Summary of Selected Financial Data . . . . . . . . . . . . . . . . . . . . . . . . . . . . . . . . . . . . . F-24
Quarterly Financial Information . . . . . . . . . . . . . . . . . . . . . . . . . . . . . . . . . . . . . . . . . . . . . . . . . F-24
i
Forward-Looking Statements
Statements in this Annual Report on Form 10-K about our anticipated financial results and growth, as well asabout the development of our products and our markets, are forward-looking statements that are based on ourcurrent plans and assumptions. Important information about the basis for these plans and assumptions andcertain factors that may cause our actual results to differ materially from these statements is discussed in“Management’s Discussion and Analysis of Financial Condition and Results of Operations” beginning on page7 below, and generally throughout this report.
PART I
ITEM 1: BusinessIntroduction
Parametric Technology Corporation (PTC), founded in 1985 and headquartered in Needham, MA, develops,markets and supports collaborative product development (CPD) software solutions that help manufacturersimprove the competitiveness of their products and product development processes. Our solutions, which includea suite of mechanical computer-aided design tools (our design solutions) and a range of Internet-basedcollaboration technologies (our collaboration and control solutions), enable manufacturing companies to createvirtual computer based products (digital products), collaborate on designs within the enterprise and throughoutthe extended supply chain, and control the digital product information throughout the product lifecycle. Thisresults in streamlined engineering processes, improved product quality, optimized product informationmanagement and reduced cost and time-to-market cycles. Our CPD software solutions are complemented by thestrength and experience of our Global Services Organization, as well as our systems integrators and otherstrategic partners, who provide training, consulting, ancillary product offerings, implementation and support tocustomers worldwide.
Our CPD software and services solutions permit individuals—regardless of their roles in the commercializationof a product, the computer-based tools they use, or their location geographically or in the supply chain—toparticipate in and impact the product development process across the manufacturing value chain. Our designsolutions provide our customers with industry-leading product development, manufacturing and engineeringdesign tools. With our collaboration and control solutions we cover many smaller, previously isolated marketsthat address various phases of the product lifecycle, such as product data management (PDM), component andsupplier management (CSM), visualization and digital mockup, enterprise application integration (EAI), programand project management, manufacturing planning and maintenance, repair and overhaul (MRO).
Products and Services
PTC has aligned its two business units under a common product strategy to meet the changing needs ofmanufacturers. The strategy allows PTC to capitalize on existing product synergies and offer fully leveragedsolutions that enable the creation, collaboration and control of digital product information across the extendeddesign chain.
DESIGN SOLUTIONS
Our family of engineering design software encompasses a broad spectrum of engineering disciplines essential tothe development of virtually all manufactured products, ranging from consumer products to jet aircraft.Manufacturers compete on the basis of cost, time to market and product performance criteria, which aresignificantly affected by the quality and length of the product development process. These tools offer high-performance, fully integrated solutions available on all leading hardware platforms (including Windows® native
1

solutions) that enable end-users to reduce their time to market and manufacturing costs for their products and toimprove product quality by easily evaluating multiple design alternatives and sharing data with bi-directionalassociativity. Our design software suite includes our Pro/ENGINEER® family of solutions, as well as otherproducts for design, surfacing, visualization, and analysis. Our design suite includes:
Pro/ENGINEER®—our cornerstone mechanical design automation technology is based on the industry’smost robust, parametric, feature-based solid modeler—enabling changes made during the design process tobe associatively updated throughout the design. These features, along with its “Designed for Windows XP®”user-interface, allow companies to create more innovative, differentiated and functional products morequickly and easily than ever before.
Pro/COLLABORATE™—launched in 2001, a service for active Pro/ENGINEER customers based onPTC® ProjectLink™. The service allows engineers to share information and actively collaborate acrossthe design chain in a hosted application environment. The service is intended to further differentiatePro/ENGINEER from competitive design offerings and to provide Pro/ENGINEER users with a sample ofthe functionality available through our Windchill-based software solutions.
Pro/MECHANICA®—our functional simulation software allows users to evaluate and optimize themechanical performance of product designs in real-world situations, reducing the need for expensivephysical prototypes and enhancing overall product quality.
Pro/INTRALINK®—our workgroup management solution for product development usingPro/ENGINEER. It lets Pro/ENGINEER users facilitate design team collaboration and manages the powerof Pro/ENGINEER associativity. Its dynamic collaborative environment supports the rapid and effectivedesign approach of Pro/ENGINEER.
Pro/DESKTOP®—our conceptual engineering solution which delivers industry proven modelingtechnology within an instantly familiar user interface and enables rapid and efficient capture of productdesign ideas. Associative interoperability with Pro/ENGINEER makes Pro/DESKTOP the perfect tool forengineers working together or within a collaborative design environment.
Granite™ One—a licensable software development kernel based on the geometry, feature, graphics anddata exchange capabilities at the core of Pro/ENGINEER. Granite One is an open platform that enablesinteroperability between CAD, CAM and CAE products.
COLLABORATION AND CONTROL SOLUTIONS
These offerings are a comprehensive set of business software technologies for collaboration and controlthroughout the product lifecycle. Built around the Windchill® federated, Net-native architecture, these offeringsenable manufacturers to leverage the Internet in their product development and delivery process from conceptionthrough product retirement. These tools enable manufacturers to deliver innovative new products to market fasterand manage the complexities of product development throughout an evolving supply chain.
Windchill® Enterprise
The Windchill Enterprise software solution set is highly customizable with core capabilities in:
Collaboration. Provides an environment where businesses can share valuable product and processinformation throughout the extended enterprise, regardless of where that information resides or in whatformat it is.
2
Product Planning. Enables businesses to meet the increasing demand for custom-tailored products whileminimizing the overall number of product variations. This is accomplished by providing the means to defineengineered-to-order products, supply customer-specific portals and easily identify existing variations forfuture reuse.
Engineering. Optimizes the product innovation and design environment to reduce concept-to-design cycletimes and improve team collaboration by linking directly with the engineering team using MCAD interfaceand PDM tools.
Sourcing. Gives manufacturers the ability to reduce global procurement and product development costsby standardizing and consolidating part and supplier information. The solution enables companies toidentify re-usable parts, commercially available solutions and preferred sources.
Product Management. Offers a complete set of enterprise scalable PDM functionality to promoteconcurrent engineering and to create a single source of product information available to all functionalorganizations, facilitating product change management throughout the entire product life cycle.
Manufacturing. Integrates a company’s product development and design with its manufacturingprocesses by creating and maintaining detailed process plans and executing production analysis and processsimulation. This solution allows companies to increase information capture and reuse, optimizemanufacturing processes and share this knowledge across the enterprise.
Production. Integrates Windchill with market-leading enterprise resource planning systems allowing theexchange of valuable product-related information including part masters, bills of material and engineeringchange information, between Windchill and those systems.
Customization. Lets manufacturers create and deploy customized Windchill lifecycle applicationsallowing them to leverage their own internal processes and practices into a competitive advantage.
PTC® Solutions
In 2001, we announced a plan to introduce a family of interactive solutions that are designed to address specificbusiness critical manufacturing functions. These solutions include pre-configured, fully integrated applicationsthat utilize the Net-native Windchill architecture, as well as components of our Pro/ENGINEER design solutions.The solutions require little customization and can be implemented quickly. In calendar 2001, PTC launched threeof these solutions:
PTC® ProjectLink™—our Net-native workspace tool that advances the ability of geographically andorganizationally dispersed project teams to collaborate on highly iterative design projects.
PTC® PartsLink™—our interactive product catalog solution that gives suppliers of electronic andmechanical products the ability to publish and distribute technical product information, including productdesign models, directly to their customers in an interactive Net-native catalog environment.
PTC® DynamicDesignLink™—our collaborative application engineering solution that enables theinteractive definition of semi-custom products. The product provides a manufacturer’s applicationengineers, sales reps, distributors, dealers and even customers the ability to customize engineered productsover the Web.
GLOBAL SERVICES ORGANIZATION
Our CPD solutions are complemented by our systems integrators, resellers and strategic partners, as well as ourGlobal Services Organization, which is committed to providing the expertise needed to meet the consulting,
3

implementation, education and technical support requirements of our customers—in seven major support centersand more than 70 educational facilities worldwide. Our Global Services Organization focuses on:
Education services offering expert, comprehensive and efficient training programs to customers and partners onour entire product line based upon PTC’s Precision Learning formula. Programs can be tailored to the needs ofeach student and combine hands-on, web-based and classroom training and self-evaluation.
Consulting services designed to transform a company’s business process into a competitive advantage byevaluating and recommending the strategy, process, tools and practices needed to create more productiveengineering and information management environments, including long-range planning, process improvement,system implementation and product program strategies.
Technical support services providing fast, accurate answers to software and product development questionsthrough a variety of global resources.
Product Development
In order for our CPD products to be competitive, we must provide our customers with new and innovativesoftware and service solutions. As a result, we continue to spend on research and development, and we areregularly looking for opportunities to acquire new technologies suited to our customers’ needs. We must alsoefficiently manage our development resources to ensure that the appropriate balance, based on both productdevelopment plans and customer demand, is reached between product lines.
Our ability to rapidly develop new design products is facilitated by the modular structure of our software code.This enables functional capabilities of existing products to be utilized by new software modules, therebyreducing the amount of new code required to develop additional products. The major benefit of this approach israpid development of new functionality. Our Windchill technology expands the breadth of our offerings allowinga comprehensive CPD solution. Our industry is characterized by new technologies, including Internet-centric,Java-based, object-oriented software. The Windchill-based products depend upon these new technologies as wellas certain licensed third-party technologies.
We work closely with our customers to define improvements and enhancements to be integrated into ourproducts. Using this approach, customers become involved in the product design process to validate feasibilityand to influence functionality early in the product life cycle. In addition, we maintain both hardware and softwarepartner programs. These programs are designed to provide partners with access to our products and provide themechanism and environment to facilitate the integration of complementary products with our product lines.Through our partner programs, members receive the tools necessary to build tightly integrated solutions thatsatisfy the various requirements of our customers.
Our fiscal year research and development expenses were $124.1 million in 1999, $143.8 million in 2000 and$148.9 million in 2001.
Sales and Marketing
We derived most of our revenue from products distributed directly by our sales force to our end-user customers.The remainder of our products are offered through third-party distributors and we also sell certain of our designproducts over the Internet. No single customer accounted for more than 10% of our revenue in any of the lastthree fiscal years.
Within our direct sales force, we have created geographic divisions focused on the Americas and on internationalsales. Within these geographic divisions there are both major and primary accounts focused units. The major
4
accounts unit is further segmented into vertical industries based on regional characteristics. In addition, wecontinue to broaden our indirect distribution channel through alliances with systems integrators, resellers andother strategic partners. The systems integrators will work in tandem with our direct sales force to locate andtarget potential CPD opportunities. We have also signed agreements with over 150 resellers as distributors of ourcore engineering design products and intend to expand their breadth of product offerings. This program gives ourresellers the rights to distribute certain products and their related maintenance services throughout NorthAmerica, Europe and parts of Asia/Pacific.
Information about our foreign and domestic operations, and the risks thereof, may be found in Note L to theconsolidated financial statements and the section entitled “Management’s Discussion and Analysis of FinancialCondition and Results of Operations” beginning on page 7 below.
Competition
Our CPD solutions compete in a relatively new industry, sometimes called collaborative product commerce(CPC), and there are a number of companies offering solutions that address specific functional areas covered byour CPD tools such as: Dassault Systemes, the former Structural Dynamics Research Corporation (SDRC),recently acquired by Electronic Data Systems (EDS), and MatrixOne for PDM solutions; Agile Software Corp.,for bill of material management; i2 Technologies Inc. for part sourcing solutions; and Dassault Systemes andEDS for visualization and mock-up solutions. The market for our CPD solutions is also affected by companiesthat are developing these solutions in-house. In addition, larger, better-known enterprise-solution companies withestablished customers may enter the CPC market and offer more complete solutions. For example, SAP hasbegun to offer a “PLM” solution that controls product data within the larger framework of its ERP solution. Inour traditional MCAD market, we compete most directly with products developed by Dassault Systemes andproducts developed by the former Unigraphics and SDRC (both of which have been acquired by EDS). Forsmaller manufacturing businesses, we, along with our resellers, compete with products from companies likeSolidworks Corporation, a subsidiary of Dassault Systemes, and Autodesk, Inc.
Proprietary Rights
Our software products and our trademarks, including our company names, product names and logos, areproprietary. We protect our intellectual property rights in these items by relying on copyrights, trademarks,patents and common law safeguards, including trade secret protection, as well as restrictions on disclosures andtransferability contained in our agreements with other parties. Despite these measures, there can be no assurancethat the laws of all relevant jurisdictions will afford adequate protection to our products and other intellectualproperty. The software industry is characterized by frequent litigation regarding copyright, patent and otherintellectual property rights.
While we have not, to date, had any significant claims of this type asserted against us, there can be no assurancethat someone will not assert such claims against us with respect to existing or future products or other intellectualproperty or that, if asserted, we would prevail in such claims. In the event a lawsuit of this type is filed, it couldresult in significant expense to us and divert the efforts of our technical and management personnel, whether ornot we ultimately prevail.
We believe that, due to the rapid pace of innovation within our industry, factors such as the technological andcreative skills of our personnel are as important to establishing and maintaining a technology leadership positionwithin the industry as are the various legal protections surrounding our technology. We believe that our products,technology and trademarks do not infringe any existing proprietary rights of others, although there can be noassurance that third parties will not assert infringement claims in the future. Certain of our products also containtechnology developed and licensed from third parties. We may likewise be susceptible to infringement claimswith respect to these third party technologies.
5

PTC, the PTC Logo, Parametric Technology Corporation, The Product Development Company, ProductDevelopment Means Business, Create Collaborate Control, Pro/ENGINEER, Pro/DESKTOP, Pro/INTRALINK,Pro/MECHANICA, Granite, Windchill, PTC ProjectLink, PTC PartsLink, PTC DynamicDesignLink and allproduct names in the PTC product family are trademarks or registered trademarks of PTC or our subsidiaries inthe United States and/or other countries.
Backlog
We generally ship our products within 30 days after acceptance of a customer purchase order and execution of asoftware license agreement. A high percentage of our revenue has historically been generated in the third monthof each fiscal quarter, and this revenue tends to be concentrated in the later part of that month. Accordingly,orders may exist at the end of a quarter that have not been shipped and not recognized as revenue. We do notbelieve that our backlog at any particular point in time is indicative of future sales levels.
Employees
As of September 30, 2001, we had 4,533 employees, including 1,646 in sales, marketing and support activities;1,243 in customer support, training and consulting; 478 in general and administration; and 1,166 in productdevelopment. Of these employees, 2,129 were located throughout the United States and 2,404 were located inforeign countries.
ITEM 1A: Executive Officers of the Registrant
Information about our executive officers is incorporated by reference from Part III, ITEM 10 of this AnnualReport.
ITEM 2: Properties
We lease 149 offices in the United States and internationally through our foreign subsidiaries, predominately assales and/or support offices and for development work. Of our total of approximately 1,352,000 square feet ofleased facilities used in operations, approximately 724,000 square feet are located in the U.S. and 628,000 squarefeet are located in foreign countries. In December 1999, we sold land and certain improvements underconstruction and entered into a lease covering approximately 381,000 square feet of office space in Needham,Massachusetts to consolidate our Massachusetts facilities. Occupancy and rent began in December 2000 and thelease expires in December 2012, subject to certain renewal rights. Several of our leased facilities were acquiredin our merger with Computervision, including 503,000 square feet of office space in Bedford, Massachusetts stillunder lease. Approximately 498,000 square feet is not used for our current operations and is primarily subleasedto other entities. As described in Notes B and F to the consolidated financial statements, these facilities have beenincluded in our restructuring provisions. We continue to engage in subleasing and early lease terminationinitiatives to employ alternate uses for these facilities. We believe that our facilities are adequate for our presentneeds.
ITEM 3: Legal Proceedings
Certain class action lawsuits were filed by shareholders in the fourth quarter of 1998 against us and certain of ourcurrent and former officers and directors in the U.S. District Court in Massachusetts claiming violations of thefederal securities laws based on alleged misrepresentations regarding our anticipated revenue and earnings for thethird quarter of 1998. An amended complaint, consolidating these lawsuits into one action, was filed in thesecond quarter of 1999, seeking unspecified damages. In the third quarter of 1999 we filed a motion to dismissthe consolidated action. On March 29, 2001, the U.S. District Court for the District of Massachusetts granted ourmotion to dismiss and entered an order dismissing the consolidated action with prejudice. The applicable appealperiod has expired and the plantiffs have not appealed, which should conclude the litigation.
6

We are also subject to various legal proceedings and claims that arise in the ordinary course of business. Wecurrently believe that resolving these matters will not have a material adverse impact on our financial conditionor results of operations.
ITEM 4: Submission of Matters to a Vote of Security Holders
No matters were submitted to a vote of security holders during the last quarter of fiscal 2001.
PART II
ITEM 5: Market for Registrant’s Common Equity and Related Stockholder Matters
Information with respect to this item may be found in the section captioned “Quarterly Financial Information” onpage F-24 below.
On September 30, 2001, our common stock was held by 6,080 shareholders of record. We have not paid cashdividends on our common stock and have historically retained earnings for use in our business. We intend toreview our policy with respect to the payment of dividends from time to time; however, there can be noassurance that any dividends will be paid in the future.
ITEM 6: Selected Financial Data
Information with respect to this item may be found in the section captioned “Five Year Summary of SelectedFinancial Data” on page F-24 below.
ITEM 7: Management’s Discussion and Analysis of Financial Condition and Results of Operations
Forward-Looking Statements
Statements in this Annual Report on Form 10-K about our anticipated financial results and growth, as well asabout the development of our products and our markets, are forward-looking statements that are based on ourcurrent plans and assumptions. Important information about the basis for these plans and assumptions andcertain factors that may cause our actual results to differ materially from these statements is contained belowand in “Important Factors That May Affect Future Results” beginning on page 16. Unless otherwise indicated,all references to a year reflect our fiscal year that ends on September 30.
Business Overview
Historically, our core business focus has been to provide design solutions to customers through our flagshipPro/ENGINEER® design software, and we continue to provide our customers with industry leading engineeringdesign solutions based on this software. We believe that there is a growing demand for collaborative productdevelopment (CPD) solutions from manufacturers who, in order to stay competitive, must deliver more custom-tailored goods faster and at lower prices while relying more than ever before on geographically dispersed anddynamic supply chains. CPD solutions include design/creation, collaboration and control software tools andservices that utilize Internet technologies to permit individuals—regardless of their role in the commercializationof a product, the computer-based tools they use, or their location geographically in the supply chain—tocollaboratively design, develop, build and manage products throughout their entire lifecycle. In 1998 weintroduced our web-based Windchill® information management and collaboration software which works acrossthe complete product lifecycle, from product planning and design through manufacturing, distribution andretirement. In 2001, we announced a plan to introduce a series of point solutions that utilize the web-based
7

Windchill architecture, each designed to address business-critical manufacturing functions. In the second quarterof 2001, we introduced the first of these solutions, PTC® ProjectLink™, a web-based workspace tool thatadvances the ability of geographically and organizationally dispersed project teams to collaborate on highlyiterative design projects. In the fourth quarter of 2001, we introduced PTC® PartsLink™, a web-based interactiveproduct catalog solution, that gives suppliers of electronic and mechanical products the ability to publish anddistribute technical product information, including product design models, directly to their customers in aninteractive, web-based catalog environment. In the first quarter of 2002, we introducedPTC® DynamicDesignLink™, a web-based collaborative application engineering solution that enables amanufacturer’s application engineers, sales reps, distributors, dealers and even customers the ability to customizeengineered products over the web. These three solutions are part of our overall PTC solutions strategy to providea complete portfolio of CPD solutions that address specific business challenges that occur at various points in theproduct lifecycle. Further solutions are expected to follow in fiscal 2002.
In 2000, we reorganized ourselves into Windchill and MCAD business units in order to provide more discreteproduct line focus and accountability and to improve our overall profitability. In 2001, these business units werecombined under a common product strategy in order to capitalize on existing synergies while continuing tomaintain individual solution development. In line with this strategy, both business units, including research anddevelopment, product marketing, and operations, now report to our Executive Vice President, Software Productsand Chief Technology Officer who is responsible for the strategic vision and execution of all of our solutions.
All of our solutions continue to be distributed primarily through our direct sales force. In tandem with our directsales force, we utilize an inside sales group focused predominately on telesales and existing accounts. Ourindirect distribution channel has been broadened over the last fiscal year through alliances with systemintegrators, resellers and other strategic partners. The system integrator partners have begun to work in tandemwith our direct sales force to locate and target potential CPD opportunities. We have also increased the numberof distributors for our design solutions to provide greater geographic coverage. While we do not expect thesedistributor relationships to have any significant immediate impact, we expect the broadening of our distributionchannel will, over time, yield greater market penetration.
Results of Operations
The following is an overview of our results of operations for the last three years:
• Total revenue was $1,057.6 million for 1999, $928.4 million for 2000 and $934.6 million for 2001.
• Our year-over-year revenue decreased 12% from 1999 to 2000 and increased 1% from 2000 to 2001.
• Windchill-based solutions revenue increased from $81.3 million in 1999 to $174.7 million in 2000 andto $213.9 million in 2001.
• Design solutions revenue decreased from $976.3 million in 1999 to $753.7 million in 2000 and to$720.7 million in 2001.
• Acquisition, nonrecurring charges and write-down of investments were $53.3 million in 1999, $21.5million in 2000 and $52.9 million in 2001.
• Amortization of goodwill and other intangible assets was $22.9 million in 1999, $38.4 million in 2000and $37.9 million in 2001.
• Net income (loss) was $119.3 million in 1999, ($4.0) million in 2000 and ($8.2) million in 2001.
• Pro forma net income, which excludes the amortization of goodwill and intangible assets, acquisitionand nonrecurring charges and write-down of investments, was $184.4 million in 1999, $38.9 million in2000 and $57.1 million in 2001.
8

The following table shows certain consolidated financial data as a percentage of our total revenue for the lastthree years.
September 30,
1999 2000 2001
Revenue:License . . . . . . . . . . . . . . . . . . . . . . . . . . . . . . . . . . . . . . . . . . . . . . . . . . . . . . . . . . . . . . . . . 53% 41% 41%Service . . . . . . . . . . . . . . . . . . . . . . . . . . . . . . . . . . . . . . . . . . . . . . . . . . . . . . . . . . . . . . . . . 47 59 59
Total revenue . . . . . . . . . . . . . . . . . . . . . . . . . . . . . . . . . . . . . . . . . . . . . . . . . . . . . . . . 100 100 100
Costs and expenses:Cost of license revenue . . . . . . . . . . . . . . . . . . . . . . . . . . . . . . . . . . . . . . . . . . . . . . . . . . . . 1 2 2Cost of service revenue . . . . . . . . . . . . . . . . . . . . . . . . . . . . . . . . . . . . . . . . . . . . . . . . . . . . 18 25 25Sales and marketing . . . . . . . . . . . . . . . . . . . . . . . . . . . . . . . . . . . . . . . . . . . . . . . . . . . . . . . 39 45 41Research and development . . . . . . . . . . . . . . . . . . . . . . . . . . . . . . . . . . . . . . . . . . . . . . . . . . 12 15 16General and administrative . . . . . . . . . . . . . . . . . . . . . . . . . . . . . . . . . . . . . . . . . . . . . . . . . 6 8 8Amortization of goodwill and other intangible assets . . . . . . . . . . . . . . . . . . . . . . . . . . . . . 2 4 4Acquisition and nonrecurring charges . . . . . . . . . . . . . . . . . . . . . . . . . . . . . . . . . . . . . . . . . 5 2 4
Total costs and expenses . . . . . . . . . . . . . . . . . . . . . . . . . . . . . . . . . . . . . . . . . . . . . . . 83 101 100
Operating income (loss) 17 (1) —Interest income . . . . . . . . . . . . . . . . . . . . . . . . . . . . . . . . . . . . . . . . . . . . . . . . . . . . . . . . . . . 1 1 1Other expense, net . . . . . . . . . . . . . . . . . . . . . . . . . . . . . . . . . . . . . . . . . . . . . . . . . . . . . . . . (1) — (1)Write-down of investments . . . . . . . . . . . . . . . . . . . . . . . . . . . . . . . . . . . . . . . . . . . . . . . . . — — (1)
Income (loss) before income taxes . . . . . . . . . . . . . . . . . . . . . . . . . . . . . . . . . . . . . . . . . . . . . . . 17 — (1)Provision (benefit) for income taxes . . . . . . . . . . . . . . . . . . . . . . . . . . . . . . . . . . . . . . . . . . 6 — —
Net income (loss) . . . . . . . . . . . . . . . . . . . . . . . . . . . . . . . . . . . . . . . . . . . . . . . . . . . . . . . . . . . . . 11% —% (1)%
Pro forma, excluding amortization of goodwill and intangible assets, acquisition andnonrecurring charges and write-down of investments:
Operating income . . . . . . . . . . . . . . . . . . . . . . . . . . . . . . . . . . . . . . . . . . . . . . . . . . . . . . . . . . . . . 24% 6% 8%Net income . . . . . . . . . . . . . . . . . . . . . . . . . . . . . . . . . . . . . . . . . . . . . . . . . . . . . . . . . . . . . . . . . . 17% 4% 6%
Revenue
Total Revenue
Our revenue consists of software license revenue and service revenue. Overall, our total revenue increased 1% in2001 compared to 2000 after a decrease of 12% in 2000 compared to 1999. Total revenue in 2001 and 2000reflects an increase in our total Windchill-based solutions revenue and a decrease in our total design solutionsrevenue. Total revenue was adversely affected by increased weakness in the global manufacturing economy andthe impact of the strong dollar overseas.
We derived 56%, 59% and 56% of our total revenue from sales to international customers in 1999, 2000 and2001, respectively. The decrease in international revenue as a percentage of overall revenue in 2001 is a result ofincreased revenue in the North America region and decreased international revenue due in part to weakness indemand as a result of weakening economic conditions in Europe and to unfavorable foreign currency ratefluctuations compared to 2000.
Total license revenue increased 1% in 2001 compared to 2000 and decreased 33% in 2000 compared to 1999.Service revenue, which is derived from the sale of software maintenance contracts and the performance oftraining and consulting services, accounted for 47% of total revenue in 1999 and 59% in both 2000 and 2001.Service revenue, which has a lower gross profit margin than license revenue, increased 1% in 2001 and 11% in2000, primarily due to growth in our installed customer base and increased training and consulting servicesperformed for Windchill-based solutions.
9

Windchill-based Solutions Revenue
Total revenue from our Windchill-based solutions grew 22% in 2001 compared to 2000 and 115% in 2000compared to 1999. In order to meet what we believe is a large market opportunity for CPD solutions, we havechanneled, over the past two years, significant resources into our Windchill technology. As a result of ourexpanded focus on providing CPD solutions, license revenue for our collaboration and control software increased3% in 2001 compared to 2000 and 65% in 2000 compared to 1999. License revenue was adversely affected bythe lack of larger customer commitments in the second half of fiscal 2001, reflecting the impact of the weaknessin the global manufacturing economy. Service revenue increased 44% in 2001 compared to 2000 and 229% in2000 compared to 1999. While we continue to derive our overall license and service revenue primarily from ourdesign solutions, our collaboration and control solutions are continuing to comprise an increasing percentage ofrevenue. Moreover, due to our growing installed customer base for our Windchill-based solutions, related servicerevenue has increased in both absolute terms and as a percentage of overall service revenue. This emphasis onlarger, more enterprise-wide solutions has, however, resulted in longer and less predictable sales cycles and morecomplex service engagements.
In order to most effectively deploy the resources needed to distribute and implement our collaboration andcontrol solutions, we have started to develop and introduce Windchill-based point solutions targeted at specificbusiness critical CPD processes. These point solutions will allow us to offer software solutions that can be botheasily and quickly implemented. We have also entered into business relationships with leading system integratorsand other strategic consultants. While these initiatives may limit opportunities for additional services revenue, webelieve that offering such point solutions and entering into these relationships will best serve to expand thecoverage of our CPD software solutions, generate additional license revenue and provide necessary expertise fortheir implementation and support.
Design Solutions Revenue
Total revenue from our mechanical and engineering software tools (our design solutions) decreased 4% in 2001compared to 2000 and 23% in 2000 compared to 1999. Total license revenue for our design solutions remainedflat in 2001 compared to 2000 and decreased 43% in 2000 compared to 1999. Service revenue decreased 7% in2001 compared to 2000 and 1% in 2000 compared to 1999. Pro/ENGINEER software unit sales decreased by 1%in 2001 and 40% in 2000 and the average selling price of this software increased 1% in 2001 and decreased by6% in 2000. Reasons for relative flatness in our design solutions revenue growth include: increased competitionin the industry from native Windows®based products offering more limited functionality at lower cost, ourtransfer of resources to our Windchill-based solutions, which reduced the sales capacity for our design solutionsproduct line and contributed to a loss of market share, a decline in large dollar license transactions with existingcustomers, weakness in the global manufacturing economy, the impact of the strong dollar overseas, and adecrease in service revenue attributable to a decline in license sales.
As part of our continued efforts to improve profitability, over the past several quarters we entered intoarrangements with over 150 new distributors for our design solutions. We expect the percentage of our designsolutions that we license through third-party distributors may increase in the future as we continue to enter intonew reseller and other distribution agreements. In 1999 and 2000, we licensed over 90% and in 2001 we licensedapproximately 87% of our products directly to end-user customers. The balance was licensed through third-partydistributors. Concentration of credit risk with respect to trade receivables is not significant except for a receivablefrom our largest distributor, which accounts for 12% and 7% of total receivables as of September 30, 2000 and2001, respectively.
10

Outlook
Looking forward, our overall performance will depend on our ability to successfully execute our commonproduct strategy, including the ability to provide our customers with an integrated, rapidly deployable and easilyusable suite of software solutions that enable creation, collaboration and control across the extended design chainwith a proven return on investment. Our success also depends on other factors, including our ability to optimizeour sales coverage through, among other things, employment of our systems integrator partners, resellers andinside sales teams, and our ability to improve customer satisfaction and build customer references. We believethat good progress was made on these initiatives in 2001 that will provide a foundation for success. We alsoexpect, however, that the weakness in the global manufacturing economy will likely continue to impact ourrevenue by causing our customers to reduce or defer their expenditures for software or services. Additionalfactors affecting our revenues and operating results are identified under “Important Factors That May AffectFuture Results” below.
Costs and Expenses
All cost and expense categories in 1999, 2000 and 2001 were impacted by the acquisition and/or nonrecurringcharges taken in those periods. See Note B of “Notes to Consolidated Financial Statements”. Our operatingexpenses are based on anticipated future revenue and are largely fixed for the short term. Given the lower thanexpected revenues, we reduced our headcount to 4,725 at the end of 2000 and to approximately 4,250 at the endof the first quarter of 2002. As a result, we recorded nonrecurring charges of $21.5 million in 2000 and $42.6million in 2001 and we expect to incur an additional nonrecurring charge in the first quarter of 2002 ofapproximately $6 million to complete the restructuring initiatives commenced in the fourth quarter of 2001.These restructuring initiatives, partially offset by a planned increase in marketing programs, are expected toresult in a fixed cost savings of approximately $60 million in 2002 (see “Nonrecurring Charges” below).
Costs and expenses, excluding amortization of goodwill and other intangible assets and acquisition andnonrecurring charges, increased 9% to $876.7 million in 2000 from $802.6 million in 1999 but decreased 2% to$857.1 million in 2001.
Cost of License Revenue
Our cost of license revenue consists of costs associated with reproducing and distributing software anddocumentation and the payment of royalties. Cost of license revenue was $16.5 million, $16.7 million and $15.7
11

million, for 1999, 2000 and 2001, respectively. Cost of license revenue as a percentage of license revenue was3% for 1999 and 4% for both 2000 and 2001.
Cost of Service Revenue
Our cost of service revenue includes costs associated with training and consulting personnel, such as salaries andrelated costs and travel, and costs related to software maintenance, including costs incurred for customer supportpersonnel and the release of maintenance updates. Cost of service revenue as a percentage of service revenue was39%, 42% and 43% in 1999, 2000 and 2001, respectively. This increase reflects our continued investment in thestaffing necessary to support our new product offerings, principally our Windchill-based solutions and ourcontinued investment over the last year in our systems integrator alliances and programs.
Sales and Marketing
Our sales and marketing expenses primarily include salaries and benefits, sales commissions, travel and facilitycosts. These costs increased 2% in 2000 and decreased 9% in 2001, primarily due to the implementation of ourstrategy to broaden our indirect distribution channel through alliances with systems integrators, resellers andother strategic partners. Total sales and marketing employees were 1,980 in 1999, 1,702 in 2000 and 1,646 in2001. The higher costs in 2000 are due to the higher average cost per sales employee, as we are hiring a moreexperienced CPD-focused sales force. International sales and marketing expenses represented 57% in 1999, 58%in 2000 and 51% in 2001 of total sales and marketing expenses.
Research and Development
Our research and development expenses consist principally of salaries and benefits, expenses associated withproduct translations, costs of computer equipment used in software development and facility expenses.Compared to the prior years, research and development expenses increased 16% in 2000 and 4% in 2001. Theincrease in 2000 and 2001 is primarily attributable to our continued investment in Windchill-based solutions, aswell as our InPart, Division and auxilium acquisitions in 1999.
General and Administrative
Our general and administrative expenses include the costs of our corporate, finance, information technology,human resources and administrative functions. These costs increased 13% in 2000 and 5% in 2001. This increasereflects our continued investment in information technology infrastructure, investments in business processimprovements and costs associated with supporting service revenue, which have been increasing as a proportionof our total revenue.
12

Amortization of Goodwill and Other Intangible Assets
These costs represent the amortization of intangible assets acquired, including developed technology, goodwill,customer lists, assembled work force and trade names. Amortization of goodwill and other intangible assets as apercentage of total revenue was 2% in 1999 and 4% in both 2000 and 2001. The increase in amortization of$15.5 million in 2000 compared to 1999 resulted principally from our 1999 acquisitions of InPart, Division andauxilium.
Acquisitions
InPart. In October 1998, we purchased InPart Design, Inc., a developer of DesignSuite, a Web-basedrepository of 3D mechanical component data, as well as the developer of enterprise software applications focusedon Web-based component and supplier management, which was founded in 1996. We allocated the purchaseprice of $38.1 million to the assets acquired and liabilities assumed based on our estimate of fair value. Thevalues assigned included $741,000 for net liabilities assumed, $10.6 million for purchased in-process R&D and$5.7 million for other intangible assets. The excess purchase price over the amounts allocated to assets acquiredand liabilities assumed was recorded as goodwill of $22.5 million.
Division. In March 1999, we purchased Division Group plc, a developer of enterprise product datavisualization, simulation and integration tools. We allocated the purchase price of $48.1 million to the assetsacquired and liabilities assumed based on our estimates of fair value. The values assigned included $555,000 fornet assets acquired, $9.0 million for purchased in-process R&D and $8.8 million for other intangible assets. The
13

excess purchase price over the amounts allocated to assets acquired and liabilities assumed was recorded asgoodwill of $29.8 million.
auxilium. In March 1999, we purchased auxilium inc., a developer of Web-based software tools for theintegration of legacy systems, databases and applications, which was founded in 1997. We allocated the purchaseprice of $101.7 million to the assets acquired and liabilities assumed based on our estimates of fair value. Thevalues assigned included $182,000 for net liabilities assumed, $18.6 million for purchased in-process R&D and$12.3 million for other intangible assets. The excess purchase price over the amounts allocated to assets acquiredand liabilities assumed was recorded as goodwill of $70.9 million.
In the opinion of management, the purchased in-process R&D for the acquisitions of InPart, Division andauxilium had not yet reached technological feasibility and had no alternative future use. Accordingly, werecorded nonrecurring charges of $10.6 million in the first quarter of 1999 related to InPart and $27.6 million inthe second quarter of 1999 related to Division and auxilium. The values assigned to purchased in-process R&Dwere determined by identifying research projects for which technological feasibility had not been established.The values of the purchased in-process R&D were determined by estimating the stage of completion, includingconsideration of the complexity of the work completed, the costs incurred and the projected costs to complete,the contribution of any core technology and other acquired assets and the projected product introduction dates,estimating the resulting net cash flows from the products developed and discounting the net cash flows back totheir present value.
The net cash flows also considered net working capital requirements and capital spending needs related to thepurchased in-process technology. The rates used to discount net cash flows for the purchased in-processtechnology to its present value for the InPart (28%), Division (25%) and auxilium (26% to 30%) acquisitionswere based on the weighted average cost of capital and took into account the uncertainty surrounding thesuccessful development of the purchased in-process technology for each acquisition. The InPart, Division andauxilium technology are integrated into our Windchill-based solutions products.
Nonrecurring Charges
In 1999, we reorganized our sales force and, in connection with this action, incurred nonrecurring charges of $9.0million for the severance and termination benefits of approximately 320 people who were terminated during1999 in connection with the integration of our sales and related support groups. All amounts related to terminatedemployees were paid in 1999. In 1999, we also incurred a nonrecurring charge of $1.4 million for theconsolidation of certain excess leased facilities and we recorded an impairment loss of $4.7 million on certainintangible assets related to our industrial design (CDRS) activities. Due to acquisitions and the development ofnew technology, the carrying value of these assets was impaired.
In the third quarter of 2000, we recorded nonrecurring charges of $21.5 million, primarily associated with thereorganization of the company into business units and with the development and execution of plans to reduce ourcost structure and improve profitability. The nonrecurring charge is comprised of $11.9 million for severance andtermination benefits of approximately 280 people who were terminated during the third quarter of 2000 and $9.6million for facility consolidations. Amounts not yet paid at September 30, 2001 related to the nonrecurringcharge were $1.8 million for facilities and are expected to be paid within the next twelve months.
In the second quarter of 2001, we recorded nonrecurring charges of $6.1 million, primarily associated with awrite-down of assets related to a focus shift in our content aggregation business. The non-cash portion of thisnonrecurring charge is $4.0 million. Amounts not yet paid at September 30, 2001 related to the nonrecurringcharge were $1.0 million and are expected to be paid within the next twelve months.
In the third quarter of 2001, we recorded nonrecurring charges of $3.8 million, primarily associated with areduction in force to reduce our cost structure and improve profitability. The nonrecurring charge is comprised of
14

$3.8 million for severance and termination benefits of approximately 100 people who were notified or terminatedduring the third quarter of 2001. Amounts not yet paid at September 30, 2001 related to the nonrecurring chargewere $500,000 for severance and are expected to be paid within the next twelve months.
In the fourth quarter of 2001, we recorded nonrecurring charges of $32.6 million, primarily associated with afurther reduction in force to reduce our cost structure and improve profitability. The nonrecurring charge iscomprised of $21.8 million for severance and termination benefits of approximately 620 people who werenotified or terminated during the fourth quarter of 2001 and $10.8 million primarily for facility consolidations.Amounts not yet paid at September 30, 2001 related to the nonrecurring charge were $26.2 million. We expect topay approximately $20.0 million within the next twelve months.
Write-down of Investments
In 2001, we recorded a $10.4 million write-down on several equity investments to reflect other than temporarydeclines in valuation and an unsettled near-term market outlook. At September 30, 2000 and 2001, equityinvestments included in other long-term assets were $12.4 million and $2.0 million, respectively.
Interest Income
Interest income relates to the earnings on the investment of our excess cash balances in various financialinstruments. The 24% decrease in interest income in 2001 compared to 2000 resulted primarily from loweraverage cash balances. The 17% increase in interest income in 2000 compared to 1999 resulted primarily fromhigher average annual yields and higher average cash balances.
Other Expense
A large portion of our revenue and expenses is transacted in foreign currencies. In order to reduce our exposureto fluctuations in foreign exchange rates we routinely engage in hedging transactions involving the use of foreigncurrency forward contracts and, from time-to-time, foreign currency option contracts primarily in euro and Asiancurrencies. Our other expense includes the costs of the hedging contracts, the gain or loss from the translation ofresults for subsidiaries for which the U.S. dollar is the functional currency and other charges, primarily related tofinancing costs. See ITEM 7A below and Note A of “Notes to Consolidated Financial Statements.”
Income Taxes
Our effective tax rate was 34% in 1999, (21)% in 2000 and (24)% in 2001. The lower effective tax rate in 1999from the statutory federal tax rate of 35% resulted primarily from the use of Computervision net operating losses,partially offset by the non-deductibility of certain acquisition-related charges and foreign net operating losseswhich could not be benefited. The reduced effective tax rate benefit in 2000 resulted primarily from the non-deductibility of certain acquisition-related amortization and foreign net operating losses which could not bebenefited. The reduced effective tax rate benefit in 2001 resulted primarily from the non-deductibility of certainacquisition-related amortization and foreign net operating losses and tax credit carryforwards which could not bebenefited, partially offset by a decrease in deferred tax liabilities related to foreign subsidiaries.
15

Liquidity and Capital Resources
Our operating activities, the proceeds from our issuance of stock under stock plans and existing cash andinvestments provided sufficient resources to fund our employee base, capital asset needs, stock repurchases,acquisitions and financing needs, in all years presented. Our investment portfolio is diversified among securitytypes, industries and individual issuers. Our investments are generally liquid and investment grade. The portfoliois primarily invested in short-term securities to minimize interest rate risk and to facilitate rapid deployment inthe event of immediate cash needs.
As of September 30, 2001, cash and investments totaled $249.1 million, down from $375.1 million atSeptember 30, 2000. The decrease in cash and investments during 2001 consisted of $131.7 million for therepurchase of treasury stock and $64.4 million in expenditures to acquire property and equipment and otherintangible assets partially offset by cash generated from operating activities of $51.1 million and proceeds fromthe issuance of common stock under our stock plans of $24.2 million. Cash expenditures for nonrecurringcharges were $34.2 million in 1999, $30.3 million in 2000 and $24.4 million in 2001. Cash generated fromoperating activities was $150.8 million in 1999, $51.9 million in 2000 and $51.1 million in 2001. In 2001, thecash generated from operating activities consisted of $82.6 million of net income before depreciation andamortization and the non-cash portion of the nonrecurring charges and write-down of investments, partiallyoffset by $31.5 million of cash utilized from assets and liabilities.
In December 1999, we sold land and certain improvements under construction for $30.8 million and entered intoan operating lease covering approximately 381,000 square feet of office space in Needham, Massachusetts toconsolidate our Massachusetts facilities. The lease expires in December 2012, subject to certain renewal rights.
In 1999, 2000 and 2001 we acquired $59.4 million, $39.8 million and $64.4 million, respectively, of capitalequipment and other intangible assets. The capital expenditures for 2001 include approximately $28.2 million,primarily for tenant improvements and furniture and fixtures related to our facility consolidation inMassachusetts. The remaining expenditures consisted primarily of computer equipment, software and officeequipment. We spent $72.9 million in 1999 and $7.9 million in 2000 to acquire businesses.
We used net cash for financing activities in 1999, 2000 and 2001, primarily to repurchase $90.0 million, $90.0million and $131.7 million, respectively, of our stock. These expenditures were partially offset by proceeds of$23.9 million, $79.6 million and $24.2 million in 1999, 2000 and 2001, respectively, from the issuance of ourcommon stock under our stock plans. Through September 2001, we had repurchased, at a cost of $361.7 million,30.5 million shares of the 40.0 million shares authorized by the Board of Directors to be repurchased under ourrepurchase program. The repurchased shares will be used for stock options exercises, employee stock purchaseplans and acquisitions. At September 30, 2001, 15.5 million shares were held in treasury.
We believe that existing cash and short-term investments together with cash generated from operations and theissuance of common stock under our stock plans will be sufficient to meet our working capital, financing andcapital expenditure requirements through at least 2002.
New Accounting Pronouncements
In accordance with recently issued accounting pronouncements, we will be required to comply with certainchanges in accounting rules and regulations. See Note A of “Notes to Consolidated Financial Statements”.
Important Factors That May Affect Future Results
The following are some of the factors that could affect our future results. They should be considered inconnection with evaluating forward-looking statements contained in this Annual Report on Form 10-K and
16

otherwise made by us or on our behalf, because these factors could cause actual results and conditions to differmaterially from those projected in forward-looking statements.
I. Operational Considerations
Our operating results fluctuate within each quarter and from quarter-to-quarter making our future revenues andoperating results difficult to predict
While our sales cycle varies substantially from customer to customer, we usually realize a high percentage of ourrevenue in the third month of each fiscal quarter, and this revenue tends to be concentrated in the later part of thatmonth. Our orders early in a quarter will not generally occur at a rate which, if sustained throughout the quarter,would be sufficient to assure that we will meet our revenue targets for any particular quarter. Moreover, ourtransition from a one product to a multi-product company, our increased utilization of distributors and systemsintegrators and our shift in business emphasis to a more solutions-oriented sales process—undertaken in part toincrease our average order size—have resulted in more unpredictable and often longer sales cycles for productsand services. Accordingly, our quarterly results may be difficult to predict prior to the end of the quarter. Anyinability to obtain large orders or orders in large volumes or to make shipments or perform services in the periodimmediately preceding the end of any particular quarter may cause the results for that quarter to fall short of ourrevenue targets. In addition, our operating expenses are based on expected future revenue and are relatively fixedfor the short term. As a result, a revenue shortfall in any quarter could cause our earnings for that quarter to fallbelow expectations as well. Any failure to meet our quarterly revenue or earnings targets could adversely impactthe market price of our stock.
Other factors that may also cause quarter-to-quarter revenue and earnings fluctuation include the following:
• our sales incentive structure is weighted more heavily toward the end of the fiscal year, and the rate ofrevenue growth for the first quarter historically has been lower and more difficult to predict than thatfor the fourth quarter of the immediately preceding fiscal year;
• variability in the levels of professional service revenues and the mix of our license and servicerevenues;
• declines in license revenue may adversely affect the size of our installed base and our level of servicerevenue; and
• the increased utilization of third parties, such as systems integrators, resellers, strategic partners andapplication service providers, as distribution mechanisms for our software products and relatedservices, may lessen the control we have over any particular sales cycle.
In addition, the levels of quarterly or annual software or service revenue in general, or for particular geographicareas, may not be comparable to those achieved in previous periods.
General economic and political conditions may impact our results
Our revenue growth and profitability depends on the overall demand for software and related services. Thisdemand can be adversely affected by unfavorable economic conditions, as customers reduce or defer spending oninformation technology improvements. We may be especially prone to this as a result of the relatively largelicense transactions we have historically relied upon. Accordingly, general economic and business conditionsmay affect our future operating results. If the recent unfavorable economic conditions continue, the economicslowdown has the potential to materially and adversely affect us. A softening demand for software caused by aprolonged slowdown of the economy would result in decreased revenue or lower revenue growth rates.
Recent political/social events, including the September 11, 2001 tragedy, have put further pressure on economicconditions both domestically and internationally. The potential turmoil that may result from such eventscontributes to the uncertainty of the economic climate, further reducing predictability and our ability to developand implement long-term strategies and business models. In light of the foregoing, the impact of these or future
17
similar events may have a materially adverse impact on our business, operating results, and financial position.
We may not be able to implement new initiatives successfully
Part of our success in the past has resulted from our ability to implement new initiatives. Our future operatingresults will continue to depend upon:
• the successful implementation of a unified CPD product strategy, including the realignment of internalfunctions, the management of multiple development and distribution processes and effective mitigationof disruption that may result from organizational change;
• our ability to deliver an integrated and comprehensive suite of solutions and to capitalize on existingsynergies through a common product strategy;
• our ability to appropriately allocate and implement cost cutting measures that increase profitabilitywhile maintaining adequate resources for effective and coordinated organizational performance;
• the success of our sales force reorganization initiatives, including:
— the effectiveness of our organizational sales model,
— the ability of our sales reps to learn and sell our products, and
— Rands’ and other distributors’ ability to perform;
• our ability to anticipate and meet evolving customer requirements in the CPD arena and successfullydeliver products and services at an enterprise level;
• our ability to broaden indirect distribution channels through alliances with systems integrators,resellers, strategic partners and application service providers and our effective management of abalanced sales model that optimizes sales coverage and most effectively utilizes these third parties;
• our ability to develop rapidly implementable point solutions that adequately address specific businesschallenges; and
• our ability to identify and penetrate additional industry sectors that represent growth opportunities.
• our ability to execute on customer satisfaction initiatives and programs in order to retain our customerbase.
We may not be successful in integrating recently acquired businesses or products
We have increased our product range and customer base in the recent past due in part to acquisitions. We mayacquire additional businesses or product lines in the future. The success of any acquisition may be dependentupon our ability to integrate the acquired business or products successfully and to retain key personnel andcustomers associated with the acquisition. If we fail to do so, or if the costs of or length of time for integrationincrease significantly, it could negatively affect our business.
We are dependent on key personnel whose loss could cause delays in our product development and sales efforts
Our success depends upon our ability to attract and retain highly skilled technical, managerial and salespersonnel. Competition for such personnel in the high technology industry is intense. We assume that we willcontinue to be able to attract and retain such personnel. The failure to do so, however, could have a materialadverse effect on our business.
We must continually modify and enhance our products to keep pace with changing technology, and we mayexperience delays in developing and debugging our software
We must continually modify and enhance our products to keep pace with changes in computer software,hardware and database technology, as well as emerging standards in the Internet software industry. Our ability toremain competitive will depend on our ability to:
18

• enhance our current offerings and develop new products and services that keep pace with technologicaldevelopments through:
— internal research and development,
— acquisition of technology, and
— strategic partnerships;
• meet evolving customer requirements, especially ease-of-use;
• provide adequate funding for development efforts; and
• license appropriate technology from third parties.
Also, as is common in the computer software industry, we may from time to time experience delays in ourproduct development and “debugging” efforts. Our performance could be hurt by significant delays indeveloping, completing or shipping new or enhanced products. Among other things, such delays could cause usto incorrectly predict the fiscal quarter in which we will realize revenue from the shipment of the new orenhanced products and give our competitors a greater opportunity to market competing products.
We may be unable to price our products competitively or distribute them effectively
Our success is tied to our ability to price our products and services competitively and to deliver them efficiently,including our ability to:
• provide products with functionality that our customers want at a price they can afford;
• build appropriate direct distribution channels;
• utilize the Internet for sales; and
• build appropriate indirect distribution channels through Rand or others.
We depend on sales from outside the United States that could be adversely affected by changes in theinternational markets
A significant portion of our business comes from outside the United States. Accordingly, our performance couldbe adversely affected by economic downturns in Europe or the Asia/Pacific region. Another consequence ofsignificant international business is that a large percentage of our revenues and expenses are denominated inforeign currencies that fluctuate in value. Although we may enter into foreign exchange forward contracts andforeign exchange option contracts to offset a portion of the foreign exchange fluctuations, unanticipated eventsmay have a material impact on our results. Other risks associated with international business include:
• changes in regulatory practices and tariffs;
• staffing and managing foreign operations, including the difficulties in providing cost-effective, equity-based compensation to attract skilled workers;
• longer collection cycles in certain areas;
• potential changes in tax and other laws;
• greater difficulty in protecting intellectual property rights; and
• general economic and political conditions.
We may not be able to obtain copyright or patent protection for the software products we develop or our othertrademarks
Our software products and our other trademarks, including our company names, product names and logos, areproprietary. We protect our intellectual property rights in these items by relying on copyrights, trademarks,
19
patents and common law safeguards, including trade secret protection, as well as restrictions on disclosures andtransferability contained in our agreements with other parties. Despite these measures, there can be no assurancethat the laws of all relevant jurisdictions will afford adequate protection to our products and other intellectualproperty. The software industry is characterized by frequent litigation regarding copyright, patent and otherintellectual property rights. While we have not, to date, had any significant claims of this type asserted against us,there can be no assurance that someone will not assert such claims against us with respect to existing or futureproducts or other intellectual property or that, if asserted, we would prevail in such claims. In the event a lawsuitof this type is filed, it could result in significant expense to us and divert the efforts of our technical andmanagement personnel, whether or not we ultimately prevail. Certain of our products also contain technologydeveloped and licensed from third parties. We may likewise be susceptible to infringement claims with respect tothese third party technologies.
II. Design Solutions Related Considerations
Increasing competition in the computer aided design marketplace may reduce our revenues
There are an increasing number of competitive design products. Despite our belief that our products aretechnologically superior, some competitive products have reached a level of functionality whereby productdifferentiation is less likely, in and of itself, to dislodge incumbent design systems, given the training and otherstartup costs associated with system replacement. Increased competition and market acceptance of thesecompetitive products could have a negative effect on pricing and revenues for our products, which could have amaterial adverse affect on our results.
In addition, our design software is capable of performing on a variety of platforms. Several of our competitorsfocus on single platform applications, particularly Windows®-based platforms. There can be no assurance that wewill have a competitive advantage with multiple platform applications.
We continue to enhance our existing products by releasing updates. Our competitive position and operatingresults could suffer if:
• we fail to anticipate or to respond adequately to customer requirements or to technologicaldevelopments, particularly those of our competitors;
• we delay the development, production, testing, marketing or availability of new or enhanced productsor services;
• customers fail to accept such products or services; or
• we fail to execute our common product strategy initiative.
Growth in the computer aided design industry appears to have slowed
Growth in certain segments of the computer aided design industry appears to have slowed and, coupled withdecreased functional differentiation among flexible engineering tools, may affect our ability to penetrate themarket for new customers and recapture our market share. Over the long term, we believe our emphasis on CPDsolutions will allow us to differentiate our design solutions from the competition and invigorate sales of thoseproducts. However, the strategy may not be successful or may take longer than we plan. There could be amaterial adverse affect on our operating results in any quarter if these assumptions prove to be incorrect.
III. Collaborate & Control Solutions and Overall CPD Related Considerations
We are attempting to capitalize on a web-based, business-to-business market opportunity known asCollaborative Product Commerce or Collaborative Product Development(CPD). It may be that our assumptionsabout this market opportunity are wrong, which could adversely affect our results
20
We have identified CPD as a new market opportunity for us, and have devoted significant resources towardcapitalizing on that opportunity. Our CPD solutions are targeted at this market and include software and servicesthat utilize Internet technologies to permit employees, customers, suppliers and others to collaboratively develop,build, distribute and manage products throughout their entire lifecycle. Because the market for software productsthat allow companies to collaborate on product information on an enterprise-wide level is newly emerging andbecause companies have not traditionally linked customers and suppliers in this process directly, we cannot becertain as to the size of this market, whether it will grow, or whether companies will elect to utilize our productsrather than attempt to develop applications internally or through other sources.
In addition, companies that have already invested substantial resources in other methods of sharing productinformation in the design-through-manufacture process may be reluctant to adopt a new approach that mayreplace, limit or compete with their existing systems or methods. We expect that we will continue to need topursue intensive marketing and sales efforts to educate prospective customers about the uses and benefits of ourproducts. Demand for and market acceptance of our products will be affected by the success of these efforts.
Our Windchill technology, which is central to our CPD strategy, is relatively new and is not yet well establishedin the marketplace
The success of our CPD strategy will depend in large part on the ability of our Windchill-based solutions to meetcustomer expectations, especially with respect to:
• measuring and understanding the benefits of Windchill, including return on investment and valuecreation;
• ease and rapidity of installation;
• ease of use;
• full capability, functionality and performance;
• ability to support a large, diverse and geographically dispersed user base; and
• quality and efficiency of the services we perform relating to implementation and customization.
The software is still relatively new. If our customers cannot successfully deploy large-scale implementationprojects or if they determine that we or our partners are unable to accommodate large-scale deployments, ouroperating results may be affected. We are also pursuing a strategy to provide a series of easily deployable CPDpoint solutions that address specific business challenges. With this strategy, PTC is converging Pro/ENGINEERand Windchill technologies to develop solutions that help manufacturers create, collaborate, and control productinformation throughout the entire product lifecycle. If we are unable to provide these solutions or are unable tomeet customer expectations, our overall revenue may be adversely impacted.
Further, our software must integrate with existing computer systems and software programs used by ourcustomers and their partners. Because we are one of the first companies to offer a CPD solution, many customerswill be facing these integration issues for the first time, particularly in the context of collaborating with membersof the extended enterprise, including customers and supply chain partners. Our customers could becomedissatisfied with our products or services if integrations prove to be difficult, costly or time consuming, and ouroperating results may be affected. Moreover, due to the emerging nature of the industry and technology,reference accounts become essential to the sales process. Accordingly, if our customers become dissatisfied,future business and revenues may be adversely affected.
We intend to utilize third parties, such as system integrators, resellers, strategic partners and application serviceproviders, for the distribution and implementation of Windchill-based software, which may result in managementdifficulties and customer retention problems
As an enterprise solution, Windchill may require large-scale organizational implementations that in today’smarketplace are often performed by third parties. We have entered into and are currently developing additional
21
relationships with third parties and intend to continue to do so. Using third parties to both implement andpromote our products can result in a reduction in our control to both drive the sales process and service ourcustomers. In addition, the successful utilization of third parties will depend on:
• our ability to enter into definitive agreements with appropriate third parties that can deliver ourproducts in appropriate markets;
• the third party’s ability to learn, promote and implement our products; and
• the effective coordination and management of joint activities (including sales, marketing, development,implementation and support) in order to deliver products and services that meet customer requirements.
Competition may increase, which may reduce our profits and limit or reduce our market share
The market for our CPD software solutions is new, highly fragmented, rapidly changing and increasinglycompetitive. We expect competition to intensify, which could result in price reductions for our products andservices, reduced gross margins and loss of market share. Our primary competition comes from:
• in-house development efforts by potential customers or partners;
• other vendors of engineering information management software; and
• larger, more well-known enterprise software providers seeking to extend the functionality of theirproducts to encompass CPD.
In addition, our Global Services Organization may face increasing competition for follow-on customization andtraining services from other third-party consultants and service providers.
If use of the Internet does not continue to develop or reliably support the demands placed on it by electroniccommerce, we may experience a loss of sales
Our success depends upon continued growth in the use of the Internet as a medium of commerce. Although theInternet is experiencing rapid growth in the overall number of users, this growth is a recent phenomenon and maynot continue. Furthermore, the use of the Internet for commerce is still relatively new. As a result, a sufficientlybroad base of companies and their supply chain partners may not adopt or continue to use the Internet as amedium of exchanging product information. Our CPD strategy would be seriously harmed if:
• use of the Internet does not continue to increase or increases more slowly than expected;
• the infrastructure for the Internet does not effectively support enterprises and their supply chainpartners;
• the Internet does not create a viable commercial marketplace, thereby inhibiting the development ofelectronic commerce and reducing the demand for our products; or
• concerns over the secure transmission of confidential information over public networks inhibit thegrowth of the Internet as a means of collaborating across enterprises and/or conducting commercialtransactions.
Our CPD strategy will also be seriously harmed if the Internet infrastructure is not able to support the demandsplaced on it by increased usage or the limited capacity of networks to transmit large amounts of data, or if delaysin the development or adoption of new equipment standards or protocols required to handle increased levels ofInternet activity, or increased governmental regulation, cause the Internet to lose its viability as a means ofcommunication between manufacturers and their customers and supply chain partners.
Certain of our Windchill-based solutions provide CPD capabilities on Internet exchanges, portals andmarketplaces. Accordingly, their success will be highly dependent upon the success of the Internet as a viablecollaboration medium and on our successful development and integration of the technologies necessary to offertools for exchanges, portals, and other forms of Internet marketplaces that are acceptable to customers andsuitable for the evolving nature of the Internet.
22

IV. Other Considerations
Our stock price, which may reflect an Internet valuation, has been highly volatile; this may make it harder toresell your shares at the time and at a price that is favorable to you
Market prices for securities of software companies have generally been volatile. In particular, the market price ofour common stock has been and may continue to be subject to significant fluctuations.
In addition, our expanded focus on delivering web-based solutions may cause us to be viewed, in part, as anInternet company. Until the third quarter of 2000, the trading prices of Internet stocks in general were unusuallyhigh under conventional valuation standards such as price-to-earnings and price-to-sales ratios. Since then, theyhave experienced fluctuations unrelated or disproportionate to the operating performance of these companies.The trading prices and valuations of these stocks, and of ours, may not be predicted. Negative changes in thepublic’s perception of the prospects of Internet or e-commerce companies, or of PTC as an Internet company,could depress our stock price regardless of our results.
Also, a large percentage of our common stock traditionally has been held by institutional investors. Purchasesand sales of our common stock by certain of these institutional investors could have a significant impact on themarket price of the stock. For more information, please see our proxy statement with respect to our most recentannual meeting of stockholders and Schedules 13D and 13G filed with the SEC with respect to our commonstock.
ITEM 7A: Quantitative and Qualitative Disclosures about Market Risk
We face exposure to financial market risks, including adverse movements in foreign currency exchange rates andchanges in interest rates. These exposures may change over time as business practices evolve and could have amaterial adverse impact on our financial results. Our primary exposure has been related to local currency revenueand operating expenses in Europe and the Asia/Pacific region. Historically, we have hedged currency exposuresassociated with certain accounts receivable denominated in local currencies and certain anticipated foreigncurrency net cash flows. The goal of our hedging activity is to offset the impact of currency fluctuations oncertain local currency accounts receivable and foreign currency net cash flows. The success of this activitydepends upon forecasts of transaction activity denominated in various currencies. To the extent that theseforecasts are overstated or understated during periods of currency volatility, we could experience unanticipatedcurrency gains or losses. Outstanding forward foreign currency contracts at September 30, 2001 matured withinthree months, and did not have a material impact on our financial results.
The carrying amounts reflected in the consolidated balance sheets for cash and cash equivalents, accountsreceivable, and accounts payable approximate fair value at the balance sheet date due to the short maturities ofthese instruments.
We maintain investment portfolio holdings of various issuers, types and maturities. These securities are generallyclassified as available for sale, and consequently, are recorded on the balance sheet at fair market value withunrealized gains or losses included in stockholders’ equity. Given the short maturities and investment gradequality of the portfolio holdings at September 30, 2001, a sharp rise in interest rates should not have a materialadverse impact on the fair value of our investment portfolio.
The following table presents hypothetical changes in fair values in our financial instruments at September 30,2001 that are sensitive to changes in interest rates. Our modeling technique measures the change in fair valuearising from selected potential changes in interest rates. Movements in interest rates of plus or minus 50 basispoints (BP) and 100 BP reflect immediate hypothetical shifts in the fair value of these investments. Fair valuerepresents the market principal plus accrued interest and dividends of certain interest-rate-sensitive securitiesconsidered cash equivalents or investments for financial reporting purposes at September 30, 2001.
23

Type of Security
Valuation ofSecurities given aninterest rate decrease No change in
interest rates
Valuation ofSecurities given aninterest rate increase
(in millions) (100 BP) (50 BP) 50 BP 100 BP
Municipal debt securities . . . . . . . . . . . . . . . . . . . . . . . $17 $17 $17 $17 $17Mutual funds . . . . . . . . . . . . . . . . . . . . . . . . . . . . . . . . . 47 47 47 47 47Commercial paper . . . . . . . . . . . . . . . . . . . . . . . . . . . . 12 11 11 11 11Government agencies . . . . . . . . . . . . . . . . . . . . . . . . . . 16 16 16 16 16
Total . . . . . . . . . . . . . . . . . . . . . . . . . . . . . . . . . . . $92 $91 $91 $91 $91
The Federal Reserve has adjusted the Federal Funds Rate by a 50 BP move ten times during the last 40 quarters,whereas they have never adjusted the Federal Funds Rate by a 100 BP move during the same period. The last 50BP move occurred in September 2001.
ITEM 8: Financial Statements and Supplementary Data
The consolidated financial statements and notes to the consolidated financial statements are attached asAPPENDIX A below.
ITEM 9: Changes in and Disagreements with Accountants on Accounting and Financial Disclosure
None.
PART III
ITEM 10: Directors and Executive Officers of the Registrant
Information with respect to our directors may be found in the sections captioned “PROPOSAL: Elect TwoDirectors” and “Who Are Our Directors” appearing in our 2002 Proxy Statement. Such information isincorporated herein by reference.
Our executive officers are:
Name Age Position
C. Richard Harrison . . . . . . . . . . 46 Chief Executive Officer and PresidentTrenton H. Brown . . . . . . . . . . . 37 Executive Vice President, International SalesBarry F. Cohen . . . . . . . . . . . . . . 57 Executive Vice President, Marketing and Human ResourcesPaul J. Cunningham . . . . . . . . . . 39 Executive Vice President, Americas SalesEdwin J. Gillis . . . . . . . . . . . . . . 53 Executive Vice President, Chief Financial Officer and TreasurerJames E. Heppelmann . . . . . . . . 37 Executive Vice President, Software Products and Chief Technology
OfficerKevin P. Wrenn . . . . . . . . . . . . . 36 Executive Vice President, Global ServicesThomas L. Beaudoin . . . . . . . . . 48 Senior Vice President, FinanceDavid R. Friedman . . . . . . . . . . . 40 Senior Vice President, General Counsel and Clerk
Mr. Harrison has been Chief Executive Officer and President since March 2000. Prior to that, Mr. Harrisonserved as President and Chief Operating Officer since August 1994.
Mr. Brown has been Executive Vice President, International Sales since July 2000. Mr. Brown was DivisionalVice President, Asia Pacific from April 2000 to July 2000 and Sector Vice President from October 1999 to April2000. Prior to that, he was Area Vice President-Sales from October 1998 to October 1999 and Regional Director
24

from April 1998 to October 1998. He also served as District Manager from December 1997 to April 1998. Priorto joining PTC, Mr. Brown served as District Manager of Nalco Chemical Inc. from September 1989 toDecember 1997.
Mr. Cohen has been Executive Vice President, Marketing and Human Resources since December 2000 andExecutive Vice President, Marketing since January 1998. Prior to joining PTC, Mr. Cohen was Senior VicePresident, Human Development and Organizational Productivity at Computervision Corporation from November1993 to January 1998.
Mr. Cunningham has served as Executive Vice President, Americas Sales since July 2000 and from October1998 to June 2000 he was Executive Vice President, Primary Sales. Mr. Cunningham was Senior Vice President,European Sales from April 1997 to October 1998 and Senior Vice President, North America West Sales fromOctober 1996 to April 1997.
Mr. Gillis has been Executive Vice President since October 1996 and Chief Financial Officer and Treasurer sinceOctober 1995. Mr. Gillis had served as Senior Vice President of Finance and Administration from October 1995to September 1996.
Mr. Heppelmann has been Executive Vice President, Software Products and Chief Technology Officer since June2001. Prior to that he was Executive Vice President, General Manager—Windchill Solutions From November2000 to June 2001. He had served as Executive Vice President and General Manager of Windchill Netmarketsfrom July 2000 to November 2000 and Senior Vice President of Windchill from January 1998 to July 2000. Priorto joining PTC, Mr. Heppelmann was Vice President of Marketing and Chief Technology Officer of WindchillTechnology, Inc. from October 1996 to January 1998.
Mr. Wrenn has been Executive Vice President, Global Services since October 2001. Prior to that he served asSenior Vice President, Windchill Global Services from June 2000 to October 2001 and Vice President, WindchillConsulting Services from October 1998 to June 2000. Mr. Wrenn was Vice President, Far East Global Servicesfrom February 1997 to October 1998 and Director, North America MCAD Consulting from October 1996 toFebruary 1997.
Mr. Beaudoin has been Senior Vice President, Finance since October 2000. Prior to joining PTC, Mr. Beaudoinwas Chief Financial Officer, Infinite Supply at i2 Technologies Inc. from June 2000 to September 2000.Mr. Beaudoin has served in the following positions at Compaq Computer Corporation: Vice President Finance,Enterprise from July 1999 to June 2000; Vice President, Services from January 1998 to July 1999; and, VicePresident, Asia Pacific from January 1995 to January 1998.
Mr. Friedman has served as Senior Vice President, General Counsel and Clerk since October 1999. Mr. Friedmanhad served as Vice President, General Counsel and Clerk from October 1998 to September 1999 and as AssociateCorporate Counsel from September 1996 to September 1998. Prior to joining PTC, Mr. Friedman was a Partnerat the law firm of Palmer & Dodge LLP from January 1994 to August 1996.
ITEM 11: Executive Compensation
Information with respect to executive compensation may be found under the headings captioned “How WeCompensate Our Directors” and “Information About Executive Compensation” appearing in our 2002 ProxyStatement. Such information is incorporated herein by reference.
25

ITEM 12: Security Ownership of Certain Beneficial Owners and Management
Information with respect to security ownership may be found under the heading captioned “Information AboutPTC Common Stock Ownership” appearing in our 2002 Proxy Statement. Such information is incorporatedherein by reference.
ITEM 13: Certain Relationships and Related Transactions
Information with respect to this item may be found under the heading “Information About Certain InsiderRelationships” appearing in our 2002 Proxy Statement. Such information is incorporated herein by reference.
PART IV
ITEM 14: Exhibits, Financial Statement Schedules and Reports on Form 8-K
(a) Documents Filed as Part of Form 10-K1. Financial Statements
— Consolidated Balance Sheets as of September 30, 2000 and 2001— Consolidated Statements of Income for the years ended September 30, 1999, 2000 and 2001— Consolidated Statements of Cash Flows for the years ended September 30, 1999, 2000 and
2001— Consolidated Statements of Stockholders’ Equity for the years ended September 30, 1999,
2000 and 2001— Consolidated Statements of Comprehensive Income for the years ended September 30,
1999, 2000 and 2001— Notes to Consolidated Financial Statements— Report of Independent Accountants
2. Financial Statement Schedules— Schedules have been omitted since they are either not required, not applicable, or the
information is otherwise included.
3. Exhibits— As part of this Annual Report on Form 10-K, we hereby file and incorporate by reference
the Exhibits listed in the Exhibit Index immediately preceding such Exhibits.
(b) Reports on Form 8-K
None.
(c) Exhibits
As part of this Annual Report on Form 10-K, we hereby file the Exhibits listed in the attached Exhibit Index.
(d) Financial Statement Schedules
None.
26

SIGNATURES
Pursuant to the requirements of Section 13 or 15(d) of the Securities Exchange Act of 1934, the Registrant hasduly caused this report to be signed on its behalf by the undersigned, thereunto duly authorized on the 26th day ofDecember, 2001.
PARAMETRIC TECHNOLOGY CORPORATION
/s/ C. Richard HarrisonByC. Richard Harrison,
Chief Executive Officer and President
POWER OF ATTORNEY
We, the undersigned officers and directors of Parametric Technology Corporation, hereby severally constituteEdwin J. Gillis and David R. Friedman, Esq., and each of them singly, our true and lawful attorneys with fullpower to them, and each of them singly, to sign for us and in our names in the capacities indicated below any andall subsequent amendments to this report, and to file the same, with exhibits thereto and other documents inconnection therewith, with the Securities and Exchange Commission, hereby ratifying and confirming all thateach of said attorneys-in-fact may do or cause to be done by virtue hereof.
Pursuant to the requirements of the Securities Exchange Act of 1934, this report has been signed below by thefollowing persons on behalf of the Registrant and in the capacities indicated below.
Signature Title Date
(i) Principal Executive Officer:
/s/ C. Richard HarrisonC. Richard Harrison
Chief Executive Officer andPresident
December 26, 2001
(ii) Principal Financial and AccountingOfficer:
/s/ Edwin J. GillisEdwin J. Gillis
Executive Vice President, ChiefFinancial Officer and Treasurer
December 26, 2001
(iii) Board of Directors:
/s/ Noel G. PosternakNoel G. Posternak
Chairman of the Board ofDirectors
December 26, 2001
/s/ C. Richard HarrisonC. Richard Harrison
Director December 26, 2001
/s/ Robert N. GoldmanRobert N. Goldman
Director December 26, 2001
/s/ Donald K. GriersonDonald K. Grierson
Director December 18, 2001
/s/ Oscar B. Marx, IIIOscar B. Marx, III
Director December 26, 2001
/s/ Michael E. PorterMichael E. Porter
Director December 26, 2001
27

EXHIBIT INDEX
ExhibitNumber
2.1 — Agreement and Plan of Reorganization dated as of March 8, 1999 by and among ParametricTechnology Corporation, Northstar Acquisition Corporation, auxilium inc. and the stockholders ofauxilium inc. (filed as Exhibit 2.1 to our Current Report on Form 8-K filed March 23, 1999 andincorporated herein by reference).
3.1(a) — Restated Articles of Organization of Parametric Technology Corporation adopted February 4,1993 (filed as Exhibit 3.1 to our Quarterly Report on Form 10-Q for the fiscal quarter endedMarch 30, 1996 and incorporated herein by reference).
3.1(b) — Articles of Amendment to Restated Articles of Organization adopted February 9, 1996 (filed asExhibit 4.1(b) to our Registration Statement on Form S-8 (Registration No. 333-01297) andincorporated herein by reference).
3.1(c) — Articles of Amendment to Restated Articles of Organization adopted February 13, 1997 (filed asExhibit 4.1(b) to our Registration Statement on Form S-8 (Registration No. 333-22169) andincorporated herein by reference).
3.1(d) — Articles of Amendment to Restated Articles of Organization adopted February 10, 2000 (filed asExhibit 3.1 to our Quarterly Report on Form 10-Q for the fiscal quarter ended April 1, 2000 andincorporated herein by reference).
3.1(e) — Certificate of Vote of Directors establishing Series A Junior Participating Preferred Stock (filed asExhibit 3.1(e) to our Annual Report on Form 10-K for the fiscal year ended September 30, 2000and incorporated herein by reference).
3.2 — By-Laws, as amended and restated, of Parametric Technology Corporation (filed as Exhibit 3.2 toour Annual Report on Form 10-K for the fiscal year ended September 30, 2000 and incorporatedherein by reference).
4.1 — Rights Agreement effective as of January 5, 2001 between Parametric Technology Corporationand American Stock Transfer & Trust Company (filed as Exhibit 4.1 to our Annual Report onForm 10-K for the fiscal year ended September 30, 2000 and incorporated herein by reference).
10.1* — Parametric Technology Corporation 2000 Equity Incentive Plan (filed as Exhibit 10.7 to ourQuarterly Report on Form 10-Q for the fiscal quarter ended April 1, 2000 and incorporated hereinby reference).
10.2* — Parametric Technology Corporation 1997 Incentive Stock Option Plan (filed as Exhibit 10.1 to ourQuarterly Report on Form 10-Q for the fiscal quarter ended March 29, 1997 and incorporatedherein by reference).
10.3* — Amendment to Parametric Technology Corporation 1997 Incentive Stock Option Plan (filed asExhibit 10.2 to our Quarterly Report on Form 10-Q for the fiscal quarter ended March 31, 2001and incorporated herein by reference).
10.4* — Parametric Technology Corporation 1987 Incentive Stock Option Plan, as amended (filed asExhibit 10.2 to our Annual Report on Form 10-K for the fiscal year ended September 30, 1999 andincorporated herein by reference).
10.5* — Parametric Technology Corporation 1992 Director Stock Option Plan, as amended (filed asExhibit 10.10 to our Annual Report on Form 10-K for the fiscal year ended September 30, 1996and incorporated herein by reference).
28

ExhibitNumber
10.6* — Parametric Technology Corporation 1996 Directors Stock Option Plan, as amended (filed asExhibit 10.4 to our Annual Report on Form 10-K for the fiscal year ended September 30, 1999 andincorporated herein by reference).
10.7* — Computervision Corporation 1992 Stock Option Plan as amended September 15, 1994, April 18,1995 and December 5, 1996 (filed as Exhibit 10.3 to the Annual Report on Form 10-K ofComputervision Corporation for the fiscal year ended December 31, 1996 (File No. 1-7760/0-20290) and incorporated herein by reference).
10.8* — Amended and Restated Severance Agreement with C. Richard Harrison dated February 10, 2000(filed as Exhibit 10.3 to our Quarterly Report on Form 10-Q for the fiscal quarter ended April 1,2000 and incorporated herein by reference).
10.9* — Amended and Restated Severance Agreement with Edwin J. Gillis dated February 10, 2000 (filedas Exhibit 10.4 to our Quarterly Report on Form 10-Q for the fiscal quarter ended April 1, 2000and incorporated herein by reference).
10.10* — Severance Agreement with Barry F. Cohen dated February 10, 2000 (filed as Exhibit 10.5 to ourQuarterly Report on Form 10-Q for the fiscal quarter ended April 1, 2000 and incorporated hereinby reference).
10.11* — Amended and Restated Severance Agreement with Paul J. Cunningham dated November 15, 2001(filed herewith).
10.12* — Severance Agreement with James E. Heppelmann dated May 18, 2000 (filed as Exhibit 10.12 toour Annual Report on Form 10-K for the fiscal year ended September 30, 2000 and incorporatedherein by reference).
10.13* — Severance Agreement with Trenton H. Brown dated February 15, 2001 (filed as Exhibit 10.1 toour Quarterly Report on Form 10-Q for the fiscal quarter ended March 31, 2001 and incorporatedherein by reference).
10.14* — Severance Agreement with Kevin P. Wrenn dated November 15, 2001 (filed herewith)
10.15* — Consulting Agreement with Michael E. Porter dated November 17, 1995 (filed as Exhibit 10.3 tothe Quarterly Report on Form 10-Q for the fiscal quarter ended June 28, 1997 and incorporatedherein by reference).
10.16* — Amendment #1 to Consulting Agreement with Michael E. Porter dated May 15, 1997 (filed asExhibit 10.4 to our Quarterly Report on Form 10-Q for the fiscal quarter ended June 28, 1997 andincorporated herein by reference).
10.17* — Amendment #2 to Consulting Agreement with Michael E. Porter dated January 6, 1998 (filed asExhibit 10.1 to our Quarterly Report on Form 10-Q for the fiscal quarter ended April 4, 1998 andincorporated herein by reference).
10.18* — Amendment #3 to Consulting Agreement with Michael E. Porter dated July 20, 1998 (filed asExhibit 10.24 to our Annual Report on Form 10-K for the fiscal year ended September 30, 1998and incorporated herein by reference).
10.19* — Amendment #4 to the Consulting Agreement with Michael E. Porter dated February 11, 1999(filed as Exhibit 10.1 to our Quarterly Report on Form 10-Q for the fiscal quarter ended April 3,1999 and incorporated herein by reference).
29

ExhibitNumber
10.20* — Amendment #5 to the Consulting Agreement with Michael E. Porter dated February 10, 2000(filed as Exhibit 10.6 to our Quarterly Report on Form 10-Q for the fiscal quarter ended April 1,2000 and incorporated herein by reference).
10.21* — Amendment #6 to the Consulting Agreement with Michael E. Porter dated September 14, 2000(filed as Exhibit 10.20 to our Annual Report on Form 10-K for the fiscal year ended September 30,2000 and incorporated herein by reference).
10.22* — Amendment #7 to the Consulting Agreement with Michael E. Porter dated May 16, 2001 (filed asExhibit 10.1 to our Quarterly Report on Form 10-Q for the fiscal quarter ended June 30, 2001 andincorporated herein by reference)
10.23 — Lease dated December 14, 1999 by and between PTC and Boston Properties Limited Partnership(filed as Exhibit 10.21 to our Annual Report on Form 10-K for the fiscal year ended September 30,2000 and incorporated herein by reference).
10.24 — Amended and Restated Lease Agreement dated as of January 1, 1995 between United Trust FundLimited Partnership and (filed as Exhibit 10.20 to the Annual Report on Form 10-K ofComputervision Corporation for the fiscal year ended December 31, 1995 (File No. 0-18059) andincorporated herein by reference).
21.1 — Subsidiaries of Parametric Technology Corporation (filed herewith).
23.1 — Consent of PricewaterhouseCoopers LLP (filed herewith).
* Identifies a management contract or compensatory plan or arrangement in which an executive officer ordirector of PTC participates.
30

APPENDIX A
PARAMETRIC TECHNOLOGY CORPORATION
CONSOLIDATED BALANCE SHEETS(in thousands)
September 30,
2000 2001
A S S E T S
Current assets:Cash and cash equivalents . . . . . . . . . . . . . . . . . . . . . . . . . . . . . . . . . . . . . . . . . . $ 325,872 $ 217,369Short-term investments . . . . . . . . . . . . . . . . . . . . . . . . . . . . . . . . . . . . . . . . . . . . . 22,969 13,906Accounts receivable, net of allowance for doubtful accounts of $6,270 and
$5,635 . . . . . . . . . . . . . . . . . . . . . . . . . . . . . . . . . . . . . . . . . . . . . . . . . . . . . . . . 183,804 185,444Prepaid expenses . . . . . . . . . . . . . . . . . . . . . . . . . . . . . . . . . . . . . . . . . . . . . . . . . . 47,727 38,473Other current assets . . . . . . . . . . . . . . . . . . . . . . . . . . . . . . . . . . . . . . . . . . . . . . . 48,061 60,496
Total current assets . . . . . . . . . . . . . . . . . . . . . . . . . . . . . . . . . . . . . . . . . . . . 628,433 515,688Marketable investments . . . . . . . . . . . . . . . . . . . . . . . . . . . . . . . . . . . . . . . . . . . . . . . . 26,300 17,823Property and equipment, net . . . . . . . . . . . . . . . . . . . . . . . . . . . . . . . . . . . . . . . . . . . . . 66,879 91,501Goodwill, net of accumulated amortization of $45,771 and $72,132 . . . . . . . . . . . . . 88,034 62,356Other intangible assets, net of accumulated amortization of $22,864 and $35,779 . . . 43,645 30,482Other assets . . . . . . . . . . . . . . . . . . . . . . . . . . . . . . . . . . . . . . . . . . . . . . . . . . . . . . . . . . 71,592 79,988
Total assets . . . . . . . . . . . . . . . . . . . . . . . . . . . . . . . . . . . . . . . . . . . . . . . . . . $ 924,883 $ 797,838
L I A B I L I T I E S AND S TOCKHOLDER S ’ EQU I T Y
Current liabilities:Accounts payable . . . . . . . . . . . . . . . . . . . . . . . . . . . . . . . . . . . . . . . . . . . . . . . . . $ 30,944 $ 28,640Accrued expenses . . . . . . . . . . . . . . . . . . . . . . . . . . . . . . . . . . . . . . . . . . . . . . . . . 47,801 55,016Accrued compensation and severance . . . . . . . . . . . . . . . . . . . . . . . . . . . . . . . . . 52,112 68,936Deferred revenue . . . . . . . . . . . . . . . . . . . . . . . . . . . . . . . . . . . . . . . . . . . . . . . . . 231,495 207,044
Total current liabilities . . . . . . . . . . . . . . . . . . . . . . . . . . . . . . . . . . . . . . . . . 362,352 359,636
Other liabilities . . . . . . . . . . . . . . . . . . . . . . . . . . . . . . . . . . . . . . . . . . . . . . . . . . . . . . . 33,989 38,500
Commitments and contingencies (Note F)
Stockholders’ equity:Preferred stock, $0.01 par value; 5,000 shares authorized; none issued . . . . . . . — —Common stock, $0.01 par value; 500,000 shares authorized; 276,053 shares
issued . . . . . . . . . . . . . . . . . . . . . . . . . . . . . . . . . . . . . . . . . . . . . . . . . . . . . . . . 2,761 2,761Additional paid-in capital . . . . . . . . . . . . . . . . . . . . . . . . . . . . . . . . . . . . . . . . . . . 1,641,513 1,643,626Treasury stock, at cost, 6,456 and 15,515 shares . . . . . . . . . . . . . . . . . . . . . . . . . (66,647) (173,504)Accumulated deficit . . . . . . . . . . . . . . . . . . . . . . . . . . . . . . . . . . . . . . . . . . . . . . . (1,036,456) (1,045,096)Accumulated other comprehensive loss . . . . . . . . . . . . . . . . . . . . . . . . . . . . . . . . (12,629) (28,085)
Total stockholders’ equity . . . . . . . . . . . . . . . . . . . . . . . . . . . . . . . . . . . . . . 528,542 399,702
Total liabilities and stockholders’ equity . . . . . . . . . . . . . . . . . . . . . . . . . . . $ 924,883 $ 797,838
The accompanying notes are an integral part of the consolidated financial statements.
F-1

PARAMETRIC TECHNOLOGY CORPORATION
CONSOLIDATED STATEMENTS OF INCOME(in thousands, except per share data)
Year ended September 30,
1999 2000 2001
Revenue:License . . . . . . . . . . . . . . . . . . . . . . . . . . . . . . . . . . . . . . . . . . . . . . . . . . . . $ 561,220 $378,618 $381,882Service . . . . . . . . . . . . . . . . . . . . . . . . . . . . . . . . . . . . . . . . . . . . . . . . . . . . . 496,381 549,796 552,724
Total revenue . . . . . . . . . . . . . . . . . . . . . . . . . . . . . . . . . . . . . . . . . . 1,057,601 928,414 934,606
Costs and expenses:Cost of license revenue . . . . . . . . . . . . . . . . . . . . . . . . . . . . . . . . . . . . . . . . 16,508 16,718 15,734Cost of service revenue . . . . . . . . . . . . . . . . . . . . . . . . . . . . . . . . . . . . . . . . 191,147 228,266 236,837Sales and marketing . . . . . . . . . . . . . . . . . . . . . . . . . . . . . . . . . . . . . . . . . . 407,936 416,665 380,902Research and development . . . . . . . . . . . . . . . . . . . . . . . . . . . . . . . . . . . . . 124,131 143,763 148,942General and administrative . . . . . . . . . . . . . . . . . . . . . . . . . . . . . . . . . . . . . 62,852 71,263 74,683Amortization of goodwill and other intangible assets . . . . . . . . . . . . . . . . . 22,888 38,432 37,942Acquisition and nonrecurring charges (Note B) . . . . . . . . . . . . . . . . . . . . . 53,347 21,534 42,568
Total costs and expenses . . . . . . . . . . . . . . . . . . . . . . . . . . . . . . . . . 878,809 936,641 937,608
Operating income (loss) . . . . . . . . . . . . . . . . . . . . . . . . . . . . . . . . . . . . . . . . 178,792 (8,227) (3,002)Interest income . . . . . . . . . . . . . . . . . . . . . . . . . . . . . . . . . . . . . . . . . . . . . . (11,283) (13,228) (10,049)Other expense, net . . . . . . . . . . . . . . . . . . . . . . . . . . . . . . . . . . . . . . . . . . . . 8,833 10,068 7,554Write-down of investments . . . . . . . . . . . . . . . . . . . . . . . . . . . . . . . . . . . . . — — 10,354
Income (loss) before income taxes . . . . . . . . . . . . . . . . . . . . . . . . . . . . . . . . . 181,242 (5,067) (10,861)Provision (benefit) for income taxes . . . . . . . . . . . . . . . . . . . . . . . . . . . . . . 61,949 (1,087) (2,647)
Net income (loss) $ 119,293 $ (3,980) $ (8,214)
Earnings (loss) per share (Note A):Basic . . . . . . . . . . . . . . . . . . . . . . . . . . . . . . . . . . . . . . . . . . . . . . . . . . . . . . $ 0.44 $ (0.01) $ (0.03)Diluted . . . . . . . . . . . . . . . . . . . . . . . . . . . . . . . . . . . . . . . . . . . . . . . . . . . . . $ 0.43 $ (0.01) $ (0.03)
The accompanying notes are an integral part of the consolidated financial statements.
F-2

PARAMETRIC TECHNOLOGY CORPORATION
CONSOLIDATED STATEMENTS OF CASH FLOWS(in thousands)
Year ended September 30,
1999 2000 2001
Cash flows from operating activities:Net income (loss) . . . . . . . . . . . . . . . . . . . . . . . . . . . . . . . . . . . . . . . . . . . . . . . . . . . . . . . . . . . . . . . . . . . $119,293 $ (3,980) $ (8,214)Adjustments to reconcile net income (loss) to net cash flows from operating activities:
Non-cash portion of nonrecurring charges and write-down of investments . . . . . . . . . . . . . . . . . . . . 4,693 2,499 14,404Depreciation and amortization . . . . . . . . . . . . . . . . . . . . . . . . . . . . . . . . . . . . . . . . . . . . . . . . . . . . . . . 62,283 78,769 76,370Deferred income taxes . . . . . . . . . . . . . . . . . . . . . . . . . . . . . . . . . . . . . . . . . . . . . . . . . . . . . . . . . . . . . (16,914) (4,838) (15,039)Provision for loss on accounts receivable . . . . . . . . . . . . . . . . . . . . . . . . . . . . . . . . . . . . . . . . . . . . . . 4,445 7,589 2,930Charge for purchased in-process research and development . . . . . . . . . . . . . . . . . . . . . . . . . . . . . . . . 38,244 — —Changes in assets and liabilities which provided (used) cash, net of effects of purchased
businesses:Accounts receivable . . . . . . . . . . . . . . . . . . . . . . . . . . . . . . . . . . . . . . . . . . . . . . . . . . . . . . . . . . . . . (35,393) 29,427 (4,570)Accounts payable and accrued expenses . . . . . . . . . . . . . . . . . . . . . . . . . . . . . . . . . . . . . . . . . . . . . (35,663) (19,210) 15,552Accrued compensation and severance . . . . . . . . . . . . . . . . . . . . . . . . . . . . . . . . . . . . . . . . . . . . . . . (26,898) (7,218) 14,723Deferred revenue . . . . . . . . . . . . . . . . . . . . . . . . . . . . . . . . . . . . . . . . . . . . . . . . . . . . . . . . . . . . . . . 64,012 18,436 (24,451)Income taxes . . . . . . . . . . . . . . . . . . . . . . . . . . . . . . . . . . . . . . . . . . . . . . . . . . . . . . . . . . . . . . . . . . 16,556 (55,601) (1,818)Other current assets and prepaid expenses . . . . . . . . . . . . . . . . . . . . . . . . . . . . . . . . . . . . . . . . . . . (35,109) 6,245 (10,583)Other noncurrent assets and liabilities . . . . . . . . . . . . . . . . . . . . . . . . . . . . . . . . . . . . . . . . . . . . . . . (8,708) (267) (8,225)
Net cash provided by operating activities . . . . . . . . . . . . . . . . . . . . . . . . . . . . . . . . . . . . . . . . . . . . . . . . 150,841 51,851 51,079
Cash flows from investing activities:Additions to property and equipment . . . . . . . . . . . . . . . . . . . . . . . . . . . . . . . . . . . . . . . . . . . . . . . . . . . (35,246) (37,032) (61,388)Additions to other intangible assets . . . . . . . . . . . . . . . . . . . . . . . . . . . . . . . . . . . . . . . . . . . . . . . . . . . . . (24,133) (2,784) (2,982)Acquisitions of businesses . . . . . . . . . . . . . . . . . . . . . . . . . . . . . . . . . . . . . . . . . . . . . . . . . . . . . . . . . . . . (72,925) (7,922) —Construction in progress . . . . . . . . . . . . . . . . . . . . . . . . . . . . . . . . . . . . . . . . . . . . . . . . . . . . . . . . . . . . . (28,284) (4,106) —Proceeds from sale of construction in progress . . . . . . . . . . . . . . . . . . . . . . . . . . . . . . . . . . . . . . . . . . . . — 30,836 —Purchases of investments . . . . . . . . . . . . . . . . . . . . . . . . . . . . . . . . . . . . . . . . . . . . . . . . . . . . . . . . . . . . . (95,416) (53,732) (38,048)Proceeds from sales and maturities of investments . . . . . . . . . . . . . . . . . . . . . . . . . . . . . . . . . . . . . . . . . 196,918 115,262 55,681
Net cash provided (used) by investing activities . . . . . . . . . . . . . . . . . . . . . . . . . . . . . . . . . . . . . . . . . . . (59,086) 40,522 (46,737)
Cash flows from financing activities:Proceeds from issuance of common stock . . . . . . . . . . . . . . . . . . . . . . . . . . . . . . . . . . . . . . . . . . . . . . . . 23,866 79,621 24,232Purchases of treasury stock . . . . . . . . . . . . . . . . . . . . . . . . . . . . . . . . . . . . . . . . . . . . . . . . . . . . . . . . . . . (89,968) (90,020) (131,708)
Net cash used by financing activities . . . . . . . . . . . . . . . . . . . . . . . . . . . . . . . . . . . . . . . . . . . . . . . . . . . . (66,102) (10,399) (107,476)
Effect of exchange rate changes on cash . . . . . . . . . . . . . . . . . . . . . . . . . . . . . . . . . . . . . . . . . . . . . . . . . . . 8,165 4,109 (5,369)
Net increase (decrease) in cash and cash equivalents . . . . . . . . . . . . . . . . . . . . . . . . . . . . . . . . . . . . . . . 33,818 86,083 (108,503)Cash and cash equivalents, beginning of year . . . . . . . . . . . . . . . . . . . . . . . . . . . . . . . . . . . . . . . . . . . . . . . 205,971 239,789 325,872
Cash and cash equivalents, end of year . . . . . . . . . . . . . . . . . . . . . . . . . . . . . . . . . . . . . . . . . . . . . . . . . . $239,789 $325,872 $ 217,369
The accompanying notes are an integral part of the consolidated financial statements.
F-3
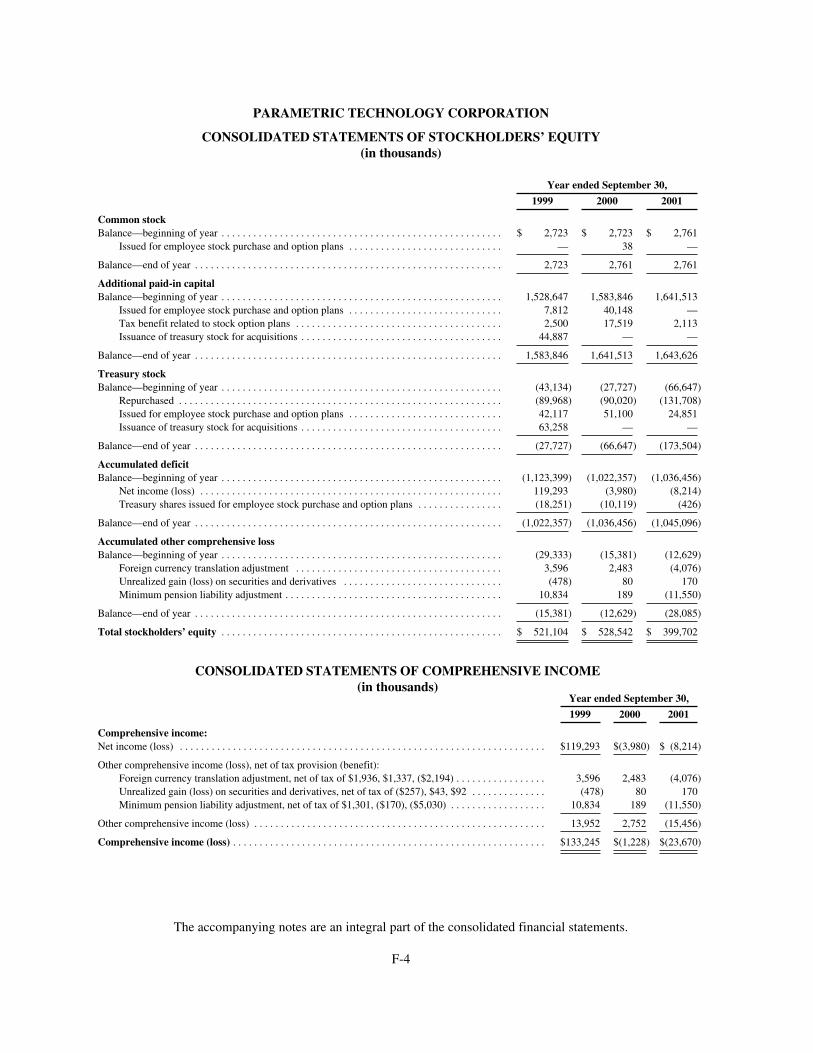
PARAMETRIC TECHNOLOGY CORPORATION
CONSOLIDATED STATEMENTS OF STOCKHOLDERS’ EQUITY(in thousands)
Year ended September 30,
1999 2000 2001
Common stockBalance—beginning of year . . . . . . . . . . . . . . . . . . . . . . . . . . . . . . . . . . . . . . . . . . . . . . . . . . . . . $ 2,723 $ 2,723 $ 2,761
Issued for employee stock purchase and option plans . . . . . . . . . . . . . . . . . . . . . . . . . . . . . — 38 —
Balance—end of year . . . . . . . . . . . . . . . . . . . . . . . . . . . . . . . . . . . . . . . . . . . . . . . . . . . . . . . . . . 2,723 2,761 2,761
Additional paid-in capitalBalance—beginning of year . . . . . . . . . . . . . . . . . . . . . . . . . . . . . . . . . . . . . . . . . . . . . . . . . . . . . 1,528,647 1,583,846 1,641,513
Issued for employee stock purchase and option plans . . . . . . . . . . . . . . . . . . . . . . . . . . . . . 7,812 40,148 —Tax benefit related to stock option plans . . . . . . . . . . . . . . . . . . . . . . . . . . . . . . . . . . . . . . . 2,500 17,519 2,113Issuance of treasury stock for acquisitions . . . . . . . . . . . . . . . . . . . . . . . . . . . . . . . . . . . . . . 44,887 — —
Balance—end of year . . . . . . . . . . . . . . . . . . . . . . . . . . . . . . . . . . . . . . . . . . . . . . . . . . . . . . . . . . 1,583,846 1,641,513 1,643,626
Treasury stockBalance—beginning of year . . . . . . . . . . . . . . . . . . . . . . . . . . . . . . . . . . . . . . . . . . . . . . . . . . . . . (43,134) (27,727) (66,647)
Repurchased . . . . . . . . . . . . . . . . . . . . . . . . . . . . . . . . . . . . . . . . . . . . . . . . . . . . . . . . . . . . . (89,968) (90,020) (131,708)Issued for employee stock purchase and option plans . . . . . . . . . . . . . . . . . . . . . . . . . . . . . 42,117 51,100 24,851Issuance of treasury stock for acquisitions . . . . . . . . . . . . . . . . . . . . . . . . . . . . . . . . . . . . . . 63,258 — —
Balance—end of year . . . . . . . . . . . . . . . . . . . . . . . . . . . . . . . . . . . . . . . . . . . . . . . . . . . . . . . . . . (27,727) (66,647) (173,504)
Accumulated deficitBalance—beginning of year . . . . . . . . . . . . . . . . . . . . . . . . . . . . . . . . . . . . . . . . . . . . . . . . . . . . . (1,123,399) (1,022,357) (1,036,456)
Net income (loss) . . . . . . . . . . . . . . . . . . . . . . . . . . . . . . . . . . . . . . . . . . . . . . . . . . . . . . . . . 119,293 (3,980) (8,214)Treasury shares issued for employee stock purchase and option plans . . . . . . . . . . . . . . . . (18,251) (10,119) (426)
Balance—end of year . . . . . . . . . . . . . . . . . . . . . . . . . . . . . . . . . . . . . . . . . . . . . . . . . . . . . . . . . . (1,022,357) (1,036,456) (1,045,096)
Accumulated other comprehensive lossBalance—beginning of year . . . . . . . . . . . . . . . . . . . . . . . . . . . . . . . . . . . . . . . . . . . . . . . . . . . . . (29,333) (15,381) (12,629)
Foreign currency translation adjustment . . . . . . . . . . . . . . . . . . . . . . . . . . . . . . . . . . . . . . . 3,596 2,483 (4,076)Unrealized gain (loss) on securities and derivatives . . . . . . . . . . . . . . . . . . . . . . . . . . . . . . (478) 80 170Minimum pension liability adjustment . . . . . . . . . . . . . . . . . . . . . . . . . . . . . . . . . . . . . . . . . 10,834 189 (11,550)
Balance—end of year . . . . . . . . . . . . . . . . . . . . . . . . . . . . . . . . . . . . . . . . . . . . . . . . . . . . . . . . . . (15,381) (12,629) (28,085)
Total stockholders’ equity . . . . . . . . . . . . . . . . . . . . . . . . . . . . . . . . . . . . . . . . . . . . . . . . . . . . . $ 521,104 $ 528,542 $ 399,702
CONSOLIDATED STATEMENTS OF COMPREHENSIVE INCOME(in thousands)
Year ended September 30,
1999 2000 2001
Comprehensive income:Net income (loss) . . . . . . . . . . . . . . . . . . . . . . . . . . . . . . . . . . . . . . . . . . . . . . . . . . . . . . . . . . . . . . . . . . . . . $119,293 $(3,980) $ (8,214)
Other comprehensive income (loss), net of tax provision (benefit):Foreign currency translation adjustment, net of tax of $1,936, $1,337, ($2,194) . . . . . . . . . . . . . . . . . 3,596 2,483 (4,076)Unrealized gain (loss) on securities and derivatives, net of tax of ($257), $43, $92 . . . . . . . . . . . . . . (478) 80 170Minimum pension liability adjustment, net of tax of $1,301, ($170), ($5,030) . . . . . . . . . . . . . . . . . . 10,834 189 (11,550)
Other comprehensive income (loss) . . . . . . . . . . . . . . . . . . . . . . . . . . . . . . . . . . . . . . . . . . . . . . . . . . . . . . . 13,952 2,752 (15,456)
Comprehensive income (loss) . . . . . . . . . . . . . . . . . . . . . . . . . . . . . . . . . . . . . . . . . . . . . . . . . . . . . . . . . . . $133,245 $(1,228) $(23,670)
The accompanying notes are an integral part of the consolidated financial statements.
F-4

PARAMETRIC TECHNOLOGY CORPORATION
NOTES TO CONSOLIDATED FINANCIAL STATEMENTS
A. Summary of Significant Accounting Policies
Business
Parametric Technology Corporation (PTC), founded in 1985 and headquartered in Needham, MA, develops,markets and supports collaborative product development (CPD) software solutions that help manufacturersimprove the competitiveness of their products and product development processes. These solutions, whichinclude a suite of mechanical computer-aided design tools and a range of Internet-based collaborationtechnologies, enable manufacturing companies to create digital products, collaborate on designs within theenterprise and throughout the extended supply chain, and control the digital product information throughout theproduct lifecycle, resulting in streamlined engineering processes, improved product quality, optimized productinformation management and reduced cost and time-to-market cycles. Our CPD software solutions arecomplemented by the strength and experience of our Global Services Organization, as well as our systemsintegrators and other strategic partners, who provide training, consulting, ancillary product offerings,implementation and support to customers worldwide. We operate in a single industry segment-computer softwareand related services.
Basis of Presentation
Our fiscal year-end is September 30. The consolidated financial statements include the parent company and itswholly owned subsidiaries, including those operating outside the U.S. All intercompany balances andtransactions have been eliminated in the financial statements. Certain reclassifications have been made forconsistent presentation. We prepare our financial statements under generally accepted accounting principles thatrequire management to make estimates and assumptions that affect the amounts reported and the relateddisclosures. Actual results could differ from these estimates.
Foreign Currency Translation
For our foreign operations where the functional currency is the local currency, we translate assets and liabilitiesat rates in effect at the balance sheet date and record translation adjustments in stockholders’ equity. As ofSeptember 30, 2000 and 2001, a cumulative translation adjustment gain of $3.7 million and a loss of $416,000,net of tax, is included in the accumulated other comprehensive income (loss) component of stockholders’ equity.For our foreign operations where the U.S. dollar is the functional currency, we translate monetary assets andliabilities using exchange rates in effect at the balance sheet date and nonmonetary assets and liabilities athistorical rates and record translation adjustments in other expense in the statement of income. We translateincome statement amounts at average rates for the period. Transaction gains and losses are recorded in otherexpense in the statement of income.
Revenue Recognition
Our revenue is derived from the licensing of computer software products and from service revenue consisting oftraining, consulting and maintenance. License revenue is recognized upon contract execution, provided allshipment obligations have been met, fees are fixed or determinable, and collection is probable. Revenue fromsoftware maintenance contracts is recognized ratably over the contract period. Revenue from consulting andtraining is recognized as performed. Revenue from software maintenance contracts, consulting and training isincluded in services revenue in the accompanying statements of income.
In December 1999, the Securities and Exchange Commission (“SEC”) issued Staff Accounting Bulletin (“SAB”)101, Revenue Recognition in Financial Statements, which provides guidance related to revenue recognition based oninterpretations and practices followed by the SEC. We adopted SAB 101, as amended, in the fourth quarter of fiscal2001 as required. The adoption of SAB 101 did not have a material effect on our consolidated financial statements.
F-5

PARAMETRIC TECHNOLOGY CORPORATION
NOTES TO CONSOLIDATED FINANCIAL STATEMENTS—(Continued)
Cash, Cash Equivalents and Marketable Investments
Our cash is invested in debt instruments of financial institutions, government entities, corporations and mutualfunds. We have established guidelines relative to credit ratings, diversification and maturities that are intended tomaintain safety and liquidity. Our cash equivalents include highly liquid investments with maturity periods ofthree months or less when purchased. Our short-term investments include those investments with maturities inexcess of three months but less than one year. Our marketable investments are those with maturities in excess ofone year but less than two years. Our cash equivalents and short-term and marketable investments are classifiedas available for sale and reported at fair value with an unrealized loss of $40,000, net of tax, and an unrealizedgain of $130,000, net of tax, included in the accumulated other comprehensive income (loss) component ofstockholders’ equity as of September 30, 2000 and 2001, respectively.
Concentration of Credit Risk and Fair Value of Financial Instruments
The amounts reflected in the consolidated balance sheets for cash and cash equivalents, accounts receivable andaccounts payable approximate their fair value due to their short maturities. Financial instruments that potentiallysubject us to concentration of credit risk consist primarily of investments, trade receivables and derivatives. Ourcash, cash equivalents, investments and derivatives are held with financial institutions with high credit standings.Our customer base consists of large numbers of geographically diverse customers dispersed across manyindustries. As a result, concentration of credit risk with respect to trade receivables is not significant except for areceivable from our largest distributor, which accounts for 12% and 7% of total receivables as of September 30,2000 and 2001, respectively.
Trade Accounts Receivable Allowance for Doubtful Accounts
Our allowance for doubtful accounts was $6.4 million, $6.3 million and $5.6 million as of September 30, 1999,2000 and 2001, respectively. Uncollectible trade accounts receivable written-off, net of recoveries, was $5.7million, $7.7 million and $3.6 million for 1999, 2000 and 2001, respectively.
Transfers of Financial Assets
We offer our customers the option to purchase software and services through payment plans. In general, wetransfer future payments under certain of these contracts to third-party financing institutions on a non-recoursebasis. We record such transfers as sales of the related accounts receivable when we surrender control of suchreceivables under the provisions of Statement of Financial Accounting Standards (SFAS) No. 140, Accountingfor Transfers and Servicing of Financial Assets and Extinguishments of Liabilities.
Derivatives
Effective October 1, 2000, we adopted SFAS No. 133, Accounting for Derivative Instruments and HedgingActivities, (SFAS No. 133) which established accounting and reporting standards for derivative instruments,including certain derivative instruments embedded in other contracts, and for hedging activities. All derivatives,whether designated in a hedging relationship or not, are required to be recorded on the balance sheet at fair value.SFAS No. 133 also requires that changes in the derivative’s fair value be recognized currently in earnings unlessspecific hedge accounting criteria are met, and that the company formally document, designate, and assess theeffectiveness of transactions that receive hedge accounting. The effectiveness of the derivative as a hedginginstrument is based on changes in its market value being highly correlated with changes in the market value ofthe underlying hedged item.
Derivatives are financial instruments whose value is derived from one or more underlying financial instruments,such as foreign currency. We enter into derivative transactions, specifically foreign currency forward contracts
F-6

PARAMETRIC TECHNOLOGY CORPORATION
NOTES TO CONSOLIDATED FINANCIAL STATEMENTS—(Continued)
and foreign currency option contracts, to manage our exposure to fluctuations in foreign exchange rates. Thecontracts are primarily in European currencies and Japanese yen and have maturities of less than one year. Anyderivative we enter into is designated at inception as a hedge of risks associated with specific assets, liabilities orfuture commitments and is monitored to determine if it remains an effective hedge. We do not enter into or holdderivatives for trading or speculative purposes.
We routinely use forward contracts to hedge specific foreign currency-denominated receivables. These contracts,which are not designated as hedging instruments under SFAS No. 133, have maturities of less than three monthsand require us to exchange foreign currencies for U.S. dollars at maturity at rates agreed to at inception of thecontracts. All foreign currency transactions and all outstanding forward contracts are marked-to-market at theend of each accounting period with unrealized gains and losses recorded in other expenses in the statement ofincome. As of September 30, 2000 and 2001, we had outstanding forward contracts of approximately $116.0million and $149.4 million, respectively. Net unrealized and realized gains and losses associated with exchangerate fluctuations on forward contracts and the underlying foreign currency exposure being hedged wereimmaterial for all periods presented.
We also use foreign currency option contracts, with maturities of less than three months, to hedge specificforecasted net cash flow transactions that are derived from international revenue levels. These hedges aredesignated as effective cash flow hedging instruments under SFAS No. 133 and are marked-to-market at the endof each accounting period. The premiums to purchase option contracts are capitalized in other assets andrecorded in other expense in the statement of income over the life of the contract. The effective portion of thechanges in the fair value of the option contracts are recorded in other comprehensive income, and subsequentlyrecognized in license and service revenue in the period in which the forecasted transactions occurs. As ofSeptember 30, 2000 and 2001, there were no foreign currency option contracts outstanding. The adoption ofSFAS No. 133 did not have a material effect on our consolidated financial statements.
Property and Equipment
Property and equipment are recorded at cost and depreciated using the straight-line method over their estimateduseful lives. Computer hardware and software are typically amortized over three to five years, and furniture andfixtures three to eight years. Leasehold improvements are amortized over the shorter of their useful lives or theremaining terms of the related leases. Property and equipment under capital leases are amortized over the lesserof the lease terms or their estimated useful lives. Maintenance and repairs are charged to expense when incurred;additions and improvements are capitalized. When an item is sold or retired, the cost and related accumulateddepreciation is relieved, and the resulting gain or loss, if any, is recognized in income.
Goodwill and Other Intangible Assets
Goodwill and other intangible assets include the values attributable to intangible assets acquired and areamortized using the straight-line method. Goodwill is amortized over five to seven years and other intangibleassets, such as assembled workforces, customer lists and developed technology, are amortized over three to fiveyears. Trademarks, which are also included in other intangible assets, are amortized over seven years.
Management regularly evaluates the net realizable value of long lived assets including property and equipment,computer software costs and goodwill and other intangible assets relying on a number of factors includingoperating results, business plans, budgets and economic projections.
Computer Software Costs
We incur costs to develop computer software to be licensed or otherwise marketed to customers. Developmentcosts incurred in the research and development of new software products and enhancements to existing productsare expensed in the period incurred, unless these costs qualify for capitalization. Capitalized computer softwarecosts related to internal development efforts are not material.
F-7
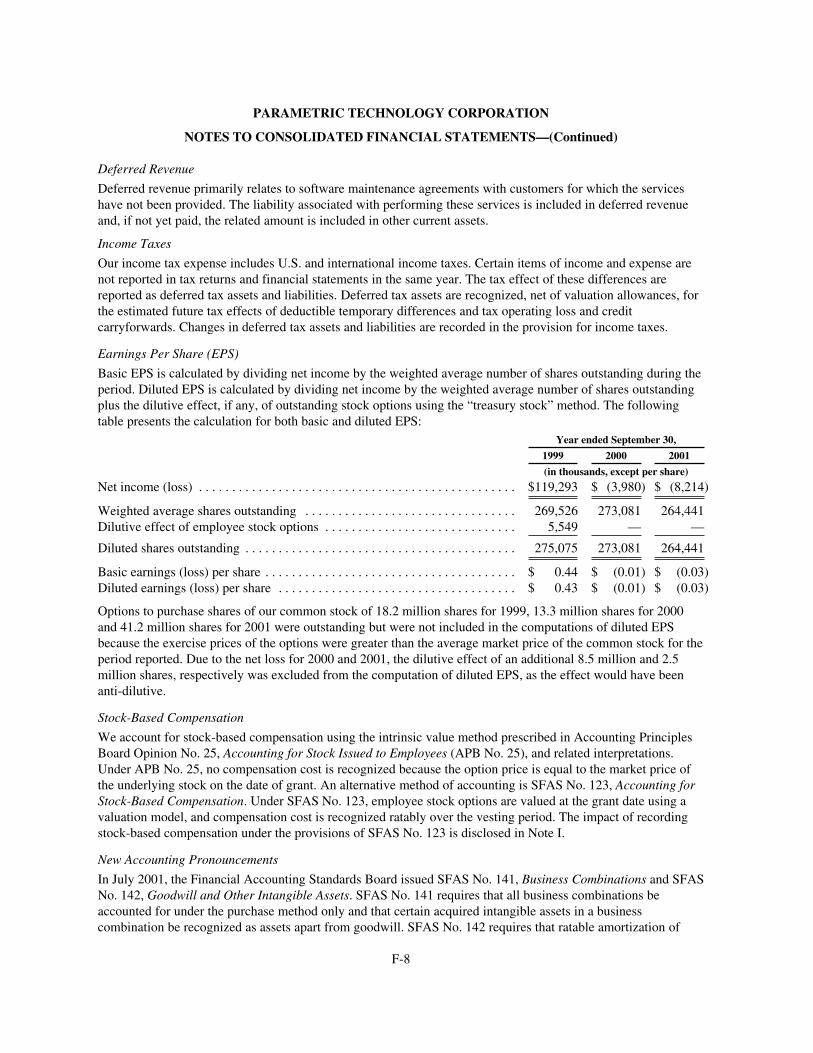
PARAMETRIC TECHNOLOGY CORPORATION
NOTES TO CONSOLIDATED FINANCIAL STATEMENTS—(Continued)
Deferred Revenue
Deferred revenue primarily relates to software maintenance agreements with customers for which the serviceshave not been provided. The liability associated with performing these services is included in deferred revenueand, if not yet paid, the related amount is included in other current assets.
Income Taxes
Our income tax expense includes U.S. and international income taxes. Certain items of income and expense arenot reported in tax returns and financial statements in the same year. The tax effect of these differences arereported as deferred tax assets and liabilities. Deferred tax assets are recognized, net of valuation allowances, forthe estimated future tax effects of deductible temporary differences and tax operating loss and creditcarryforwards. Changes in deferred tax assets and liabilities are recorded in the provision for income taxes.
Earnings Per Share (EPS)
Basic EPS is calculated by dividing net income by the weighted average number of shares outstanding during theperiod. Diluted EPS is calculated by dividing net income by the weighted average number of shares outstandingplus the dilutive effect, if any, of outstanding stock options using the “treasury stock” method. The followingtable presents the calculation for both basic and diluted EPS:
Year ended September 30,
1999 2000 2001
(in thousands, except per share)
Net income (loss) . . . . . . . . . . . . . . . . . . . . . . . . . . . . . . . . . . . . . . . . . . . . . . . . $119,293 $ (3,980) $ (8,214)
Weighted average shares outstanding . . . . . . . . . . . . . . . . . . . . . . . . . . . . . . . . 269,526 273,081 264,441Dilutive effect of employee stock options . . . . . . . . . . . . . . . . . . . . . . . . . . . . . 5,549 — —
Diluted shares outstanding . . . . . . . . . . . . . . . . . . . . . . . . . . . . . . . . . . . . . . . . . 275,075 273,081 264,441
Basic earnings (loss) per share . . . . . . . . . . . . . . . . . . . . . . . . . . . . . . . . . . . . . . $ 0.44 $ (0.01) $ (0.03)Diluted earnings (loss) per share . . . . . . . . . . . . . . . . . . . . . . . . . . . . . . . . . . . . $ 0.43 $ (0.01) $ (0.03)
Options to purchase shares of our common stock of 18.2 million shares for 1999, 13.3 million shares for 2000and 41.2 million shares for 2001 were outstanding but were not included in the computations of diluted EPSbecause the exercise prices of the options were greater than the average market price of the common stock for theperiod reported. Due to the net loss for 2000 and 2001, the dilutive effect of an additional 8.5 million and 2.5million shares, respectively was excluded from the computation of diluted EPS, as the effect would have beenanti-dilutive.
Stock-Based Compensation
We account for stock-based compensation using the intrinsic value method prescribed in Accounting PrinciplesBoard Opinion No. 25, Accounting for Stock Issued to Employees (APB No. 25), and related interpretations.Under APB No. 25, no compensation cost is recognized because the option price is equal to the market price ofthe underlying stock on the date of grant. An alternative method of accounting is SFAS No. 123, Accounting forStock-Based Compensation. Under SFAS No. 123, employee stock options are valued at the grant date using avaluation model, and compensation cost is recognized ratably over the vesting period. The impact of recordingstock-based compensation under the provisions of SFAS No. 123 is disclosed in Note I.
New Accounting Pronouncements
In July 2001, the Financial Accounting Standards Board issued SFAS No. 141, Business Combinations and SFASNo. 142, Goodwill and Other Intangible Assets. SFAS No. 141 requires that all business combinations beaccounted for under the purchase method only and that certain acquired intangible assets in a businesscombination be recognized as assets apart from goodwill. SFAS No. 142 requires that ratable amortization of
F-8

PARAMETRIC TECHNOLOGY CORPORATION
NOTES TO CONSOLIDATED FINANCIAL STATEMENTS—(Continued)
goodwill be replaced with periodic tests of the goodwill’s impairment and that certain intangible assets other thangoodwill be amortized over their useful lives. SFAS No. 141 is effective for all business combinations initiatedafter June 30, 2001. The provisions of SFAS No. 142 will be effective for fiscal years beginning after December15, 2001. We will not be required to adopt SFAS No. 142 until fiscal 2003; however, early adoption is allowed infiscal 2002. We have not determined if we will elect early adoption of SFAS No. 142.
B. Acquisitions, Nonrecurring Charges and Write-down of Investments
Acquisitions
InPart
In October 1998, we acquired all of the outstanding stock in InPart Design, Inc. by issuing 2.0 million shares ofour common stock. As of September 30, 1999, we issued 600,000 additional shares to satisfy certain contingentconditions, which were included in the purchase price described below. In addition, we reserved 386,000 sharesof common stock for outstanding InPart options assumed. The acquisition was accounted for as a purchase.Accordingly, we allocated the purchase price of $38.1 million to the assets acquired and liabilities assumed basedon our estimates of fair value. The values assigned included $741,000 for net liabilities assumed, $10.6 millionfor purchased in-process R&D and $5.7 million for other intangible assets. The excess purchase price over theamounts allocated to assets acquired and liabilities assumed was recorded as goodwill of $22.5 million.
Division
In March 1999, we acquired Division Group plc for $37.3 million in cash and 593,000 shares of our commonstock. The acquisition was accounted for as a purchase. Accordingly, we allocated the purchase price of $48.1million to the assets acquired and liabilities assumed based on our estimates of fair value. The values assignedincluded $555,000 for net assets acquired, $9.0 million for purchased in-process R&D and $8.8 million for otherintangible assets. The excess purchase price over the amounts allocated to assets acquired and liabilities assumedwas recorded as goodwill of $29.8 million.
auxilium
In March 1999, we acquired all of the outstanding stock of auxilium inc. in exchange for 2.6 million shares of ourcommon stock and $39.4 million in cash. In addition, we reserved 1.1 million shares of common stock foroutstanding auxilium options assumed. The acquisition was accounted for as a purchase. Accordingly, weallocated the purchase price of $101.7 million to the assets acquired and liabilities assumed based on ourestimates of fair value. The values assigned included $182,000 for net liabilities assumed, $18.6 million forpurchased in-process R&D and $12.3 million for other intangible assets. The excess purchase price over theamounts allocated to assets acquired and liabilities assumed was recorded as goodwill of $70.9 million.
The operating results of InPart, Division and auxilium have been included in our results of operations from thedate of each acquisition. Our purchases of InPart, Division and auxilium did not require the presentation of proforma information.
In the opinion of management, the purchased in-process R&D for the acquisitions of InPart, Division andauxilium had not yet reached technological feasibility and had no alternative future use. Accordingly, werecorded nonrecurring charges of $10.6 million in the first quarter of 1999 related to InPart and $27.6 million inthe second quarter of 1999 related to Division and auxilium. The values assigned to purchased in-process R&Dwere determined by identifying research projects for which technological feasibility had not been established.
F-9

PARAMETRIC TECHNOLOGY CORPORATION
NOTES TO CONSOLIDATED FINANCIAL STATEMENTS—(Continued)
The values of the purchased in-process R&D were determined by estimating the stage of completion, includingconsideration of the complexity of the work completed, the costs incurred and the projected cost to complete, thecontribution of any core technology and other acquired assets and the projected product introduction dates,estimating the resulting net cash flows from the products developed and discounting the net cash flows back totheir present value. The discount rates used included a factor that took into account the uncertainty surroundingthe successful development of the purchased in-process technology for each acquisition
Write-down of Investments
In 2001, we recorded a $10.4 million non-cash write-down on several equity investments, included in other long-term assets, to reflect other than temporary declines in valuation and an unsettled near-term market outlook. AtSeptember 30, 2000 and 2001, equity investments were $12.4 million and $2.0 million, respectively.
Nonrecurring Charges
In 1999, we reorganized our sales force and, in connection with this action, incurred nonrecurring charges of $9.0million for the severance and termination benefits of approximately 320 people who were terminated during1999 in connection with the integration of our sales and related support groups. All amounts related to terminatedemployees were paid in 1999. Also in 1999, we incurred a nonrecurring charge of $1.4 million for theconsolidation of certain excess leased facilities and we recorded an impairment loss of $4.7 million on certainintangible assets related to our industrial design (CDRS) activities. Due to recent acquisitions and thedevelopment of new technology, the carrying value of these assets was impaired.
In 2000, we recorded nonrecurring charges of $21.5 million, primarily associated with our reorganization intobusiness units and with the development and execution of management’s plans to reduce our cost structure andimprove profitability. The nonrecurring charge is comprised of $11.9 million for severance and terminationbenefits of approximately 280 people who were notified or terminated during the third quarter of 2000 and $9.6million for facility consolidations.
In 2001, we recorded nonrecurring charges of $42.6 million, primarily associated with a reduction in force toreduce our cost structure and improve profitability and a write-down of assets related to a focus shift in ourcontent aggregation business. The nonrecurring charge is comprised of $25.7 million for severance andtermination benefits of approximately 720 people who were notified or terminated in 2001, $9.9 million forfacility consolidations, and $7.0 million primarily for a write-down of assets related to a focus shift in certainproducts. Of the $42.6 million of nonrecurring charges, $4.0 million is non-cash related.
F-10

PARAMETRIC TECHNOLOGY CORPORATION
NOTES TO CONSOLIDATED FINANCIAL STATEMENTS—(Continued)
The following table summarizes all of our acquisition and nonrecurring charges activity:
September 30,
1999 2000 2001
(in thousands)
Beginning balance . . . . . . . . . . . . . . . . . . . . . . . . . . . . . . . . . . . . . . . . . . . . . . . . $ 69,601 $ 45,860 $ 34,586
Charges to operations:Employee severance and termination . . . . . . . . . . . . . . . . . . . . . . . . . . . . . . 8,242 11,908 25,652Purchased in-process R&D . . . . . . . . . . . . . . . . . . . . . . . . . . . . . . . . . . . . . 38,244 — —Asset write-offs . . . . . . . . . . . . . . . . . . . . . . . . . . . . . . . . . . . . . . . . . . . . . . 4,693 920 4,049Facility closures and related costs . . . . . . . . . . . . . . . . . . . . . . . . . . . . . . . . 1,912 8,706 9,879Lease terminations, contract obligations and other . . . . . . . . . . . . . . . . . . . 256 — 2,988
Total charges to operations . . . . . . . . . . . . . . . . . . . . . . . . . . . . . . . . . . . . . . . . . 53,347 21,534 42,568
Costs incurred:Employee severance and termination benefits . . . . . . . . . . . . . . . . . . . . . . . (11,422) (9,934) (14,035)Purchased in-process R&D . . . . . . . . . . . . . . . . . . . . . . . . . . . . . . . . . . . . . (38,244) — —Asset write-offs . . . . . . . . . . . . . . . . . . . . . . . . . . . . . . . . . . . . . . . . . . . . . . (4,693) (920) (4,049)Facility closures and related costs . . . . . . . . . . . . . . . . . . . . . . . . . . . . . . . . (17,475) (17,966) (8,688)Lease terminations, contract obligations and other . . . . . . . . . . . . . . . . . . . (5,254) (3,988) (1,035)
Total costs incurred . . . . . . . . . . . . . . . . . . . . . . . . . . . . . . . . . . . . . . . . . . . . . . . (77,088) (32,808) (27,807)
Ending balance . . . . . . . . . . . . . . . . . . . . . . . . . . . . . . . . . . . . . . . . . . . . . . . . . . . $ 45,860 $ 34,586 $ 49,347
Cash expenditures:Employee severance and termination benefits . . . . . . . . . . . . . . . . . . . . . . . $ 11,422 $ 8,354 $ 14,638Facility closures and related costs . . . . . . . . . . . . . . . . . . . . . . . . . . . . . . . . 17,475 17,966 8,688Lease terminations, contract obligations and other . . . . . . . . . . . . . . . . . . . 5,254 3,988 1,035
Total cash expenditures . . . . . . . . . . . . . . . . . . . . . . . . . . . . . . . . . . . . . . . . . . . . $ 34,151 $ 30,308 $ 24,361
Number of employee severances . . . . . . . . . . . . . . . . . . . . . . . . . . . . . . . . . . . . . 320 280 720
As of September 30, 2001, of the $49.3 million remaining in accrued acquisition and nonrecurring charges, $37.8million was included in current liabilities and $11.5 million in other liabilities, principally for facility andseverance costs.
F-11

PARAMETRIC TECHNOLOGY CORPORATION
NOTES TO CONSOLIDATED FINANCIAL STATEMENTS—(Continued)
C. Investments
The fair values of our investments have been determined through information obtained from market sources andmanagement estimates. We use a specific identification cost method to determine the gross realized gains andlosses on the sale of our securities. Realized gains and losses on the sale of investments were immaterial for1999, 2000 and 2001. The table below does not include equity investments included in other long-term assets.
September 30, 2000
AmortizedCost
GrossUnrealizedGains
GrossUnrealizedLosses
EstimatedFairValue
(in thousands)
Municipal debt securities . . . . . . . . . . . . . . . . . . . . . . . . . . . . . . . . . $ 57,778 $25 $(54) $ 57,749Mutual funds . . . . . . . . . . . . . . . . . . . . . . . . . . . . . . . . . . . . . . . . . . 68,219 — — 68,219Government agencies . . . . . . . . . . . . . . . . . . . . . . . . . . . . . . . . . . . 18,767 11 (44) 18,734
Total investments . . . . . . . . . . . . . . . . . . . . . . . . . . . . . . . . . . . . . . $144,764 $36 $(98) $144,702
Amounts included in:Cash and cash equivalents . . . . . . . . . . . . . . . . . . . . . . . . . . . . $ 95,433 $— $ — $ 95,433Short-term investments . . . . . . . . . . . . . . . . . . . . . . . . . . . . . . 23,000 23 (54) 22,969Marketable investments . . . . . . . . . . . . . . . . . . . . . . . . . . . . . . 26,331 13 (44) 26,300
Total investments . . . . . . . . . . . . . . . . . . . . . . . . . . . . . . . . . . . . . . $144,764 $36 $(98) $144,702
September 30, 2001
AmortizedCost
GrossUnrealizedGains
GrossUnrealizedLosses
EstimatedFairValue
(in thousands)
Municipal debt securities . . . . . . . . . . . . . . . . . . . . . . . . . . . . . . . . . $16,958 $ 9 $(24) $16,943Mutual funds . . . . . . . . . . . . . . . . . . . . . . . . . . . . . . . . . . . . . . . . . . . 46,751 — — 46,751Commercial paper . . . . . . . . . . . . . . . . . . . . . . . . . . . . . . . . . . . . . . . 11,280 118 (4) 11,394Government agencies . . . . . . . . . . . . . . . . . . . . . . . . . . . . . . . . . . . . 16,181 102 (1) 16,282
Total investments . . . . . . . . . . . . . . . . . . . . . . . . . . . . . . . . . . . . . . . $91,170 $229 $(29) $91,370
Amounts included in:Cash and cash equivalents . . . . . . . . . . . . . . . . . . . . . . . . . . . . . $59,641 $ — $ — $59,641Short-term investments . . . . . . . . . . . . . . . . . . . . . . . . . . . . . . . 13,898 13 (5) 13,906Marketable investments . . . . . . . . . . . . . . . . . . . . . . . . . . . . . . 17,631 216 (24) 17,823
Total investments . . . . . . . . . . . . . . . . . . . . . . . . . . . . . . . . . . . . . . . $91,170 $229 $(29) $91,370
F-12

PARAMETRIC TECHNOLOGY CORPORATION
NOTES TO CONSOLIDATED FINANCIAL STATEMENTS—(Continued)
D. Property and Equipment
Our property and equipment consisted of the following:
September 30,
2000 2001
(in thousands)
Computer hardware and software . . . . . . . . . . . . . . . . . . . . . . . . . . . . . . . . . . . . . . . . . . . . . $128,686 $141,661Furniture and fixtures . . . . . . . . . . . . . . . . . . . . . . . . . . . . . . . . . . . . . . . . . . . . . . . . . . . . . . 15,885 19,773Leasehold improvements . . . . . . . . . . . . . . . . . . . . . . . . . . . . . . . . . . . . . . . . . . . . . . . . . . . . 16,671 33,674
Gross property and equipment . . . . . . . . . . . . . . . . . . . . . . . . . . . . . . . . . . . . . . . . . . . . . . . 161,242 195,108Accumulated depreciation and amortization . . . . . . . . . . . . . . . . . . . . . . . . . . . . . . . . . . . . . (94,363) (103,607)
Net property and equipment . . . . . . . . . . . . . . . . . . . . . . . . . . . . . . . . . . . . . . . . . . . . . . . . . $ 66,879 $ 91,501
Depreciation expense was $33.3 million in 1999, $35.9 million in 2000 and $35.6 million in 2001. There were nocapital leases as of September 30, 2000 or 2001.
E. Income Taxes
Our income (loss) before taxes consisted of the following:
September 30,
1999 2000 2001
(in thousands)
Domestic . . . . . . . . . . . . . . . . . . . . . . . . . . . . . . . . . . . . . . . . . . . . . . . . . . . . . . . $211,580 $(22,801) $(34,064)Foreign . . . . . . . . . . . . . . . . . . . . . . . . . . . . . . . . . . . . . . . . . . . . . . . . . . . . . . . . . (30,338) 17,734 23,203
Total . . . . . . . . . . . . . . . . . . . . . . . . . . . . . . . . . . . . . . . . . . . . . . . . . . . . . . . . . . . $181,242 $ (5,067) $(10,861)
Our provision (benefit) for income taxes consisted of the following:
September 30
1999 2000 2001
(in thousands)
Current:Federal . . . . . . . . . . . . . . . . . . . . . . . . . . . . . . . . . . . . . . . . . . . . . . . . . . . . . . $ 59,191 $ (9,046) $ (7,963)State . . . . . . . . . . . . . . . . . . . . . . . . . . . . . . . . . . . . . . . . . . . . . . . . . . . . . . . . 9,250 (3,858) 2,546Foreign . . . . . . . . . . . . . . . . . . . . . . . . . . . . . . . . . . . . . . . . . . . . . . . . . . . . . . 10,422 16,655 17,809
78,863 3,751 12,392
Deferred:Federal . . . . . . . . . . . . . . . . . . . . . . . . . . . . . . . . . . . . . . . . . . . . . . . . . . . . . . (17,553) (8,028) (13,523)State . . . . . . . . . . . . . . . . . . . . . . . . . . . . . . . . . . . . . . . . . . . . . . . . . . . . . . . . (2,250) 4,301 (1,945)Foreign . . . . . . . . . . . . . . . . . . . . . . . . . . . . . . . . . . . . . . . . . . . . . . . . . . . . . . 2,889 (1,111) 429
(16,914) (4,838) (15,039)
Total provision (benefit) for income taxes . . . . . . . . . . . . . . . . . . . . . . . . . . . . . . $ 61,949 $ (1,087) $ (2,647)
F-13

PARAMETRIC TECHNOLOGY CORPORATION
NOTES TO CONSOLIDATED FINANCIAL STATEMENTS—(Continued)
The reconciliation between the statutory federal income tax rate and our effective income tax rate is shownbelow:
September 30,
1999 2000 2001
Statutory federal income taxes . . . . . . . . . . . . . . . . . . . . . . . . . . . . . . . . . . . . . . . . . . . . . 35% (35)% (35)%State income taxes, net of federal tax benefit . . . . . . . . . . . . . . . . . . . . . . . . . . . . . . . . . . 3 6 4Tax exempt interest income . . . . . . . . . . . . . . . . . . . . . . . . . . . . . . . . . . . . . . . . . . . . . . . . (2) (36) (7)Benefit of foreign sales corporations . . . . . . . . . . . . . . . . . . . . . . . . . . . . . . . . . . . . . . . . . (1) (1) (2)Valuation allowance . . . . . . . . . . . . . . . . . . . . . . . . . . . . . . . . . . . . . . . . . . . . . . . . . . . . . (9) (93) 86Acquisition-related charges . . . . . . . . . . . . . . . . . . . . . . . . . . . . . . . . . . . . . . . . . . . . . . . . 7 157 93Investment in foreign subsidiaries . . . . . . . . . . . . . . . . . . . . . . . . . . . . . . . . . . . . . . . . . . . — — (161)Other, net . . . . . . . . . . . . . . . . . . . . . . . . . . . . . . . . . . . . . . . . . . . . . . . . . . . . . . . . . . . . . . 1 (19) (2)
Effective income tax rate . . . . . . . . . . . . . . . . . . . . . . . . . . . . . . . . . . . . . . . . . . . . . . . . . . 34% (21)% (24)%
We paid $57.7 million in 1999, $52.0 million in 2000 and $6.9 million in 2001 for income taxes.
The significant temporary differences that create deferred tax assets and liabilities are shown below:
September 30,
2000 2001
(in thousands)
Deferred tax assets:Reserves not currently deductible . . . . . . . . . . . . . . . . . . . . . . . . . . . . . . . . . . . . . . . . . $ 5,921 $ 9,819Restructuring reserves not currently deductible . . . . . . . . . . . . . . . . . . . . . . . . . . . . . . 14,673 20,296Net operating loss carryforwards . . . . . . . . . . . . . . . . . . . . . . . . . . . . . . . . . . . . . . . . . 84,980 78,089Foreign tax credits . . . . . . . . . . . . . . . . . . . . . . . . . . . . . . . . . . . . . . . . . . . . . . . . . . . . . — 7,605Amortization of intangible assets . . . . . . . . . . . . . . . . . . . . . . . . . . . . . . . . . . . . . . . . . 10,435 8,448Depreciation . . . . . . . . . . . . . . . . . . . . . . . . . . . . . . . . . . . . . . . . . . . . . . . . . . . . . . . . . 2,274 2,389Other . . . . . . . . . . . . . . . . . . . . . . . . . . . . . . . . . . . . . . . . . . . . . . . . . . . . . . . . . . . . . . . 1,747 1,647
Gross deferred tax assets . . . . . . . . . . . . . . . . . . . . . . . . . . . . . . . . . . . . . . . . . . . . . . . . . . . . 120,030 128,293Valuation allowance . . . . . . . . . . . . . . . . . . . . . . . . . . . . . . . . . . . . . . . . . . . . . . . . . . . . . . . (59,137) (68,487)
Total deferred tax assets . . . . . . . . . . . . . . . . . . . . . . . . . . . . . . . . . . . . . . . . . . . . . . . . . . . . $ 60,893 $ 59,806
Deferred tax liabilities:Investment in foreign subsidiaries . . . . . . . . . . . . . . . . . . . . . . . . . . . . . . . . . . . . . . . . (25,308) (7,776)Deferred revenue . . . . . . . . . . . . . . . . . . . . . . . . . . . . . . . . . . . . . . . . . . . . . . . . . . . . . . (2,313) (2,125)Other . . . . . . . . . . . . . . . . . . . . . . . . . . . . . . . . . . . . . . . . . . . . . . . . . . . . . . . . . . . . . . . (7,298) (8,892)
Total deferred tax liabilities . . . . . . . . . . . . . . . . . . . . . . . . . . . . . . . . . . . . . . . . . . . . . . . . . (34,919) (18,793)
Net deferred tax assets . . . . . . . . . . . . . . . . . . . . . . . . . . . . . . . . . . . . . . . . . . . . . . . . . . . . . . $ 25,974 $ 41,013
For U.S. tax return purposes, net operating losses (NOLs) and tax credit carryforwards are generally available tobe carried forward to future years. However, the Internal Revenue Code limits a corporation’s use of NOLs andtax credits after a change of more than 50% of the ownership of the corporation. Our merger withComputervision in January 1998 changed its ownership more than 50%. This change limits our usage of theComputervision NOLs to $14.0 million per year and $196.0 million cumulatively through 2011, plus any built-in
F-14

PARAMETRIC TECHNOLOGY CORPORATION
NOTES TO CONSOLIDATED FINANCIAL STATEMENTS—(Continued)
gains which existed at the time of the ownership change. There are other limitations imposed on the utilization ofsuch NOLs that could further restrict the recognition of such tax benefits. We have foreign NOLs that are alsosubject to various limitations. Due to these limitations, we recorded a valuation allowance for the tax benefit of amajority of NOLs since realization of these future benefits was not sufficiently assured. During 2000, we reducedour valuation allowance $4.7 million primarily due to anticipated future benefits from the utilization of certainNOLs in 2000 and during 2001 we increased our valuation allowance $9.4 million due to the uncertainty ofutilization of certain foreign net operating losses and tax credit carryforwards.
F. Commitments and Contingencies
Leasing Arrangements
We lease office facilities and certain equipment under operating leases expiring at various dates through 2014. Inaddition to rent, certain leases require us to pay directly for taxes, insurance, maintenance and other operatingexpenses. Lease expense, net of sublease income, was $54.6 million in 1999, $54.1 million in 2000 and $56.9million in 2001. At September 30, 2001, our future minimum lease payments under noncancellable operatingleases with remaining terms of one or more years are as follows:
September 30,2001
(in thousands)
2002 . . . . . . . . . . . . . . . . . . . . . . . . . . . . . . . . . . . . . . . . . . . . . . . . . . . . . . . . . . . . . . . . . $ 53,0892003 . . . . . . . . . . . . . . . . . . . . . . . . . . . . . . . . . . . . . . . . . . . . . . . . . . . . . . . . . . . . . . . . . 39,4892004 . . . . . . . . . . . . . . . . . . . . . . . . . . . . . . . . . . . . . . . . . . . . . . . . . . . . . . . . . . . . . . . . . 27,6682005 . . . . . . . . . . . . . . . . . . . . . . . . . . . . . . . . . . . . . . . . . . . . . . . . . . . . . . . . . . . . . . . . . 25,2812006 . . . . . . . . . . . . . . . . . . . . . . . . . . . . . . . . . . . . . . . . . . . . . . . . . . . . . . . . . . . . . . . . . 21,485Thereafter . . . . . . . . . . . . . . . . . . . . . . . . . . . . . . . . . . . . . . . . . . . . . . . . . . . . . . . . . . . . . 105,049
Total minimum lease payments . . . . . . . . . . . . . . . . . . . . . . . . . . . . . . . . . . . . . . . . . . . . $272,061
As a result of Computervision’s cost saving initiatives in prior years, our merger with Computervision and ourcost saving initiatives in 1999, 2000 and 2001, certain leased facilities were considered excess. As of September30, 2001 we had $29.2 million reserved for facility obligations in excess of sublease income.
In December 1999, we sold land and certain improvements under construction for $30.8 million and entered intoan operating lease covering approximately 381,000 square feet of office space in Needham, Massachusetts toconsolidate our Massachusetts facilities. Occupancy and rent began in December 2000 and the lease expires inDecember 2012, subject to certain renewal rights. As of September 30, 2000 and 2001, we have letters of creditoutstanding of approximately $25.5 million and $9.1 million primarily related to the lease of the new facility.
Legal Proceedings
Certain class action lawsuits were filed by shareholders in the fourth quarter of 1998 against us and certain of ourcurrent and former officers and directors in the U.S. District Court in Massachusetts claiming violations of thefederal securities laws based on alleged misrepresentations regarding our anticipated revenue and earnings for thethird quarter of 1998. An amended complaint, consolidating these lawsuits into one action, was filed in thesecond quarter of 1999, seeking unspecified damages. In the third quarter of 1999 we filed a motion to dismissthe consolidated action. On March 29, 2001, the U.S. District Court for the District of Massachusetts granted our
F-15

PARAMETRIC TECHNOLOGY CORPORATION
NOTES TO CONSOLIDATED FINANCIAL STATEMENTS—(Continued)
motion to dismiss and entered an order dismissing the consolidated action with prejudice. The applicable appealperiod has expired and the plantiffs have not appealed, which should conclude the litigation.
We are also subject to various legal proceedings and claims that arise in the ordinary course of business. Wecurrently believe that resolving these matters will not have a material adverse impact on our financial conditionor results of operations.
G. Stockholders’ Equity
Preferred Stock
We may issue up to 5.0 million shares of our preferred stock in one or more series. Our Board of Directors isauthorized to fix the rights and terms for any series of preferred stock without additional shareholder approval.As of September 30, 2000 and 2001, there were no outstanding shares of preferred stock.
In November 2000, our Board of Directors authorized and designated 500,000 shares of preferred stock as SeriesA Junior Participating Preferred Stock for issuance pursuant to our Shareholder Rights Plan (discussed below inNote H).
Common Stock
Our Articles of Organization authorize us to issue up to 500 million shares of our common stock. Shares ofcommon stock outstanding are shown below:
September 30,
1999 2000 2001
(in thousands)
Beginning balance . . . . . . . . . . . . . . . . . . . . . . . . . . . . . . . . . . . . . . . . . . . . . . . . . . 268,142 270,164 269,597Common stock issued . . . . . . . . . . . . . . . . . . . . . . . . . . . . . . . . . . . . . . . . . . . . . . . . — 3,776 —Treasury shares repurchased . . . . . . . . . . . . . . . . . . . . . . . . . . . . . . . . . . . . . . . . . . (6,270) (7,727) (11,811)Treasury shares issued . . . . . . . . . . . . . . . . . . . . . . . . . . . . . . . . . . . . . . . . . . . . . . . 8,292 3,384 2,752
Ending balance . . . . . . . . . . . . . . . . . . . . . . . . . . . . . . . . . . . . . . . . . . . . . . . . . . . . . 270,164 269,597 260,538
In September 1998, our Board of Directors authorized a plan that allows us to repurchase up to 20.0 millionshares. In July 2000, our Board of Directors authorized an additional 20.0 million shares to be repurchased.Through September 30, 2001, we repurchased 30.5 million shares at a cost of $361.7 million. Our treasury stockis held on a first in, first out cost basis. The repurchased shares are used to issue shares for stock option exercises,employee stock purchase plans and potential acquisitions.
H. Shareholder Rights Plan
In November 2000, our Board of Directors adopted a Shareholder Rights Plan and declared a dividenddistribution of one share purchase right (a “Right”) for each outstanding share of our common stock tostockholders of record at the close of business on January 5, 2001. Each share of common stock newly issuedafter that date also will carry with it one Right. Each Right will entitle the record holder to purchase from us oneone-thousandth of a share of our Series A Junior Participating Preferred Stock at an exercise price of $60.00 perunit subject to adjustment. The Rights become exercisable ten (10) days after the earlier of our announcementthat a person has acquired 15% or more of our outstanding common stock or an announcement of a tender offer
F-16

PARAMETRIC TECHNOLOGY CORPORATION
NOTES TO CONSOLIDATED FINANCIAL STATEMENTS—(Continued)
which would result in a person or group acquiring 15% or more of our common stock; in either case, the Boardof Directors can extend the 10 day period. If we have not redeemed or exchanged the Rights and a personbecomes the beneficial owner of 15% or more of our common stock (a “Triggering Event”), each holder of aRight will have the right to purchase shares of our common stock having a value equal to two times the exerciseprice of the Right. If, at any time following the Triggering Event, we are acquired in a merger or other businesscombination transaction in which we are not the surviving corporation or more than 50% of its assets or earningpower is sold to a person or group, each holder of a Right shall have the right to purchase shares of commonstock of the acquiring person, group or company having a value equal to two times the exercise price of theRight. The Rights expire on January 5, 2011, and may be redeemed by us for $.001 per Right.
I. Stock Plans
Employee Stock Purchase Plans
We offer an employee stock purchase plan for all eligible employees. Under the current plan, which qualifies asan “employee stock purchase plan” under Section 423 of the Internal Revenue Code, shares of our common stockcan be purchased at 85% of the lower of the fair market value of the stock on the first or the last day of each six-month offering period. Employee purchases in any year are limited to the lesser of $25,000 worth of stock,determined by the fair market value of the common stock at the time the offering begins, or 15% of his or herbase pay. The shareholders have approved that 10.0 million shares of common stock be reserved for issuanceunder the plan. During fiscal 1999, 2000 and 2001, employees purchased 1.0 million, 757,000 and 1.2 millionshares at average prices of $9.20, $11.67 and $8.30, respectively.
Stock Option Plans
We have stock option plans for employees, directors, officers and consultants that provide for issuance ofnonqualified and incentive stock options. The option exercise price is typically the fair market value at the dateof grant. These options generally vest over four years and expire ten years from the date of grant. As ofSeptember 30, 2001, 11.7 million shares were available for grant and 66.2 million shares granted and outstandingwere reserved under stock option plans.
September 30,
1999 2000 2001
Shares
WeightedAverageExercisePrice Shares
WeightedAverageExercisePrice Shares
WeightedAverageExercisePrice
(shares in thousands)
Outstanding:Beginning balance . . . . . . . . . . . . . . . . . . . . . . . 48,888 $15.03 55,435 $14.52 60,619 $14.30Granted and assumed . . . . . . . . . . . . . . . . . . . . . 17,169 13.28 21,413 13.41 15,173 8.75Cancelled . . . . . . . . . . . . . . . . . . . . . . . . . . . . . . (8,564) 16.75 (10,429) 15.08 (8,047) 14.34Exercised . . . . . . . . . . . . . . . . . . . . . . . . . . . . . . (2,058) 7.03 (5,800) 12.22 (1,576) 9.19
Ending Balance . . . . . . . . . . . . . . . . . . . . . . . . . 55,435 $14.52 60,619 $14.30 66,169 $13.16
Exercisable . . . . . . . . . . . . . . . . . . . . . . . . . . . . . . . . 19,687 $14.50 23,110 $15.30 32,701 $14.89
Certain employees have disposed of stock acquired through the employee stock purchase plan and the exercise ofincentive stock options earlier than the mandatory holding period required for certain tax treatment. Thesedispositions, together with the tax benefits realized from the exercise of nonqualified stock options, create taxbenefits that have been recorded as increases to additional paid-in capital.
F-17

PARAMETRIC TECHNOLOGY CORPORATION
NOTES TO CONSOLIDATED FINANCIAL STATEMENTS—(Continued)
For various price ranges, information for options outstanding and exercisable at September 30, 2001 was asfollows:
Outstanding Options Exercisable Options
Shares
Weighted AverageRemaining Life
(years)Weighted AverageExercise Price Shares
Weighted AverageExercise Price
(shares in thousands)
$ 0.09- 8.06 11,327 8.93 $ 5.71 1,743 $ 6.288.07- 9.94 10,604 7.81 9.48 5,749 9.529.95-12.44 9,365 7.66 11.62 3,451 11.32
12.45-13.63 11,941 7.22 13.51 7,538 13.6013.64-15.69 10,689 7.27 15.30 5,480 15.1915.70-24.00 10,524 6.37 21.21 7,468 21.4624.01-72.55 1,719 6.21 28.19 1,272 28.40
$ 0.09-72.55 66,169 7.52 $13.16 32,701 $14.89
Valuation of Stock Plans
We have not recognized compensation expense in connection with stock option grants to employees, directorsand officers under our plans. We have recognized compensation expense of $927,000 in 1999, $652,000 in 2000and $236,000 in 2001 in connection with stock option grants to consultants as prescribed by APB No. 25 andFASB Interpretation No. 44, Accounting for Certain Transactions Involving Stock Compensation—anInterpretation of APB Opinion No. 25. However, had compensation expense for stock option and employee stockpurchase plans been determined based on fair value at the grant dates as prescribed by SFAS No. 123, pro formanet income (loss) and earnings (loss) per share would have been:
September 30,
1999 2000 2001
(in thousands, except pershare amounts)
Pro forma net income (loss) . . . . . . . . . . . . . . . . . . . . . . . . . . . . . . . . . . . . . . . . . $32,848 $(89,566) $(94,718)Pro forma earnings (loss) per share:
Basic . . . . . . . . . . . . . . . . . . . . . . . . . . . . . . . . . . . . . . . . . . . . . . . . . . . . . . . $ 0.12 $ (0.33) $ (0.36)Diluted . . . . . . . . . . . . . . . . . . . . . . . . . . . . . . . . . . . . . . . . . . . . . . . . . . . . . . $ 0.12 $ (0.33) $ (0.36)
The pro forma disclosures above include the amortization of the fair value of all options vested between 1996and 2001, regardless of the grant date. The effects on pro forma disclosures of applying SFAS No. 123 are notnecessarily representative of the effects on pro forma disclosures of future years.
F-18
PARAMETRIC TECHNOLOGY CORPORATION
NOTES TO CONSOLIDATED FINANCIAL STATEMENTS—(Continued)
The fair value of options granted has been estimated at the date of grant using the Black-Scholes option-pricingmodel assuming the following weighted-average assumptions:
September 30,
1999 2000 2001
Expected life (years) . . . . . . . . . . . . . . . . . . . . . . . . . . . . . . . . . . . . . . . . . . . . . . . . . . . . . . . . . . 6.0 6.0 6.0Risk-free interest rates . . . . . . . . . . . . . . . . . . . . . . . . . . . . . . . . . . . . . . . . . . . . . . . . . . . . . . . . . 5.0% 6.2% 5.0%Volatility . . . . . . . . . . . . . . . . . . . . . . . . . . . . . . . . . . . . . . . . . . . . . . . . . . . . . . . . . . . . . . . . . . . 50% 50% 75%Dividend yield . . . . . . . . . . . . . . . . . . . . . . . . . . . . . . . . . . . . . . . . . . . . . . . . . . . . . . . . . . . . . . . — — —
The weighted average fair value of employee stock options granted was $7.96 in 1999, $7.46 in 2000 and $5.86in 2001. The expected life used for stock purchase plans was six months. The weighted average fair value ofshares granted under the stock purchase plan was $3.80 in 1999, $4.10 in 2000 and $4.56 in 2001.
The Black-Scholes option-pricing model was developed for use in estimating the fair value of traded options thathave no vesting restrictions and are fully transferable. In addition, option valuation models require the input ofhighly subjective assumptions, including the expected stock price volatility. Because our options havecharacteristics significantly different from those of traded options, and because changes in the subjective inputassumptions can materially affect the fair value estimate, in the opinion of management, the existing models donot necessarily provide a reliable measure of the fair value of our options.
J. Employee Benefit Plan
We offer a savings plan (PTC plan) to eligible employees. The plan is intended to qualify under Section 401(k)of the Internal Revenue Code. Participating employees may defer up to 15% of their pre-tax compensation, asdefined, but not more than statutory limits. We contribute 50% of the amount contributed by the employee, up toa maximum of 10% of the employee’s earnings. Our matching contributions vest at a rate of 25% per year ofservice. We made matching contributions of $4.7 million, $5.1 million and $5.5 million in 1999, 2000 and 2001,respectively.
K. Pension Plans
We maintain a defined benefit pension plan covering certain employees of Computervision. Benefits are basedupon length of service and average compensation and generally vest after five years of service. Accrued pensioncosts have been included in other liabilities.
U.S. Pension Plan
Effective April 1, 1990, the benefits under the U.S. pension plan were frozen indefinitely. We contribute allamounts deemed necessary on an actuarial basis to satisfy Internal Revenue Service funding requirements. Basedupon the actuarial valuations, we contributed $13.7 million in 1999, $0 in 2000 and $1.4 million in 2001. Theminimum pension liability increased $13.2 million in 2001 due primarily to a change in the discount rateactuarial assumption to 7.0% from 7.5% and the underperformance of plan assets during 2001. Plan assetsconsist primarily of indexed funds.
Foreign Pension Plans
The accrued international pension cost was actuarially computed using assumptions applicable to each subsidiaryplan and economic environment. We adjusted our minimum pension liability related to our foreign plans due tothe changes in actuarial assumptions and performance of plan investments, as shown below. Plan assets consistof investments in equities and guaranteed investment contracts with several insurance companies and banks.
F-19

PARAMETRIC TECHNOLOGY CORPORATION
NOTES TO CONSOLIDATED FINANCIAL STATEMENTS—(Continued)
The following table presents the actuarial assumptions used in accounting for the pension plans:
U.S. Plan Foreign Plans
1999 2000 2001 1999 2000 2001
Discount rate . . . . . . . . . . . . . . . . . . . . . . . . . . . . . . . . 7.5% 7.5% 7.0% 6.3 to 6.5% 6.3 to 6.5% 6.0%Rate of increase in future compensation . . . . . . . . . . . — — — 3.5 to 5.0% 3.5 to 5.0% 3.25%Rate of return on plan assets . . . . . . . . . . . . . . . . . . . . 7.5% 7.5% 7.5% 6.3 to 7.0% 5.3 to 7.0% 5.0%
The actuarially computed components of net periodic pension cost are show below:
U.S. Plan Foreign Plans
1999 2000 2001 1999 2000 2001
(in thousands)
Service costs of benefits earned during the period . . $ — $ — $ — $ 6 $ — $ —Interest cost of projected benefit obligation . . . . . . . 3,224 3,663 3,778 2,853 2,542 1,907Expected return on plan assets . . . . . . . . . . . . . . . . . (2,568) (3,389) (3,487) (2,698) (2,192) (1,318)Amortization of prior service cost . . . . . . . . . . . . . . . — — — 17 17 15Recognized actuarial loss . . . . . . . . . . . . . . . . . . . . . 1,191 950 897 381 165 36
Net periodic pension cost . . . . . . . . . . . . . . . . . . . . . $ 1,847 $ 1,224 $ 1,188 $ 559 $ 532 $ 640
The following tables display the change in benefit obligation, plan assets and funded status:
U.S. Plan Foreign Plans
2000 2001 2000 2001
(in thousands)
Beginning benefit obligation . . . . . . . . . . . . . . . . . . . . . . . . . . . . . . . . . $49,043 $ 51,716 $42,480 $30,785Service cost . . . . . . . . . . . . . . . . . . . . . . . . . . . . . . . . . . . . . . . . . . . . . . — — — —Interest cost . . . . . . . . . . . . . . . . . . . . . . . . . . . . . . . . . . . . . . . . . . . . . . 3,663 3,778 2,542 1,907Actuarial loss (gain) . . . . . . . . . . . . . . . . . . . . . . . . . . . . . . . . . . . . . . . . 358 3,596 (1,681) 1,854Foreign exchange impact . . . . . . . . . . . . . . . . . . . . . . . . . . . . . . . . . . . . — — (4,552) 385Benefits paid . . . . . . . . . . . . . . . . . . . . . . . . . . . . . . . . . . . . . . . . . . . . . (1,348) (1,424) (8,004) (2,205)
Ending benefit obligation . . . . . . . . . . . . . . . . . . . . . . . . . . . . . . . . . . . . $51,716 $ 57,666 $30,785 $32,726
Beginning plan assets at fair value . . . . . . . . . . . . . . . . . . . . . . . . . . . . $45,751 $ 46,686 $36,607 $25,478Actual return on plan assets . . . . . . . . . . . . . . . . . . . . . . . . . . . . . . . . . . 2,283 (7,044) 320 59Employer contributions . . . . . . . . . . . . . . . . . . . . . . . . . . . . . . . . . . . . . — 1,441 5 —Foreign exchange impact . . . . . . . . . . . . . . . . . . . . . . . . . . . . . . . . . . . . — — (3,573) 94Benefits paid . . . . . . . . . . . . . . . . . . . . . . . . . . . . . . . . . . . . . . . . . . . . . (1,348) (1,424) (7,881) (2,087)
Ending plan assets at fair value . . . . . . . . . . . . . . . . . . . . . . . . . . . . . . . 46,686 39,659 25,478 23,544Benefit obligation at end of year . . . . . . . . . . . . . . . . . . . . . . . . . . . . . . 51,716 57,666 30,785 32,726
Funded status . . . . . . . . . . . . . . . . . . . . . . . . . . . . . . . . . . . . . . . . . . . . . (5,030) (18,007) (5,307) (9,182)Unrecognized actuarial loss . . . . . . . . . . . . . . . . . . . . . . . . . . . . . . . . . . 18,394 31,625 1,952 5,045Unrecognized prior service cost . . . . . . . . . . . . . . . . . . . . . . . . . . . . . . — — 272 258
Net prepaid (accrued) benefit cost . . . . . . . . . . . . . . . . . . . . . . . . . . . . . $13,364 $ 13,618 $ (3,083) $ (3,879)
F-20

PARAMETRIC TECHNOLOGY CORPORATION
NOTES TO CONSOLIDATED FINANCIAL STATEMENTS—(Continued)
The following table shows the amounts recognized in the balance sheet:
U.S. Plan Foreign Plans
2000 2001 2000 2001
(in thousands)Accrued benefit liability . . . . . . . . . . . . . . . . . . . . . . . . . . . . . . . . . . . . $ (5,030) $(18,007) $(7,036) $(10,768)Intangible asset . . . . . . . . . . . . . . . . . . . . . . . . . . . . . . . . . . . . . . . . . . . — — 272 258Accumulated other comprehensive income . . . . . . . . . . . . . . . . . . . . . 18,394 31,625 3,681 6,631
Net amount recognized . . . . . . . . . . . . . . . . . . . . . . . . . . . . . . . . . . . . . $13,364 $ 13,618 $(3,083) $ (3,879)
L. Segment Information
We operate within a single industry segment—computer software and related services. We have two majorproduct categories within that one segment: (1) our computer aided design, manufacturing and engineeringsolutions (Design solutions), including our flagship Pro/ENGINEER® design software, which providesengineering solutions to our customers and (2) our Windchill® software, which provides collaborativeinformation management solutions to our customers using Internet technologies.
Operating segments are defined as components of an enterprise about which separate financial information isavailable that is evaluated regularly by the chief operating decision maker, or decision-making group, in decidinghow to allocate resources and in assessing performance. Our chief operating decision-making group is ourexecutive officers. Our executive officers make financial decisions and resource allocations based in part on ourproduct segments.
Effective in 2001, our financial reporting focuses on the revenue and operating income (loss) for our designsolutions and Windchill-based solutions product segments. We do not allocate certain sales, marketing oradministrative expenses to our product segments, as these activities are managed separately. The revenue andoperating income (loss) attributable to these product segments are included below:
September 30,
1999 2000 2001
Revenue:Design solutions:License revenue . . . . . . . . . . . . . . . . . . . . . . . . . . . . . . . . . . . . . . . . . . $ 504,696 $ 285,475 $ 285,709Service revenue . . . . . . . . . . . . . . . . . . . . . . . . . . . . . . . . . . . . . . . . . . . 471,561 468,210 435,023
Total Design solutions revenue . . . . . . . . . . . . . . . . . . . . . . . . . . . . . . 976,257 753,685 720,732
Windchill-based solutions:License revenue . . . . . . . . . . . . . . . . . . . . . . . . . . . . . . . . . . . . . . . . . . 56,524 93,142 96,173Service revenue . . . . . . . . . . . . . . . . . . . . . . . . . . . . . . . . . . . . . . . . . . . 24,820 81,587 117,701
Total Windchill-based solutions revenue . . . . . . . . . . . . . . . . . . . . . . . 81,344 174,729 213,874
Total revenue . . . . . . . . . . . . . . . . . . . . . . . . . . . . . . . . . . . . . . . . . . . . $1,057,601 $ 928,414 $ 934,606
Operating income (loss): (1)Design solutions . . . . . . . . . . . . . . . . . . . . . . . . . . . . . . . . . . . . . . . . . . $ 706,166 $ 470,619 $ 451,453Windchill-based solutions . . . . . . . . . . . . . . . . . . . . . . . . . . . . . . . . . . (51,588) 6,565 (707)Distribution expenses (2) . . . . . . . . . . . . . . . . . . . . . . . . . . . . . . . . . . . (412,934) (416,121) (381,566)
Product segment operating income (3) . . . . . . . . . . . . . . . . . . . . . . . . . . . . . 241,644 61,063 69,180Unallocated expenses (4) . . . . . . . . . . . . . . . . . . . . . . . . . . . . . . . . . . . . . . . (62,852) (69,290) (72,182)
Total operating income (loss) . . . . . . . . . . . . . . . . . . . . . . . . . . . . . . . . . . . . $ 178,792 $ (8,227) $ (3,002)
F-21

PARAMETRIC TECHNOLOGY CORPORATION
NOTES TO CONSOLIDATED FINANCIAL STATEMENTS—(Continued)
(1) For 1999, 2000 and 2001, Windchill-based solutions operating loss includes $38.2 million, $4.9 million and$10.8 million, respectively, of acquisition and nonrecurring charges. For 1999, 2000 and 2001, designsolutions operating income includes $4.7 million, $5.1 million and $15.6 million, respectively, ofacquisition and nonrecurring charges.
(2) Distribution expenses represent certain sales and marketing expenses incurred in support of the productsegments.
(3) The product segment operating income reflects only the direct controllable expenses of each productsegment. The product segment operating income reported does not represent the total operating results foreach product segment as it does not contain an allocation of certain sales, marketing, corporate and generaladministrative expenses incurred in support of the product segments.
(4) Unallocated expenses represent certain corporate and general administrative expenses incurred in support ofthe product segments.
While we are predominately a computer software company, our business is organized geographically. Data forthe geographic regions in which we operate is presented below:
September 30,
1999 2000 2001
Revenue:North America . . . . . . . . . . . . . . . . . . . . . . . . . . . . . . . . . . . . . . . . . . . . . $ 464,445 $378,564 $408,422Europe . . . . . . . . . . . . . . . . . . . . . . . . . . . . . . . . . . . . . . . . . . . . . . . . . . . 389,969 341,859 308,452Asia/Pacific . . . . . . . . . . . . . . . . . . . . . . . . . . . . . . . . . . . . . . . . . . . . . . . 203,187 207,991 217,732
Total revenue . . . . . . . . . . . . . . . . . . . . . . . . . . . . . . . . . . . . . . . . . . $1,057,601 $928,414 $934,606
Long-lived assets:North America . . . . . . . . . . . . . . . . . . . . . . . . . . . . . . . . . . . . . . . . . . . . . $ 165,212 $155,236 $162,013Europe . . . . . . . . . . . . . . . . . . . . . . . . . . . . . . . . . . . . . . . . . . . . . . . . . . . 66,826 51,955 38,498Asia/Pacific . . . . . . . . . . . . . . . . . . . . . . . . . . . . . . . . . . . . . . . . . . . . . . . 23,503 22,527 18,013
Total long-lived assets . . . . . . . . . . . . . . . . . . . . . . . . . . . . . . . . . . . $ 255,541 $229,718 $218,524
We license products to customers worldwide. Our sales and marketing operations outside the United States areconducted principally through our foreign sales subsidiaries throughout Europe and the Asia/Pacific region.Intercompany sales and transfers between geographic areas are accounted for at prices that are designed to berepresentative of unaffiliated party transactions. Total exports were $166.2 million, $81.5 million and $61.7million in 1999, 2000 and 2001, respectively.
F-22

REPORT OF INDEPENDENT ACCOUNTANTS
To the Stockholders and Board of Directors of Parametric Technology Corporation:
In our opinion, the accompanying consolidated balance sheets and the related consolidated statements of income,cash flows, stockholders’ equity and comprehensive income present fairly, in all material respects, the financialposition of Parametric Technology Corporation and its subsidiaries at September 30, 2001 and 2000, and theresults of their operations and their cash flows for each of the three years in the period ended September 30, 2001in conformity with accounting principles generally accepted in the United States of America. These financialstatements are the responsibility of the Company’s management; our responsibility is to express an opinion onthese financial statements based on our audits. We conducted our audits of these statements in accordance withauditing standards generally accepted in the United States of America, which require that we plan and performthe audit to obtain reasonable assurance about whether the financial statements are free of material misstatement.An audit includes examining, on a test basis, evidence supporting the amounts and disclosures in the financialstatements, assessing the accounting principles used and significant estimates made by management, andevaluating the overall financial statement presentation. We believe that our audits provide a reasonable basis forour opinion.
PricewaterhouseCoopers LLP
Boston, MassachusettsOctober 15, 2001
F-23

FIVE YEAR SUMMARY OF SELECTED FINANCIAL DATA (1)
September 30,
1997 1998 1999 2000 2001
(in thousands, except per share data)Revenue . . . . . . . . . . . . . . . . . . . . . . . . . . . . . . . . . . . . . . . . . . . . . . . . . . . . $1,062,018 $1,017,970 $1,057,601 $928,414 $934,606Operating income (loss) . . . . . . . . . . . . . . . . . . . . . . . . . . . . . . . . . . . . . . . . 229,335 208,020 178,792 (8,227) (3,002)Net income (loss) . . . . . . . . . . . . . . . . . . . . . . . . . . . . . . . . . . . . . . . . . . . . . 87,660 86,697 119,293 (3,980) (8,214)Earnings (loss) per share:(2)
Basic . . . . . . . . . . . . . . . . . . . . . . . . . . . . . . . . . . . . . . . . . . . . . . . . . . . 0.33 0.32 0.44 (0.01) (0.03)Diluted . . . . . . . . . . . . . . . . . . . . . . . . . . . . . . . . . . . . . . . . . . . . . . . . . 0.32 0.31 0.43 (0.01) (0.03)
Total assets . . . . . . . . . . . . . . . . . . . . . . . . . . . . . . . . . . . . . . . . . . . . . . . . . . 919,129 801,060 1,016,620 924,883 797,838Working capital . . . . . . . . . . . . . . . . . . . . . . . . . . . . . . . . . . . . . . . . . . . . . . 311,299 174,239 247,921 266,081 156,052Long term liabilities, less current portion . . . . . . . . . . . . . . . . . . . . . . . . . . 263,949 46,014 38,333 33,989 38,500Stockholders’ equity . . . . . . . . . . . . . . . . . . . . . . . . . . . . . . . . . . . . . . . . . . 204,551 335,504 521,104 528,542 399,702
QUARTERLY FINANCIAL INFORMATION (UNAUDITED)January 1,
2000April 1,2000
July 1,2000
September 30,2000
(in thousands, except per share data)Revenue . . . . . . . . . . . . . . . . . . . . . . . . . . . . . . . . . . . . . . . . . . . . . . . . . . . . . . . . $239,037 $227,105 $227,254 $235,018Operating income (loss) . . . . . . . . . . . . . . . . . . . . . . . . . . . . . . . . . . . . . . . . . . . . 13,976 (8,401) (22,112) 8,310Net income (loss) . . . . . . . . . . . . . . . . . . . . . . . . . . . . . . . . . . . . . . . . . . . . . . . . . 10,381 (5,846) (15,427) 6,912Earnings (loss) per share:
Basic . . . . . . . . . . . . . . . . . . . . . . . . . . . . . . . . . . . . . . . . . . . . . . . . . . . . . . . 0.04 (0.02) (0.06) 0.03Diluted . . . . . . . . . . . . . . . . . . . . . . . . . . . . . . . . . . . . . . . . . . . . . . . . . . . . . 0.04 (0.02) (0.06) 0.03
Common stock prices: (3)High . . . . . . . . . . . . . . . . . . . . . . . . . . . . . . . . . . . . . . . . . . . . . . . . . . . . . . . $ 32.88 $ 31.94 $ 11.63 $ 13.81Low . . . . . . . . . . . . . . . . . . . . . . . . . . . . . . . . . . . . . . . . . . . . . . . . . . . . . . . . 13.94 19.06 8.00 9.94
December 30,2000
March 31,2001
June 30,2001
September 30,2001
(in thousands, except per share data)Revenue . . . . . . . . . . . . . . . . . . . . . . . . . . . . . . . . . . . . . . . . . . . . . . . . . . . . . . . . $234,944 $245,130 $229,093 $225,439Operating income (loss) . . . . . . . . . . . . . . . . . . . . . . . . . . . . . . . . . . . . . . . . . . . . 16,001 17,400 (4,230) (32,173)Net income (loss) . . . . . . . . . . . . . . . . . . . . . . . . . . . . . . . . . . . . . . . . . . . . . . . . . 12,254 7,121 (2,685) (24,904)Earnings (loss) per share:
Basic . . . . . . . . . . . . . . . . . . . . . . . . . . . . . . . . . . . . . . . . . . . . . . . . . . . . . . . 0.05 0.03 (0.01) (0.10)Diluted . . . . . . . . . . . . . . . . . . . . . . . . . . . . . . . . . . . . . . . . . . . . . . . . . . . . . 0.05 0.03 (0.01) (0.10)
Common stock prices: (3)High . . . . . . . . . . . . . . . . . . . . . . . . . . . . . . . . . . . . . . . . . . . . . . . . . . . . . . . $ 14.50 $ 16.63 $ 13.99 $ 12.65Low . . . . . . . . . . . . . . . . . . . . . . . . . . . . . . . . . . . . . . . . . . . . . . . . . . . . . . . . 9.22 8.97 8.09 4.60
(1) In January 1998, we completed a merger with Computervision Corporation that has been accounted for as a pooling of interests.Accordingly, we have restated all financial information to reflect the merger.
(2) Per share data has been retroactively adjusted to reflect the one-for-one stock dividends in 1998.(3) Our common stock is traded on the Nasdaq National Market under the symbol “PMTC”. The common stock prices are based on the
Nasdaq Stock Market daily closing stock price.
F-24

EXHIBIT 21.1
SUBSIDIARIES OF PARAMETRIC TECHNOLOGY CORPORATION
NamePlace of
Incorporation
Division Inc. . . . . . . . . . . . . . . . . . . . . . . . . . . . . . . . . . . . . . . . . . . . . . . . . . . . . . . . . . . . . . . . . . . CaliforniaInPart Design, Inc. . . . . . . . . . . . . . . . . . . . . . . . . . . . . . . . . . . . . . . . . . . . . . . . . . . . . . . . . . . . . . Californiaauxilium inc. . . . . . . . . . . . . . . . . . . . . . . . . . . . . . . . . . . . . . . . . . . . . . . . . . . . . . . . . . . . . . . . . . DelawareComputervision Corporation . . . . . . . . . . . . . . . . . . . . . . . . . . . . . . . . . . . . . . . . . . . . . . . . . . . . . DelawareCV Finance Holding, Inc. . . . . . . . . . . . . . . . . . . . . . . . . . . . . . . . . . . . . . . . . . . . . . . . . . . . . . . . DelawareCV International Holding, Inc. . . . . . . . . . . . . . . . . . . . . . . . . . . . . . . . . . . . . . . . . . . . . . . . . . . . DelawareICEM Technologies, Inc. . . . . . . . . . . . . . . . . . . . . . . . . . . . . . . . . . . . . . . . . . . . . . . . . . . . . . . . . DelawareParametric Holdings Inc. . . . . . . . . . . . . . . . . . . . . . . . . . . . . . . . . . . . . . . . . . . . . . . . . . . . . . . . . DelawareParametric International, Inc. . . . . . . . . . . . . . . . . . . . . . . . . . . . . . . . . . . . . . . . . . . . . . . . . . . . . DelawareParametric Technology International, Inc. . . . . . . . . . . . . . . . . . . . . . . . . . . . . . . . . . . . . . . . . . . DelawareWindchill Technology, Inc. . . . . . . . . . . . . . . . . . . . . . . . . . . . . . . . . . . . . . . . . . . . . . . . . . . . . . . DelawareComputervision Securities Corporation . . . . . . . . . . . . . . . . . . . . . . . . . . . . . . . . . . . . . . . . . . . . MassachusettsParametric Securities Corporation . . . . . . . . . . . . . . . . . . . . . . . . . . . . . . . . . . . . . . . . . . . . . . . . . MassachusettsPTC International, Inc. . . . . . . . . . . . . . . . . . . . . . . . . . . . . . . . . . . . . . . . . . . . . . . . . . . . . . . . . . . MassachusettsParametric Technology Australia Pty Limited . . . . . . . . . . . . . . . . . . . . . . . . . . . . . . . . . . . . . . . AustraliaParametric Technology Gesellschaft m.b.H. . . . . . . . . . . . . . . . . . . . . . . . . . . . . . . . . . . . . . . . . . AustriaParametric Foreign Sales Corporation . . . . . . . . . . . . . . . . . . . . . . . . . . . . . . . . . . . . . . . . . . . . . . BarbadosParametric Technology (Belgium) b.v.b.a. . . . . . . . . . . . . . . . . . . . . . . . . . . . . . . . . . . . . . . . . . . BelgiumComputervision (Bermuda) Limited . . . . . . . . . . . . . . . . . . . . . . . . . . . . . . . . . . . . . . . . . . . . . . . BermudaParametric Technology Brasil Ltda. . . . . . . . . . . . . . . . . . . . . . . . . . . . . . . . . . . . . . . . . . . . . . . . BrazilComputervision (Canada) Inc. . . . . . . . . . . . . . . . . . . . . . . . . . . . . . . . . . . . . . . . . . . . . . . . . . . . . CanadaParametric Technology (Canada) Ltd. . . . . . . . . . . . . . . . . . . . . . . . . . . . . . . . . . . . . . . . . . . . . . . CanadaParametric Technology (C.R.) s.r.o. . . . . . . . . . . . . . . . . . . . . . . . . . . . . . . . . . . . . . . . . . . . . . . . Czech RepublicParametric Technology (Denmark) A/S . . . . . . . . . . . . . . . . . . . . . . . . . . . . . . . . . . . . . . . . . . . . DenmarkParametric Technology (Finland) Oy . . . . . . . . . . . . . . . . . . . . . . . . . . . . . . . . . . . . . . . . . . . . . . FinlandDivision SARL . . . . . . . . . . . . . . . . . . . . . . . . . . . . . . . . . . . . . . . . . . . . . . . . . . . . . . . . . . . . . . . FranceParametric Technology S.A. . . . . . . . . . . . . . . . . . . . . . . . . . . . . . . . . . . . . . . . . . . . . . . . . . . . . . FranceICEM Holdings GmbH . . . . . . . . . . . . . . . . . . . . . . . . . . . . . . . . . . . . . . . . . . . . . . . . . . . . . . . . . GermanyICEM Technologies GmbH . . . . . . . . . . . . . . . . . . . . . . . . . . . . . . . . . . . . . . . . . . . . . . . . . . . . . . GermanyParametric Technology GmbH . . . . . . . . . . . . . . . . . . . . . . . . . . . . . . . . . . . . . . . . . . . . . . . . . . . GermanyComputervision Asia Ltd. . . . . . . . . . . . . . . . . . . . . . . . . . . . . . . . . . . . . . . . . . . . . . . . . . . . . . . . Hong KongParametric Technology (Hong Kong) Limited . . . . . . . . . . . . . . . . . . . . . . . . . . . . . . . . . . . . . . . Hong KongParametric Technology Research & Development (India) Private Limited . . . . . . . . . . . . . . . . . IndiaParametric Technology (India) Private Limited . . . . . . . . . . . . . . . . . . . . . . . . . . . . . . . . . . . . . . IndiaParametric Technology (Republic of Ireland) Limited . . . . . . . . . . . . . . . . . . . . . . . . . . . . . . . . . IrelandParametric Technology Services Ireland Limited . . . . . . . . . . . . . . . . . . . . . . . . . . . . . . . . . . . . . IrelandPTC (IFSC) Limited . . . . . . . . . . . . . . . . . . . . . . . . . . . . . . . . . . . . . . . . . . . . . . . . . . . . . . . . . . . IrelandParametric Technology Israel Ltd. . . . . . . . . . . . . . . . . . . . . . . . . . . . . . . . . . . . . . . . . . . . . . . . . Israel

NamePlace of
Incorporation
Computervision S.p.A. . . . . . . . . . . . . . . . . . . . . . . . . . . . . . . . . . . . . . . . . . . . . . . . . . . . . . . . . . ItalyDivision Italia S.r.l. . . . . . . . . . . . . . . . . . . . . . . . . . . . . . . . . . . . . . . . . . . . . . . . . . . . . . . . . . . . ItalyParametric Technology Italia S.r.l. . . . . . . . . . . . . . . . . . . . . . . . . . . . . . . . . . . . . . . . . . . . . . . . ItalyNihon Computervision Corporation . . . . . . . . . . . . . . . . . . . . . . . . . . . . . . . . . . . . . . . . . . . . . . . JapanNihon Parametric Technology K.K. . . . . . . . . . . . . . . . . . . . . . . . . . . . . . . . . . . . . . . . . . . . . . . . JapanParametric Korea Co., Ltd. . . . . . . . . . . . . . . . . . . . . . . . . . . . . . . . . . . . . . . . . . . . . . . . . . . . . . . KoreaCV Holding (Mauritius) Ltd. . . . . . . . . . . . . . . . . . . . . . . . . . . . . . . . . . . . . . . . . . . . . . . . . . . . . MauritiusParametric Technology Mexico S.A. de C.V. . . . . . . . . . . . . . . . . . . . . . . . . . . . . . . . . . . . . . . . MexicoParametric Technology New Zealand Limited . . . . . . . . . . . . . . . . . . . . . . . . . . . . . . . . . . . . . . New ZealandParametric Technology Norway AS . . . . . . . . . . . . . . . . . . . . . . . . . . . . . . . . . . . . . . . . . . . . . . NorwayParametric Technology Portugal-Computadores, Lda. . . . . . . . . . . . . . . . . . . . . . . . . . . . . . . . . PortugalComputervision TOO . . . . . . . . . . . . . . . . . . . . . . . . . . . . . . . . . . . . . . . . . . . . . . . . . . . . . . . . . . RussiaComputervision Asia Pte Ltd . . . . . . . . . . . . . . . . . . . . . . . . . . . . . . . . . . . . . . . . . . . . . . . . . . . . SingaporeParametric Technology Singapore Pte Ltd . . . . . . . . . . . . . . . . . . . . . . . . . . . . . . . . . . . . . . . . . SingaporeParametric Technology (Slovakia) s.r.o. . . . . . . . . . . . . . . . . . . . . . . . . . . . . . . . . . . . . . . . . . . . Slovak RepublicParametric Technology South Africa (Proprietary) Limited . . . . . . . . . . . . . . . . . . . . . . . . . . . . South AfricaParametric Technology Espana, S.A. . . . . . . . . . . . . . . . . . . . . . . . . . . . . . . . . . . . . . . . . . . . . . . SpainPTC Sweden AB . . . . . . . . . . . . . . . . . . . . . . . . . . . . . . . . . . . . . . . . . . . . . . . . . . . . . . . . . . . . . SwedenParametric Technology (Schweiz) AG . . . . . . . . . . . . . . . . . . . . . . . . . . . . . . . . . . . . . . . . . . . . SwitzerlandParametric Technology (Taiwan) Limited . . . . . . . . . . . . . . . . . . . . . . . . . . . . . . . . . . . . . . . . . . TaiwanComputervision B.V. . . . . . . . . . . . . . . . . . . . . . . . . . . . . . . . . . . . . . . . . . . . . . . . . . . . . . . . . . . The NetherlandsComputervision Finance B.V. . . . . . . . . . . . . . . . . . . . . . . . . . . . . . . . . . . . . . . . . . . . . . . . . . . . The NetherlandsComputervision International Distribution B.V. . . . . . . . . . . . . . . . . . . . . . . . . . . . . . . . . . . . . . The NetherlandsExtended Vision Logistics International B.V. . . . . . . . . . . . . . . . . . . . . . . . . . . . . . . . . . . . . . . . The NetherlandsParametric Technology Europe B.V. . . . . . . . . . . . . . . . . . . . . . . . . . . . . . . . . . . . . . . . . . . . . . . The NetherlandsParametric Technology Nederland B.V. . . . . . . . . . . . . . . . . . . . . . . . . . . . . . . . . . . . . . . . . . . . The Netherlands3rd Angle Limited . . . . . . . . . . . . . . . . . . . . . . . . . . . . . . . . . . . . . . . . . . . . . . . . . . . . . . . . . . . . United KingdomComputervision Limited . . . . . . . . . . . . . . . . . . . . . . . . . . . . . . . . . . . . . . . . . . . . . . . . . . . . . . . United KingdomComputervision Pensions Limited . . . . . . . . . . . . . . . . . . . . . . . . . . . . . . . . . . . . . . . . . . . . . . . . United KingdomDivision Group Limited . . . . . . . . . . . . . . . . . . . . . . . . . . . . . . . . . . . . . . . . . . . . . . . . . . . . . . . . United KingdomDivision Limited . . . . . . . . . . . . . . . . . . . . . . . . . . . . . . . . . . . . . . . . . . . . . . . . . . . . . . . . . . . . . United KingdomICEM Systems (UK) Limited . . . . . . . . . . . . . . . . . . . . . . . . . . . . . . . . . . . . . . . . . . . . . . . . . . . United KingdomParametric Technology (UK) Limited . . . . . . . . . . . . . . . . . . . . . . . . . . . . . . . . . . . . . . . . . . . . . United KingdomParametric Holdings (UK) Limited . . . . . . . . . . . . . . . . . . . . . . . . . . . . . . . . . . . . . . . . . . . . . . . United KingdomRasna UK Limited . . . . . . . . . . . . . . . . . . . . . . . . . . . . . . . . . . . . . . . . . . . . . . . . . . . . . . . . . . . . United Kingdom

EXHIBIT 23.1
CONSENT OF INDEPENDENT ACCOUNTANTS
We hereby consent to the incorporation by reference in the Registration Statements on Form S-8 (File Nos.333-30514, 333-30516, 333-93729, 333-01297, 333-01299, 33-52044, 33-89528, 33-61485, 333-38629,333-28495, 333-22169, 333-44701, 333-56287, 333-70227, 333-72783, 333-76027, 333-55798, and 333-55800)of Parametric Technology Corporation of our report dated October 15, 2001 relating to the financial statements,which appears in this Form 10-K.
/s/ PricewaterhouseCoopers LLP
Boston, MassachusettsDecember 26, 2001

PTC Worldwide Headquarters140 Kendrick StreetNeedham, MA 02494781.370.5000
www.ptc.com
FIARP1201-EN


![[XLS] · Web view2001 2 2003 4 2004 1 2006 1 1995 1 1990 1993 1998 1999 1999 1999 1999 2000 2000 2000 2000 2000 2001 2001 2001 2001 2001 2001 2001 2001 2001 2001 2001 2001 2001 2002](https://img.pdfslide.net/doc/110x75/5bdc2d6f09d3f2bc1c8d6ace/xls-web-view2001-2-2003-4-2004-1-2006-1-1995-1-1990-1993-1998-1999-1999-1999.jpg)