Embed Size (px)
Citation preview
Insights from the F e d e r a l r e s e r v e B a n k o F d a l l a s
EconomicLettervol. 4, no. 9
novemBer 2009
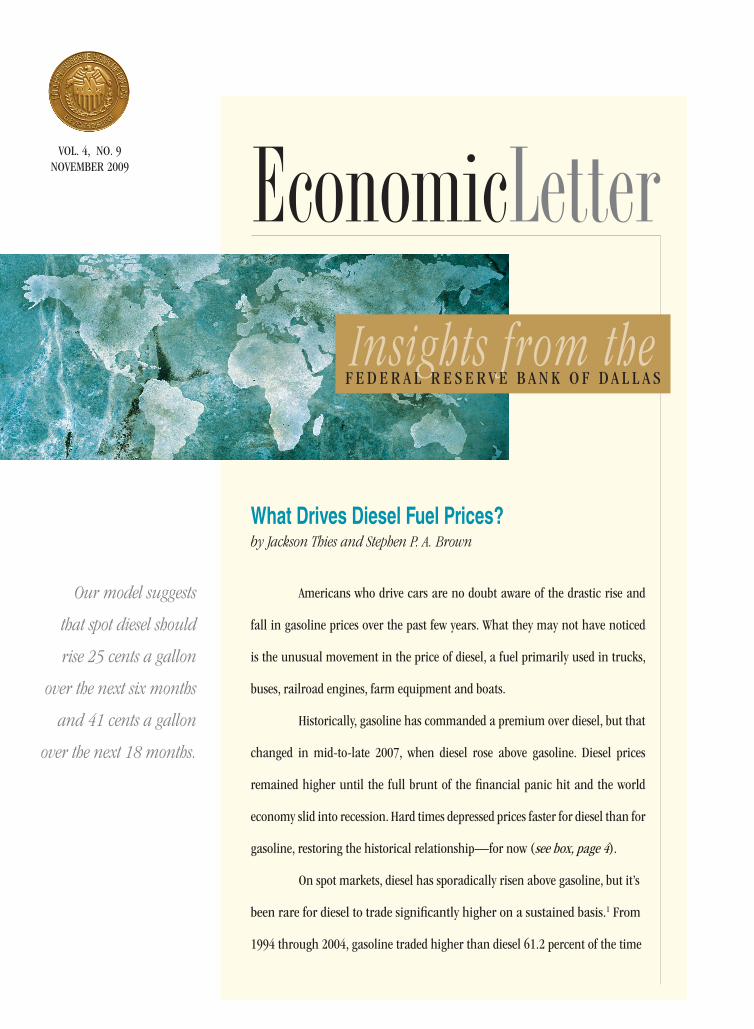
Our model suggests
that spot diesel should
rise 25 cents a gallon
over the next six months
and 41 cents a gallon
over the next 18 months.
What Drives Diesel Fuel Prices?by Jackson Thies and Stephen P. A. Brown
americans who drive cars are no doubt aware of the drastic rise and
fall in gasoline prices over the past few years. What they may not have noticed
is the unusual movement in the price of diesel, a fuel primarily used in trucks,
buses, railroad engines, farm equipment and boats.
Historically, gasoline has commanded a premium over diesel, but that
changed in mid-to-late 2007, when diesel rose above gasoline. diesel prices
remained higher until the full brunt of the financial panic hit and the world
economy slid into recession. Hard times depressed prices faster for diesel than for
gasoline, restoring the historical relationship—for now (see box, page 4).
on spot markets, diesel has sporadically risen above gasoline, but it’s
been rare for diesel to trade significantly higher on a sustained basis.1 From
1994 through 2004, gasoline traded higher than diesel 61.2 percent of the time
EconomicLetter Federal reserve Bank oF dall as2 Federal reserve Bank oF dall as EconomicLetter
As with virtually all
petroleum-derived
products, the
story begins
with oil prices.
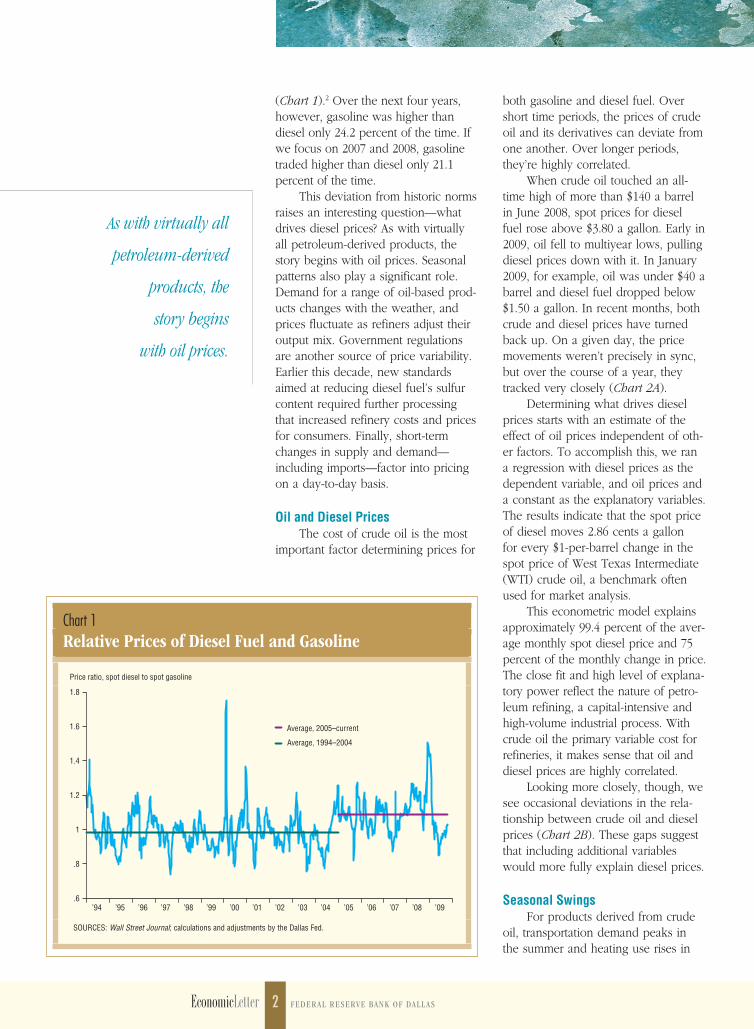
(Chart 1).2 Over the next four years, however, gasoline was higher than diesel only 24.2 percent of the time. If we focus on 2007 and 2008, gasoline traded higher than diesel only 21.1 percent of the time.
This deviation from historic norms raises an interesting question—what drives diesel prices? As with virtually all petroleum-derived products, the story begins with oil prices. Seasonal patterns also play a significant role. Demand for a range of oil-based prod-ucts changes with the weather, and prices fluctuate as refiners adjust their output mix. Government regulations are another source of price variability. Earlier this decade, new standards aimed at reducing diesel fuel’s sulfur content required further processing that increased refinery costs and prices for consumers. Finally, short-term changes in supply and demand—including imports—factor into pricing on a day-to-day basis.
Oil and Diesel PricesThe cost of crude oil is the most
important factor determining prices for
both gasoline and diesel fuel. Over short time periods, the prices of crude oil and its derivatives can deviate from one another. Over longer periods, they’re highly correlated.
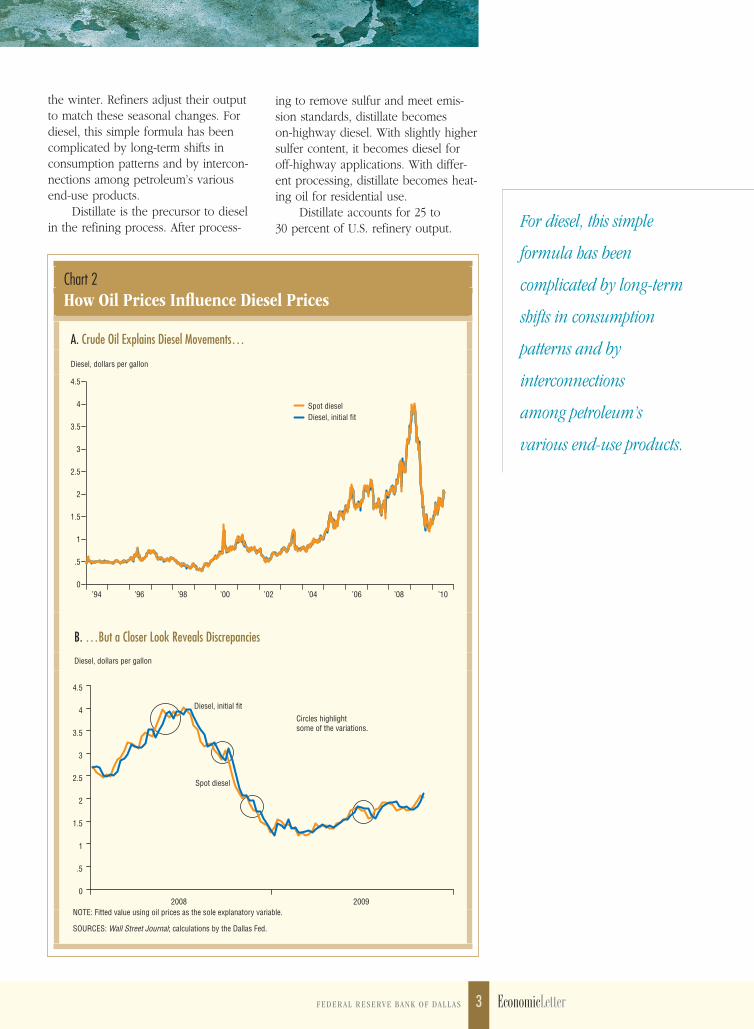
When crude oil touched an all-time high of more than $140 a barrel in June 2008, spot prices for diesel fuel rose above $3.80 a gallon. Early in 2009, oil fell to multiyear lows, pulling diesel prices down with it. In January 2009, for example, oil was under $40 a barrel and diesel fuel dropped below $1.50 a gallon. In recent months, both crude and diesel prices have turned back up. On a given day, the price movements weren’t precisely in sync, but over the course of a year, they tracked very closely (Chart 2A).
Determining what drives diesel prices starts with an estimate of the effect of oil prices independent of oth-er factors. To accomplish this, we ran a regression with diesel prices as the dependent variable, and oil prices and a constant as the explanatory variables. The results indicate that the spot price of diesel moves 2.86 cents a gallon for every $1-per-barrel change in the spot price of West Texas Intermediate (WTI) crude oil, a benchmark often used for market analysis.
This econometric model explains approximately 99.4 percent of the aver-age monthly spot diesel price and 75 percent of the monthly change in price. The close fit and high level of explana-tory power reflect the nature of petro-leum refining, a capital-intensive and high-volume industrial process. With crude oil the primary variable cost for refineries, it makes sense that oil and diesel prices are highly correlated.
Looking more closely, though, we see occasional deviations in the rela-tionship between crude oil and diesel prices (Chart 2B). These gaps suggest that including additional variables would more fully explain diesel prices.
Seasonal SwingsFor products derived from crude
oil, transportation demand peaks in the summer and heating use rises in
Chart 1Relative Prices of Diesel Fuel and Gasoline
Price ratio, spot diesel to spot gasoline
.6
.8
1
1.2
1.4
1.6
1.8
Average, 2005–current
Average, 1994–2004
’09’08’07’06’05’04’03’02’01’00’99’98’97’96’95’94
SOURCES: Wall Street Journal; calculations and adjustments by the Dallas Fed.
EconomicLetter Federal reserve Bank oF dall as Federal reserve Bank oF dall as EconomicLetter3
the winter. Refiners adjust their output to match these seasonal changes. For diesel, this simple formula has been complicated by long-term shifts in consumption patterns and by intercon-nections among petroleum’s various end-use products.
Distillate is the precursor to diesel in the refining process. After process-
Chart 2How Oil Prices Influence Diesel Prices
A. Crude Oil Explains Diesel Movements…
Diesel, dollars per gallon
Spot diesel
0
.5
1
1.5
2
2.5
3
3.5
4
4.5
’10’08’06’04’02’00’98’96’94
Diesel, initial fit
B. …But a Closer Look Reveals Discrepancies
Diesel, dollars per gallon
NOTE: Fitted value using oil prices as the sole explanatory variable.
SOURCES: Wall Street Journal; calculations by the Dallas Fed.
Diesel, initial fit
Spot diesel
0
.5
1
1.5
2
2.5
3
3.5
4
4.5
20092008
Circles highlightsome of the variations.
ing to remove sulfur and meet emis-sion standards, distillate becomes on-highway diesel. With slightly higher sulfer content, it becomes diesel for off-highway applications. With differ-ent processing, distillate becomes heat-ing oil for residential use.
Distillate accounts for 25 to 30 percent of U.S. refinery output. For diesel, this simple
formula has been
complicated by long-term
shifts in consumption
patterns and by
interconnections
among petroleum’s
various end-use products.
EconomicLetter Federal reserve Bank oF dall as4 Federal reserve Bank oF dall as EconomicLetter
Gasoline, the product of a different refining process, makes up 40 to 50 percent of this country’s production.3
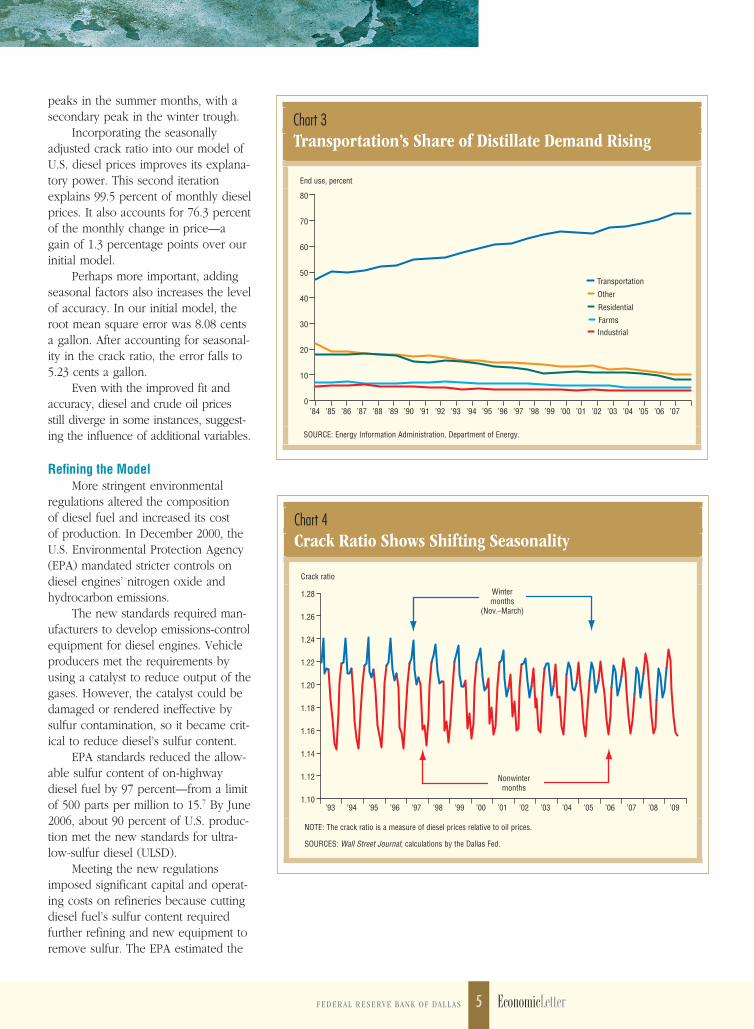
For distillate, transportation is the largest end-use market, account-ing for approximately 70 percent of consumption, up from 50 percent two decades ago (Chart 3).4 U.S. passen-ger vehicles use relatively little diesel
fuel, but more than 90 percent of U.S. goods are shipped via diesel-powered transport.5
Home heating is the other pri-mary market for distillate, although it’s not as prevalent as it once was. The Northeast—New England, in particu-lar—is the primary region that relies on heating oil for winter warmth. Most
other regions have converted to natu-ral gas, a mostly cheaper and cleaner-burning fuel. Heating oil’s dwindling importance can be seen in the decline of residential use from 15.2 percent of total distillate consumption in 1990 to 8.1 percent in 2007.
On- and off-highway diesel fuels and heating oil are so similar that they’re referred to as distillate in mea-suring consumption. Because they’re so similar, changes in demand for one product move all distillate prices.
Shifting consumption patterns have altered the seasonal ebb and flow of distillate/diesel pricing. In the past, the highest price spikes came when cold weather led to greater heating oil consumption. In anticipation, prices began to rise ahead of winter, and refiners built up heating oil inventories.
When warmer weather arrived, heating oil consumption declined, pushing down distillate/diesel prices. European refiners saw similar sea-sonal swings in their market, and they increased diesel exports to the U.S. in the summer months, putting added downward pressure on prices.
As U.S. demand for heating oil declined over the past two decades, Europeans began using more diesel fuel in their passenger cars. Together, these factors gradually shifted the sea-sonality of distillate/diesel consump-tion. The sharp increases in winter demand were reduced, and the sharp increases in summer supply from Europe were virtually eliminated.
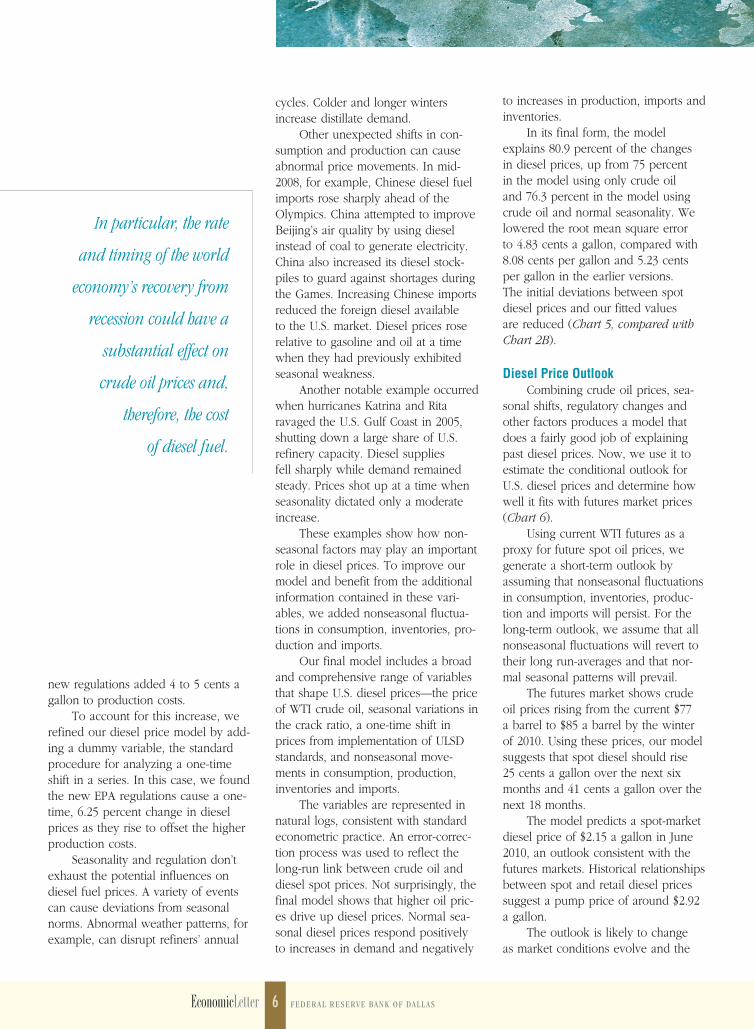
The interaction of these factors and their effect on production, imports and inventories led to a changing sea-sonal pattern in diesel prices relative to oil prices. The “crack ratio” provides a measure of the relationship between the two prices.6 It’s calculated by mul-tiplying the spot price of a gallon of regular diesel by 42—the number of gallons in an oil barrel—and dividing by the WTI spot price.
From 1993 to 2001, the crack ratio shows peaks in the winter and troughs in the summer (Chart 4). Gradually, shifting consumption patterns led to
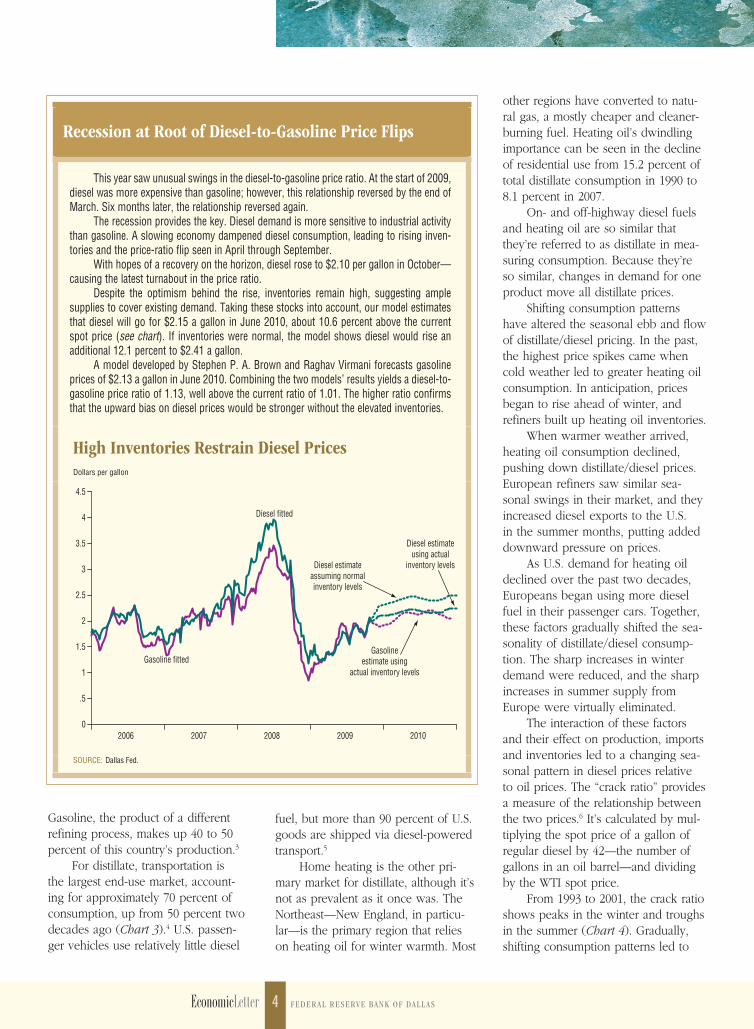
Recession at Root of Diesel-to-Gasoline Price Flips
This year saw unusual swings in the diesel-to-gasoline price ratio. At the start of 2009, diesel was more expensive than gasoline; however, this relationship reversed by the end of March. Six months later, the relationship reversed again.
The recession provides the key. Diesel demand is more sensitive to industrial activity than gasoline. A slowing economy dampened diesel consumption, leading to rising inven-tories and the price-ratio flip seen in April through September.
With hopes of a recovery on the horizon, diesel rose to $2.10 per gallon in October—causing the latest turnabout in the price ratio.
Despite the optimism behind the rise, inventories remain high, suggesting ample supplies to cover existing demand. Taking these stocks into account, our model estimates that diesel will go for $2.15 a gallon in June 2010, about 10.6 percent above the current spot price (see chart). If inventories were normal, the model shows diesel would rise an additional 12.1 percent to $2.41 a gallon.
A model developed by Stephen P. A. Brown and Raghav Virmani forecasts gasoline prices of $2.13 a gallon in June 2010. Combining the two models’ results yields a diesel-to-gasoline price ratio of 1.13, well above the current ratio of 1.01. The higher ratio confirms that the upward bias on diesel prices would be stronger without the elevated inventories.
High Inventories Restrain Diesel PricesDollars per gallon
0
.5
1
1.5
2
2.5
3
3.5
4
4.5
20102009200820072006
Diesel fitted
Gasoline fittedGasoline
estimate usingactual inventory levels
Diesel estimateusing actual
inventory levelsDiesel estimateassuming normalinventory levels
SOURCE: Dallas Fed.
EconomicLetter Federal reserve Bank oF dall as Federal reserve Bank oF dall as EconomicLetter5
peaks in the summer months, with a secondary peak in the winter trough.
Incorporating the seasonally adjusted crack ratio into our model of U.S. diesel prices improves its explana-tory power. This second iteration explains 99.5 percent of monthly diesel prices. It also accounts for 76.3 percent of the monthly change in price—a gain of 1.3 percentage points over our initial model.
Perhaps more important, adding seasonal factors also increases the level of accuracy. In our initial model, the root mean square error was 8.08 cents a gallon. After accounting for seasonal-ity in the crack ratio, the error falls to 5.23 cents a gallon.
Even with the improved fit and accuracy, diesel and crude oil prices still diverge in some instances, suggest-ing the influence of additional variables.
Refining the ModelMore stringent environmental
regulations altered the composition of diesel fuel and increased its cost of production. In December 2000, the U.S. Environmental Protection Agency (EPA) mandated stricter controls on diesel engines’ nitrogen oxide and hydrocarbon emissions.
The new standards required man-ufacturers to develop emissions-control equipment for diesel engines. Vehicle producers met the requirements by using a catalyst to reduce output of the gases. However, the catalyst could be damaged or rendered ineffective by sulfur contamination, so it became crit-ical to reduce diesel’s sulfur content.
EPA standards reduced the allow-able sulfur content of on-highway diesel fuel by 97 percent—from a limit of 500 parts per million to 15.7 By June 2006, about 90 percent of U.S. produc-tion met the new standards for ultra-low-sulfur diesel (ULSD).
Meeting the new regulations imposed significant capital and operat-ing costs on refineries because cutting diesel fuel’s sulfur content required further refining and new equipment to remove sulfur. The EPA estimated the
Chart 3Transportation’s Share of Distillate Demand Rising
End use, percent
0
10
20
30
40
50
60
70
80
Other
Transportation
FarmsIndustrial
Residential
’07’06’05’04’03’02’01’00’99’98’97’96’95’94’93’92’91’90’89’88’87’86’85’84
SOURCE: Energy Information Administration, Department of Energy.
Chart 4Crack Ratio Shows Shifting Seasonality
Crack ratio
1.10
1.12
1.14
1.16
1.18
1.20
1.22
1.24
1.26
1.28
Nonwintermonths
’09’08’07’06’05’04’03’02’01’00’99’98’97’96’95’94’93
Wintermonths
(Nov.–March)
NOTE: The crack ratio is a measure of diesel prices relative to oil prices.
SOURCES: Wall Street Journal; calculations by the Dallas Fed.
EconomicLetter Federal reserve Bank oF dall as6 Federal reserve Bank oF dall as EconomicLetter
new regulations added 4 to 5 cents a gallon to production costs.
To account for this increase, we refined our diesel price model by add-ing a dummy variable, the standard procedure for analyzing a one-time shift in a series. In this case, we found the new EPA regulations cause a one-time, 6.25 percent change in diesel prices as they rise to offset the higher production costs.
Seasonality and regulation don’t exhaust the potential influences on diesel fuel prices. A variety of events can cause deviations from seasonal norms. Abnormal weather patterns, for example, can disrupt refiners’ annual
cycles. Colder and longer winters increase distillate demand.
Other unexpected shifts in con-sumption and production can cause abnormal price movements. In mid-2008, for example, Chinese diesel fuel imports rose sharply ahead of the Olympics. China attempted to improve Beijing’s air quality by using diesel instead of coal to generate electricity. China also increased its diesel stock-piles to guard against shortages during the Games. Increasing Chinese imports reduced the foreign diesel available to the U.S. market. Diesel prices rose relative to gasoline and oil at a time when they had previously exhibited seasonal weakness.
Another notable example occurred when hurricanes Katrina and Rita ravaged the U.S. Gulf Coast in 2005, shutting down a large share of U.S. refinery capacity. Diesel supplies fell sharply while demand remained steady. Prices shot up at a time when seasonality dictated only a moderate increase.
These examples show how non-seasonal factors may play an important role in diesel prices. To improve our model and benefit from the additional information contained in these vari-ables, we added nonseasonal fluctua-tions in consumption, inventories, pro-duction and imports.
Our final model includes a broad and comprehensive range of variables that shape U.S. diesel prices—the price of WTI crude oil, seasonal variations in the crack ratio, a one-time shift in prices from implementation of ULSD standards, and nonseasonal move-ments in consumption, production, inventories and imports.
The variables are represented in natural logs, consistent with standard econometric practice. An error-correc-tion process was used to reflect the long-run link between crude oil and diesel spot prices. Not surprisingly, the final model shows that higher oil pric-es drive up diesel prices. Normal sea-sonal diesel prices respond positively to increases in demand and negatively
to increases in production, imports and inventories.
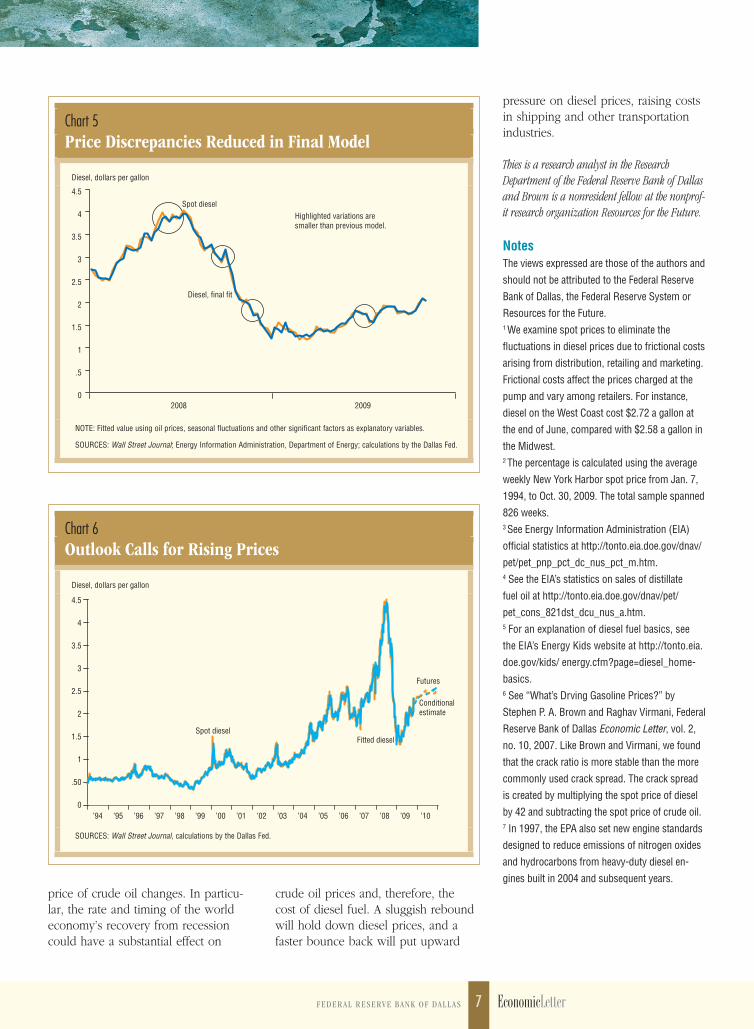
In its final form, the model explains 80.9 percent of the changes in diesel prices, up from 75 percent in the model using only crude oil and 76.3 percent in the model using crude oil and normal seasonality. We lowered the root mean square error to 4.83 cents a gallon, compared with 8.08 cents per gallon and 5.23 cents per gallon in the earlier versions. The initial deviations between spot diesel prices and our fitted values are reduced (Chart 5, compared with Chart 2B).
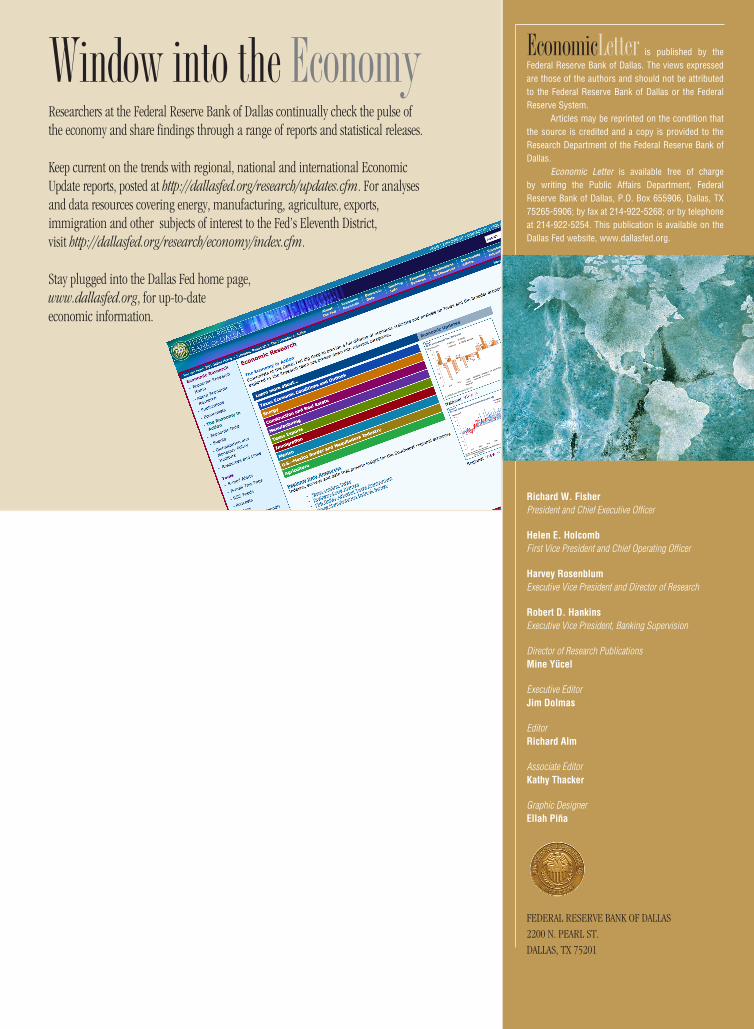
Diesel Price Outlook Combining crude oil prices, sea-
sonal shifts, regulatory changes and other factors produces a model that does a fairly good job of explaining past diesel prices. Now, we use it to estimate the conditional outlook for U.S. diesel prices and determine how well it fits with futures market prices (Chart 6).
Using current WTI futures as a proxy for future spot oil prices, we generate a short-term outlook by assuming that nonseasonal fluctuations in consumption, inventories, produc-tion and imports will persist. For the long-term outlook, we assume that all nonseasonal fluctuations will revert to their long run-averages and that nor-mal seasonal patterns will prevail.
The futures market shows crude oil prices rising from the current $77 a barrel to $85 a barrel by the winter of 2010. Using these prices, our model suggests that spot diesel should rise 25 cents a gallon over the next six months and 41 cents a gallon over the next 18 months.
The model predicts a spot-market diesel price of $2.15 a gallon in June 2010, an outlook consistent with the futures markets. Historical relationships between spot and retail diesel prices suggest a pump price of around $2.92 a gallon.
The outlook is likely to change as market conditions evolve and the
In particular, the rate
and timing of the world
economy’s recovery from
recession could have a
substantial effect on
crude oil prices and,
therefore, the cost
of diesel fuel.
EconomicLetter Federal reserve Bank oF dall as Federal reserve Bank oF dall as EconomicLetter7
price of crude oil changes. In particu-lar, the rate and timing of the world economy’s recovery from recession could have a substantial effect on
Chart 5Price Discrepancies Reduced in Final Model
Diesel, dollars per gallon
Diesel, final fit
Spot diesel
0
.5
1
1.5
2
2.5
3
3.5
4
4.5
20092008
Highlighted variations aresmaller than previous model.
NOTE: Fitted value using oil prices, seasonal fluctuations and other significant factors as explanatory variables.
SOURCES: Wall Street Journal; Energy Information Administration, Department of Energy; calculations by the Dallas Fed.
Chart 6Outlook Calls for Rising Prices
Diesel, dollars per gallon
0
.50
1
1.5
2
2.5
3
3.5
4
4.5
’10 ’09 ’08 ’07 ’06 ’05 ’04 ’03 ’02 ’01 ’00 ’99 ’98 ’97 ’96 ’95 ’94
Fitted dieselSpot diesel
Conditionalestimate
Futures
SOURCES: Wall Street Journal, calculations by the Dallas Fed.
pressure on diesel prices, raising costs in shipping and other transportation industries.
Thies is a research analyst in the Research Department of the Federal Reserve Bank of Dallas and Brown is a nonresident fellow at the nonprof-it research organization Resources for the Future.
NotesThe views expressed are those of the authors and
should not be attributed to the Federal Reserve
Bank of Dallas, the Federal Reserve System or
Resources for the Future.1 We examine spot prices to eliminate the
fluctuations in diesel prices due to frictional costs
arising from distribution, retailing and marketing.
Frictional costs affect the prices charged at the
pump and vary among retailers. For instance,
diesel on the West Coast cost $2.72 a gallon at
the end of June, compared with $2.58 a gallon in
the Midwest.2 The percentage is calculated using the average
weekly New York Harbor spot price from Jan. 7,
1994, to Oct. 30, 2009. The total sample spanned
826 weeks.3 See Energy Information Administration (EIA)
official statistics at http://tonto.eia.doe.gov/dnav/
pet/pet_pnp_pct_dc_nus_pct_m.htm.4 See the EIA’s statistics on sales of distillate
fuel oil at http://tonto.eia.doe.gov/dnav/pet/
pet_cons_821dst_dcu_nus_a.htm.5 For an explanation of diesel fuel basics, see
the EIA’s Energy Kids website at http://tonto.eia.
doe.gov/kids/ energy.cfm?page=diesel_home-
basics.6 See “What’s Drving Gasoline Prices?” by
Stephen P. A. Brown and Raghav Virmani, Federal
Reserve Bank of Dallas Economic Letter, vol. 2,
no. 10, 2007. Like Brown and Virmani, we found
that the crack ratio is more stable than the more
commonly used crack spread. The crack spread
is created by multiplying the spot price of diesel
by 42 and subtracting the spot price of crude oil.7 In 1997, the EPA also set new engine standards
designed to reduce emissions of nitrogen oxides
and hydrocarbons from heavy-duty diesel en-
gines built in 2004 and subsequent years.crude oil prices and, therefore, the cost of diesel fuel. A sluggish rebound will hold down diesel prices, and a faster bounce back will put upward
EconomicLetter is published by the Federal Reserve Bank of Dallas. The views expressed are those of the authors and should not be attributed to the Federal Reserve Bank of Dallas or the Federal Reserve System. Articles may be reprinted on the condition that the source is credited and a copy is provided to the Research Department of the Federal Reserve Bank of Dallas. Economic Letter is available free of charge by writing the Public Affairs Department, Federal Reserve Bank of Dallas, P.O. Box 655906, Dallas, TX 75265-5906; by fax at 214-922-5268; or by telephone at 214-922-5254. This publication is available on the Dallas Fed website, www.dallasfed.org.
Richard W. FisherPresident and Chief Executive Officer
Helen E. HolcombFirst Vice President and Chief Operating Officer
Harvey RosenblumExecutive Vice President and Director of Research
Robert D. HankinsExecutive Vice President, Banking Supervision
Director of Research PublicationsMine Yücel
Executive EditorJim Dolmas
EditorRichard Alm
Associate EditorKathy Thacker
Graphic DesignerEllah Piña
Federal reserve Bank oF dallas2200 n. Pearl st.dallas, tX 75201
Window into the Economy
researchers at the Federal reserve Bank of dallas continually check the pulse of the economy and share findings through a range of reports and statistical releases. keep current on the trends with regional, national and international economic Update reports, posted at http://dallasfed.org/research/updates.cfm. For analyses and data resources covering energy, manufacturing, agriculture, exports, immigration and other subjects of interest to the Fed’s eleventh district, visit http://dallasfed.org/research/economy/index.cfm.
stay plugged into the dallas Fed home page, www.dallasfed.org, for up-to-date economic information.