Embed Size (px)
Citation preview
1
What Drives FDI Policy Liberalization? An Empirical Investigation
Krishna Chaitanya Vadlamannati
Alfred-Weber-Institute for Economics
University of Heidelberg, Germany
Arusha Cooray
School of Economics
University of Wollongong, Australia
Abstract: Do countries compete for FDI by liberalizing their FDI policy regimes? Our
measure of FDI policy liberalization is an event count of changes made by a country in a
given year in the areas of approval procedures, sectoral restrictions, operational conditions,
incentives, investment guarantees, foreign exchange, and corporate regulations to attract FDI.
Using spatial econometric estimations on panel data for 148 countries during the 1992–2009
period, we find that favorable policy changes to the FDI regime in one country are positively
correlated with FDI policy changes elsewhere (i.e., policy changes favorable to FDI from
other countries, increase the likelihood of liberalizing FDI policy in the country in question).
While low income countries compete among themselves for investment via the liberalization
of FDI policy, competition is most fierce in those countries which are relatively more open to
FDI. These results are robust to alternative weighting schemes, estimation methods, sample
sizes, and controlling for the possibility of endogeneity.
Keywords: FDI policy liberalization, spatial econometrics (C33, C26, F21).
_____________________________
Authors’ note: Krishna Vadlamannati thanks Thomas Pollan at UNCTAD and Stephen J. Kobrin for
generously sharing the FDI policy liberalization data. We also thank Ron Davies for the discussion on
spatial econometrics. The data and do files for replicating the results can be obtained upon request.
2
1. Introduction
Do nation states compete for Foreign Direct Investment (FDI hereafter) by altering laws and
regulations governing FDI policy? While there is much anecdotal evidence to suggest that
they do, surprisingly enough, to the best of our knowledge there is no empirical evidence to
support these claims. The present paper fills this gap in the international political economy
literature by specifically looking at competition among countries in liberalizing FDI laws and
regulations related to foreign ownership, approval procedures, sectoral restrictions,
operational conditions, incentives, investment guarantees, foreign exchange, and corporate
regulations. It is often argued that globalization gives footloose capital greater bargaining
power while placing host country governments under pressure to liberalize laws and
regulations governing FDI policy, thus leading to competition between countries to attract
FDI. Countries also compete for FDI because it can yield a number of benefits for host
countries, including the development of infrastructure, technology transfer, promotion of
institutions conducive to economic growth, and improvements in managerial knowledge and
the level of skill among the human capital stock – all necessary for a country to compete in
global markets (Dunning 1993). The main underlying argument here is that entrepreneurial
politicians respond to capital mobility through a process of regulatory and incentive based
competition, with the expectation that FDI creates job opportunities raising wages. This
forms a huge political capital for incumbent politicians. Although competition for mobile
capital is present among developed and developing countries, we believe that it is developing
countries which compete more fiercely among themselves, as well as with developed
countries, to attract FDI. Developed countries are not pushed as hard as developing countries
to compete for mobile capital because they possess better infrastructure facilities and property
rights protection, as well as stronger institutions and a more educated work force. This
3
reduces the cost of conducting business, making them attractive destinations for FDI in the
long run (Ahlquist 2006).
Previous studies on the liberalization of FDI policy have examined the effects of
openness (Asiedu and Lien 2004, Biglaiser and DeRouen 2007), tax incentives (Banga 2006),
administrative barriers (Morisset and Neso 2002) and deregulation (Golub 2003, Gastanga et
al. 1998) to attract FDI. Although Korbin (2005) attempts to study the basic determinants of
the liberalization of FDI policy, curiously, the key aspect of inter-country competition has yet
to be explored. In this paper, we use spatial econometrics to examine whether changes in FDI
laws and regulations which are favorable to attracting FDI in one country, are influenced by
favorable changes in FDI policy elsewhere. We also examine if such competition is evident
both within group as well as across various groups of countries.
Spatial econometrics has been used in the literature to explore the extent of
competition in tax, environmental standards, economic policy reforms, bilateral investment
treaties and labor standards, among others. Some of the initial studies that have used spatial
econometrics to examine tax competition among developed countries include those by
Davies, Egger and Egger (2003), Devereux, Lockwood, and Redoano (2008), Davies and
Voget (2008), Overesche and Rinke (2008) and Klemm and van Parys (2009). Davies and
Vadlamannati (2011) also use spatial econometrics to examine the extent of competition in
labor standards among nation states to attract FDI and trade. Neumayer and de Soysa (2011)
use a similar technique with a different weighting matrix and find support for a race to the top
with respect to women’s labor rights. Spatial econometrics is additionally used by Markusen,
Morey and Olewiler (1995), Fredriksson and Millimet (2002), Beron et al. (2003), Murdoch
et al. (2003), Davies and Naughton (2006) and Perkins and Neumayer (2010) to explore the
race to the bottom argument in the adoption of environmental agreements and policies. This
form of econometrics has also been used in studies measuring the extent of diffusion of
4
policy liberalization and investment treaties. For example, Pitlik (2007) and Gassebner,
Gaston and Lamla (2011) find evidence of competition among countries to liberalize
regulatory, monetary and trade policies, while Simmons and Elkins (2004) find that the
adoption of economic practices is highly clustered, both temporally and spatially. Using
subnational data in Germany, Potrafke (2012) finds that economic liberalization in one state
is influenced by economic liberalization in a neighboring state. Simmons, Elkins, and
Guzman (2004) also find that inter-country competition drives the signing of bilateral
investment treaties1.
While most of these studies are cross-country analyses, to the best of our knowledge
there is no evidence for competition among countries to liberalize FDI policy regimes in
order to make the host destination more attractive to FDI. Our paper attempts to fill this gap
by specifically focusing on competition among countries to attract FDI through liberalizing
FDI policy regimes, further examining whether this competition is any different within and
between developing and developed countries. Using information on changes in FDI laws and
regulations in 148 countries during the 1992–2009 period, we find that changes in FDI laws
and regulations which are favorable to FDI in one country, are positively correlated with the
liberalization of FDI policy in other countries. Furthermore, we find that developing countries
compete for FDI by relaxing FDI regulations more fiercely among themselves. On the other
hand, we also find that the competition is intense in the countries which are relatively more
open to FDI. Our results remain robust to an alternative weighting scheme and controlling for
endogeneity. We interpret these results as direct evidence of interstate strategic interactions in
the liberalization of FDI policy. It is beyond the scope of this study to examine whether such
fierce competition among countries actually leads to a race to the bottom, or otherwise. We
1 There are also other areas where spatial econometrics has been used. For instance, Cho, Dreher and Neumayer
(2011) use it to examine the diffusion of anti-trafficking government policies. Also, Cao (2010) examining
policy diffusion in taxation finds that the competition mechanism induced by network position similarity in the
network of portfolio investment and that of exports causes policy diffusion in corporate taxation.
5
leave it to a future research agenda to examine whether competition among states results in
race to the bottom or race to the top.
The rest of the paper is structured as follows. Section 2 illustrates the reasons as to
why countries compete for FDI. Section 3 describes the data used and the spatial econometric
methodology in detail. Section 4 discusses the results and section 5 concludes.
2. Theory and Hypothesis
The 1990s witnessed a marked increase in economic integration which resulted in a
dramatic increase in FDI inflows into developing countries. It is estimated that FDI inflows
into developing countries during 1990s increased by about 520% (UNCTAD 2004). This
increase was a consequence of widespread liberalization of FDI laws and regulations.
According to Kobrin (2005), the 1992–2001 period witnessed roughly 1029 changes in
policies favorable to FDI in developing countries alone. While many developing countries
started to frame policies in favor of FDI and reduce regulations for the entry of foreign firms
in the 1990s, this trend became even more pronounced in the 2000s. Using a different
measure of changes in FDI policy, Pandya (2010) finds that a median country, protecting
about 40% of its industries from the entry of foreign firms in the 1970s, dropped its
protection to about 12% by the end of 2000. These drastic changes in policies favoring FDI
are a significant reversal from the 1970s and 1980s as the general consensus until the 1980s
was that economic incentives had an ambiguous effect on economic growth, or no impact at
all (Peters and Fisher 2004, Markusen and Nesse 2006). Subsequent studies have shown that
tax and other incentives have a significant effect on regional growth (Bartik 1993, Phillips
and Gross 1995, Newman and Sullivan 1988). Moreover, traditional economic growth theory
highlights the importance of investment in attaining higher rates of economic growth (Barro
and Sala-i-Martin 2004).
6
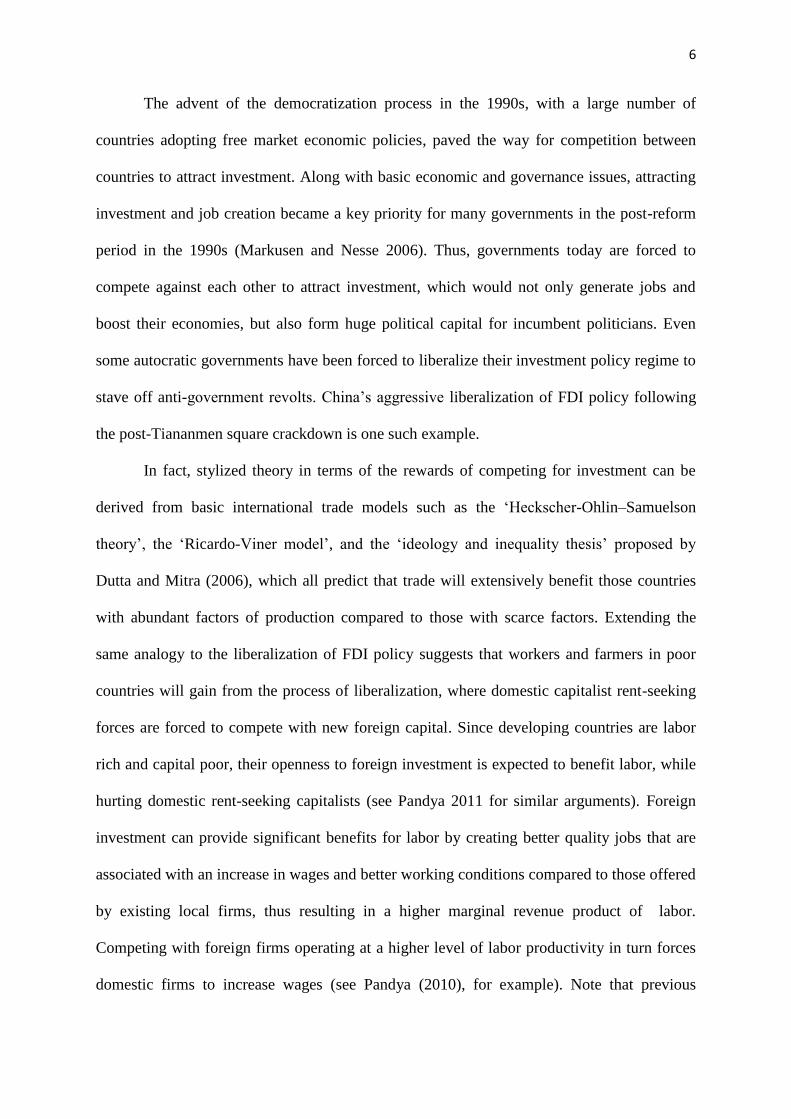
The advent of the democratization process in the 1990s, with a large number of
countries adopting free market economic policies, paved the way for competition between
countries to attract investment. Along with basic economic and governance issues, attracting
investment and job creation became a key priority for many governments in the post-reform
period in the 1990s (Markusen and Nesse 2006). Thus, governments today are forced to
compete against each other to attract investment, which would not only generate jobs and
boost their economies, but also form huge political capital for incumbent politicians. Even
some autocratic governments have been forced to liberalize their investment policy regime to
stave off anti-government revolts. China’s aggressive liberalization of FDI policy following
the post-Tiananmen square crackdown is one such example.
In fact, stylized theory in terms of the rewards of competing for investment can be
derived from basic international trade models such as the ‘Heckscher-Ohlin–Samuelson
theory’, the ‘Ricardo-Viner model’, and the ‘ideology and inequality thesis’ proposed by
Dutta and Mitra (2006), which all predict that trade will extensively benefit those countries
with abundant factors of production compared to those with scarce factors. Extending the
same analogy to the liberalization of FDI policy suggests that workers and farmers in poor
countries will gain from the process of liberalization, where domestic capitalist rent-seeking
forces are forced to compete with new foreign capital. Since developing countries are labor
rich and capital poor, their openness to foreign investment is expected to benefit labor, while
hurting domestic rent-seeking capitalists (see Pandya 2011 for similar arguments). Foreign
investment can provide significant benefits for labor by creating better quality jobs that are
associated with an increase in wages and better working conditions compared to those offered
by existing local firms, thus resulting in a higher marginal revenue product of labor.
Competing with foreign firms operating at a higher level of labor productivity in turn forces
domestic firms to increase wages (see Pandya (2010), for example). Note that previous
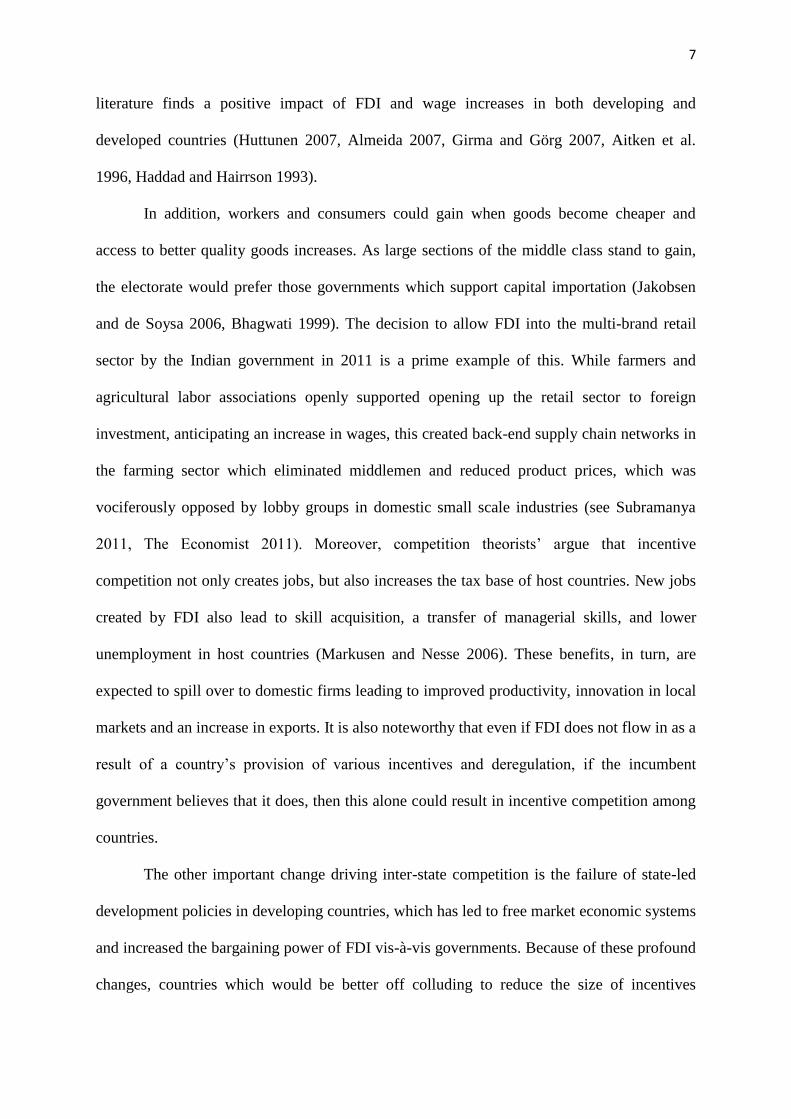
7
literature finds a positive impact of FDI and wage increases in both developing and
developed countries (Huttunen 2007, Almeida 2007, Girma and Görg 2007, Aitken et al.
1996, Haddad and Hairrson 1993).
In addition, workers and consumers could gain when goods become cheaper and
access to better quality goods increases. As large sections of the middle class stand to gain,
the electorate would prefer those governments which support capital importation (Jakobsen
and de Soysa 2006, Bhagwati 1999). The decision to allow FDI into the multi-brand retail
sector by the Indian government in 2011 is a prime example of this. While farmers and
agricultural labor associations openly supported opening up the retail sector to foreign
investment, anticipating an increase in wages, this created back-end supply chain networks in
the farming sector which eliminated middlemen and reduced product prices, which was
vociferously opposed by lobby groups in domestic small scale industries (see Subramanya
2011, The Economist 2011). Moreover, competition theorists’ argue that incentive
competition not only creates jobs, but also increases the tax base of host countries. New jobs
created by FDI also lead to skill acquisition, a transfer of managerial skills, and lower
unemployment in host countries (Markusen and Nesse 2006). These benefits, in turn, are
expected to spill over to domestic firms leading to improved productivity, innovation in local
markets and an increase in exports. It is also noteworthy that even if FDI does not flow in as a
result of a country’s provision of various incentives and deregulation, if the incumbent
government believes that it does, then this alone could result in incentive competition among
countries.
The other important change driving inter-state competition is the failure of state-led
development policies in developing countries, which has led to free market economic systems
and increased the bargaining power of FDI vis-à-vis governments. Because of these profound
changes, countries which would be better off colluding to reduce the size of incentives
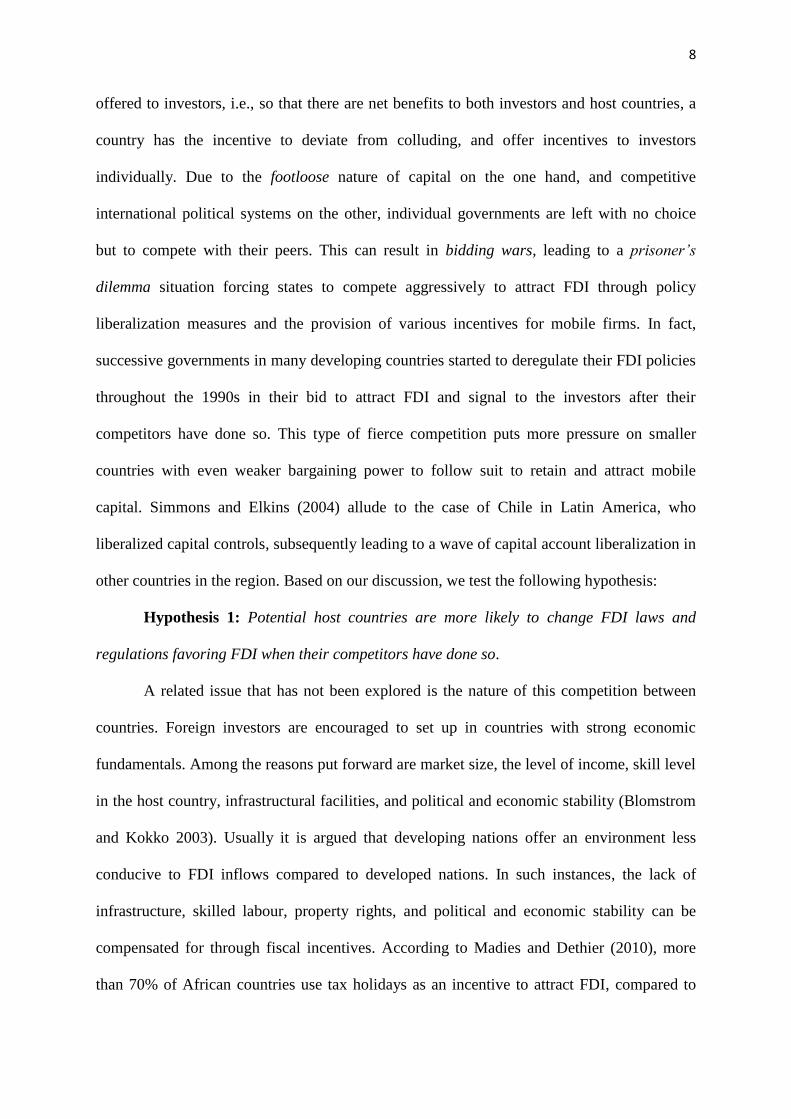
8
offered to investors, i.e., so that there are net benefits to both investors and host countries, a
country has the incentive to deviate from colluding, and offer incentives to investors
individually. Due to the footloose nature of capital on the one hand, and competitive
international political systems on the other, individual governments are left with no choice
but to compete with their peers. This can result in bidding wars, leading to a prisoner’s
dilemma situation forcing states to compete aggressively to attract FDI through policy
liberalization measures and the provision of various incentives for mobile firms. In fact,
successive governments in many developing countries started to deregulate their FDI policies
throughout the 1990s in their bid to attract FDI and signal to the investors after their
competitors have done so. This type of fierce competition puts more pressure on smaller
countries with even weaker bargaining power to follow suit to retain and attract mobile
capital. Simmons and Elkins (2004) allude to the case of Chile in Latin America, who
liberalized capital controls, subsequently leading to a wave of capital account liberalization in
other countries in the region. Based on our discussion, we test the following hypothesis:
Hypothesis 1: Potential host countries are more likely to change FDI laws and
regulations favoring FDI when their competitors have done so.
A related issue that has not been explored is the nature of this competition between
countries. Foreign investors are encouraged to set up in countries with strong economic
fundamentals. Among the reasons put forward are market size, the level of income, skill level
in the host country, infrastructural facilities, and political and economic stability (Blomstrom
and Kokko 2003). Usually it is argued that developing nations offer an environment less
conducive to FDI inflows compared to developed nations. In such instances, the lack of
infrastructure, skilled labour, property rights, and political and economic stability can be
compensated for through fiscal incentives. According to Madies and Dethier (2010), more
than 70% of African countries use tax holidays as an incentive to attract FDI, compared to

9
only 20% of OECD countries. Azemar and Delois (2008) argue that the level of statutory tax
rates strongly influence the destination of Japanese firms, and may allow a country to
compensate for disadvantages related to public good provision or governance. However, the
influence of corporate taxes decreases with a high provision of public goods and better
quality of public governance. Similarly, Haufler and Wooton (1998) show that that foreign
investors prefer to locate in larger countries providing a higher producer price, even in the
presence of higher tax levels. Imperfect competition leads small countries to offer lower tax
rates relative to large countries in order to compensate for their small market size (Raff and
Srinivasan 1997, Haufler and Wooton 1998). Accordingly, we expect that the nature of FDI
competition is fiercer in developing countries vis-à-vis developed countries. We therefore
test:
Hypothesis 2: Competition to attract FDI via the liberalization of FDI policy is
fiercer among developing countries.
3. Data and Methods
3.1 Model Specification
We use panel data covering 148 countries over the 1992–2009 (18 years) period. The
baseline specification estimates the number of annual changes in FDI laws and regulations
(which we describe in detail below) affecting inflows of FDI into country i in year t, which is
a function of a set of exogenous variables itZ :
)1(tiitiit ZPolicyFDI
i is the country specific dummy and ti is the error term. The control variables are drawn
from the existing FDI literature and are described below. We now include competition with
other countries by introducing the number of annual changes in FDI laws and regulations in
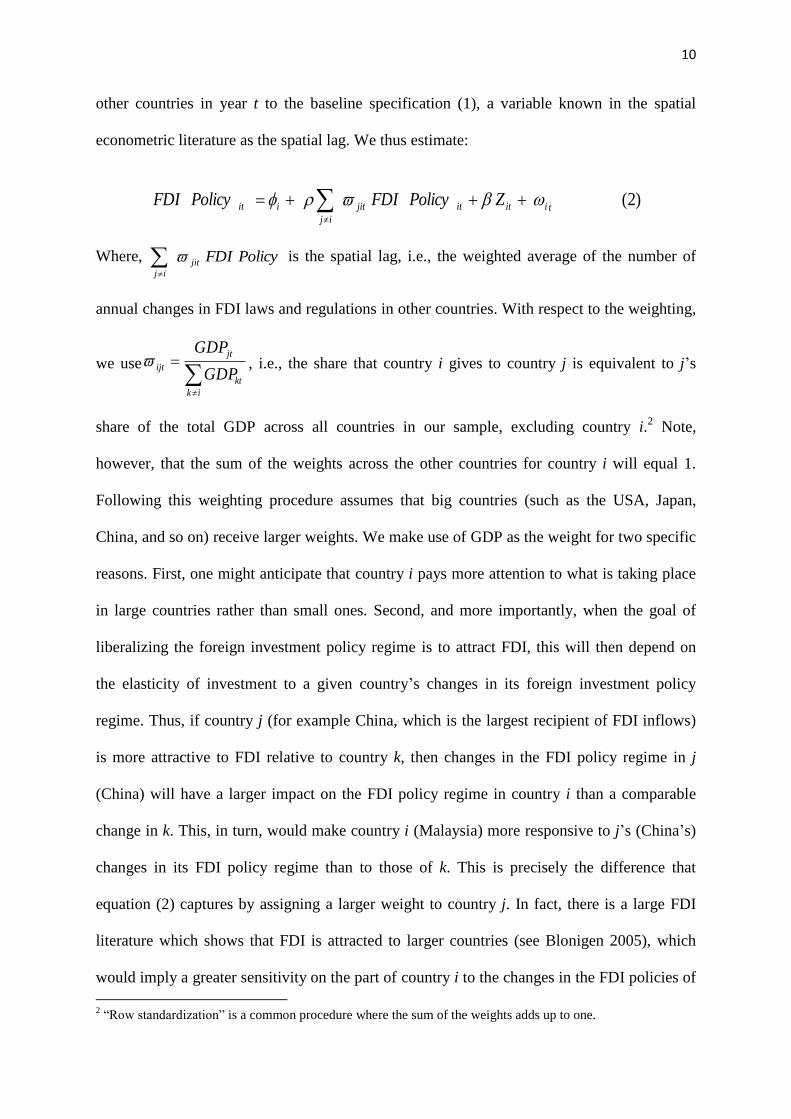
10
other countries in year t to the baseline specification (1), a variable known in the spatial
econometric literature as the spatial lag. We thus estimate:
)2(tiititjit
ij
iit ZPolicyFDIPolicyFDI
Where, PolicyFDIjit
ij
is the spatial lag, i.e., the weighted average of the number of
annual changes in FDI laws and regulations in other countries. With respect to the weighting,
we use
ik
kt
jt
ijtGDP
GDP , i.e., the share that country i gives to country j is equivalent to j’s
share of the total GDP across all countries in our sample, excluding country i.2 Note,
however, that the sum of the weights across the other countries for country i will equal 1.
Following this weighting procedure assumes that big countries (such as the USA, Japan,
China, and so on) receive larger weights. We make use of GDP as the weight for two specific
reasons. First, one might anticipate that country i pays more attention to what is taking place
in large countries rather than small ones. Second, and more importantly, when the goal of
liberalizing the foreign investment policy regime is to attract FDI, this will then depend on
the elasticity of investment to a given country’s changes in its foreign investment policy
regime. Thus, if country j (for example China, which is the largest recipient of FDI inflows)
is more attractive to FDI relative to country k, then changes in the FDI policy regime in j
(China) will have a larger impact on the FDI policy regime in country i than a comparable
change in k. This, in turn, would make country i (Malaysia) more responsive to j’s (China’s)
changes in its FDI policy regime than to those of k. This is precisely the difference that
equation (2) captures by assigning a larger weight to country j. In fact, there is a large FDI
literature which shows that FDI is attracted to larger countries (see Blonigen 2005), which
would imply a greater sensitivity on the part of country i to the changes in the FDI policies of
2 “Row standardization” is a common procedure where the sum of the weights adds up to one.
11
a large country. Moreover, the literature using spatial econometrics to examine cross-country
competition has also used GDP as a weight (e.g., Davies and Vadlamannati 2011,
Vadlamannati 2011, Devereux, Lockwood, and Redoano, 2008, Madariaga and Poncet 2007,
Pitlik 2007).
We include country fixed effects to control for unobserved country specific
heterogeneity in the panel dataset. We also include a time trend to capture other key reform
measures taking place in each country. The time trend also captures factors which are not
accounted for in the models, such as efficiency gains through technological advancements or
enhanced management skills, which grow over time and can have a positive correlation with
changes in FDI policy regimes. As the dependent variable here is a count of the number of
annual changes in FDI laws and regulations, the preferred estimates are those from the
maximum likelihood, zero-inflated negative binomial regression method (Brandt et al. 2000
and King 1988) with heteroskedasticity consistent robust standard errors (Beck and Katz
1995). It is noteworthy that our dependent count variable not only exhibits a distribution that
is strongly skewed to the right (accumulation of observations at zero), but also shows over-
dispersion (variance being greater than the mean - see descriptive statistics in Appendix 2)
with excess zeros (zeros represent about 40%). To counter these problems, we make use of
the zero-inflated, negative binomial method (Lambert 1992, Greene 1994).
3.2 Data
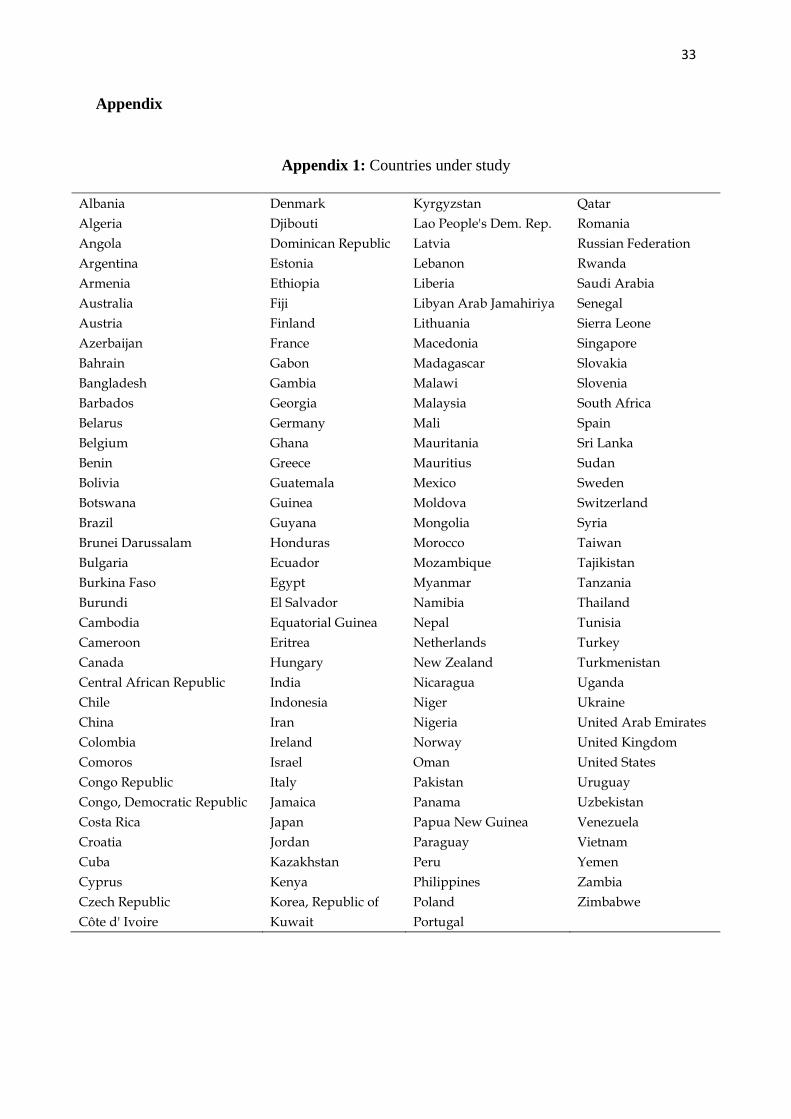
We use annual data for 148 countries from 1992 to 2009. Appendix 1 includes the list
of countries used in our study. For the dependent variable, we make use of the number of
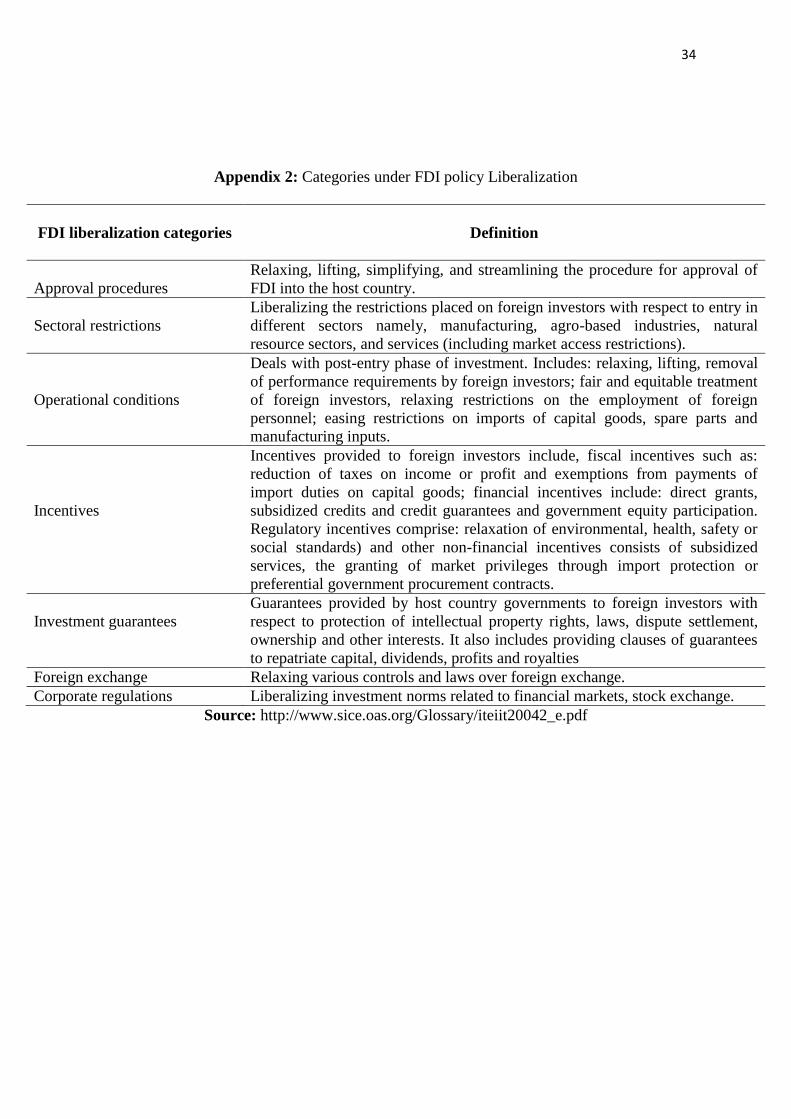
annual changes in FDI laws and regulations which are favorable to FDI, which is the
aggregation of changes occurring in the following categories: (a) Foreign ownership, (b)
Approval procedures, (c) Sectoral restrictions, (d) Operational conditions, (e) Incentives, (f)
Guarantees or protections, (g) Foreign exchange, and (h) Corporate regulations. The details
12
for each of these categories are described in appendix 2. This data is generated by UNCTAD,
which has been collecting the information on annual changes in the FDI policies of respective
countries since 1992. UNCTAD collects this information for its annual World Investment
Reports, which monitor and analyze global and regional policy trends affecting FDI flows.
As an initial step, UNCTAD collects these data from various sources ranging from the media
and private consulting firms, to official government sources such as investment promotion
agencies or respective ministries. In the second step, this information is sent to the respective
government ministries for proper verification. Upon verification, if revisions are warranted,
then changes are made to the data. In a final step, the changes are categorized according to
the eight relevant categories listed above. It is noteworthy that our dependent variable is the
count of changes in FDI laws and regulations which are favorable to FDI in all eight
categories combined. Unfortunately, UNCTAD does not provide disaggregated data on each
of the eight categories. It is, however, important to note that changes in FDI laws and
regulations reflect the mere openness to FDI and not the degree of openness at that particular
point in time. With this caveat in mind, we use this dataset with the intention of capturing
broader trends reflecting changes in FDI policy regimes across countries.
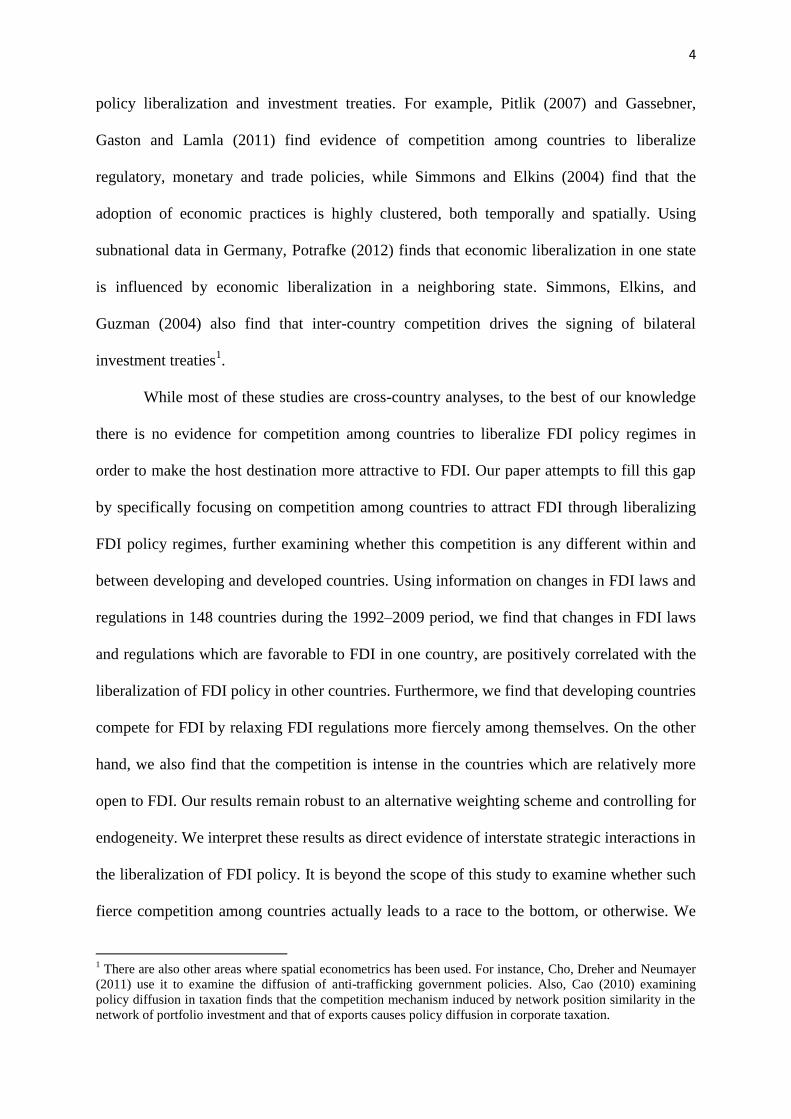
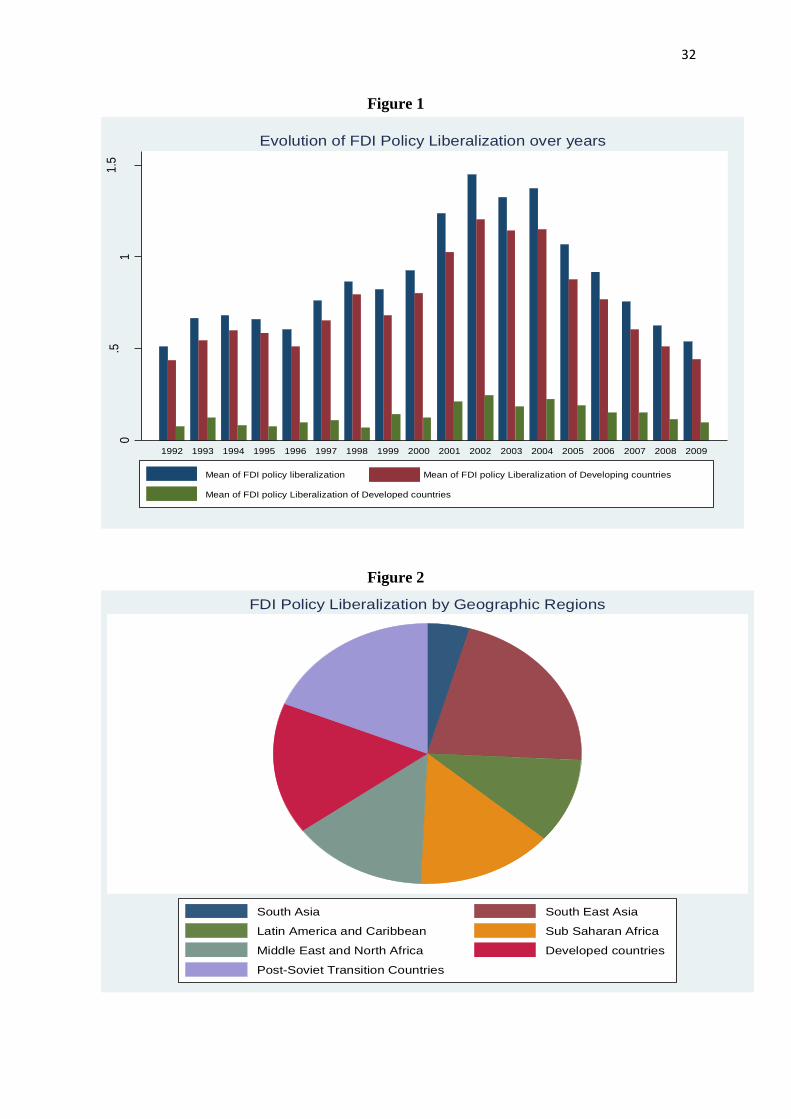
Figure 1 captures the the evolution of the liberalization of FDI policy across the 148
countries analyzed over the 1992–2009 period. As one can see, the number of annual changes
in FDI laws and regulations saw a steady increase during the mid to late 1990s, and then
declined towards the end of 2009. This trend is also broadly reflected among developing
countries (in red bars). On the other hand, despite being low, the liberalization of FDI policy
among developed countries remained fairly constant over the years. On average, the number
of policy changes carried out by a median developing country was below 0.5 in 1992. This
increased to almost1.5 during 2002, and remained at just 0.5 in 2009. By contrast, the number
of changes carried out by a median developed country always remained below 0.5 during our

13
study period. Thus, much of the changes in FDI laws and regulations in our sample period are
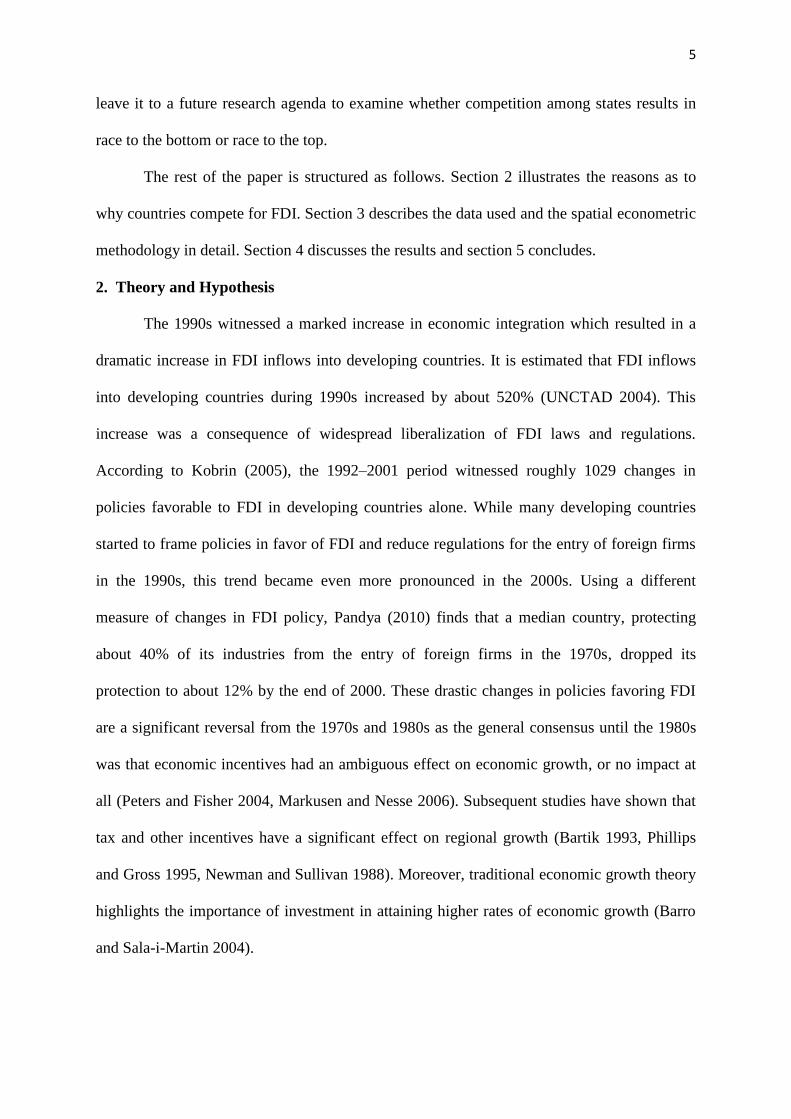
largely driven by developing countries and not by developed countries. Figure 2 provides a
geographic breakdown of the number of changes in FDI laws and regulations over the 1992–
2009 period. As seen, Southeast Asia has witnessed the majority of the changes in FDI
policy, at 21.3% (494 changes) of the total share, followed by post-Soviet transition
countries, at 18.8% (about 435 changes). Sub-Saharan Africa and the Middle East/North
Africa accounted for roughly 14% each, with 335 and 331 policy changes, respectively.
Developed countries, comprising of Europe, Australia, New Zealand, Canada and the USA,
saw 378 policy changes in their FDI laws and regulations, which is about 16.3% of the total
changes registered worldwide. South Asia saw the least number of changes at 104, which is
roughly 4.5% of the total share. It is noteworthy that many of the changes in South Asia and
Southeast Asia are driven by India and China, respectively.
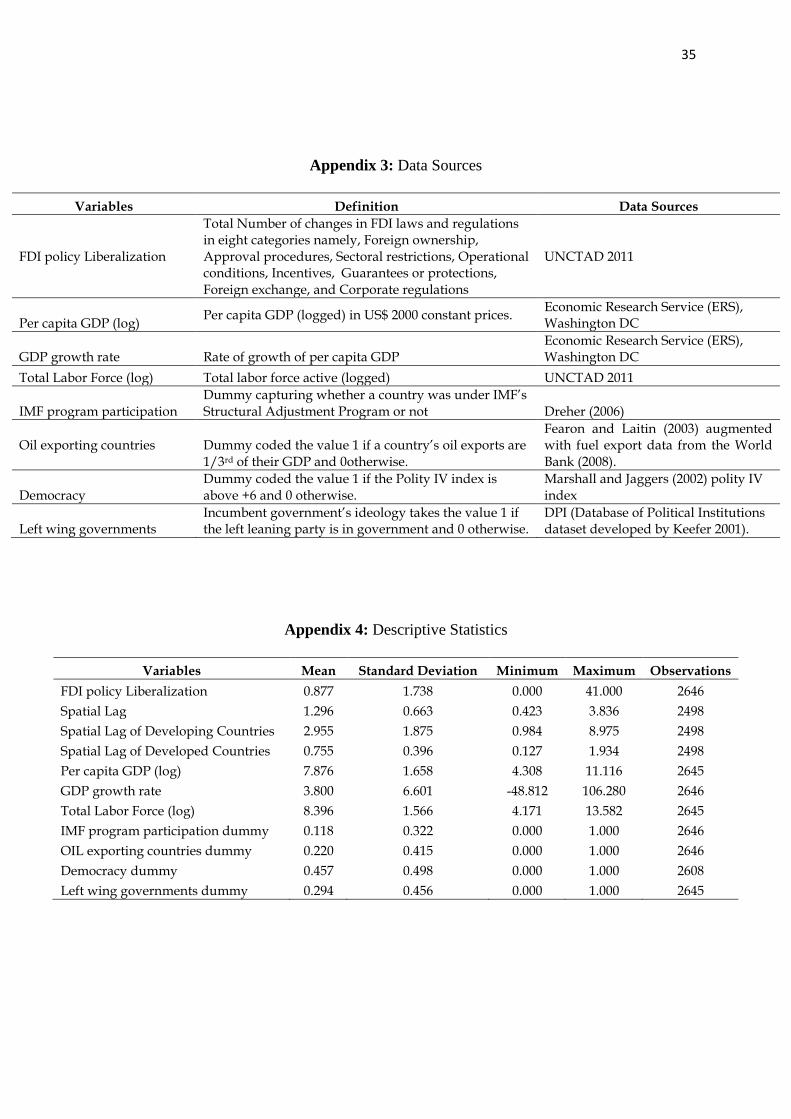
With respect to the control variables, we follow other studies on determinants of FDI -
Blonigen (2005), Chakrabarti (2001), Wheeler and Moody (1992) - and other comprehensive
evaluations of the liberalization of FDI policy (Kobrin 2005). Accordingly, we include GDP
per capita, measured in 2000 US$ constant prices (logged), as a proxy for the level of
development in the host country. It has been argued in the literature that the benefits accruing
from FDI are conditional upon higher levels of absorptive capabilities (Borensztein et al.
1998) and are thus more likely to benefit from FDI liberalization. Likewise, we control for
the rate of growth in GDP of the respective host countries, which might be associated with
the liberalization of FDI policy. We also include total labor force (logged) as a proxy for the
support for new investments which are expected to push wages upwards. Following others,
we incorporate a measure of democracy which takes the value 1 if Marshall and Jaggers
(2002) polity IV index is equal or above +6 on the scale of -10 to +10, with higher values
14
representing a greater level of democracy3 (Robertson and Teitelbaum 2011, Pandya 2010).
In addition to these variables, we include oil export dependency, which is expected to have a
negative effect on the liberalization of FDI policy. Oil wealth is a dummy variable taking the
value 1 if oil exports exceed one-third of export revenue, and 0 otherwise. We also include a
variable capturing the ideology of the incumbent government. Many studies have found
ideology to be a key determinant of market economic liberalization process (Bjørnskov and
Potrafke 2012, Bjørnskov and Potrafke 2011). The data on ideology comes from Beck et al.
(2001), which are coded as a value of 1 for leftist governments in power, and 0 otherwise.
Finally, using the dataset developed by Dreher et al. (2009), we include a dummy using the
host country’s participation in the IMF structural adjustment program as a proxy for external
pressures to deregulate and liberalize the existing FDI policy regime (Kobrin 2005). The
details on definitions and data sources are provided in appendix 3.
3.3 Endogeneity concerns
The spatial lag variable is bound to be endogenous because if the liberalization of FDI
policy in country i depends on that of country j, then the reverse is also true. In order to
address this endogeneity problem, we utilize a non-linear instrumental variable estimation.
For the instruments, we use jtjit
ij
Z
, i.e., the weighted average of the other countries’
control variables, namely GDP per capita (log), the GDP growth rate, labor force,
democracy, the oil exports dummy, government ideology, and IMF program participation.
The intuition behind using these variables is twofold. First, economic and political factors are
found to be a very important force driving the liberalization of FDI policy. Second, for a
given country j, these exogenous variables directly impact its FDI policies, but are not
3 Though Polity IV index has faced some criticism, it captures three important elements of democracy namely,
presence of institutions, existence of effective constraints on executive and participation in political process,
which are found to be key for economic openness (Henisz and Manfield 2006).
15
dependent on those in country i, thus satisfying both the instrument relevance and exclusion
criteria.
Employing two-stage instrumental variable estimations (2SLS–IV) for non-linear
models such as zero-inflated negative binomial may be problematic, and the relevant
parameters are difficult to estimate directly. Therefore, we opt to regress our endogenous
variable – the spatial lag – on the selected instrumental variables by using pooled OLS
models (which are the first stage regressions). We then predict the values of the endogenous
variable and regress our dependent variable – FDI policy liberalization measure – using zero-
inflated negative binomial estimations (the second stage regressions). However, to check the
validity of the instruments in the 2SLS–IV estimations, country fixed effects are employed.
As highlighted above, the validity of the selected instruments depends on two
conditions. First is instrument relevance, i.e., they must be correlated with the explanatory
variable in question. Bound, Jaeger and Baker (1995) suggest examining the F-statistic on the
excluded instruments in the first stage regression. The selected instrument would be relevant
when the first stage regression model’s F-statistic is above 10 (Staiger and Stock 1997).
Second, the selected instrumental variable should not vary systematically with the
disturbance term in the second stage equation, i.e., 0itit IV . Meaning, instruments
cannot independently affect the dependent variable. As for the exclusion restriction, it is hard
to believe that the exogenous variables of country j directly impact the liberalization of FDI
policy in country i. Nevertheless, the F-statistic and Hansen J-test are employed (using 2SLS-
IV) to check instrument relevance and exclusion criterion (results are provided at the end of
all the tables reporting regression estimations).
4. Empirical Results
4.1 Baseline Results
16
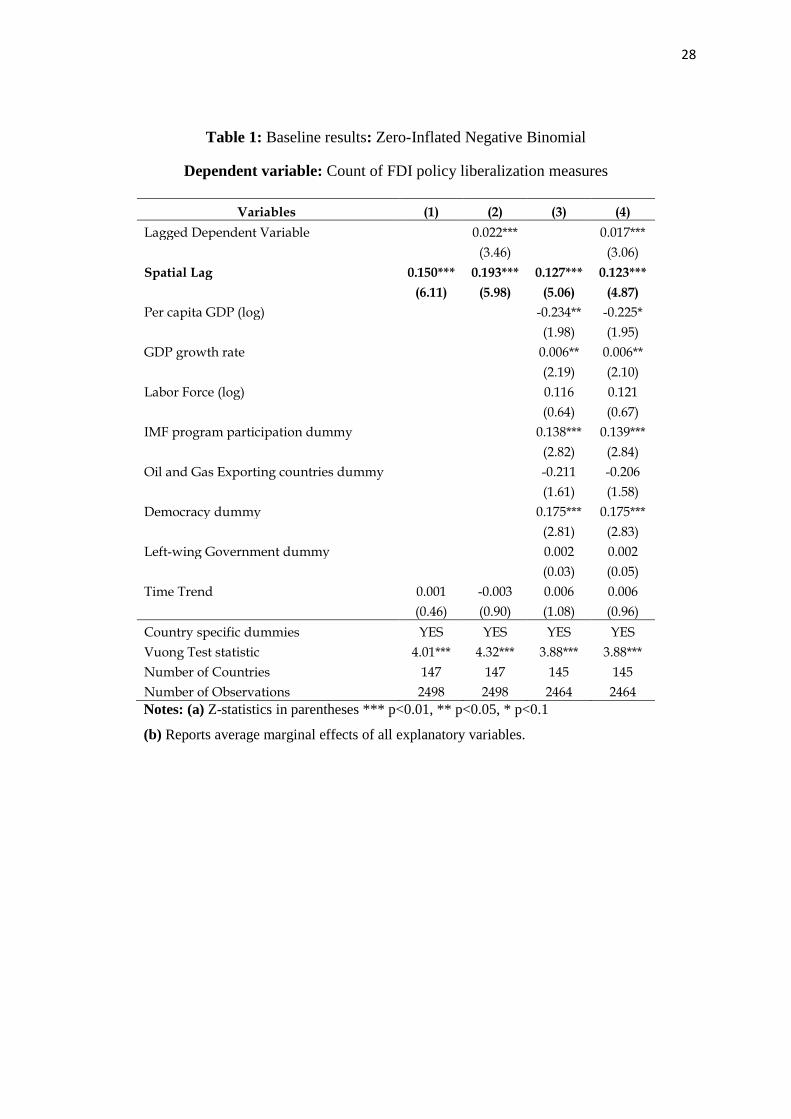
Table 1 presents the baseline results, estimated using zero-inflated negative binomial
regression estimations. Note that the Voung test results always support using zero-inflated
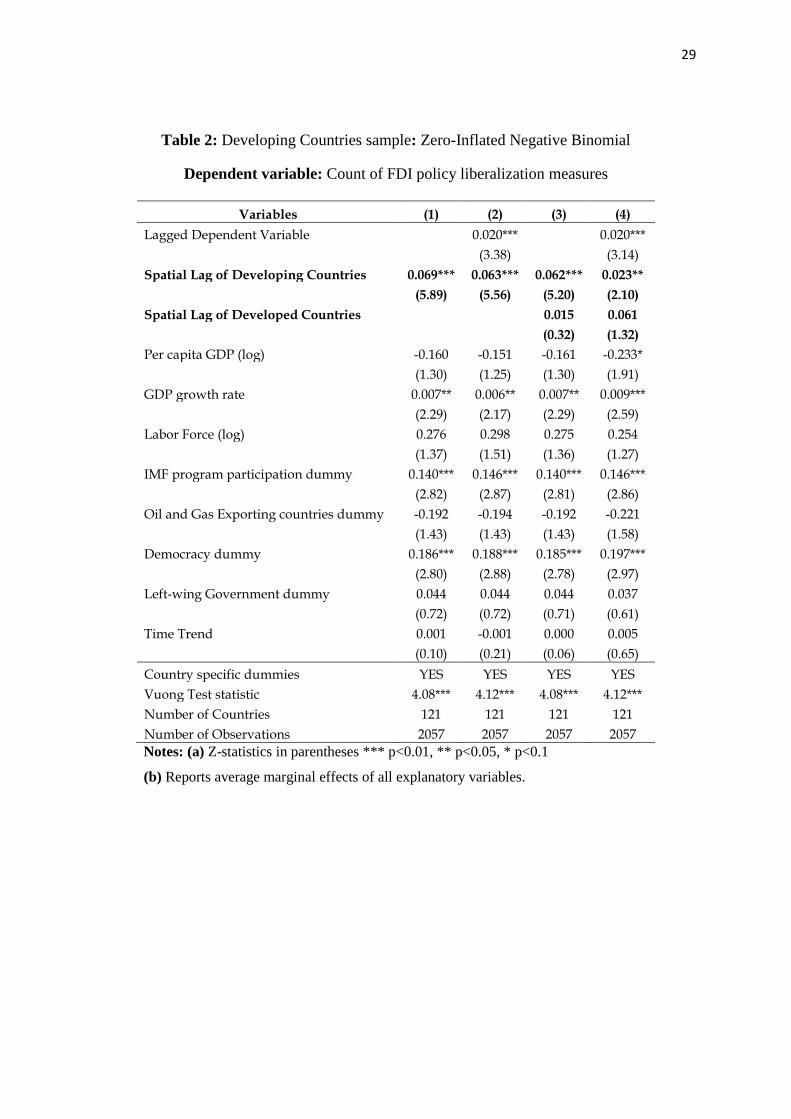
negative binomial regressions over negative binomial estimations. Table 2 focuses
exclusively on the sample of developing countries; table 3 captures the results of the sample
of countries falling below and above the median value of the liberalization of FDI policy.
Table 4 replicates our baseline results for both the full and developing countries sample with
instrumental variable estimations. Note that the results in all tables report marginal effects at
the mean of the explanatory variables4. A summary of the data statistics is presented in
appendix 4. Beginning with column 1 of table 1, which includes only the spatial lag term, the
result is positive and significantly different from zero, at the 1% level. This result remains
consistent when we include a lagged dependent variable in column 2 of table 1. In column 3,
which forms our preferred specification, we add the control variables. As can be seen, we
find a positive spatial lag which is significantly different from zero, at the 1% level. Adding a
lagged dependent variable in column 4 does not change the results of the spatial lag. To
interpret the marginal effects, a single standard deviation increase in the liberalization of FDI
policy in all other countries would increase the FDI policy liberalization measures in country
i by roughly 0.21. These results therefore provide some preliminary evidence that countries
do in fact compete for FDI via liberalization of FDI policy regimes after their competitors
have done so.
4.2 Subsample Results
In table 2, we split the sample by excluding the developed countries5. Note that when
doing this (as well as in all subsamples below in table 3), we recalculate the spatial lag using
only those countries in the subsample, i.e., assigning those outside of the subsample a zero
weight. This then assumes that the subsample of developing countries does not respond to
4 We use Stata 11.0’s margins command to calculate marginal effects.
5 These include: Australia, Austria, Belgium, Canada, France, Germany, Italy, Ireland, Spain, Portugal, Greece,
New Zealand, United States of America, and United Kingdom.
17
changes in the FDI policies of developed countries. As seen in column 1, despite excluding
the developed countries from the sample, the spatial lag term retains its positive sign and
statistical significance, at the 1% level. These results remain consistent with the inclusion of
lagged dependent variable in column 2 of table 2. The substantive effects suggest that a single
standard deviation increase in the liberalization of FDI policy of all other developing
countries would increase the FDI policy liberalization measures in a certain developing
country i by roughly 0.13. What is interesting here, however, is the results reported in
columns 3 and 4 where we test for competition across groups, i.e., between developing and
developed countries. As seen, developing countries seem to only respond to changes in other
developing countries, and not those taking place in developed countries. On the other hand,
changes in FDI policy regimes in the developing world seem to have a strong positive
influence on the FDI policy regime changes in the developing country in question, which is
significantly different from zero, at the 1% level (see column 3). These results remain robust
to the inclusion of a lagged dependent variable in column 4 of table 2. It is also interesting to
note that developing countries are only competing among themselves and not with the
developed world. This might well be due to the fact that developing countries are well aware
that they do not possess factors such as an educated and skilled labor force, property rights
protection, strong institutions, political stability, which would attract big ticket investment
anyway, even without much competition.
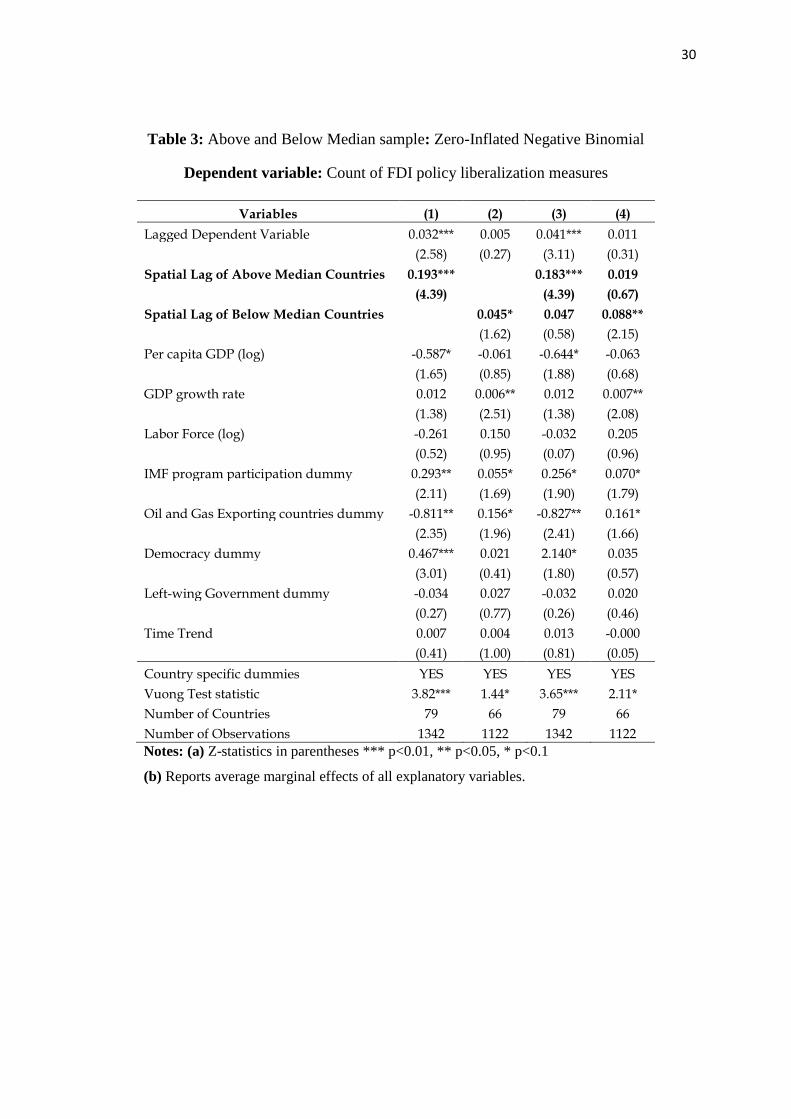
The above results provide evidence of fierce competition between nations, both in the
global sample as well as in the sample of developing countries. In table 3, we explore this
further by separating our sample of countries into two categories: those for which the mean
FDI policy liberalization measure over the sample period was below the median, and those
for which the mean was above the median. We do this to investigate whether the extent of
competition differs between developing nations which are relatively less open, and those
18
which are relatively more open to FDI. Note that as is the case in the sample of developing
countries, we recalculate the spatial lags using within group countries only, implying that
countries below the median do not respond to those above the median, and vice versa. As can
be seen here, we find much stronger evidence of competition among countries which are
relatively more open to FDI, where the marginal effects are somewhat greater than those in
the full sample (see column 1 of table 3). This, combined with a higher number of changes to
the FDI policy regime, suggests that a one standard deviation increase in changes in FDI
policy in countries in the sample above the median, are associated with a change in policy of
0.43 in a given country i above the median. In contrast, we find the effects of the spatial lag
in the sample below the median to be weak, which is statistically significant at the 10% level
only (see column 2 of table 3). It is also noteworthy that the marginal effects of this
subsample are smaller compared to any other subsample group and the global sample
reported in table 1. In columns 3 and 4, we examine the cross-group competition between the
two. Interestingly, we find that both these groups only compete among themselves and not
with each other (see columns 3 and 4). Furthermore, the competition, as it appears from
columns 3 and 4, is much fiercer among countries which are relatively more open to FDI. It is
also noteworthy that if our results were simply capturing an overall trend in the liberalization
of FDI policy, one would expect similar results for the above and below median groups
because their trends are comparable. The fact that we find distinct results suggests that we are
capturing something more than a mere trend in the dependent variable.
Before moving further, we focus on the extent of control variables in tables 1 to 3. As
expected, the rate of growth in GDP is associated with a positive effect on the liberalization
of FDI policy. On the contrary, however, we find a negative impact of GDP per capita
(logged) on the liberalization of FDI policy. This is certainly a surprising result. A plausible
explanation is that during our study period, high income countries had already liberalized
19
their FDI policy regimes, while developing countries were still in the process of doing so. In
table 2, which is our sample of developing countries, we do not find any statistical
significance for GDP per capita. In line with our expectation, we find that the extent to which
a country is operating under an IMF program, the more likely it is to liberalize its FDI policy
regime. In fact, these findings remain robust across all tables. Likewise, we also find the
more democratic governments are associated with liberalizing FDI policy, a result consistent
with the findings of Pandya (2010). The positive and significant effect of democracy on the
liberalization of FDI policy is consistent across all tables. However, we do not find any
support for the mere presence of a labor force and left leaning governments. These results
mostly remain robust when estimating the models using IV estimations in table 4.
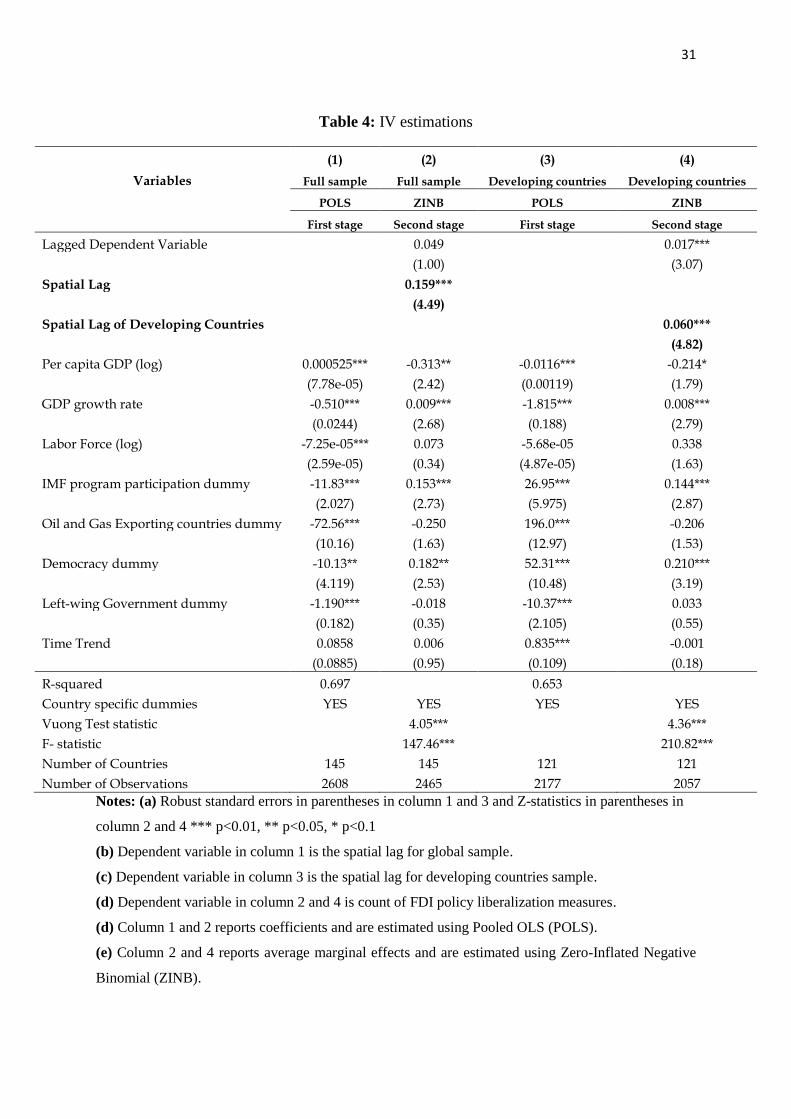
In table 4, we report the results based on zero-inflated negative binomial IV
estimations. Note that columns 1 and 2 represent the global sample, while columns 3 and 4
represent the developing countries sample alone. Columns 1 and 3 capture the results of the
first stage regressions estimated using the pooled OLS method, while columns 2 and 4
capture the second stage regressions using the zero-inflated negative binomial method. As
seen from columns two and four, the positive significant effect of the spatial lag term remains
robust in the IV models. Note that we have already included the lagged dependent variable in
both these models and the spatial lag results still hold. The substantive effects for both the
global and developing countries sample suggest that a one standard deviation increase in the
spatial lag of the IV models is associated with an increase in the liberalization of FDI policy
in country i by roughly 0.11. As highlighted earlier, to examine the validity of the
instruments, we estimate 2SLS-IV models that report the statistics which explore the strength
of the instruments. As can be seen here, the first-stage F-test and Anderson canon LR
statistics report the test statistic used to test the null hypothesis, i.e., the parameter estimate
for the instrument in the first stage regression is equal to zero. Based on Staiger and Stock
20
(1997), we treat F-statistics greater than 10 as being sufficiently strong. In table 4, we find
that in all columns, the F-statistic is always greater than 10, which is significantly different
from zero, at the 1% level.
4.3 Checks on Robustness
We examine the robustness of our main findings in the following ways. First, we use
an alternative weighting approach where we weigh the FDI policy liberalization measure with
the distance between each country, instead of GDP, under the presumption that a country
closer to those countries with higher levels of liberalization in FDI policy are well placed to
compete. We use the distance in kilometers from country i as the weighting scheme, so that
more distant countries are given smaller weights. Hence, we use inverse distance, not
distance, with a weighting as follows: , ,
, ,
, ,
1
1
i j t
i j t
k i i k t
dist
dist
. The baseline results basically
remain unchanged, although the magnitude of the results does vary marginally. When
weighted by distance, we still find that changes in FDI policy which are favorable to FDI in
one country are positively correlated with the liberalization of FDI policy elsewhere.
Likewise, we also replace GDP as a weight with GDP per capita. Here, the results of inter-
country competition to attract FDI remain robust. Second, as an additional test for robustness
we exclude the observations with extreme values. The main results still remain qualitatively
unchanged, suggesting that the results are not driven by extreme values. Third, in a similar
fashion, we also exclude a few countries which might be suspected of driving our results,
such as Argentina, Brazil, China, India, Indonesia, Malaysia, Russia, South Korea, South
Africa and Turkey, i.e., the emerging countries group. Estimating our baseline models
without these countries generate very similar results with respect to the spatial lag, which
remains positive and significant, at the 5% level. In summary, taken together, the results seem
21
to be very robust to sample size, specification, and testing procedure. The results of all of the
robustness checks are not reported due to space considerations, but are available upon
request. Given the robust evidence, we can safely accept the hypothesis of strong inter-
country competition to attract FDI.
5. Conclusion
In this paper, we present the first set of empirical results exploring the possibility of
competition between countries to attract FDI via the liberalization of FDI policy. Using
spatial econometric estimations for a panel data of 148 countries over the 1992–2009 period,
we find that favorable policy changes to the FDI regime in one country are positively
correlated with changes to FDI policy in another. This does not imply that such competition
is universal, however. We also find evidence that low income countries compete among
themselves for investments through the liberalization of FDI policy, and that competition is at
its fiercest among countries which are relatively more open to FDI. We interpret these results
as direct evidence of inter-country strategic interactions in FDI policy. Our results also
suggest several potential considerations for future policy and scope for further research.
Given that changes in FDI policy which are favorable to FDI in one country are positively
correlated with FDI policy in another, local governments should ensure that this competition
is welfare enhancing, leading to a more equitable spatial distribution of investment in host
countries. Secondly, it is important to recognise the fact that the ability of a country to attract
FDI via liberalization of policy is contingent on other factors that attract investment, such as
domestic market size, property rights, and institutional quality, among others. Thus, if a
country attracts more FDI as a result of dramatic liberalization of its FDI policy, our
estimates indicate that this would force others to respond by competing more fiercely in
liberalizing their FDI policy regime to avoid losing potential investment. This suggests that it
may be important to be mindful of the implications of such fierce competition, as it might

22
also result in race to the bottom. We leave this issue to future research, perhaps by usefully
employing the comparative case study method to examine whether fierce competition among
countries to attract FDI is leading to a race to the bottom, or otherwise.
23
References
Ahlquist John S. (2006) Economic Policy, Institutions, and Capital Flows: Portfolio and
Direct Investment Flows in Developing Countries, International Studies Quarterly, 50, 681–
704.
Aitken, B., A.E. Harrison and R. Lipsey (1996) Wages and Foreign Ownership: A
Comparative Study of Mexico, Venezuela, and the United States, Journal of International
Economics, 40, 3/4, 345-371.
Almeida, R. (2007) The Effects of Foreign Owned Firms on the Labor Market, Journal of
International Economics, Vol. 72, Iss. 1, pp. 75-96.
Asiedu, Elizabeth and Donald D. Lien (2004) Capital Controls and Foreign Direct
Investment, World Development, 32(3), 479-490.
Azemar C and Delios A (2008) Tax Competition and FDI: The Special Case of Developing
Countries, Journal of the Japanese and International Economies, 22, 85-108.
Banga, Rashmi (2003) Do Investment Agreements Matter? Journal of Economic Integration,
21, 40-63.
Barro, Robert and X Sala-i-Martin (2004) Economic Growth, Cambridge, MA: MIT Press.
Bartik, T. J., (1993) Who Benefits from Local Job Growth: Migration or the Original
Residents? Regional Studies, 27, 297-312.
Beck, Nathaniel and Jonathan N. Katz, (1995) What To Do (and Not To Do) with Time-
Series Cross-Section Data, American Political Science Review, 89(3), 634-647.
Beck, Thorsten, George Clarke, Alberto Groff, Philip Keefer and Patrick Walsh (2001) New
Tools in Comparative Political Economy: The Database of Political Institutions, World Bank
Economic Review, 15(1), 165-176.
Bhagwati, Jagdish (2004) In Defense of Globalization, Princeton: Princeton University.
Biglaiser,Glen and Karl DeRouen Jr (2007) Following the Flag: Troop Deployment and U.S.
Foreign Direct Investment, International Studies Quarterly, 51, 835–854.
Bjørnskov, Christian and Niklas Potrafke (2011) Politics and privatization in Central and
Eastern Europe: A panel data analysis, Economics of Transition 19 (2), 201-230
Bjørnskov, Christian and Niklas Potrafke (2012) Political ideology and economic freedom
across Canadian provinces, Eastern Economic Journal 38 (2), 143-166
Blomstrom M and Kokko A (2003) The Economics of Foreign Direct Investment Incentives,
NBER Working Paper No. 9489
Blonigen, Bruce A. (2005) A Review of the Empirical Literature on FDI Determinants,
Atlantic Economic Journal, 33(December), 383-403.
24
Boockmann, Bernhard (2006) Partisan Politics and Treaty Ratification: The Acceptance of
International Labour Organization Conventions by Industrialized Democracies, 1960–1996,
European Journal of Political Research, 45(1), 153-180.
Borensztein, E., J. De Gregorio and J-W. Lee (1998) How does Foreign Direct Investment
affect Economic Growth? Journal of International Economics, 45, 115–135.
Bound, J., D. Jaeger, and R. Baker (1995) Problems with Instrumental Variables Estimation
when the Correlation between the Instruments and the Endogenous Explanatory Variable is
Weak, Journal of the American Statistical Association, 90, 443-450.
Brandt, Patrick T., John T Williams, Benjamin O. Fordham and Brian Pollins (2000)
Dynamic Models for Persistent Event Count Time Series, American Journal of Political
Science, 44(4), 823-43.
Cao, Xun (2010) Networks as Channels of Policy Diffusion: Explaining Worldwide Changes
in Capital Taxation, 1998–2006, International Studies Quarterly, 54, 823–854.
Chakrabarti, Avik (2001) The Determinants of Foreign Direct Investment: Sensitivity
Analyses of Cross-Country Regressions, Kyklos, 54(1), 89-113.
Cho, Seo-Young, Axel Dreher and Eric Neumayer (2011) The Spread of Anti-Trafficking
Policies – Evidence from a New Index, Cege Discussion Paper Series No. 119, Georg-
August-University of Goettingen, Germany.
Davies, Ronald B. and Krishna Chaitanya Vadlamannati (2011) A Race to the Bottom in
Labor Standards? An Empirical Investigation, working paper, University of Heidelberg:
Germany.
Davies Ronald B. and Johannes Voget (2008) Tax Competition in an Expanding European
Union, Working paper 0830, Oxford University Centre for Business Taxation.
Davies Ronald B. and Helen T. Naughton (2006) Cooperation in Environmental Policy: A
Spatial Approach, Working paper 2006-18, University of Oregon.
Davies Ronald B., Hartmut Egger and Peter Egger (2003) Tax Competition for International
Producers and the Mode of Foreign Market Entry, Working paper 2006-19, University of
Oregon.
Devereux, Michael P., Ben Lockwood and Michela Redoano (2008) Do Countries Compete
over Corporate Tax Rates? Journal of Public Economics, 92(5-6), 1210-1235.
Dreher Axel, Jan-Egbert Sturm and James Vreeland (2009) Global Horse Trading: IMF loans
for voting in the UN Security Council, European Economic Review, 53, 742-757.
Dunning H. John (1993) Multinational Enterprises and the Global Economy, Wokingham,
England: Addision-Wesley.
25
Dutt, Pushan and Devashish Mitra (2006) Labor versus Capital in Trade Policy: The Role of
Ideology and Inequality, Journal of International Economics 69(2), 310-20.
Fredriksson, Per G., and Daniel L. Millimet (2002) Strategic Interaction and the
Determination of Environmental Policy across US States, Journal of Urban Economics, 51,
101-122.
Gassebner, Martin, Noel Gaston and Micheal Lamla (2011) The Inverse Domino Effect: Are
Economic Reforms Contagious? International Economic Review, 52(1) 183-200.
Greene, W. H. (1994) Accounting for Excess Zeros and Sample Selection in Poisson and
Negative Binomial Regression Models, Technical report.
Girma, S. and H. Görg (2007) Evaluating the foreign ownership wage premium using a
difference-in-differences matching approach, Journal of International Economics, 72, 1, 97-
112.
Haddad, M. and A.E. Harrison (1993) Are there Positive Spillovers from Direct Foreign
Investment? Evidence from Panel data for Morocco, Journal of Development Economics, 41,
51-74.
Haufler A and Wooton I (1998) Country Size and Tax Competition for Foreign Direct
Investment, Journal of Public Economics, 71, 121–139.
Henisz, Witold J., and Edward D. Manfield (2006) Votes and Vetoes: The Political
Determinants of Commercial Openness, International Studies Quarterly, 50, 189–211.
Huttunen, K. (2007) The Effect of Foreign Acquisition on Employment and Wages: Evidence
from Finnish Establishments, Review of Economics and Statistics, 89(3), 497-509.
Jakobsen, Jo and Indra de Soysa (2006) Do Foreign Investors punish Democracy? Theory
and Empirics, 1984-2001, Kyklos, 55(3), 383-410.
King, Gary (1988) Statistical Models for Political Science Event Counts: Bias in
Conventional Procedures and Evidence for the Exponential Poisson Regression Model,
American Journal of Political Science, 32(3), 838-863.
Klemm, Alexander and Stefan van Parys (2009) Empirical Evidence on the Effects of Tax
Incentives, Working Paper WP/09/136, IMF: Washington DC.
Kobrin, Stephen J. (2005) The Determinants of Liberalization of FDI Policy in Developing
Countries: A Cross-Sectional Analysis, 1992-2001, Transnational Corporations, 14(1), 67-
104.
Lambert, D. (1992) Zero-Inflated Poisson Regression Models with an Application to Defects
in Manufacturing, Technometrics, 34, 1–14.
Madies T and Dethier J (2010) Fiscal Competition in Developing Countries: A Survey of the
Theoretical and Empirical Literature, World Bank Policy Research Working Paper No. 5311.
26
Madariaga, Nicole and Sandra Poncet (2007) FDI in Chinese Cities: Spillovers and Impact
on Growth, World Economy, 30, 837-862.
Markusen, Ann and Kate Nesse (2006) Institutional and Political Determinants of Incentive
Competition: Reassessing Causes, Outcomes, Remedies, in Ann Markusen (ed.) Reining in
the Competition for Capital: International Perspectives, Kalamazoo, MI: W. E. Upjohn
Institute for Employment Research.
Markusen, James R., Edward R. Morey and Nancy Olewiler (1995) Competition in Regional
Environmental Policies when Plant Locations are Endogenous, Journal of Public Economics,
56(1), 55-77.
Marshall, Monty G., and Keith Jaggers (2002) Polity IV Project: Dataset Users’ Manual.
College Park: University of Maryland.
Morisset J and Neso O (2002) Administrative Barriers to Foreign Investment in Developing
Countries, World Bank Policy Research Paper 2848.
Murdoch, James C., Todd Sandler, and Wim P. M. Vijverberg (2003) The Participation
Decisions versus the Level of Participation in an Environmental Treaty: A Spatial Probit
Analysis, Journal of Public Economics, 87, 337-362.
Neumayer, Eric and De Soysa, Indra (2011) Globalization and the Empowerment of Women:
An Analysis of Spatial Dependence via Trade and FDI, World development, 39(7), 1065-
1074.
Newman, R. J., and D. H. Sullivan (1988) Econometric Analysis of Business Tax Impacts on
Industrial Location: What Do We Know, and How Do We Know It? Journal of Urban
Economics, 23, 215–34.
Overesch, Michael and Johannes Rincke (2008) Tax Competition in Europe 1980-2007 –
Evidence from Dynamic Panel Data Estimation, Working Paper.
Pandya, Sonal (2011) Democratization and FDI Liberalization, working paper, University of
Virginia.
Pandya, Sonal (2010) Labor Markets and Demand for Foreign Direct Investment,
International Organization 64, 3, 389–409.
Perkins, Richard and Neumayer, Eric (2011) Does the ‘California effect’ Operate Across
Borders?: Trading and Investing-up in Automobile Emission Standards, Journal of European
Public Policy.
Peters A and Fisher P (2004) The Failures of Economic Development Incentives, Journal of
the American Planning Association, 70, 1, 27-37.
Pitlik, Hans (2007) A Race to Liberalization? Diffusion of Economic Policy Reform among
OECD-Economies, Public Choice, 132, 159–178.
27
Potrafke, Niklas (2012) Economic Freedom and Government Ideology Across German
States, Regional Studies.
Phillips J. and T Goss E (1995) The Effects of State and Local Taxes on Economic
Development: A Meta-Analysis, Southern Economic Journal, 62, 197-316.
Raff H and Srinivasan K (1997) Tax Incentives for Import-Substituting Foreign Investment:
Does Signaling Play a Role? Journal of Public Economics, 67, 167–193.
Robertson, Graeme B. and Emmanuel Teitelbaum (2011) Foreign Direct Investment, Regime
Type and Labor Protest in Developing Countries, American Journal of Political Science,
55(3), 665–677
Simmons, BA, Elkins Z, Guzman A. (2006) Competing for Capital: The Diffusion of
Bilateral Investment Treaties, 1960-2000, International Organization, 60(4), 811-846.
Simmons, BA, Elkins Z. (2004) The Globalization of Liberalization: Policy Diffusion in the
International Political Economy, American Political Science Review, 98(1), 171-189.
Staiger, D., and J.H. Stock (1997) Instrumental Variables Regression with Weak Instruments,
Econometrica, 65, 557-586.
Subramanya, Rupa (2011) Economics Journal: Why Did Indian Retailers U-Turn on FDI?
The Wall street Journal: India, Accessed from:
http://blogs.wsj.com/indiarealtime/2011/12/12/economics-journal-why-did-indian-retailers-u-
turn-on-fdi/
The Economist (2011) India's retail reform: No massive rush, The Economist, Accessed
from: http://www.economist.com/blogs/schumpeter/2011/12/indias-retail-reform
Wheeler, David, and Ashoka Mody (1992) International Investment Location Decisions: The
Case of U.S. Firms, Journal of International Economics, 33(1-2), 57-76.
28
Table 1: Baseline results: Zero-Inflated Negative Binomial
Dependent variable: Count of FDI policy liberalization measures
Variables (1) (2) (3) (4)
Lagged Dependent Variable
0.022***
0.017***
(3.46)
(3.06)
Spatial Lag 0.150*** 0.193*** 0.127*** 0.123***
(6.11) (5.98) (5.06) (4.87)
Per capita GDP (log)
-0.234** -0.225*
(1.98) (1.95)
GDP growth rate
0.006** 0.006**
(2.19) (2.10)
Labor Force (log)
0.116 0.121
(0.64) (0.67)
IMF program participation dummy
0.138*** 0.139***
(2.82) (2.84)
Oil and Gas Exporting countries dummy
-0.211 -0.206
(1.61) (1.58)
Democracy dummy
0.175*** 0.175***
(2.81) (2.83)
Left-wing Government dummy
0.002 0.002
(0.03) (0.05)
Time Trend 0.001 -0.003 0.006 0.006
(0.46) (0.90) (1.08) (0.96)
Country specific dummies YES YES YES YES
Vuong Test statistic 4.01*** 4.32*** 3.88*** 3.88***
Number of Countries 147 147 145 145
Number of Observations 2498 2498 2464 2464
Notes: (a) Z-statistics in parentheses *** p<0.01, ** p<0.05, * p<0.1
(b) Reports average marginal effects of all explanatory variables.
29
Table 2: Developing Countries sample: Zero-Inflated Negative Binomial
Dependent variable: Count of FDI policy liberalization measures
Variables (1) (2) (3) (4)
Lagged Dependent Variable 0.020*** 0.020***
(3.38)
(3.14)
Spatial Lag of Developing Countries 0.069*** 0.063*** 0.062*** 0.023**
(5.89) (5.56) (5.20) (2.10)
Spatial Lag of Developed Countries
0.015 0.061
(0.32) (1.32)
Per capita GDP (log) -0.160 -0.151 -0.161 -0.233*
(1.30) (1.25) (1.30) (1.91)
GDP growth rate 0.007** 0.006** 0.007** 0.009***
(2.29) (2.17) (2.29) (2.59)
Labor Force (log) 0.276 0.298 0.275 0.254
(1.37) (1.51) (1.36) (1.27)
IMF program participation dummy 0.140*** 0.146*** 0.140*** 0.146***
(2.82) (2.87) (2.81) (2.86)
Oil and Gas Exporting countries dummy -0.192 -0.194 -0.192 -0.221
(1.43) (1.43) (1.43) (1.58)
Democracy dummy 0.186*** 0.188*** 0.185*** 0.197***
(2.80) (2.88) (2.78) (2.97)
Left-wing Government dummy 0.044 0.044 0.044 0.037
(0.72) (0.72) (0.71) (0.61)
Time Trend 0.001 -0.001 0.000 0.005
(0.10) (0.21) (0.06) (0.65)
Country specific dummies YES YES YES YES
Vuong Test statistic 4.08*** 4.12*** 4.08*** 4.12***
Number of Countries 121 121 121 121
Number of Observations 2057 2057 2057 2057
Notes: (a) Z-statistics in parentheses *** p<0.01, ** p<0.05, * p<0.1
(b) Reports average marginal effects of all explanatory variables.
30
Table 3: Above and Below Median sample: Zero-Inflated Negative Binomial
Dependent variable: Count of FDI policy liberalization measures
Variables (1) (2) (3) (4)
Lagged Dependent Variable 0.032*** 0.005 0.041*** 0.011
(2.58) (0.27) (3.11) (0.31)
Spatial Lag of Above Median Countries 0.193***
0.183*** 0.019
(4.39)
(4.39) (0.67)
Spatial Lag of Below Median Countries
0.045* 0.047 0.088**
(1.62) (0.58) (2.15)
Per capita GDP (log) -0.587* -0.061 -0.644* -0.063
(1.65) (0.85) (1.88) (0.68)
GDP growth rate 0.012 0.006** 0.012 0.007**
(1.38) (2.51) (1.38) (2.08)
Labor Force (log) -0.261 0.150 -0.032 0.205
(0.52) (0.95) (0.07) (0.96)
IMF program participation dummy 0.293** 0.055* 0.256* 0.070*
(2.11) (1.69) (1.90) (1.79)
Oil and Gas Exporting countries dummy -0.811** 0.156* -0.827** 0.161*
(2.35) (1.96) (2.41) (1.66)
Democracy dummy 0.467*** 0.021 2.140* 0.035
(3.01) (0.41) (1.80) (0.57)
Left-wing Government dummy -0.034 0.027 -0.032 0.020
(0.27) (0.77) (0.26) (0.46)
Time Trend 0.007 0.004 0.013 -0.000
(0.41) (1.00) (0.81) (0.05)
Country specific dummies YES YES YES YES
Vuong Test statistic 3.82*** 1.44* 3.65*** 2.11*
Number of Countries 79 66 79 66
Number of Observations 1342 1122 1342 1122
Notes: (a) Z-statistics in parentheses *** p<0.01, ** p<0.05, * p<0.1
(b) Reports average marginal effects of all explanatory variables.
31
Table 4: IV estimations
(1) (2) (3) (4)
Variables Full sample Full sample Developing countries Developing countries
POLS ZINB POLS ZINB
First stage Second stage First stage Second stage
Lagged Dependent Variable 0.049
0.017***
(1.00)
(3.07)
Spatial Lag
0.159***
(4.49)
Spatial Lag of Developing Countries
0.060***
(4.82)
Per capita GDP (log) 0.000525*** -0.313** -0.0116*** -0.214*
(7.78e-05) (2.42) (0.00119) (1.79)
GDP growth rate -0.510*** 0.009*** -1.815*** 0.008***
(0.0244) (2.68) (0.188) (2.79)
Labor Force (log) -7.25e-05*** 0.073 -5.68e-05 0.338
(2.59e-05) (0.34) (4.87e-05) (1.63)
IMF program participation dummy -11.83*** 0.153*** 26.95*** 0.144***
(2.027) (2.73) (5.975) (2.87)
Oil and Gas Exporting countries dummy -72.56*** -0.250 196.0*** -0.206
(10.16) (1.63) (12.97) (1.53)
Democracy dummy -10.13** 0.182** 52.31*** 0.210***
(4.119) (2.53) (10.48) (3.19)
Left-wing Government dummy -1.190*** -0.018 -10.37*** 0.033
(0.182) (0.35) (2.105) (0.55)
Time Trend 0.0858 0.006 0.835*** -0.001
(0.0885) (0.95) (0.109) (0.18)
R-squared 0.697 0.653
Country specific dummies YES YES YES YES
Vuong Test statistic
4.05***
4.36***
F- statistic
147.46***
210.82***
Number of Countries 145 145 121 121
Number of Observations 2608 2465 2177 2057
Notes: (a) Robust standard errors in parentheses in column 1 and 3 and Z-statistics in parentheses in
column 2 and 4 *** p<0.01, ** p<0.05, * p<0.1
(b) Dependent variable in column 1 is the spatial lag for global sample.
(c) Dependent variable in column 3 is the spatial lag for developing countries sample.
(d) Dependent variable in column 2 and 4 is count of FDI policy liberalization measures.
(d) Column 1 and 2 reports coefficients and are estimated using Pooled OLS (POLS).
(e) Column 2 and 4 reports average marginal effects and are estimated using Zero-Inflated Negative
Binomial (ZINB).
32
Figure 1
Figure 2
0.5
11
.5
1992 1993 1994 1995 1996 1997 1998 1999 2000 2001 2002 2003 2004 2005 2006 2007 2008 2009
Evolution of FDI Policy Liberalization over years
Mean of FDI policy liberalization Mean of FDI policy Liberalization of Developing countries
Mean of FDI policy Liberalization of Developed countries
South Asia South East Asia
Latin America and Caribbean Sub Saharan Africa
Middle East and North Africa Developed countries
Post-Soviet Transition Countries
FDI Policy Liberalization by Geographic Regions
33
Appendix
Appendix 1: Countries under study
Albania Denmark Kyrgyzstan Qatar
Algeria Djibouti Lao People's Dem. Rep. Romania
Angola Dominican Republic Latvia Russian Federation
Argentina Estonia Lebanon Rwanda
Armenia Ethiopia Liberia Saudi Arabia
Australia Fiji Libyan Arab Jamahiriya Senegal
Austria Finland Lithuania Sierra Leone
Azerbaijan France Macedonia Singapore
Bahrain Gabon Madagascar Slovakia
Bangladesh Gambia Malawi Slovenia
Barbados Georgia Malaysia South Africa
Belarus Germany Mali Spain
Belgium Ghana Mauritania Sri Lanka
Benin Greece Mauritius Sudan
Bolivia Guatemala Mexico Sweden
Botswana Guinea Moldova Switzerland
Brazil Guyana Mongolia Syria
Brunei Darussalam Honduras Morocco Taiwan
Bulgaria Ecuador Mozambique Tajikistan
Burkina Faso Egypt Myanmar Tanzania
Burundi El Salvador Namibia Thailand
Cambodia Equatorial Guinea Nepal Tunisia
Cameroon Eritrea Netherlands Turkey
Canada Hungary New Zealand Turkmenistan
Central African Republic India Nicaragua Uganda
Chile Indonesia Niger Ukraine
China Iran Nigeria United Arab Emirates
Colombia Ireland Norway United Kingdom
Comoros Israel Oman United States
Congo Republic Italy Pakistan Uruguay
Congo, Democratic Republic Jamaica Panama Uzbekistan
Costa Rica Japan Papua New Guinea Venezuela
Croatia Jordan Paraguay Vietnam
Cuba Kazakhstan Peru Yemen
Cyprus Kenya Philippines Zambia
Czech Republic Korea, Republic of Poland Zimbabwe
Côte d' Ivoire Kuwait Portugal
34
Appendix 2: Categories under FDI policy Liberalization
FDI liberalization categories
Definition
Approval procedures
Relaxing, lifting, simplifying, and streamlining the procedure for approval of
FDI into the host country.
Sectoral restrictions
Liberalizing the restrictions placed on foreign investors with respect to entry in
different sectors namely, manufacturing, agro-based industries, natural
resource sectors, and services (including market access restrictions).
Operational conditions
Deals with post-entry phase of investment. Includes: relaxing, lifting, removal
of performance requirements by foreign investors; fair and equitable treatment
of foreign investors, relaxing restrictions on the employment of foreign
personnel; easing restrictions on imports of capital goods, spare parts and
manufacturing inputs.
Incentives
Incentives provided to foreign investors include, fiscal incentives such as:
reduction of taxes on income or profit and exemptions from payments of
import duties on capital goods; financial incentives include: direct grants,
subsidized credits and credit guarantees and government equity participation.
Regulatory incentives comprise: relaxation of environmental, health, safety or
social standards) and other non-financial incentives consists of subsidized
services, the granting of market privileges through import protection or
preferential government procurement contracts.
Investment guarantees
Guarantees provided by host country governments to foreign investors with
respect to protection of intellectual property rights, laws, dispute settlement,
ownership and other interests. It also includes providing clauses of guarantees
to repatriate capital, dividends, profits and royalties
Foreign exchange Relaxing various controls and laws over foreign exchange.
Corporate regulations Liberalizing investment norms related to financial markets, stock exchange.
Source: http://www.sice.oas.org/Glossary/iteiit20042_e.pdf
35
Appendix 3: Data Sources
Variables Definition Data Sources
FDI policy Liberalization
Total Number of changes in FDI laws and regulations in eight categories namely, Foreign ownership, Approval procedures, Sectoral restrictions, Operational conditions, Incentives, Guarantees or protections, Foreign exchange, and Corporate regulations
UNCTAD 2011
Per capita GDP (log) Per capita GDP (logged) in US$ 2000 constant prices.
Economic Research Service (ERS), Washington DC
GDP growth rate Rate of growth of per capita GDP Economic Research Service (ERS), Washington DC
Total Labor Force (log) Total labor force active (logged) UNCTAD 2011
IMF program participation Dummy capturing whether a country was under IMF’s Structural Adjustment Program or not Dreher (2006)
Oil exporting countries
Dummy coded the value 1 if a country’s oil exports are 1/3rd of their GDP and 0otherwise.
Fearon and Laitin (2003) augmented with fuel export data from the World Bank (2008).
Democracy Dummy coded the value 1 if the Polity IV index is above +6 and 0 otherwise.
Marshall and Jaggers (2002) polity IV index
Left wing governments Incumbent government’s ideology takes the value 1 if the left leaning party is in government and 0 otherwise.
DPI (Database of Political Institutions dataset developed by Keefer 2001).
Appendix 4: Descriptive Statistics
Variables Mean Standard Deviation Minimum Maximum Observations
FDI policy Liberalization 0.877 1.738 0.000 41.000 2646
Spatial Lag 1.296 0.663 0.423 3.836 2498
Spatial Lag of Developing Countries 2.955 1.875 0.984 8.975 2498
Spatial Lag of Developed Countries 0.755 0.396 0.127 1.934 2498
Per capita GDP (log) 7.876 1.658 4.308 11.116 2645
GDP growth rate 3.800 6.601 -48.812 106.280 2646
Total Labor Force (log) 8.396 1.566 4.171 13.582 2645
IMF program participation dummy 0.118 0.322 0.000 1.000 2646
OIL exporting countries dummy 0.220 0.415 0.000 1.000 2646
Democracy dummy 0.457 0.498 0.000 1.000 2608
Left wing governments dummy 0.294 0.456 0.000 1.000 2645