Embed Size (px)
Citation preview
What drivesyou mad, drives us…Germs, infectious diseases, pests, poor hygiene, dirty water.
Sustainability Report 2004
…to deliver better solutionsOur vision is to deliver better solutions in household cleaning and in health andpersonal care. In pursuing that vision we improve people’s lives. Our productsimprove hygiene and health – cleaning, disinfecting, controlling pests, preventinginfection – and we work relentlessly to make them even better. Our employmentprovides a safe and secure workplace for our people. Our success creates wealthenriching the lives of employees, suppliers, shareholders and society at large.
We’re committed to improving lives today at even less cost to the future. We’re intent on pursuing our vision sustainably and responsibly, by reducing the environmental cost of what we do and recognising our responsibilities tosociety in the way we do business. How are we doing this? Read on…
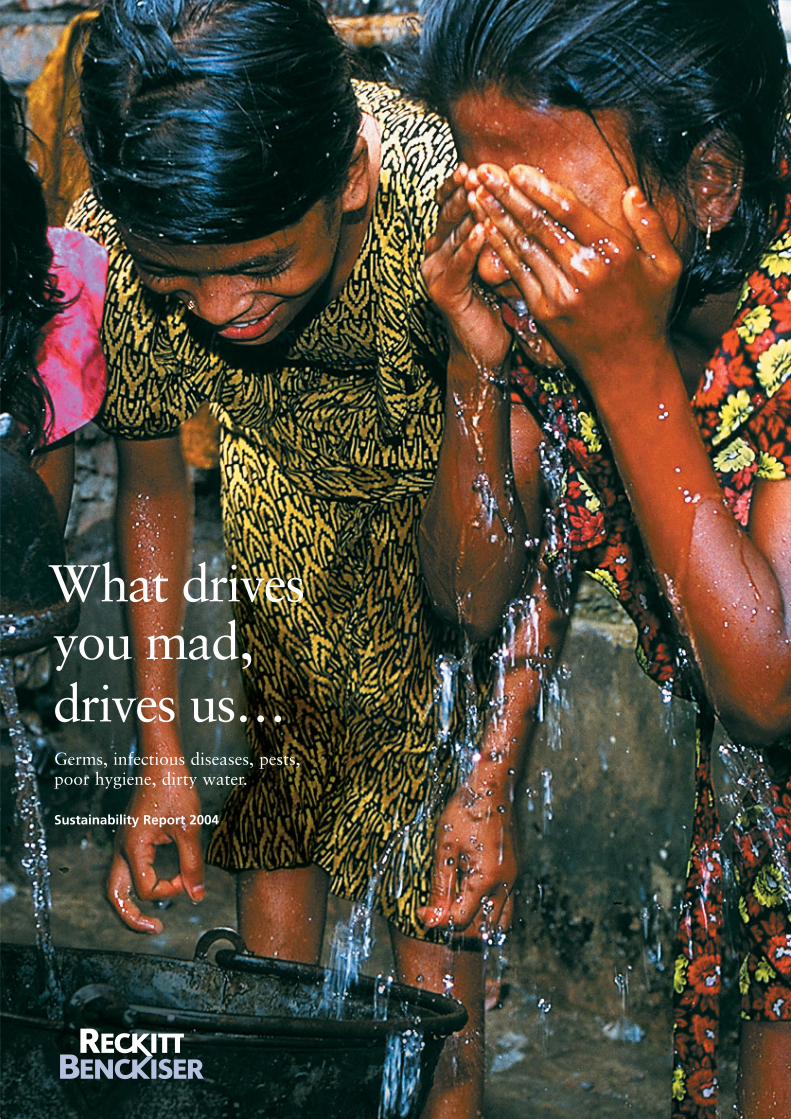
The story behind the cover photograph
In June 2004 Bangladesh was struck by extensive floods. More
than 33 million people were affected and two-thirds of the
country was submerged. Additional heavy rainfall in September
2004 made the continuation of relief efforts imperative.
Reckitt Benckiser’s support enabled Save the Children to
continue working at 20 severely hit slums around the capital
Dhaka and the neighbouring city of Narayangonj.
The projects focussed on:
• provision of safe water, hygienic latrines and mosquito control
• medical care for flood related diseases
whilst also helping with disease prevention via health education.
www.savethechildren.net
Contents
01 CEO’s statement
Our primary purpose
02 Better solutions improve lives
04 The wealth we create improves lives
Sustainability
05 Making us more sustainable
06 Reducing emissions from our facilities
07 Reducing our use of materials and resources
08 Reducing the impact of our supply chain
09 Reducing the impact of our products
Responsibility
10 Safe products, quality products
11 Improving our social performance at work
13 Community – investing where it’s most needed
Further information
14 How we ensure we act sustainably and responsibly
15 Stakeholders and external benchmarking
16 Measuring our actual environmental impact
17 Basis of reporting
18 Glossary and contact details
19 Independent assurance statement
Reckitt Benckiser Sustainability Report 2004 1
Body text
Our business and our passionWe’re passionate about deliveringbetter solutions to consumers in theareas of household cleaning and in health and personal care. We alsobelieve that our business has a muchbigger social role than this – ourproducts improve people’s lives andthe wealth we generate benefits society.
Every day our products touch millionsof lives. A family or school in Americathat uses Lysol disinfectant to killgerms is helping to prevent infection,giving children fewer days off school.A household in India that cleans withDettol improves hygiene, reducesdisease and increases quality of life.Mortein pest control products allowan uninterrupted night’s sleep andguard against diseases borne bymosquitoes. Dishes cleaned withFinish, Calgonit or Electrasol are more hygienic. Lavatories treated withHarpic or Lysol are cleaner and saferfor all the family. Suboxone andSubutex help to treat drug addiction.
Our sense of purpose in deliveringbetter hygiene and health solutions to consumers lies at the heart of whatwe do. We understand that our businesswill only be sustainable if we improvethe lives of all involved.
That extends to nearly 20,000 peopleworldwide who work for ReckittBenckiser, sharing in the wealth thatthe business creates. In 2004 thatmeant £416 million in remuneration.
To our shareholders in 2004 it meant£499 million in cash paid out individends and share buy backs, and
an increase in the value of theenterprise of over £2 billion.
To society as a whole, it meant £266 million paid in tax and socialsecurity, £2.4 billion paid to supplierssustaining other businesses andemployment, and £1 million putstraight back into society where it ismost needed through our communityinvolvement programs.
Sustainability and responsibilityWe do recognise that our business has side effects that may not be sopositive. Our commitment is to makeour business more sustainable andresponsible. By this we mean abusiness that operates effectively todaywith as little environmental, social andethical cost to the future as possible.
PrioritiesWe have clear priorities in oursustainability and responsibilitystrategy, focusing on those areas wherewe can have most impact on the mostserious issues.
1 Environmental sustainability• Climate change To date our focus
has been on reducing the globalwarming emissions from our energyuse in product manufacturing; since2000, we have reduced our globalwarming emissions by 11% per unitof production
• Waste reduction and recycling Since2000 we have reduced our totalwaste by 21% and hazardous wasteby 40%, per unit of production. In 2004 we launched a three-partproject to encourage plasticpackaging recycling internationally
2 Social and ethical responsibility • Health & safety of employees
Our incident rate of lost workingday accidents has decreased by 70%since 2001
• Responsibility in our supply chainResponsible behaviour in our supplychain can have a multiplier effect interms of improving responsibility
(and sustainability) performance. In 2004 we launched a GlobalManufacturing Standard (GMS),clearly defining supply chainrequirements in terms of workingconditions, health & safety andenvironmental management
• Community involvement We focusour community involvement towardsthose whom our products would not normally touch, addressinghealth and hygiene and HIV/Aids
The futureGlobal issues such as climate change,sustainable resources and HIV/Aidsthreaten whole societies. We areworking intensively today to see where we can do more as a business to make a positive contribution. We expect to be launching some majorinitiatives in the next 12 months.
Our aims for 2005 and the next fewyears include:
• expand our work on climate change in terms of consumers’ use of our products and our owndirect impacts
• increase the potential for consumer recycling of our own (and others’) plastic packaging
• continuing improvements in employees health and safety
• further encourage and ensure socialand environmental responsibility inour supply chain
• providing more support to thosewho do not generally benefit fromour products
That is our sustainability commitment.I hope that all readers of this reportwill seek to contribute to what is botha challenge and an opportunity.
Bart BechtChief Executive OfficerReckitt Benckiser plc
INTRODUCTION
Sustainable growth – A statement from our CEOReckitt Benckiser improves people’s lives through better hygiene and health. Our sustainability commitment is to do this with even less cost to the future.
2 Reckitt Benckiser Sustainability Report 2004
Better hygiene leads to better healthwhich means improved lives.
Our product portfolio contributes to improving lives in the 180 countrieswhere we sell those products today.Our focus on household cleaning,where we are the world’s number one company (excluding laundrydetergents), and on health and personalcare, where we are a major player inantiseptics, disinfectants and in overthe counter medicines, means that wemake a major contribution to hygieneand health in the world.
Our product categoriesSurface Care (20% of net revenues).We are world number one in surfacecleaning thanks to our leadership indisinfectant cleaners with brands Lysoland Dettol and in lavatory cleanerswith Harpic and Lysol. We also have a major position in multipurposecleaning thanks in part due to CillitBang and Easy-Off Bang, newlyintroduced power cleaners.
Fabric Care (28% of net revenues).We are number one worldwide infabric treatment with Vanish andSpray’nWash, and in water softenerswith Calgon. We are major players infine fabric detergent with the worldnumber one brand Woolite.
Dishwashing (14% of net revenues).We are world number one inautomatic dishwashing products withFinish and Calgonit in Europe andDeveloping Markets, and Electrasoland Jet Dry in North America.
Home Care (15% of net revenues).We are number two worldwide in air care, with Airwick, and in PestControl, with Mortein and dCon.
Health & Personal Care (15% of netrevenues). We are world number one in antiseptics with Dettol personal carerange, and in Depilatories with Veet.
Our healthcare portfolio includesmarket leading brands such as:
• Gaviscon, which treats heartburnand indigestion including animportant role in the treatment of gastric reflux in young babies
• Lemsip, the market leader in coldand flu treatments in the UK
• Suboxone and Subutex, leaders in the treatment of opiate addiction
Food (6% of net revenues). French’s is North America’s favourite yellowmustard. Frank’s Red Hot andCattleman’s BBQ are also leadingNorth American brands.
So how in practice does this portfoliocontribute to improving lives?
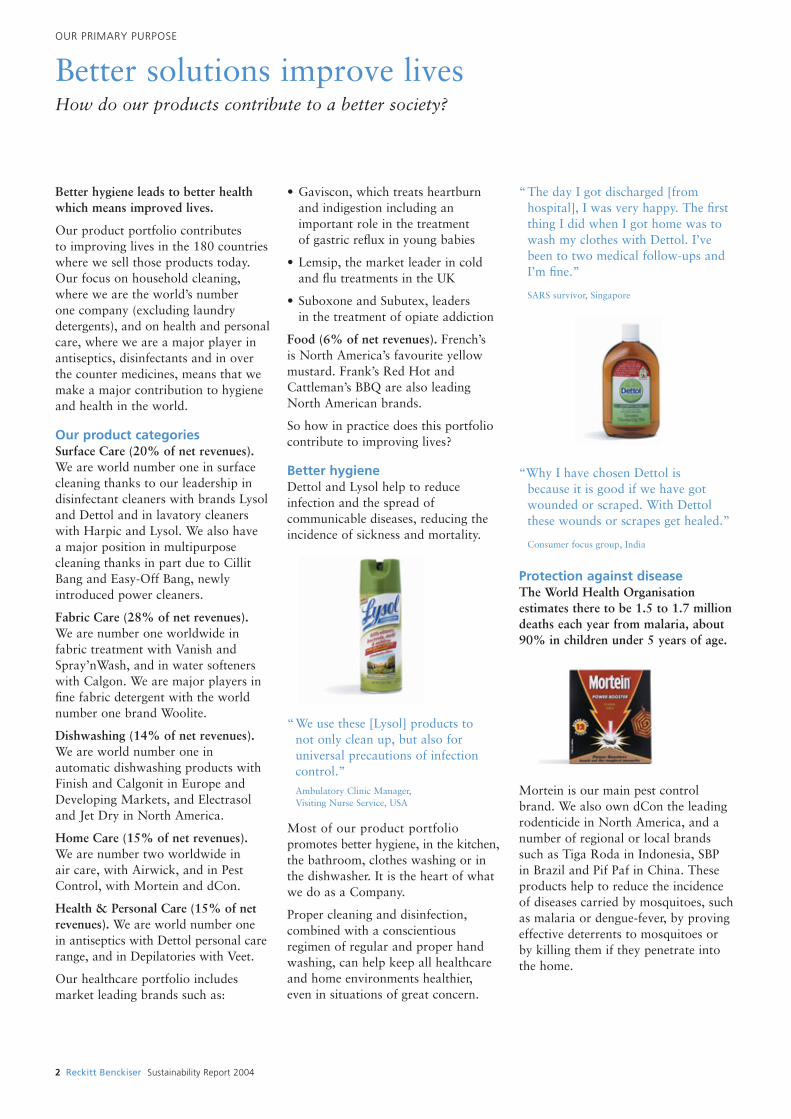
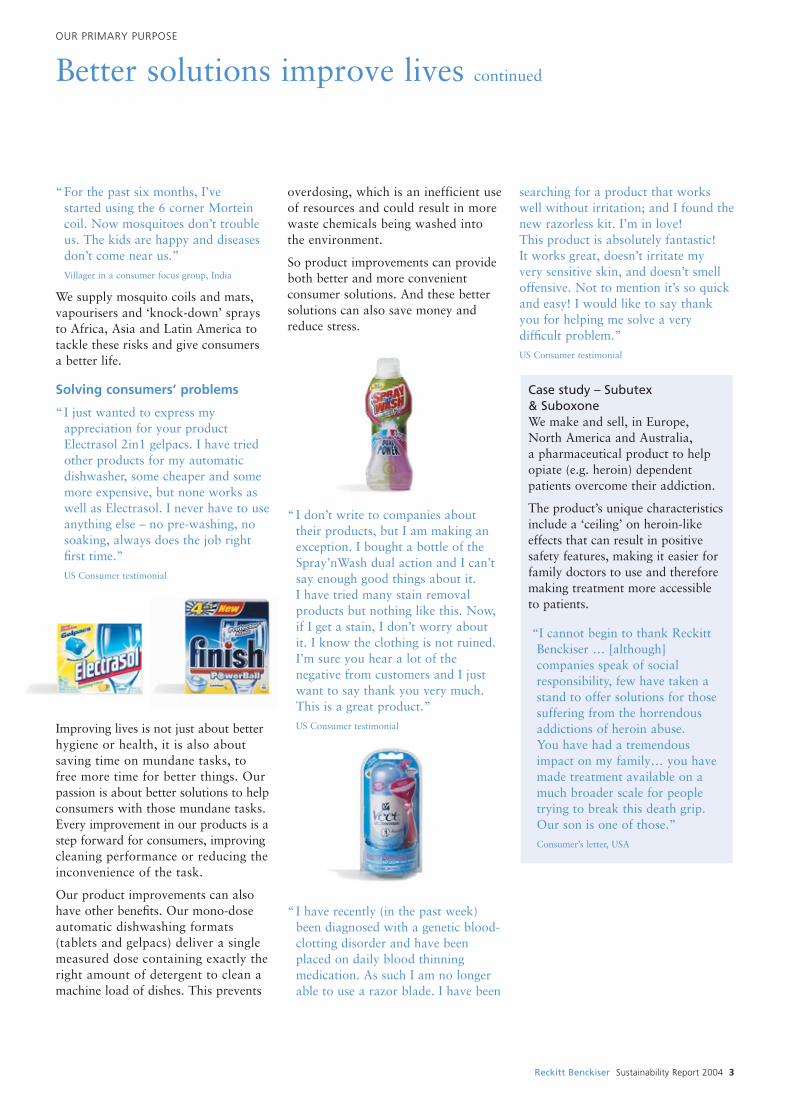
Better hygieneDettol and Lysol help to reduceinfection and the spread ofcommunicable diseases, reducing theincidence of sickness and mortality.
“We use these [Lysol] products to not only clean up, but also foruniversal precautions of infectioncontrol.”
Ambulatory Clinic Manager, Visiting Nurse Service, USA
Most of our product portfoliopromotes better hygiene, in the kitchen,the bathroom, clothes washing or inthe dishwasher. It is the heart of whatwe do as a Company.
Proper cleaning and disinfection,combined with a conscientiousregimen of regular and proper handwashing, can help keep all healthcareand home environments healthier, even in situations of great concern.
“The day I got discharged [from hospital], I was very happy. The firstthing I did when I got home was towash my clothes with Dettol. I’vebeen to two medical follow-ups andI’m fine.”
SARS survivor, Singapore
“Why I have chosen Dettol is because it is good if we have gotwounded or scraped. With Dettolthese wounds or scrapes get healed.”
Consumer focus group, India
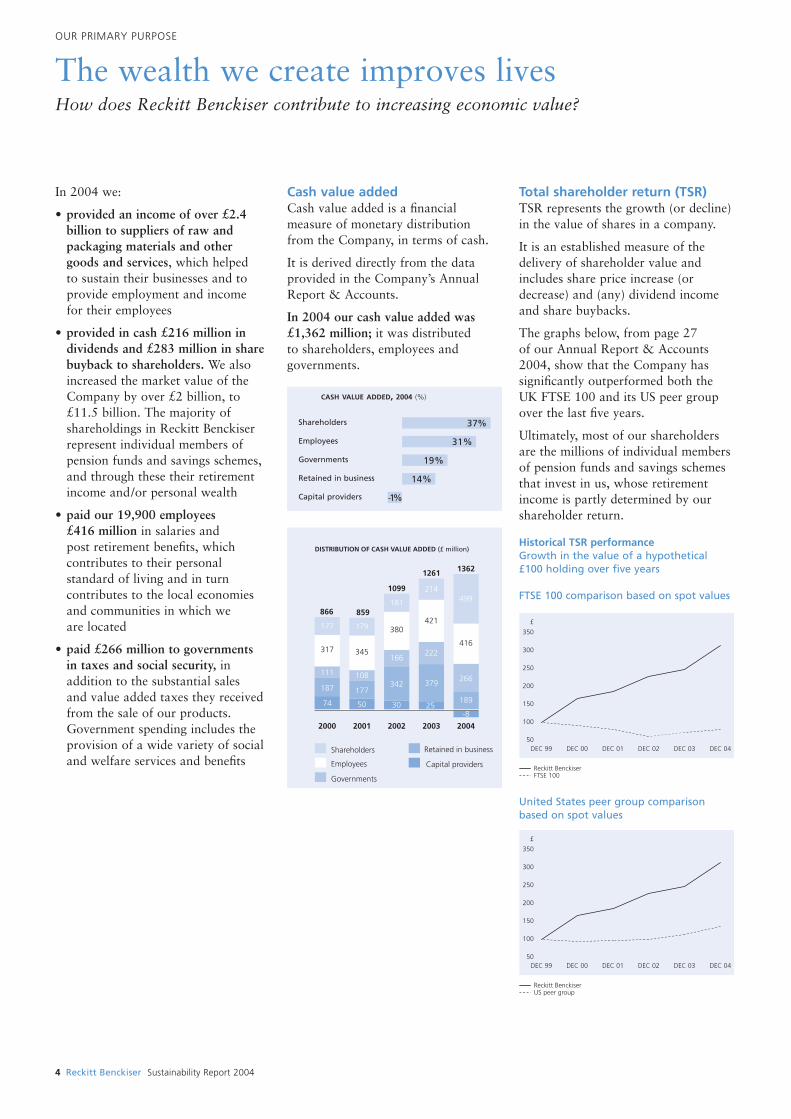
Protection against diseaseThe World Health Organisationestimates there to be 1.5 to 1.7 milliondeaths each year from malaria, about90% in children under 5 years of age.
Mortein is our main pest controlbrand. We also own dCon the leadingrodenticide in North America, and anumber of regional or local brandssuch as Tiga Roda in Indonesia, SBP in Brazil and Pif Paf in China. Theseproducts help to reduce the incidenceof diseases carried by mosquitoes, such as malaria or dengue-fever, by provingeffective deterrents to mosquitoes orby killing them if they penetrate intothe home.
OUR PRIMARY PURPOSE
Better solutions improve lives How do our products contribute to a better society?
Reckitt Benckiser Sustainability Report 2004 3
“For the past six months, I’ve started using the 6 corner Morteincoil. Now mosquitoes don’t troubleus. The kids are happy and diseasesdon’t come near us.”
Villager in a consumer focus group, India
We supply mosquito coils and mats,vapourisers and ‘knock-down’ spraysto Africa, Asia and Latin America totackle these risks and give consumers a better life.
Solving consumers’ problems
“I just wanted to express my appreciation for your productElectrasol 2in1 gelpacs. I have triedother products for my automaticdishwasher, some cheaper and somemore expensive, but none works aswell as Electrasol. I never have to useanything else – no pre-washing, nosoaking, always does the job rightfirst time.”
US Consumer testimonial
Improving lives is not just about betterhygiene or health, it is also aboutsaving time on mundane tasks, to free more time for better things. Ourpassion is about better solutions to helpconsumers with those mundane tasks.Every improvement in our products is astep forward for consumers, improvingcleaning performance or reducing theinconvenience of the task.
Our product improvements can alsohave other benefits. Our mono-doseautomatic dishwashing formats(tablets and gelpacs) deliver a singlemeasured dose containing exactly theright amount of detergent to clean amachine load of dishes. This prevents
overdosing, which is an inefficient useof resources and could result in morewaste chemicals being washed intothe environment.
So product improvements can provideboth better and more convenientconsumer solutions. And these bettersolutions can also save money andreduce stress.
“I don’t write to companies about their products, but I am making anexception. I bought a bottle of theSpray’nWash dual action and I can’tsay enough good things about it. I have tried many stain removalproducts but nothing like this. Now,if I get a stain, I don’t worry aboutit. I know the clothing is not ruined.I’m sure you hear a lot of thenegative from customers and I justwant to say thank you very much.This is a great product.”
US Consumer testimonial
“ I have recently (in the past week) been diagnosed with a genetic blood-clotting disorder and have beenplaced on daily blood thinningmedication. As such I am no longerable to use a razor blade. I have been
searching for a product that workswell without irritation; and I found thenew razorless kit. I’m in love! This product is absolutely fantastic! It works great, doesn’t irritate my very sensitive skin, and doesn’t smelloffensive. Not to mention it’s so quickand easy! I would like to say thankyou for helping me solve a verydifficult problem.”
US Consumer testimonial
US Consumer testimonialCase study – Subutex & SuboxoneWe make and sell, in Europe, North America and Australia, a pharmaceutical product to helpopiate (e.g. heroin) dependentpatients overcome their addiction.
The product’s unique characteristicsinclude a ‘ceiling’ on heroin-likeeffects that can result in positivesafety features, making it easier forfamily doctors to use and thereforemaking treatment more accessibleto patients.
“I cannot begin to thank Reckitt Benckiser … [although]companies speak of socialresponsibility, few have taken astand to offer solutions for thosesuffering from the horrendousaddictions of heroin abuse. You have had a tremendousimpact on my family… you havemade treatment available on amuch broader scale for peopletrying to break this death grip.Our son is one of those.”
Consumer’s letter, USA
OUR PRIMARY PURPOSE
Better solutions improve lives continued
4 Reckitt Benckiser Sustainability Report 2004
In 2004 we:
• provided an income of over £2.4billion to suppliers of raw andpackaging materials and other goods and services, which helped to sustain their businesses and toprovide employment and income for their employees
• provided in cash £216 million individends and £283 million in sharebuyback to shareholders. We alsoincreased the market value of theCompany by over £2 billion, to£11.5 billion. The majority ofshareholdings in Reckitt Benckiserrepresent individual members ofpension funds and savings schemes,and through these their retirementincome and/or personal wealth
• paid our 19,900 employees £416 million in salaries and post retirement benefits, whichcontributes to their personalstandard of living and in turncontributes to the local economiesand communities in which we are located
• paid £266 million to governments in taxes and social security, inaddition to the substantial sales and value added taxes they receivedfrom the sale of our products.Government spending includes theprovision of a wide variety of socialand welfare services and benefits
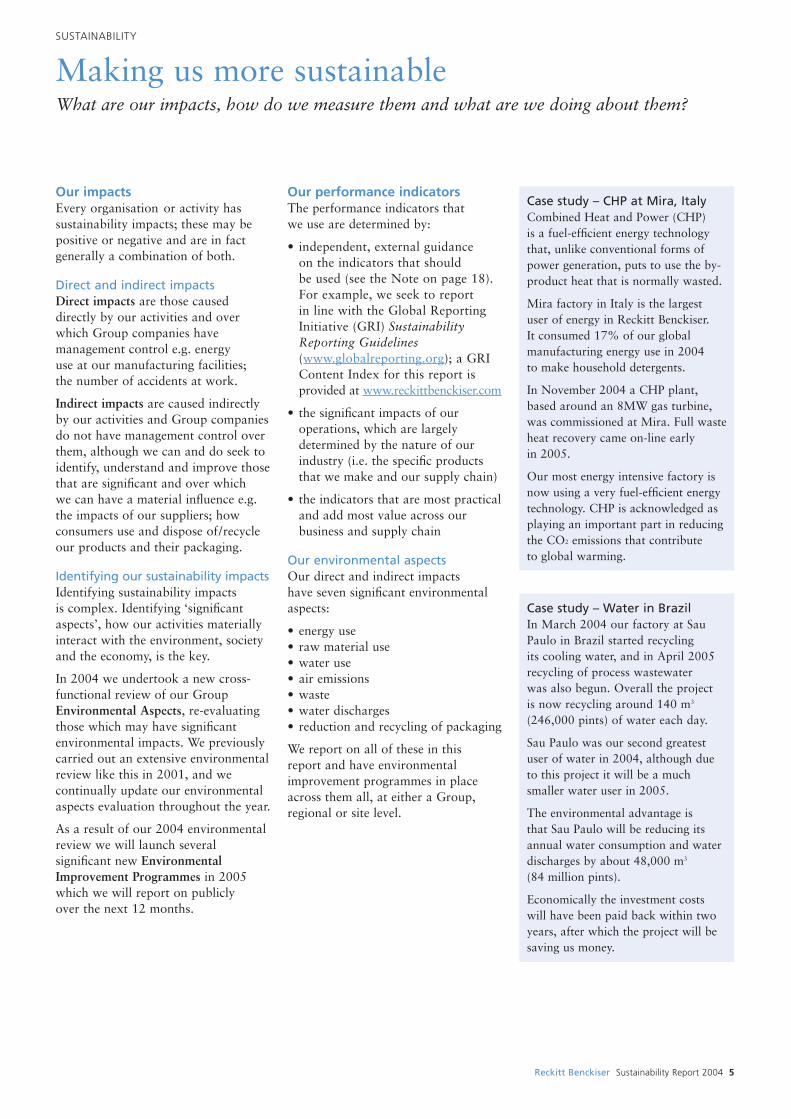
Cash value addedCash value added is a financialmeasure of monetary distribution from the Company, in terms of cash.
It is derived directly from the dataprovided in the Company’s AnnualReport & Accounts.
In 2004 our cash value added was£1,362 million; it was distributed to shareholders, employees andgovernments.
Total shareholder return (TSR)TSR represents the growth (or decline)in the value of shares in a company.
It is an established measure of thedelivery of shareholder value andincludes share price increase (ordecrease) and (any) dividend incomeand share buybacks.
The graphs below, from page 27 of our Annual Report & Accounts 2004, show that the Company hassignificantly outperformed both theUK FTSE 100 and its US peer groupover the last five years.
Ultimately, most of our shareholdersare the millions of individual membersof pension funds and savings schemesthat invest in us, whose retirementincome is partly determined by ourshareholder return.
Historical TSR performanceGrowth in the value of a hypothetical£100 holding over five years
FTSE 100 comparison based on spot values
United States peer group comparisonbased on spot values
OUR PRIMARY PURPOSE
The wealth we create improves livesHow does Reckitt Benckiser contribute to increasing economic value?
Shareholders
Employees
Governments
Retained in business
Capital providers
14%
19%
31%
37%
CASH VALUE ADDED, 2004 (%)
-1%
866
317
111
187
74
2000
Shareholders
Employees
Retained in business
DISTRIBUTION OF CASH VALUE ADDED (£ million)
Capital providers
Governments
859
345
179
108
177
50
2001
1099
380
181
166
342
30
2002
1362
416
499
266
189
1261
421
214
222
379
2003
25
2004
-8
177
50
100
150
200
250
300
350
DEC 04DEC 03DEC 02DEC 01DEC 00DEC 99
Reckitt BenckiserFTSE 100
£
50
100
150
200
250
300
350
DEC 04DEC 03DEC 02DEC 01DEC 00DEC 99
Reckitt BenckiserUS peer group
£
Reckitt Benckiser Sustainability Report 2004 5
Our impactsEvery organisation or activity hassustainability impacts; these may bepositive or negative and are in factgenerally a combination of both.
Direct and indirect impactsDirect impacts are those causeddirectly by our activities and overwhich Group companies havemanagement control e.g. energy use at our manufacturing facilities; the number of accidents at work.
Indirect impacts are caused indirectlyby our activities and Group companiesdo not have management control overthem, although we can and do seek toidentify, understand and improve thosethat are significant and over which we can have a material influence e.g. the impacts of our suppliers; howconsumers use and dispose of/recycleour products and their packaging.
Identifying our sustainability impactsIdentifying sustainability impacts is complex. Identifying ‘significantaspects’, how our activities materiallyinteract with the environment, societyand the economy, is the key.
In 2004 we undertook a new cross-functional review of our GroupEnvironmental Aspects, re-evaluatingthose which may have significantenvironmental impacts. We previouslycarried out an extensive environmentalreview like this in 2001, and wecontinually update our environmentalaspects evaluation throughout the year.
As a result of our 2004 environmentalreview we will launch severalsignificant new EnvironmentalImprovement Programmes in 2005which we will report on publicly over the next 12 months.
Our performance indicatorsThe performance indicators that we use are determined by:
• independent, external guidance on the indicators that should be used (see the Note on page 18). For example, we seek to report in line with the Global ReportingInitiative (GRI) SustainabilityReporting Guidelines(www.globalreporting.org); a GRIContent Index for this report isprovided at www.reckittbenckiser.com
• the significant impacts of ouroperations, which are largelydetermined by the nature of ourindustry (i.e. the specific productsthat we make and our supply chain)
• the indicators that are most practicaland add most value across ourbusiness and supply chain
Our environmental aspects Our direct and indirect impacts have seven significant environmentalaspects:
• energy use• raw material use• water use• air emissions• waste• water discharges• reduction and recycling of packaging
We report on all of these in this report and have environmentalimprovement programmes in placeacross them all, at either a Group,regional or site level.
SUSTAINABILITY
Making us more sustainableWhat are our impacts, how do we measure them and what are we doing about them?
Case study – CHP at Mira, ItalyCombined Heat and Power (CHP) is a fuel-efficient energy technologythat, unlike conventional forms ofpower generation, puts to use the by-product heat that is normally wasted.
Mira factory in Italy is the largestuser of energy in Reckitt Benckiser. It consumed 17% of our globalmanufacturing energy use in 2004 to make household detergents.
In November 2004 a CHP plant,based around an 8MW gas turbine,was commissioned at Mira. Full wasteheat recovery came on-line early in 2005.
Our most energy intensive factory isnow using a very fuel-efficient energytechnology. CHP is acknowledged asplaying an important part in reducingthe CO2 emissions that contribute to global warming.
Case study – Water in BrazilIn March 2004 our factory at SauPaulo in Brazil started recycling its cooling water, and in April 2005recycling of process wastewater was also begun. Overall the project is now recycling around 140 m3
(246,000 pints) of water each day.
Sau Paulo was our second greatestuser of water in 2004, although due to this project it will be a muchsmaller water user in 2005.
The environmental advantage is that Sau Paulo will be reducing itsannual water consumption and waterdischarges by about 48,000 m3
(84 million pints).
Economically the investment costswill have been paid back within twoyears, after which the project will besaving us money.
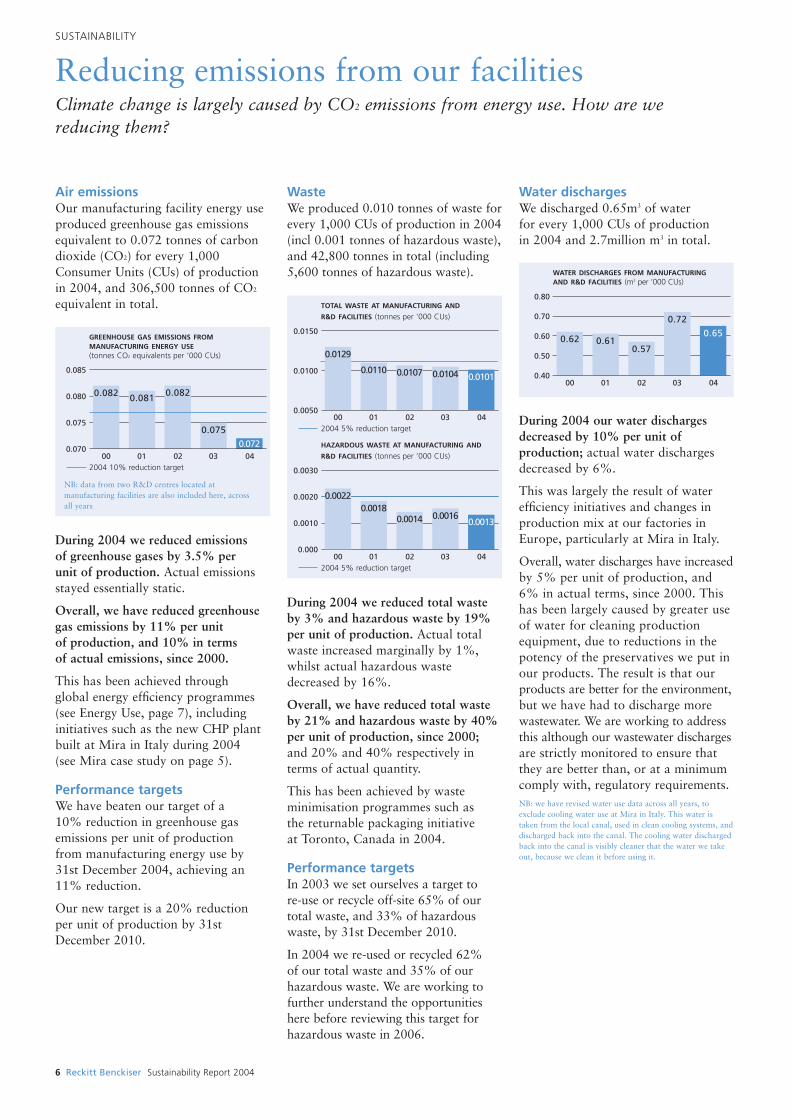
Air emissionsOur manufacturing facility energy useproduced greenhouse gas emissionsequivalent to 0.072 tonnes of carbondioxide (CO2) for every 1,000Consumer Units (CUs) of productionin 2004, and 306,500 tonnes of CO2
equivalent in total.
During 2004 we reduced emissions of greenhouse gases by 3.5% per unit of production. Actual emissionsstayed essentially static.
Overall, we have reduced greenhousegas emissions by 11% per unit of production, and 10% in terms of actual emissions, since 2000.
This has been achieved through global energy efficiency programmes(see Energy Use, page 7), includinginitiatives such as the new CHP plantbuilt at Mira in Italy during 2004 (see Mira case study on page 5).
Performance targetsWe have beaten our target of a 10% reduction in greenhouse gasemissions per unit of production from manufacturing energy use by31st December 2004, achieving an11% reduction.
Our new target is a 20% reduction per unit of production by 31stDecember 2010.
WasteWe produced 0.010 tonnes of waste forevery 1,000 CUs of production in 2004(incl 0.001 tonnes of hazardous waste),and 42,800 tonnes in total (including5,600 tonnes of hazardous waste).
During 2004 we reduced total wasteby 3% and hazardous waste by 19%per unit of production. Actual totalwaste increased marginally by 1%,whilst actual hazardous wastedecreased by 16%.
Overall, we have reduced total wasteby 21% and hazardous waste by 40%per unit of production, since 2000;and 20% and 40% respectively interms of actual quantity.
This has been achieved by wasteminimisation programmes such as the returnable packaging initiative at Toronto, Canada in 2004.
Performance targetsIn 2003 we set ourselves a target to re-use or recycle off-site 65% of ourtotal waste, and 33% of hazardouswaste, by 31st December 2010.
In 2004 we re-used or recycled 62% of our total waste and 35% of ourhazardous waste. We are working tofurther understand the opportunitieshere before reviewing this target forhazardous waste in 2006.
Water dischargesWe discharged 0.65m3 of water for every 1,000 CUs of production in 2004 and 2.7million m3 in total.
During 2004 our water dischargesdecreased by 10% per unit ofproduction; actual water dischargesdecreased by 6%.
This was largely the result of waterefficiency initiatives and changes inproduction mix at our factories inEurope, particularly at Mira in Italy.
Overall, water discharges have increasedby 5% per unit of production, and6% in actual terms, since 2000. Thishas been largely caused by greater useof water for cleaning productionequipment, due to reductions in thepotency of the preservatives we put inour products. The result is that ourproducts are better for the environment,but we have had to discharge morewastewater. We are working to addressthis although our wastewater dischargesare strictly monitored to ensure thatthey are better than, or at a minimumcomply with, regulatory requirements.NB: we have revised water use data across all years, toexclude cooling water use at Mira in Italy. This water istaken from the local canal, used in clean cooling systems, anddischarged back into the canal. The cooling water dischargedback into the canal is visibly cleaner that the water we takeout, because we clean it before using it.
6 Reckitt Benckiser Sustainability Report 2004
SUSTAINABILITY
Reducing emissions from our facilitiesClimate change is largely caused by CO2 emissions from energy use. How are we reducing them?
0.085
0.080
0.075
0.070
GREENHOUSE GAS EMISSIONS FROMMANUFACTURING ENERGY USE(tonnes CO2 equivalents per ‘000 CUs)
00 01 02 03 04
0.075
0.0820.0810.082
2004 10% reduction target
NB: data from two R&D centres located at manufacturing facilities are also included here, across all years
0.0150
0.0100
0.0050
TOTAL WASTE AT MANUFACTURING AND
R&D FACILITIES (tonnes per ’000 CUs)
HAZARDOUS WASTE AT MANUFACTURING AND
R&D FACILITIES (tonnes per ’000 CUs)
00 01 02 03 04
0.01010.01040.01070.0110
2004 5% reduction target
0.0030
0.0020
0.0010
0.00000 01 02 03 04
0.00130.00160.0014
0.0018
2004 5% reduction target
0.0129
0.0022
0.072
0.80
0.70
0.60
0.50
0.40
WATER DISCHARGES FROM MANUFACTURINGAND R&D FACILITIES (m3 per ‘000 CUs)
00 01 02 03 04
0.610.620.65
0.72
0.57

Reckitt Benckiser Sustainability Report 2004 7
Energy useWe consumed 0.795 Gigajoules (GJ) of energy for every 1,000 ConsumerUnits (CUs) of production in 2004,and 3.36 million GJ of energy in total.
In 2004 we reduced our energy use by 5% per unit of production and by1% in terms of actual energy used.
Overall, we have reduced energy useby 14% per unit of production and13% in terms of actual energy used,since 2000.
Energy use reductions in 2004 havebeen achieved through efficiencyprogrammes at facilities worldwide,including strong performance at ourfactories in Granollers, Spain andShashi Jingzhou, China.
A more efficient boiler at Cileungsifactory in Indonesia gave significantreductions; whilst our North AmericanR&D centre at Montvale, USAreduced energy use by 11% in 2004,largely through new energy efficientdrives on air conditioning chillers.
Performance targetWe have beaten our target of a 10%reduction in energy consumption perunit of production by 31st December2004, achieving a 14% reduction.
Our new target is a 20% reduction in energy consumption per unit ofproduction by 2010, although wehope to achieve this before then.
Raw material useIn 2004 our top-five raw materials (in terms of quantity) totalled 1.05million metric tonnes.
Top five raw material categories Material Percentage of Category raw material use
Salts 36%Organic matter 27%Hydrocarbons 8%Minerals 3%Acids 2%Other 24%
Water use54% of the water we used in 2004 was released back into water systems(see Water Discharges, page 6). The remaining 46% went into ourproducts, was contained in liquid andsolid wastes sent off site, or evaporatedfrom cooling and process systems.
In 2004 we used 1.19m3 of water forevery 1,000 CUs of production and5.1 million m3 in total.
In 2004 we reduced our water use by 3% per unit of production; actualwater use increased slightly by 0.6%due to increased production levels.
Our R&D centre in Montvale, USAreduced water use by 46% in 2004,largely due to installing new airconditioning chillers.
Overall, water use has increased by8% per unit of production and 9% in terms of actual water used, since2000. This is largely due to increasedproduction of liquid-based products in response to increased consumerdemand for them, and greater use ofwater for cleaning productionequipment (see page 6). For example,the liquid laundry detergent marketgrew by 80% in Italy and 125% inSpain between 1997 and 2001.NB: we have revised water use data across all years, toexclude cooling water use at Mira in Italy. This water istaken from the local canal, used in clean cooling systems, anddischarged back into the canal. The cooling water dischargedback into the canal is visibly cleaner that the water we takeout, because we clean it before using it.
SUSTAINABILITY
Reducing use of material and resources in ourfacilities The world’s resources are limited. How are we managing our consumption?
Case study – the GreenFilter™ The two predecessors of ReckittBenckiser, Reckitt & Colman andBenckiser, operated strict policiesregarding the safety of the materialsused to make their products. InReckitt & Colman these policies were assembled into the GreenFilterTM
in 1998.
Following Reckitt Benckiser’sformation in 1999, our GlobalIngredient Guidelines (GIGs) wereestablished. The GIGs specify ourglobal standards for materials to beexcluded or only used at accepted safe levels (see page 10).
Since well before 1999 we haveoperated formal Ingredient RemovalProgrammes, systematically removingingredients from product formulationsand PVC from packaging. This is over and above legal requirements.
In November 2004, following ourlatest environmental aspects review(see page 5), we:
• re-established the GreenFilterTM, this time to seek moreenvironmentally sustainablealternatives to the materials that we use, starting with fragrances
• established a Standard for rawmaterials derived from forests, to assure that our products andpackaging do not contain materialsharvested from forests in anunsustainable manner
1.0
0.9
0.8
0.7
0.6
ENERGY USE AT MANUFACTURING ANDR&D FACILITIES (GJs per ‘000 CUs)
00 01 02 03 042004 10% reduction target
0.7950.8350.844
0.9160.925
1.25
1.00
0.75
0.50
0.25
0
WATER USE AT MANUFACTURING ANDR&D FACILITIES (m3 per ‘000 CUs)
00 01 02 03 04
1.191.23
1.011.101.10
8 Reckitt Benckiser Sustainability Report 2004
PackagingPackaging is used to contain, protectand transport our products.
We work hard to minimise packagingas far as possible and constantly havea number of projects in place doingjust that (see case studies, page 9).
Many of our products use plasticpackaging. In 2004 we donated asignificant amount of money and time to support three new initiatives,specifically designed for us to address international barriers to the recycling of plastic packaging:
• development of international ‘Design for Recycling’ Guidelines
• capital support to recycling schemes in Europe, North Americaand Africa
• an international journal to stimulateimprovements in plastics recyclingsystems and infrastructure
Work on these projects is ongoing,project managed by RECOUP (the UK plastic packaging recyclingadvisory body).
Transport and logisticsWe use transport contractors to movefinished products by road, rail and sea from manufacturing facilities todistribution centres and from there to our customers.
The environmental impacts of this aremostly associated with the use of fossilfuels to power trucks, trains and ships,which results in the emission ofgreenhouse gases.
In 2004 our global transportcontractors:• travelled approximately 189 million
kilometres (117 million miles) byroad contributing about 0.048tonnes of carbon dioxide equivalentfor every 1,000 consumer units(CUs) of production in 2004 and203,000 tonnes in total
• transported approximately 1,412million tonne-kilometres (a functionof tonnage transported and distance
travelled) by container in deep seaships; contributing approximately0.0023 tonnes of carbon dioxideequivalents for every 1,000Consumer units (CUs) and 9,900tonnes in total
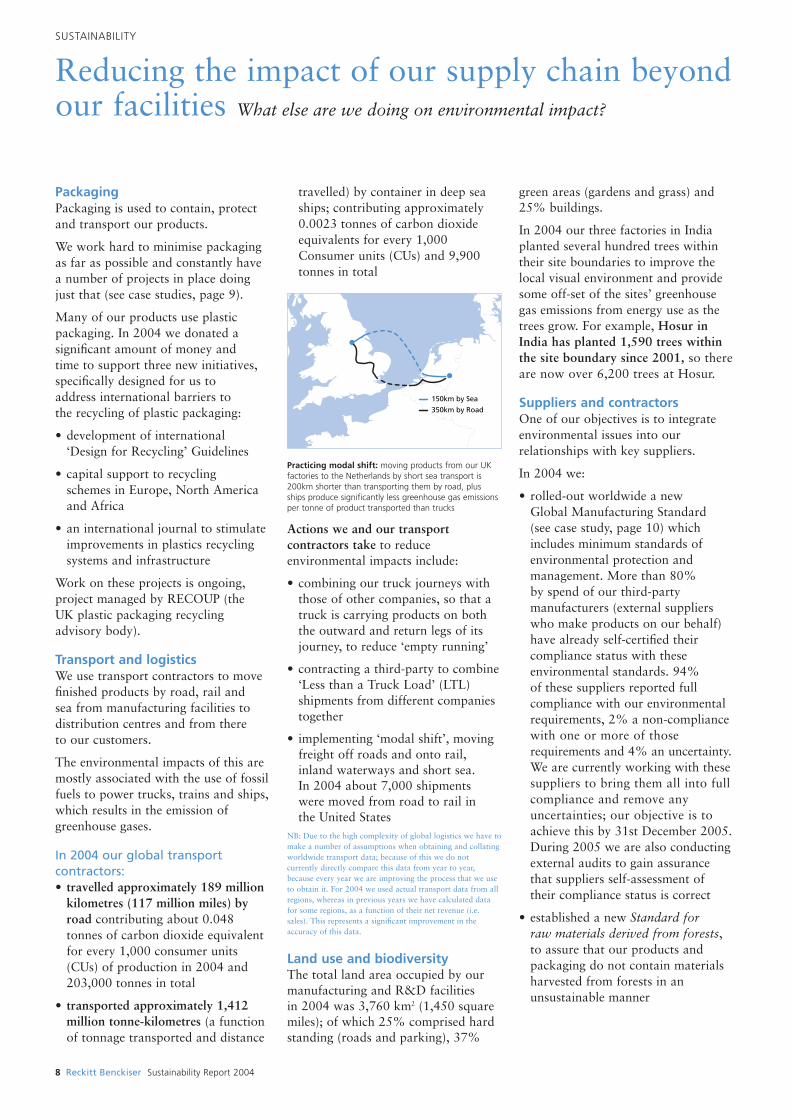
Practicing modal shift: moving products from our UKfactories to the Netherlands by short sea transport is200km shorter than transporting them by road, plusships produce significantly less greenhouse gas emissionsper tonne of product transported than trucks
Actions we and our transportcontractors take to reduceenvironmental impacts include:
• combining our truck journeys withthose of other companies, so that atruck is carrying products on boththe outward and return legs of itsjourney, to reduce ‘empty running’
• contracting a third-party to combine‘Less than a Truck Load’ (LTL)shipments from different companiestogether
• implementing ‘modal shift’, movingfreight off roads and onto rail,inland waterways and short sea. In 2004 about 7,000 shipments were moved from road to rail in the United States
NB: Due to the high complexity of global logistics we have tomake a number of assumptions when obtaining and collatingworldwide transport data; because of this we do notcurrently directly compare this data from year to year,because every year we are improving the process that we useto obtain it. For 2004 we used actual transport data from allregions, whereas in previous years we have calculated datafor some regions, as a function of their net revenue (i.e.sales). This represents a significant improvement in theaccuracy of this data.
Land use and biodiversityThe total land area occupied by ourmanufacturing and R&D facilities in 2004 was 3,760 km2 (1,450 squaremiles); of which 25% comprised hardstanding (roads and parking), 37%
green areas (gardens and grass) and 25% buildings.
In 2004 our three factories in Indiaplanted several hundred trees withintheir site boundaries to improve thelocal visual environment and providesome off-set of the sites’ greenhousegas emissions from energy use as thetrees grow. For example, Hosur inIndia has planted 1,590 trees withinthe site boundary since 2001, so thereare now over 6,200 trees at Hosur.
Suppliers and contractorsOne of our objectives is to integrateenvironmental issues into ourrelationships with key suppliers.
In 2004 we:
• rolled-out worldwide a new Global Manufacturing Standard (see case study, page 10) whichincludes minimum standards ofenvironmental protection andmanagement. More than 80% by spend of our third-partymanufacturers (external supplierswho make products on our behalf)have already self-certified theircompliance status with theseenvironmental standards. 94% of these suppliers reported fullcompliance with our environmentalrequirements, 2% a non-compliancewith one or more of thoserequirements and 4% an uncertainty.We are currently working with thesesuppliers to bring them all into fullcompliance and remove anyuncertainties; our objective is toachieve this by 31st December 2005.During 2005 we are also conductingexternal audits to gain assurancethat suppliers self-assessment of their compliance status is correct
• established a new Standard for raw materials derived from forests,to assure that our products andpackaging do not contain materialsharvested from forests in anunsustainable manner
SUSTAINABILITY
Reducing the impact of our supply chain beyondour facilities What else are we doing on environmental impact?
150km by Sea
350km by Road
Reckitt Benckiser Sustainability Report 2004 9
We are seeking to implement a lifecycle management (LCM) approach to our products and processes.
By looking at the environmentalimpacts associated with our productsbefore we manufacture them and afterwe sell them, alongside those from ourdirect operations, we aim to achievecontinues improvement in productenvironmental sustainability.
Material and component useThe environmental impacts of productuse and disposal are closely connectedwith their design and the materialswhich comprise them.
We use Global Ingredient Guidelines(GIGs) and Ingredient RemovalProgrammes (see case study, page 7and Product Safety, page 10) tocontrol the ingredients and materialsfrom which our products and theirpackaging are made.
Our Regulatory, Safety &Environmental services group (RSE) reviews products throughouttheir design and development, toensure that they are safe to use asintended and their environmentalimpacts considered.
Product environmental reviewIn 2004 we developed a new andadditional Product EnvironmentalReview process for our top NPDs(New Product Developments). This looks more closely at theenvironmental aspects associated witheach product from a Life CycleManagement (LCM) perspective.
During 2005 we shall be using thisnew review process to help us reducethe environmental impacts of ourproducts across their life cycle, as we develop them.
SUSTAINABILITY
Reducing the impact of our products in consumershands How do we help our consumers to reduce their environmental impact?
Case study – Granollers regularfabric softenerIn 2004 we introduced the RUB (RealUni-Bottle) 2.5 litre regular fabricsoftener product at our factory inGranollers, Spain.
We only made two changes:reducing the bottle size from 3 litres to 2.5 litres and increasing the product’s concentration, so thatthe new 2.5 litre bottle gave thesame number of product doses asthe old 3 litre bottle.
Because we have increased theproduct’s concentration, significantenvironmental benefits have been achieved.
For every 36 doses of regular fabric softener now produced atGranollers, up to 0.5 litres lesswater is used to make them and 15grams less plastic packaging isrequired to contain them.
In 2004 we produced around 5.25million bottles of the new RUB 2.5litre fabric softener at Granollers,which means that we also:
• reduced water use duringmanufacture by up to 2,625,000litres (4.6 million pints)
• saved almost 79 tonnes of plasticthat would otherwise have beenused for packaging and in turnbecome post-consumer waste
• reduced product transportation(and accompanying fuel use,traffic volume and air emissions)by about 150 truck loads
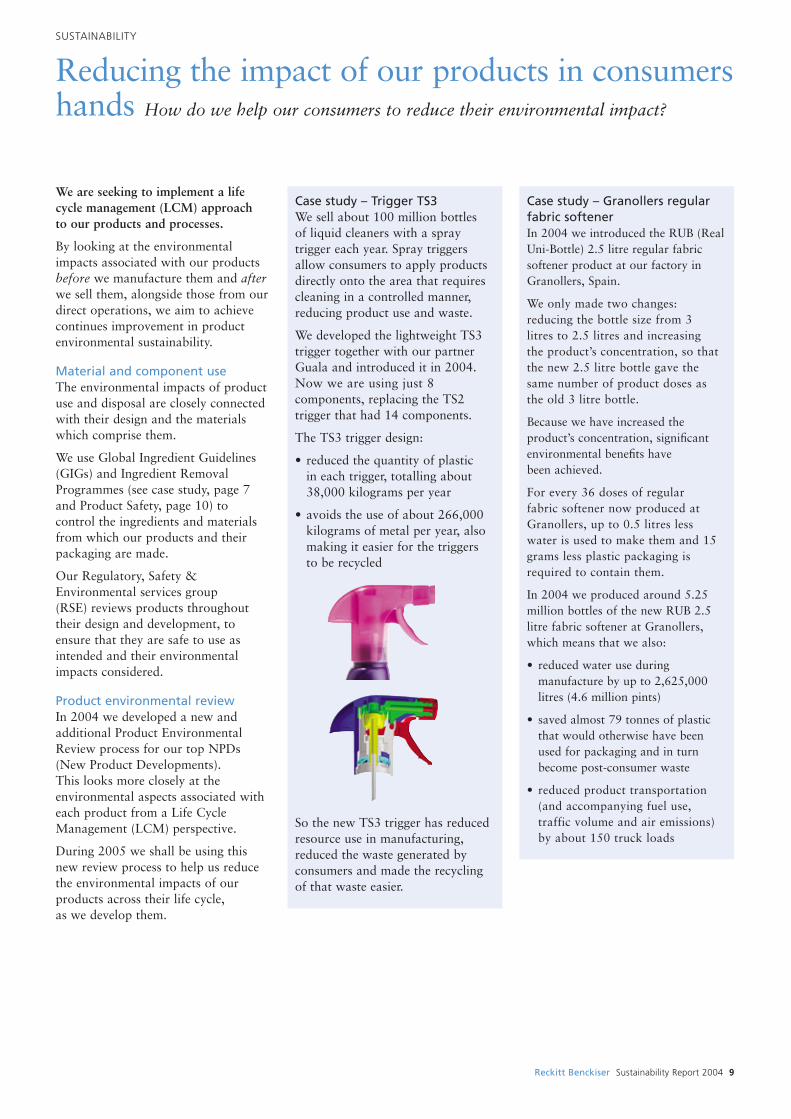
Case study – Trigger TS3We sell about 100 million bottles of liquid cleaners with a spraytrigger each year. Spray triggersallow consumers to apply productsdirectly onto the area that requirescleaning in a controlled manner,reducing product use and waste.
We developed the lightweight TS3trigger together with our partnerGuala and introduced it in 2004.Now we are using just 8components, replacing the TS2trigger that had 14 components.
The TS3 trigger design:
• reduced the quantity of plastic in each trigger, totalling about38,000 kilograms per year
• avoids the use of about 266,000kilograms of metal per year, alsomaking it easier for the triggers to be recycled
So the new TS3 trigger has reducedresource use in manufacturing,reduced the waste generated byconsumers and made the recyclingof that waste easier.
10 Reckitt Benckiser Sustainability Report 2004
Product safetyWe believe that product safety isfundamental to our personal andprofessional integrity, to sound andethical business practice and to ourresponsibility as a global leader in quality consumer products.
Our Regulatory, Safety &Environmental services group (RSE) is responsible for ensuring the safetyand regulatory compliance of ourproducts for their intended use.
For example, RSE maintain andregularly review our Global IngredientGuidelines (GIGs), which specifymaterials to be excluded or only usedat certain levels in our products (seecase study, page 7).
Ingredient removal programmesA number of specific ingredients arebeing systematically removed from our product formulas and packagingspecifications globally. Recentprogrammes include: the removal of nitro and polycyclic (artificial)musks from fragrances; thereplacement of PVC packaging,resulting in the avoidance of 1.3 million kg of PVC packaging since 2001; the replacement offormaldehyde preservatives; and theremoval of NPEs (Nonyl PhenolEthoxylates) and APEs (Alky PhenolEthoxylates) from fragrances and surfactants.
Ingredient % Number of Targetreduction products completionto date remaining date
Formaldehyde >90% <20 End 2006
APEs/NPEs >90% <10 End 2006
Glycol Ethers* 90% <10 End 2006
* Monoethylene series
These programmes are above andbeyond regulatory requirements.
HERA projectThe HERA (Human andEnvironmental Risk Assessment)project, established in 1999, is a
voluntary industry programme ofpublicly available risk assessments onthe ingredients of household cleaningproducts (www.heraproject.com). We continue to provide baseline dataand funding for HERA.
Product qualityReckitt Benckiser is committed toconsistently delivering the highestquality products.
We focus on building quality in at the product design stage and onquality risk assessments of processesand suppliers.
Quality issuesConsumer Existing New recalls products product
development
2002 1 16 10
2003 2 10 5
2004 0 1 0
In 2004 we had one quality issue,regarding leaks from the plug/cap of a toilet bowl cleaner. This issue didnot affect customers or consumers.
Group, regional and local QualityAssurance functions regularly auditour key suppliers, to assure andcontinuously improve the standards offinished products, raw materials andcomponents that they provide us with.
Our suppliersWe proactively engage with oursuppliers across a wide range ofissues from product quality toregulatory compliance.
Social issues in the supply chain are addressed through our GlobalManufacturing Standard (see case study on this page). We areparticularly focussed on suppliers that undertake the manufacturing or packing of products on behalf ofReckitt Benckiser Group companies.
Environmental supply chain issues are discussed on page 8.
RESPONSIBILITY
Safe products, quality productsHow do we ensure that our products are sourced and manufactured responsibly?
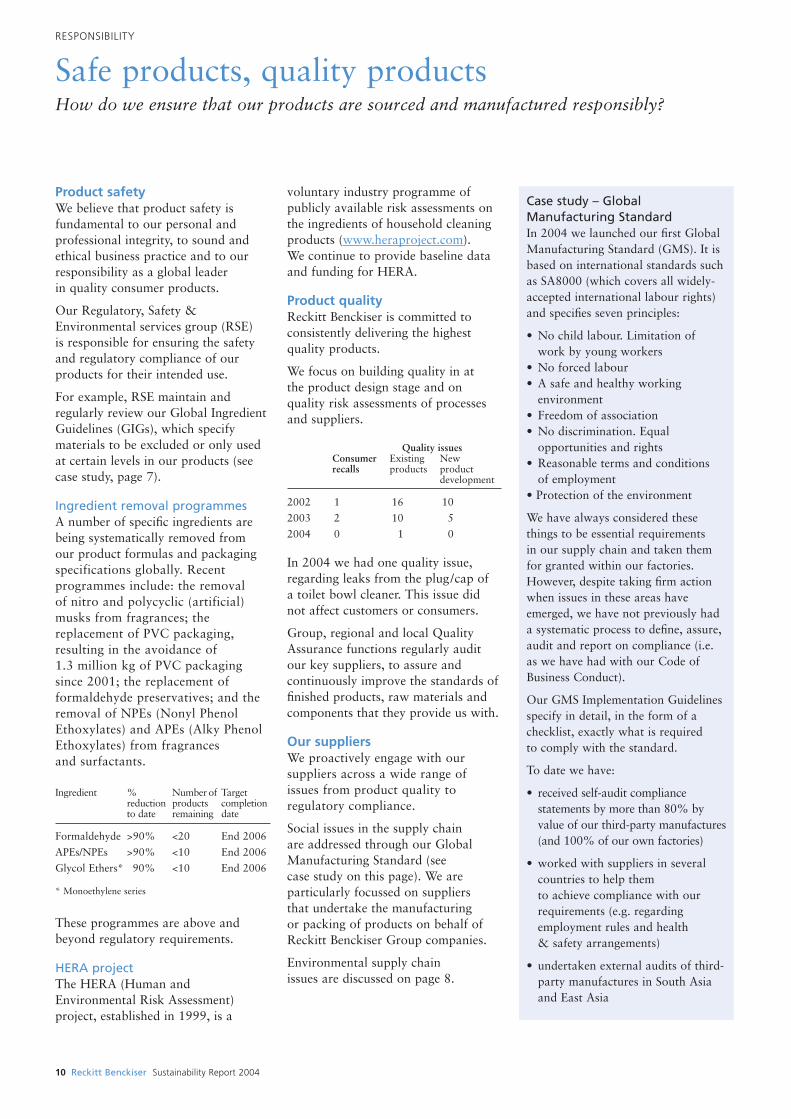
Case study – GlobalManufacturing Standard In 2004 we launched our first GlobalManufacturing Standard (GMS). It isbased on international standards suchas SA8000 (which covers all widely-accepted international labour rights)and specifies seven principles:
• No child labour. Limitation ofwork by young workers
• No forced labour• A safe and healthy working
environment• Freedom of association• No discrimination. Equal
opportunities and rights• Reasonable terms and conditions
of employment• Protection of the environment
We have always considered thesethings to be essential requirements in our supply chain and taken themfor granted within our factories.However, despite taking firm actionwhen issues in these areas haveemerged, we have not previously hada systematic process to define, assure,audit and report on compliance (i.e.as we have had with our Code ofBusiness Conduct).
Our GMS Implementation Guidelinesspecify in detail, in the form of achecklist, exactly what is required to comply with the standard.
To date we have:
• received self-audit compliancestatements by more than 80% byvalue of our third-party manufactures(and 100% of our own factories)
• worked with suppliers in severalcountries to help them to achieve compliance with ourrequirements (e.g. regardingemployment rules and health & safety arrangements)
• undertaken external audits of third-party manufactures in South Asiaand East Asia
Reckitt Benckiser Sustainability Report 2004 11
Our employeesReckitt Benckiser is driven by thepassion and commitment of itsemployees.
We attract and retain talentedindividuals, who work together aspowerful teams, by going out of our way to encourage, recognise and reward entrepreneurship and achievement.
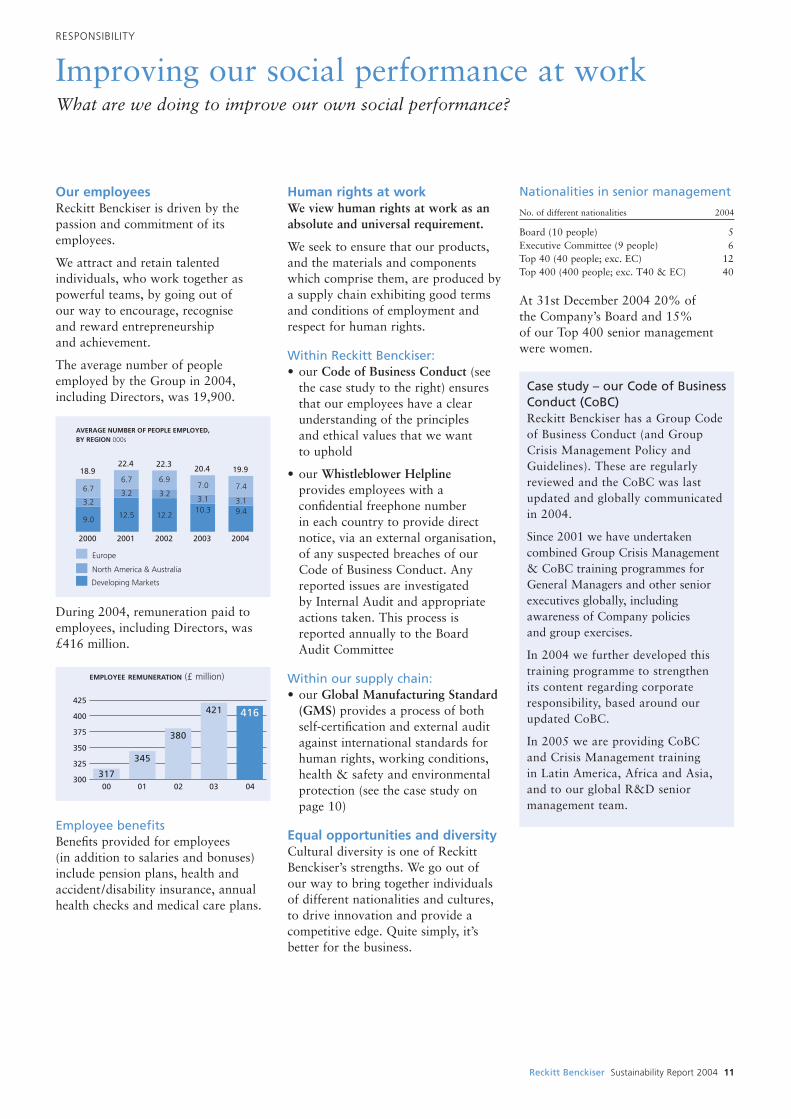
The average number of peopleemployed by the Group in 2004,including Directors, was 19,900.
During 2004, remuneration paid toemployees, including Directors, was£416 million.
Employee benefitsBenefits provided for employees (in addition to salaries and bonuses)include pension plans, health andaccident/disability insurance, annualhealth checks and medical care plans.
Human rights at workWe view human rights at work as anabsolute and universal requirement.
We seek to ensure that our products,and the materials and componentswhich comprise them, are produced bya supply chain exhibiting good termsand conditions of employment andrespect for human rights.
Within Reckitt Benckiser:• our Code of Business Conduct (see
the case study to the right) ensuresthat our employees have a clearunderstanding of the principles and ethical values that we want to uphold
• our Whistleblower Helplineprovides employees with aconfidential freephone number in each country to provide directnotice, via an external organisation,of any suspected breaches of ourCode of Business Conduct. Anyreported issues are investigated by Internal Audit and appropriateactions taken. This process is reported annually to the Board Audit Committee
Within our supply chain:• our Global Manufacturing Standard
(GMS) provides a process of bothself-certification and external auditagainst international standards forhuman rights, working conditions,health & safety and environmentalprotection (see the case study onpage 10)
Equal opportunities and diversityCultural diversity is one of ReckittBenckiser’s strengths. We go out of our way to bring together individualsof different nationalities and cultures,to drive innovation and provide acompetitive edge. Quite simply, it’sbetter for the business.
Nationalities in senior management
No. of different nationalities 2004
Board (10 people) 5Executive Committee (9 people) 6Top 40 (40 people; exc. EC) 12Top 400 (400 people; exc. T40 & EC) 40
At 31st December 2004 20% of the Company’s Board and 15% of our Top 400 senior management were women.
Europe
North America & Australia
Developing Markets
2000
9.0
3.2
6.7
18.9
2001
12.5
22.4
2002
12.2
22.3
2003
10.3
7.0
20.4
2004
9.4
7.4
19.9
AVERAGE NUMBER OF PEOPLE EMPLOYED, BY REGION 000s
3.2 3.2
6.7 6.9
3.1 3.1
RESPONSIBILITY
Improving our social performance at workWhat are we doing to improve our own social performance?
Case study – our Code of BusinessConduct (CoBC)Reckitt Benckiser has a Group Codeof Business Conduct (and GroupCrisis Management Policy andGuidelines). These are regularlyreviewed and the CoBC was lastupdated and globally communicatedin 2004.
Since 2001 we have undertakencombined Group Crisis Management& CoBC training programmes forGeneral Managers and other seniorexecutives globally, includingawareness of Company policies and group exercises.
In 2004 we further developed thistraining programme to strengthen its content regarding corporateresponsibility, based around ourupdated CoBC.
In 2005 we are providing CoBC and Crisis Management training in Latin America, Africa and Asia,and to our global R&D seniormanagement team.
425
400
375
350
325
300
EMPLOYEE REMUNERATION (£ million)
00 01 02 03 04
416421
380
345
317
12 Reckitt Benckiser Sustainability Report 2004
Health & safety at workWe seek to prevent accidents, injuriesand occupational ill health at alllocations under our control.
We also seek to ensure that our keysuppliers maintain necessary health & safety arrangements (see GlobalManufacturing Standard, page 10).
Managing riskIn 2004 we further improved ourOccupational Health & Safety (H&S)Global Hazard and Risk Assessment,which was first established in 2003.
We use this tool, which covers ourworldwide manufacturing and R&Dfacilities, to assist in understandingwhat and where our greatest potentialH&S hazards are, so that the requiredattention can be focussed upon them.
This attention includes, for example:process specific safety assessments,audits and Group standards; processhazard and safety training by internalGroup experts.
Audits and reviewsIn 2004 H&S audits and reviews were conducted in all regions by a combination of local, regional, Group and external auditors against Group, regulatory and ‘best practice’ requirements.
For example: our European H&SCoordinator audited 11 of our 14factories in Europe; the Group EHSDirector reviewed six sites, in Europe,Africa and Asia; EHS complianceaudits were conducted at two sites inIndia by an independent consultant;and PricewaterhouseCoopers LLPundertook a Group Health & SafetyReview for Internal Audit, includingaudits of six sites.
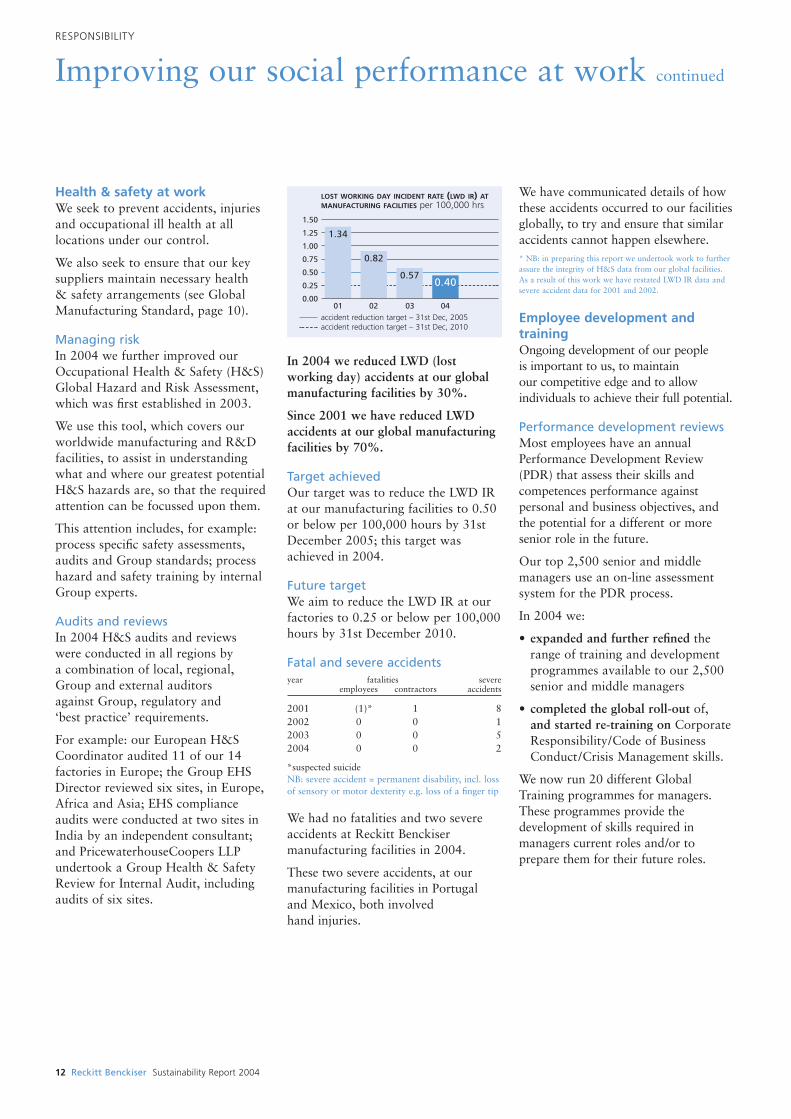
In 2004 we reduced LWD (lostworking day) accidents at our globalmanufacturing facilities by 30%.
Since 2001 we have reduced LWDaccidents at our global manufacturingfacilities by 70%.
Target achievedOur target was to reduce the LWD IRat our manufacturing facilities to 0.50or below per 100,000 hours by 31stDecember 2005; this target wasachieved in 2004.
Future targetWe aim to reduce the LWD IR at ourfactories to 0.25 or below per 100,000hours by 31st December 2010.
Fatal and severe accidentsyear fatalities severe
employees contractors accidents
2001 (1)* 1 82002 0 0 12003 0 0 52004 0 0 2
*suspected suicideNB: severe accident = permanent disability, incl. lossof sensory or motor dexterity e.g. loss of a finger tip
We had no fatalities and two severeaccidents at Reckitt Benckisermanufacturing facilities in 2004.
These two severe accidents, at ourmanufacturing facilities in Portugal and Mexico, both involved hand injuries.
We have communicated details of howthese accidents occurred to our facilitiesglobally, to try and ensure that similaraccidents cannot happen elsewhere.* NB: in preparing this report we undertook work to furtherassure the integrity of H&S data from our global facilities.As a result of this work we have restated LWD IR data andsevere accident data for 2001 and 2002.
Employee development andtrainingOngoing development of our people is important to us, to maintain our competitive edge and to allowindividuals to achieve their full potential.
Performance development reviewsMost employees have an annualPerformance Development Review(PDR) that assess their skills andcompetences performance againstpersonal and business objectives, andthe potential for a different or moresenior role in the future.
Our top 2,500 senior and middlemanagers use an on-line assessmentsystem for the PDR process.
In 2004 we:
• expanded and further refined therange of training and developmentprogrammes available to our 2,500senior and middle managers
• completed the global roll-out of, and started re-training on CorporateResponsibility/Code of BusinessConduct/Crisis Management skills.
We now run 20 different GlobalTraining programmes for managers.These programmes provide thedevelopment of skills required inmanagers current roles and/or toprepare them for their future roles.
RESPONSIBILITY
Improving our social performance at work continued
1.50
1.25
1.00
0.75
0.50
0.25
0.00
LOST WORKING DAY INCIDENT RATE (LWD IR) ATMANUFACTURING FACILITIES per 100,000 hrs
01 02 03 04
0.400.57
0.82
1.34
accident reduction target – 31st Dec, 2005accident reduction target – 31st Dec, 2010
Reckitt Benckiser Sustainability Report 2004 13
In 2004 Reckitt Benckiser and itsemployees joined forces with charitableorganisations worldwide to make a real difference to people’s lives.
These community involvementactivities included:
• direct financial assistance of around£1 million
• significant donations of products to provide immediate assistance with hygiene and health
• giving of employee time andexpertise, both through company-originated programmes and throughdirect employee initiatives
For example, Reckitt Benckiser SriLanka employees each donated a day’s salary to the Asian Tsunamirelief effort in their country, wherethousands of people lost their lives.Reckitt Benckiser Sri Lanka matchedthis employee donation, doubling theamount given to the local relief efforts,in addition to donating Dettol andDisprin products to the Red Cross.
We focus our assistance on issues of health and hygiene, particularly in relation to families with children, as both go to the heart of what Reckitt Benckiser is about.
In our partnership with Save theChildren, we are continually enlargingthe base of countries in which we are fund raising and the number of programmes that we support.
Assisting the millions of people aroundthe world affected by HIV/Aids can be a challenging issue for charities toraise money for. In 2004 we donated£100,000 to Medecins sans Frontieresprogrammes to help adults and childrenaffected by HIV/Aids in Thailand andEthiopia, including education work to reduce the spread of the disease.
Meanwhile we have not forgotten the local programmes that have beenbenefited by our support for a numberof years, such as Home Start in theUK, or the Dettol Trust for Aids inSouth Africa.
RESPONSIBILITY
Community – investing where it’s most neededHow do we join forces around the world to make a difference to people’s lives?
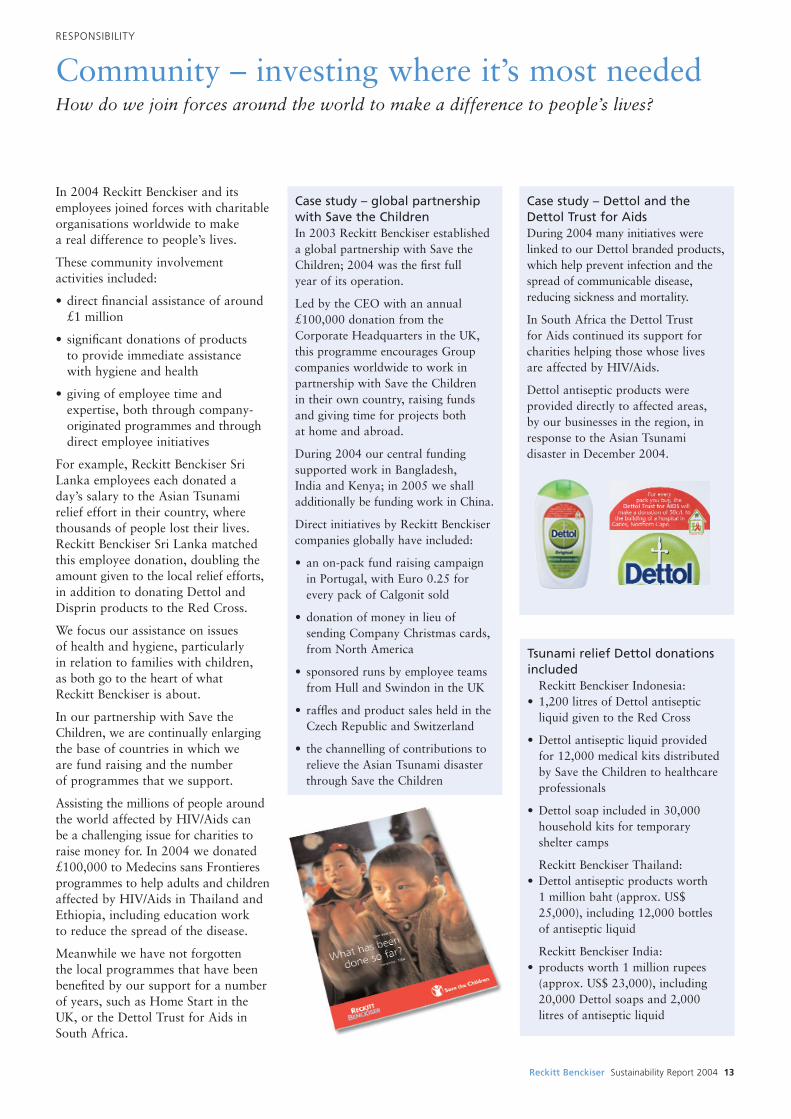
Case study – global partnershipwith Save the ChildrenIn 2003 Reckitt Benckiser establisheda global partnership with Save theChildren; 2004 was the first full year of its operation.
Led by the CEO with an annual£100,000 donation from theCorporate Headquarters in the UK,this programme encourages Groupcompanies worldwide to work inpartnership with Save the Children in their own country, raising fundsand giving time for projects both at home and abroad.
During 2004 our central fundingsupported work in Bangladesh, India and Kenya; in 2005 we shalladditionally be funding work in China.
Direct initiatives by Reckitt Benckisercompanies globally have included:
• an on-pack fund raising campaignin Portugal, with Euro 0.25 forevery pack of Calgonit sold
• donation of money in lieu ofsending Company Christmas cards,from North America
• sponsored runs by employee teamsfrom Hull and Swindon in the UK
• raffles and product sales held in theCzech Republic and Switzerland
• the channelling of contributions torelieve the Asian Tsunami disasterthrough Save the Children
Case study – Dettol and the Dettol Trust for AidsDuring 2004 many initiatives werelinked to our Dettol branded products,which help prevent infection and thespread of communicable disease,reducing sickness and mortality.
In South Africa the Dettol Trust for Aids continued its support forcharities helping those whose lives are affected by HIV/Aids.
Dettol antiseptic products wereprovided directly to affected areas, by our businesses in the region, inresponse to the Asian Tsunamidisaster in December 2004.
Tsunami relief Dettol donationsincluded
Reckitt Benckiser Indonesia:• 1,200 litres of Dettol antiseptic
liquid given to the Red Cross
• Dettol antiseptic liquid provided for 12,000 medical kits distributed by Save the Children to healthcareprofessionals
• Dettol soap included in 30,000household kits for temporary shelter camps
Reckitt Benckiser Thailand:• Dettol antiseptic products worth
1 million baht (approx. US$25,000), including 12,000 bottles of antiseptic liquid
Reckitt Benckiser India:• products worth 1 million rupees
(approx. US$ 23,000), including20,000 Dettol soaps and 2,000litres of antiseptic liquid
FURTHER INFORMATION
How we ensure we act sustainably and responsiblyHow do we manage sustainability and responsibility in our business?
GovernanceResponsibility for sustainability*issues is integrated throughout theCompany’s management structure.
The Board is responsible for theoverall stewardship of the Company,including sustainability. The ChiefExecutive Officer (CEO) is the Boardmember with specific responsibility forthe Company’s sustainability policiesand performance.
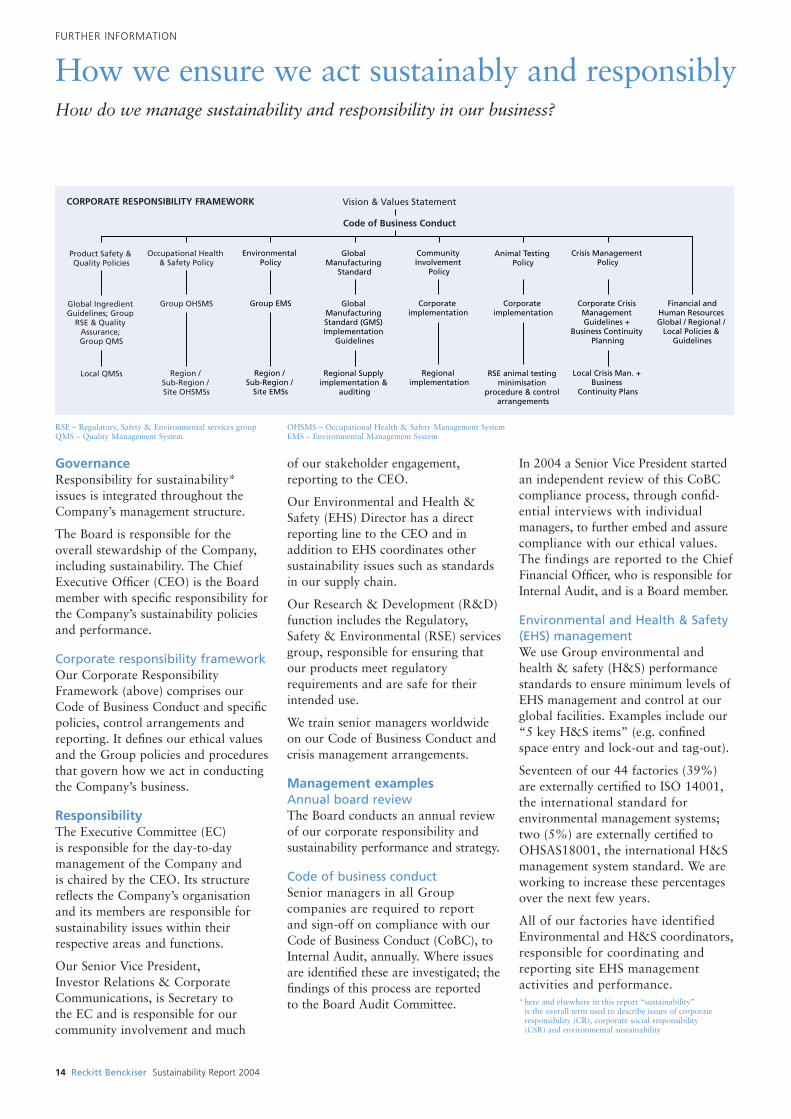
Corporate responsibility frameworkOur Corporate ResponsibilityFramework (above) comprises ourCode of Business Conduct and specificpolicies, control arrangements andreporting. It defines our ethical valuesand the Group policies and proceduresthat govern how we act in conductingthe Company’s business.
ResponsibilityThe Executive Committee (EC) is responsible for the day-to-daymanagement of the Company and is chaired by the CEO. Its structurereflects the Company’s organisationand its members are responsible forsustainability issues within theirrespective areas and functions.
Our Senior Vice President, Investor Relations & CorporateCommunications, is Secretary to the EC and is responsible for ourcommunity involvement and much
of our stakeholder engagement,reporting to the CEO.
Our Environmental and Health &Safety (EHS) Director has a directreporting line to the CEO and inaddition to EHS coordinates othersustainability issues such as standardsin our supply chain.
Our Research & Development (R&D)function includes the Regulatory,Safety & Environmental (RSE) servicesgroup, responsible for ensuring thatour products meet regulatoryrequirements and are safe for theirintended use.
We train senior managers worldwideon our Code of Business Conduct andcrisis management arrangements.
Management examplesAnnual board reviewThe Board conducts an annual review of our corporate responsibility andsustainability performance and strategy.
Code of business conductSenior managers in all Groupcompanies are required to report and sign-off on compliance with ourCode of Business Conduct (CoBC), toInternal Audit, annually. Where issuesare identified these are investigated; thefindings of this process are reported to the Board Audit Committee.
In 2004 a Senior Vice President startedan independent review of this CoBCcompliance process, through confid-ential interviews with individualmanagers, to further embed and assurecompliance with our ethical values. The findings are reported to the ChiefFinancial Officer, who is responsible forInternal Audit, and is a Board member.
Environmental and Health & Safety(EHS) managementWe use Group environmental andhealth & safety (H&S) performancestandards to ensure minimum levels ofEHS management and control at ourglobal facilities. Examples include our“5 key H&S items” (e.g. confinedspace entry and lock-out and tag-out).
Seventeen of our 44 factories (39%)are externally certified to ISO 14001,the international standard forenvironmental management systems;two (5%) are externally certified toOHSAS18001, the international H&Smanagement system standard. We areworking to increase these percentagesover the next few years.
All of our factories have identifiedEnvironmental and H&S coordinators,responsible for coordinating andreporting site EHS managementactivities and performance.* here and elsewhere in this report “sustainability”
is the overall term used to describe issues of corporateresponsibility (CR), corporate social responsibility (CSR) and environmental sustainability
Code of Business Conduct
Vision & Values Statement
Product Safety & Quality Policies
Occupational Health & Safety Policy
Environmental Policy
Global Manufacturing
Standard
Community Involvement
Policy
Animal Testing Policy
Crisis Management Policy
Financial andHuman Resources Global / Regional /
Local Policies & Guidelines
Local QMSs Region / Sub-Region / Site OHSMSs
Region / Sub-Region /
Site EMSs
Regional Supply implementation &
auditing
Regional implementation
Local Crisis Man. + Business
Continuity Plans
Global Ingredient Guidelines; Group
RSE & Quality Assurance; Group QMS
Group OHSMS Group EMS Global Manufacturing Standard (GMS) Implementation
Guidelines
RSE animal testing minimisation
procedure & control arrangements
Corporate Crisis Management Guidelines +
Business Continuity Planning
Corporate implementation
Corporate implementation
RSE – Regulatory, Safety & Environmental services groupQMS – Quality Management System
OHSMS – Occupational Health & Safety Management SystemEMS – Environmental Management System
CORPORATE RESPONSIBILITY FRAMEWORK
14 Reckitt Benckiser Sustainability Report 2004
Reckitt Benckiser Sustainability Report 2004 15
Stakeholder understanding andengagementBy actively engaging with ourstakeholders we can better understandtheir expectations, and betterdetermine how we can best meet those expectations in practical terms.
We talk to our stakeholders:• as part of normal, day-to-day
business and support activities e.g. working with suppliers on new product development, talking to customers and shareholders
• as part of more specific, periodicprogrammes, which may or may notbe specific to sustainability issues
In 2004 we engaged with all of the sixstakeholder groups identified by theUK’s Business in the Community(BitC) Corporate Responsibility Index:
• customers and consumers
• financial stakeholders
• government and regulators
• local communities
• non-governmental organisations (NGOs) and media
• suppliers
Example – Employee engagementSince the Company’s formation in1999 we have undertaken a range ofculture surveys to understand employeeviews about how the Company is runand organised, and to determine howsatisfied employees are and where theythink we can make improvements.
These surveys are conductedanonymously through an expert thirdparty and have included to date:
• two global, Group-wide surveys
• an area survey across Developing Markets
• a regional survey in Eastern Europe
• a country survey in India
• two functionally focussed surveys, in Supply and Finance
In 2001 and 2002 we conductedseveral meetings with employees to determine their views on environmental performance and how we could improve it.
Sustainability issues, such as health & safety, are included in our regularmeetings with the European WorkersCouncil and other employeerepresentatives.
External benchmarkingWe learn a lot from the assessment of and feedback on our performancein external benchmarks. In 2004 we were:
• sector leader in the UK’s Business in the Community (BitC) CorporateResponsibility Index and placed22nd out of the top “100 companiesthat Count”. We were also in itsEnvironment Index in which weentered the “Premier League” for thefirst time in 2004 (www.bitc.org.uk)
• a member of the World and
European Dow Jones Sustainability
Index, and of the UK, European
and World FTSE4Good indices
(www.sustainability-indexes.com;
www.ftse.com/ftse4good)
• ranked amongst the leaders of oursector in the Carbon DisclosureProject’s assessment of companiescarbon strategy (www.cdproject.net)
Future programmesDuring 2005 and 2006, in addition toour normal engagement activities, wewill be conducting new sustainabilityengagement programmes with:
• employees
• consumers
• customers
• shareholders
• society e.g. NGOs
FURTHER INFORMATION
Stakeholders and external benchmarkingHow do we listen to our stakeholders and benchmark our performance?
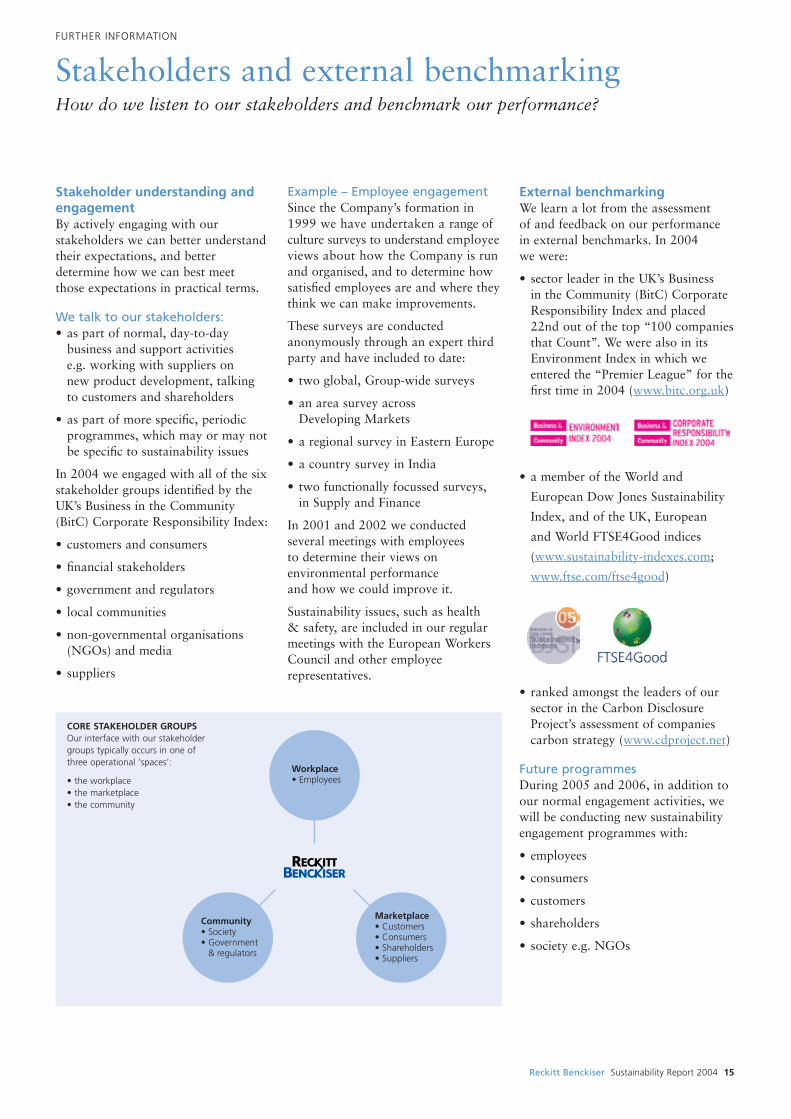
Workplace• Employees
Community• Society• Government
& regulators
Marketplace• Customers• Consumers• Shareholders• Suppliers
CORE STAKEHOLDER GROUPSOur interface with our stakeholdergroups typically occurs in one ofthree operational ‘spaces’:
• the workplace• the marketplace• the community
FURTHER INFORMATION
Measuring our actual environmental impactWhat is our actual environmental impact, not normalised against production volume?
4.0
3.5
3.0
ENERGY USE AT MANUFACTURING ANDR&D FACILITIES (million GJ)
00 01 02 03 04
3.363.413.38
3.753.87
5.5
5.0
4.5
4.0
3.5
WATER USE AT MANUFACTURING ANDR&D FACILITIES (million m3)
00 01 02 03 04
5.055.02
4.06
4.524.62
0.350
0.325
0.300
0.275
GREENHOUSE GAS EMISSIONS FROMMANUFACTURING ENERGY USE(million tonnes CO2 equivalents)
00 01 02 03 04
0.3070.306
0.3270.3320.342
3.00
2.75
2.50
2.25
2.00
WATER DISCHARGES FROM MANUFACTURINGAND R&D FACILITIES (million m3)
00 01 02 03 04
2.74
2.92
2.28
2.512.59
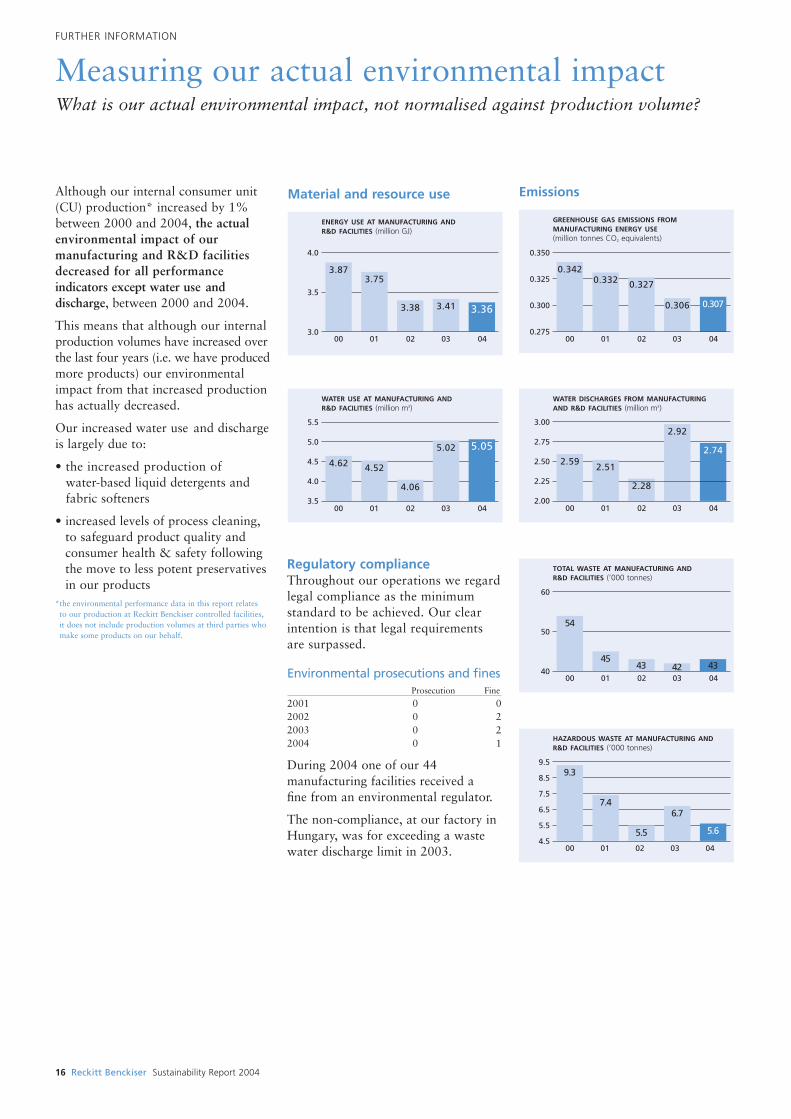
Although our internal consumer unit(CU) production* increased by 1%between 2000 and 2004, the actualenvironmental impact of ourmanufacturing and R&D facilitiesdecreased for all performanceindicators except water use anddischarge, between 2000 and 2004.
This means that although our internalproduction volumes have increased overthe last four years (i.e. we have producedmore products) our environmentalimpact from that increased productionhas actually decreased.
Our increased water use and discharge is largely due to:
• the increased production of water-based liquid detergents andfabric softeners
• increased levels of process cleaning,to safeguard product quality andconsumer health & safety followingthe move to less potent preservativesin our products
*the environmental performance data in this report relates to our production at Reckitt Benckiser controlled facilities, it does not include production volumes at third parties whomake some products on our behalf.
Regulatory complianceThroughout our operations we regardlegal compliance as the minimumstandard to be achieved. Our clearintention is that legal requirementsare surpassed.
Environmental prosecutions and finesProsecution Fine
2001 0 02002 0 22003 0 22004 0 1
During 2004 one of our 44manufacturing facilities received a fine from an environmental regulator.
The non-compliance, at our factory inHungary, was for exceeding a wastewater discharge limit in 2003.
60
50
40
TOTAL WASTE AT MANUFACTURING ANDR&D FACILITIES (’000 tonnes)
00 01 02 03 04
45
54
43 4342
HAZARDOUS WASTE AT MANUFACTURING ANDR&D FACILITIES (’000 tonnes)
9.5
8.5
7.5
6.5
5.5
4.500 01 02 03 04
5.6
6.7
5.5
7.4
9.3
Material and resource use Emissions
16 Reckitt Benckiser Sustainability Report 2004
Scope and completenessThis report provides data andinformation for the period 1st January2004 to 31st December 2004 acrossall Reckitt Benckiser Groupcompanies, as follows:
• Environmental: the 44 factories and 5 R&D centres over which we had operational control on 31stDecember 2004 (see table below)
• Health & Safety: the 46 factoriesover which we had operationalcontrol on 1st January 2004; weinclude all data from all factories up until the date of their closure or sale
• Social: all Group companiesand facilities
• Economic: all Group companies and facilities, excluding Zimbabwe (see Basis of Consolidation on page 34 of our Annual Report & Accounts 2004, atwww.reckittbenckiser.com).
Data on our greenhouse gas emissionswere calculated in line with The GHGProtocol Corporate Accounting andReporting Standard (2004). We haveadditionally taken account of theglobal warming potential of methaneand nitrous oxide emissions fromenergy use, in line with theIntergovernmental Panel on ClimateChange (IPCC) Guidelines forNational Greenhouse Gas Inventories (1996).
Comparability and limitationsThe comparability of data from year to year is affected by changes in the number of Group facilities,changes in the methodology fordetermining certain data (e.g. European Union changes in thedefinition of hazardous waste) and continual improvements in ourperformance measurement systems.
In this report we have made thefollowing improvements in historicaldata presented in previous reports:
• facility specific emissions of CO2
from electricity consumption havebeen amended for 2000-2002 using updated country-level dataprovided by the International EnergyAgency. In the absence of published2003 and 2004 data, a five-yearaverage (1998 to 2002) has been used
• volumes of water consumption anddischarge at our facility at Mira inItaly have been amended to excludewater used only for cooling purposes
• minor amendments have been madeto previous years Consumer Unitproduction data for our facilities at Hull in the UK and at St Petersand Brandon in the US, to correctprevious inaccuracies
• we have restated health & safetyLWD IR and severe accident data for 2001 and 2002 following theinternal assurance of global health& safety data across all years
Although we are confident in theoverall reliability of the data andinformation reported, we recognisethat some of these data are subject to a degree of uncertainty that relatesto, for example:
• different interpretation of reportingguidelines at a local, site level
• inherent limitations in methods and measurement techniques used to determine environmental andsafety data, including calculations of consumer unit (CU) productionlevels and working hours at a site level
Independent assuranceURS Verification Limited (URSVL) has provided independent assuranceover information and data in thisreport. For their scope and opinion see page 19.
The economic data disclosed in thisreport on pages 1 and 4, and the social data on employee numbers andremuneration on page 11, is takenfrom the Company’s Annual Report & Accounts 2001–2004, which aresubject to independent audit andavailable at: www.reckittbenckiser.com
PricewaterhouseCoopers LLP (PwC)provided independent assurance/reviewof our four previous EnvironmentalReports, for 2000–2003, which areavailable at: www.reckittbenckiser.com
FURTHER INFORMATION
Basis of reportingHow has the data and information in this report been put together?
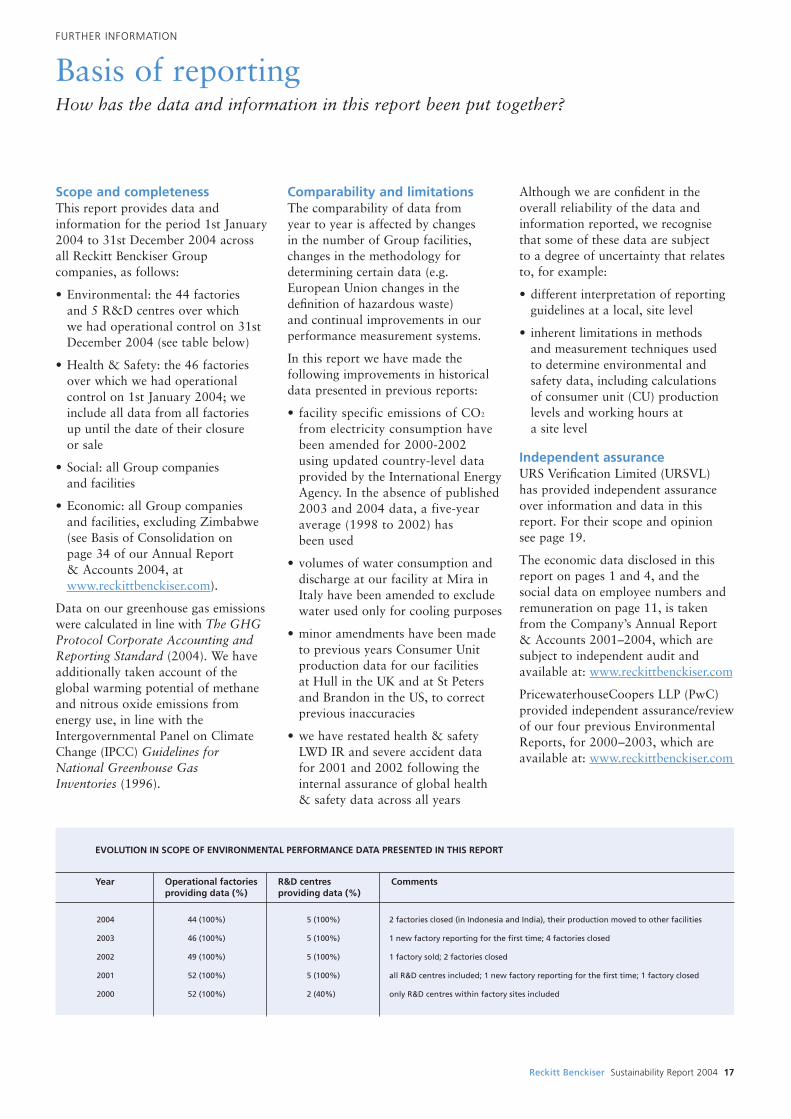
Year Operational factories providing data (%)
R&D centres providing data (%)
Comments
EVOLUTION IN SCOPE OF ENVIRONMENTAL PERFORMANCE DATA PRESENTED IN THIS REPORT
2004 44 (100%) 5 (100%) 2 factories closed (in Indonesia and India), their production moved to other facilities
2003 46 (100%) 5 (100%) 1 new factory reporting for the first time; 4 factories closed
2002 49 (100%) 5 (100%) 1 factory sold; 2 factories closed
2001 52 (100%) 5 (100%) all R&D centres included; 1 new factory reporting for the first time; 1 factory closed
2000 52 (100%) 2 (40%) only R&D centres within factory sites included
Reckitt Benckiser Sustainability Report 2004 17
18 Reckitt Benckiser Sustainability Report 2004
Biodiversity: biological diversity. The variety of living things; the differentplants, animals and micro-organisms,the genes they contain and theecosystems of which they are a part
Consumers: the persons who use our products, usually in the home
Corporate Responsibility: anorganisation’s responsibility to act in an environmentally, ethically and socially responsible manner inconducting its activities (also known asCorporate Social Responsibility or CSR)
Consumer Unit (CU): the normal unitof product purchase by a consumer(i.e. a single box, bag, bottle etc.)
Customers: the companies to whomwe sell our products
Economic: relating to the economy(the system of production, distributionand consumption of goods andservices) and/or economics (themanagement of material wealth)
Environment: surroundings, includingair, water, land, natural resources, flora,fauna, humans and their interactions
Environmental Aspect: an element ofan organisations activities, products or services that can interact with the environment to cause anenvironmental impact and benefit
Performance (environmental/social/economic): level of benefit and impact,particularly over time
Human Rights: the universal rightsoutlined in the United Nations’Universal Declaration of HumanRights, such as the rights to life, libertyand security of person, equality beforethe law and freedom of association
Risk: uncertainty, including bothpotential threats and potentialopportunities
Society: the general population and its institutions, aside from governmentand business; including individuals,voluntary/religious groups,schools/universities and non-governmental organisations (NGOs)
Stakeholder(s): those individuals orgroups that affect and/or are affectedby the Company and its activities
Stakeholder Engagement: the processof interacting with stakeholder groups
Supplier(s): third-party suppliers of goods and services
Sustainability: the capacity forcontinuance into the long-term future, environmentally, socially andeconomically. It embodies the conceptof balancing short-term and long-term goals and benefits
FURTHER INFORMATION
Glossary and contact details
NoteGuidelines we have taken account of in preparingthis report include:
• Reporting Standard 1: Operating & FinancialReview (OFR RS1), Accounting Standards Board(ASB), 2005
• Risk & Opportunity: Best Practice in Non-financialReporting, Sustainability, 2004
• Indicators that Count: social and environmentalindicators, a model for reporting impact, Business in the Community (BitC), 2003
• Sustainability Reporting Guidelines, GlobalReporting Initiative (GRI), 2002
• Health & Safety in Annual Reports, Health & SafetyCommission (HSC), 2001
• General Guidelines on Environmental Reporting,Department for Environment, Food & Rural Affairs(DEFRA), 2001
• Towards a Generally Accepted Framework forEnvironmental Reporting, European Federation of Accountants (FEE), 2000
• BS EN ISO 14031 Environmental PerformanceEvaluation Guidelines, 1999
• AA1000 Framework: standard, guidelines andprofessional qualification – exposure draft, Institute of Social & Ethical Accountability, 1999
For further information on ReckittBenckiser please visit our web site at:www.reckittbenckiser.com
If you have any comments or queries on this report, please contact:
Edward Butt Environmental and Health & Safety Director
Reckitt Benckiser plc103-105 Bath Road Slough, Berkshire SL1 3UHUnited Kingdom
Tel: +44 (0) 1753 217 800Fax: +44 (0) 1753 217 899
email: [email protected]
Reckitt Benckiser Sustainability Report 2004 19
FURTHER INFORMATION
Independent assurance statement
Objectives and scopeURS Verification Ltd (URSVL) has beencommissioned by Reckitt Benckiser to provideindependent assurance of its SustainabilityReport 2004 (“the Report”). The scope ofwork we have performed and on which ouropinions are based is as follows:
• six management interviews covering Group,area and functional level strategy andapproach to the management and controlof sustainability issues
• visits to four manufacturing facilities at Hull (UK), Ladenburg (Germany), Hosur (India) and Sao Paulo (Brazil); reviewingprocesses in place for site level datacollection, management and reporting;obtaining an overview of some of the keysustainability issues relevant to the Company(at those sites) and the processes for theirmanagement; and looking at issues aroundcompliance with the Group’s GlobalManufacturing Standard (GMS)
• a review of the Group-level datamanagement and reporting systems in place for the collation and aggregation of site level data into Group-level data, and its reporting
The specific data assured during the abovetasks comprised figures for 2004 as below:
Health & Safety: Lost Working Day IncidentRate (LWD IR); Severe and Fatal accidents
Environment: Greenhouse Gas emissionsfrom manufacturing energy consumption(and in doing so manufacturing energyconsumption itself); Total Waste andHazardous Waste
We have considered the following issues in forming our opinion:
• the effectiveness of data collection andreporting systems from site through toGroup level
• the appropriateness and coverage ofpolicies and management processes in place at a Group level regardingsustainability issues
We have also embedded in our overallapproach certain principles of the GlobalReporting Initiative (GRI) and the assuranceelement of AA1000, an internationalaccountability framework. In undertaking this work URSVL auditors have applied thegeneral principles of auditing and auditprocedures as contained within internationalstandard ISO 19011.
The scope of work did not include verifyingconsumer testimonials on pages 2 and 3 ofthe report.
Responsibilities of Management and VerifiersThe information contained in the Report is thesole responsibility of the Executive Committeeof Reckitt Benckiser. This assurance statementrepresents the independent opinion of URSVLin relation to the Report. URSVL was notinvolved in the preparation of any materialincluded in this report.
URSVL has carried out this assurance bychecking samples of data, information anddocuments that have been made available on request to URSVL by Reckitt Benckiser.Accordingly, URSVL has not checked orreviewed all of Reckitt Benckiser’s data,information and documents that contribute tothe Report. The assurance statement providedherein by URSVL is not intended to be used as advice or as the basis for any decisions,including, without limitation, financial orinvestment decisions.
OpinionSustainability and responsibilityReckitt Benckiser has described the corporatesystems for governance and management ofsustainability issues within the content of theReport. In URSVL’s opinion, the allocation of responsibilities and corporate policies areappropriate, well communicated and coverkey items of corporate responsibility relevantto the organisation. There are processes foridentifying items of non-compliance withthese policies.
Reckitt Benckiser should be commended for developing and implementing its GlobalManufacturing Standard, which seeks toensure certain standards for corporateresponsibility within its supply chain and thecompany’s own processes. URSVL notes thatthe Standard has been recently developed andhas yet to become fully embedded withinbusiness practices.
Risk assessment processes are in place forcertain aspects of sustainability (environment,occupational safety and product safety), which have been used to develop improvementprogrammes and enhance managementcontrols. Sustainability risks as well as broaderbusiness risks are discussed at a Board level.Additional benefit could be derived fromformalising the corporate-level non-financialrisk assessment process, thereby ensuring that these risks are identified and assessed in a consistent manner.
Reckitt Benckiser has used benchmarking and external expert advice to identify the key performance indicators in this report. As sustainability processes mature further,broader performance indicators will enablemore complete reporting of performance.
Content and Coverage of the reportData Accuracy. Based on our review, thesystems in place for the collection and collationof environmental and safety data are effective.
In our opinion, the environmental datareported for the indicators assessed isrepresentative at a Group level. Somevariances in data were identified, which werenot significant when aggregated at a globallevel. These were due to data processingerrors and omissions at site level and have all been corrected in the final data set.
In terms of the safety data, it is URSVL’sopinion that accident data presented in thisreport reflects performance.
A few inconsistencies were identified duringthe URSVL site visits, particularly the scopeof work hours used for determination of LostWorking Day Incident Rate. These were notsignificant when aggregated at a global level.
Balance and Representativeness of Information. The information reported inthe areas of sustainability and responsibilityreflects the initiatives undertaken as part ofReckitt Benckiser’s sustainability andresponsibility strategy.
Certain risks, challenges and incidents arereported, and further development of thereporting process to increase discussion ofthese issues would provide greater balance.
Suggestions for improvementOur feedback report for Reckitt Benckiser’smanagement contains suggestions for thecontinuous improvement of the company’sreporting systems and processes.
David WestwoodDirector
For and on behalf of URS Verification LtdLondon, July 2005

Reckitt Benckiser plc103-105 Bath Road Slough, Berkshire SL1 3UHUnited Kingdom
www.reckittbenckiser.com