Embed Size (px)
Citation preview
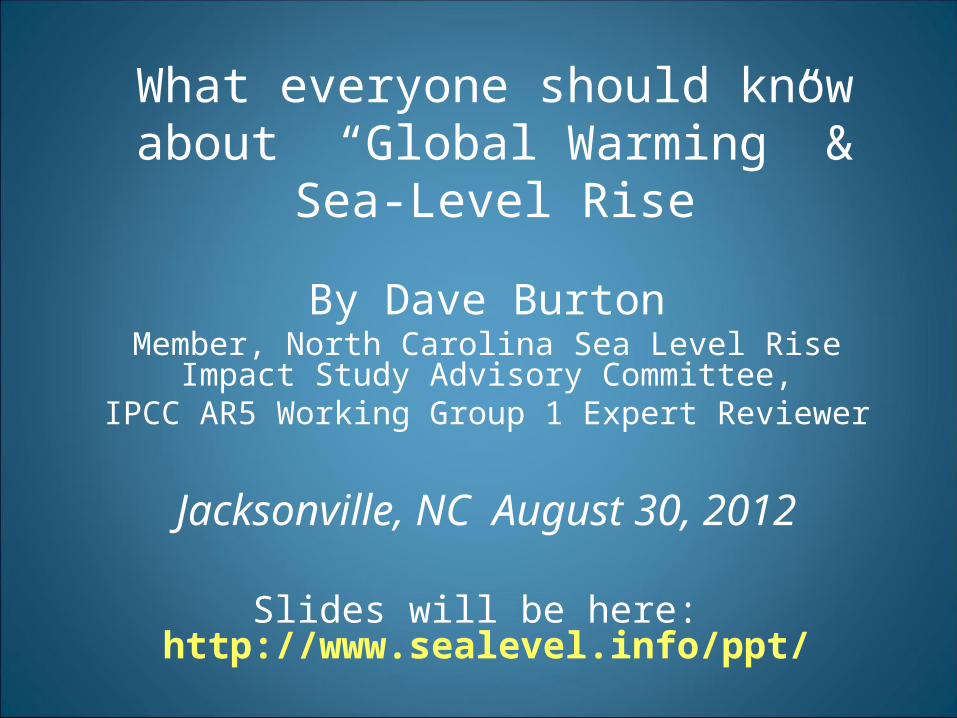
What everyone should know about “Global Warming” & Sea-Level Rise
By Dave BurtonMember, North Carolina Sea Level Rise Impact Study
Advisory Committee,IPCC AR5 Working Group 1 Expert Reviewer
Jacksonville, NC August 30, 2012
Slides will be here: http://www.sealevel.info/ppt/

“Carbon pollution” “Carbon emissions”
• not “black carbon!”• Carbon dioxide (CO2) emissions• From burning fossil fuels, breathing, etc.• Plants: CO2 + H2O + sunlight → oxygen (O2) +
hydrocarbons• (hydrocarbons = food, wood, oils, etc.)• Animals: oxygen (O2) + food → CO2

CO2 levels are up ~100 ppm

What does “carbon pollution” do to plants?

What does “carbon pollution” do to plants?
Cowpeas use “C3” photosynthesis (like most crops)
C3 plants benefit most from additional CO2
What about “C4” plants, like corn?

What does “carbon pollution” do to sea level?But first, a digression . . .

Key concept: Acceleration
Time (years)
Does the rate of sea level rise increase or decrease, and by how much?
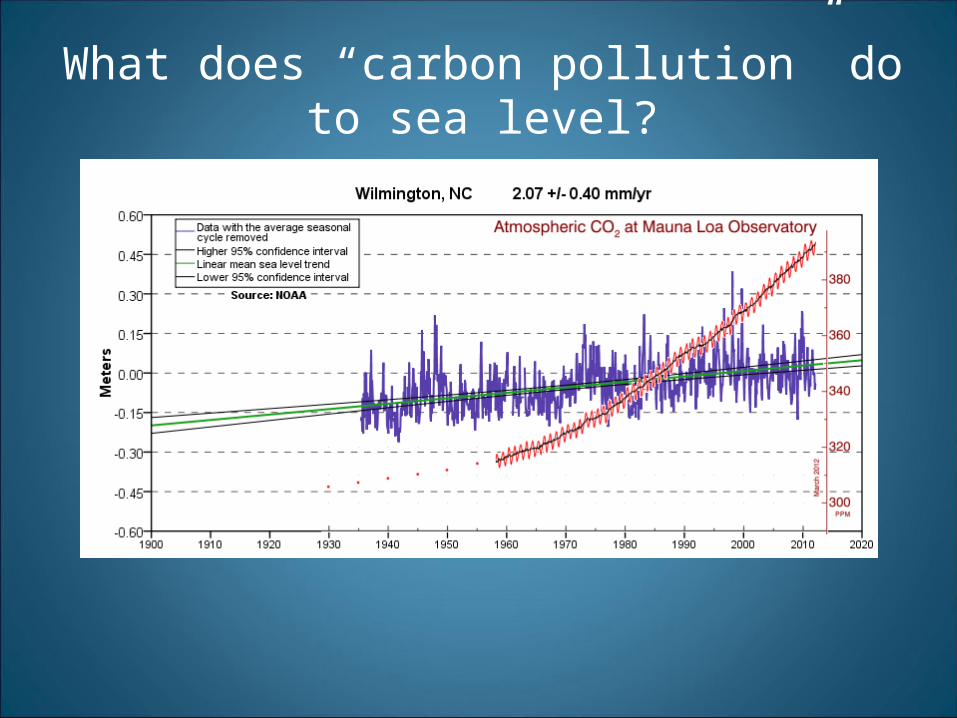
What does “carbon pollution” do to sea level?

Tide gauges show no acceleration
(Graphs downloaded from NOAA.gov)
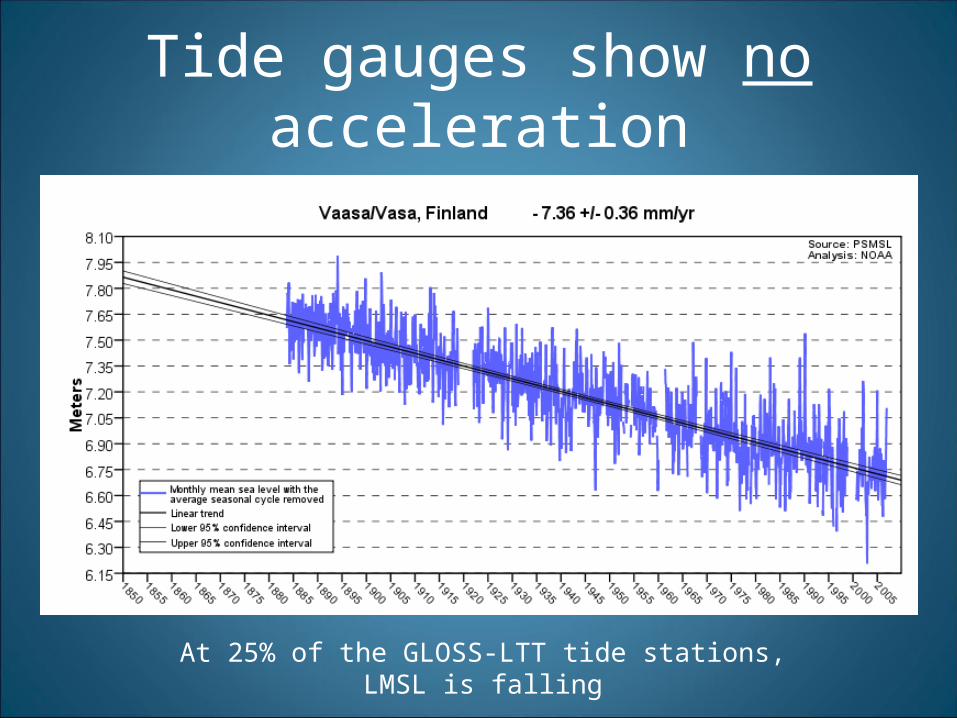
Tide gauges show no acceleration
At 25% of the GLOSS-LTT tide stations, LMSL is falling

Tide gauges show no acceleration

Digression:Why it varies: Subsidence & uplift
• Crust of the earth floats on a ball of molten magma, and it’s sloshing!
• Water, oil & natural gas wells – subsidence
• Northeastern NC has less bedrock than SE NC

Satellites show no acceleration

• No increase in rate of Sea Level Rise (no acceleration) in last ~80 years!
Take-away point:

How Much Sea Level Rise Should We Expect by 2100?

Claim:
(p.3): “This report synthesizes the best available science on SLR...”
No, it doesn’t!
But the Report’s problems are far from unique.

Climate misinformation is rampant
http://www.nsf.gov/about/history/nsf0050/arctic/seaice.htm
On the National Science Foundation web site…
For example…

Climate misinformation is rampant
http://www.nsf.gov/about/history/nsf0050/arctic/seaice.htm
…and any competent high school science teacher could tell you that it is nonsense. (Archimedes!)
On the National Science Foundation web site… for 6.5 years!

Climate misinformation is rampant
http://www.nsf.gov/about/history/nsf0050/arctic/seaice.htm
Finally fixed … after 6.5 years!

2010 NC SLR AR predicts huge acceleration in SLR
CRC Science Panel Report
Mythical acceleration

Sea level rises or falls at different rates in different places: -8 mm/year to +6 mm/year
So why Duck?

Why Duck?
CRC Science Panel Report

and around 3 mm per year (0.12 inches/yr) over the last fifteen years.
CRC Science Panel Report
Claim (p.6): “Currently, MSL is rising at a rate of approximately 2 mm per year (0.08 inches/yr) if averaged over the last hundred years,
Mythical acceleration
The rate of MSL rise has increased in response to global warming.”

• Douglas (1992), Journal of Geophysical Research (JGR), analyzed world- wide gauges and found a deceleration from 1905-1985
• Jevrejeva et al (2006), JGR, found a deceleration for 20th Century
• Holgate (2007), Geophysical Research Letters, found a deceleration from 1904-2003
• Church et al (2004), Journal of Climate, found no increase in the rate of sea level rise from 1950-2000
• Woodworth (2006), Philosophical Transactions of the Royal Society, said “... No definitive long-term acceleration of sea level has been identified using 20th Century data alone”
• Woodworth et al (2009), International Journal of Climatology, note “… little evidence has been found in individual gauge records for an ongoing positive acceleration of the sort suggested for the 20th Century by climate models”
Not According to the Peer Reviewed Literature
“Global Sea Level Change in the 20th Century and Recent Satellite Results”Bob Dean and Jim Houston NC-20, New Bern, NC October 7, 2011

Not According to the Peer Reviewed Literature
www.SeaLevel.info (click “papers”)

and around 3 mm per year (0.12 inches/yr) over the last fifteen years.
CRC Science Panel Report
Claim (p.6): “Currently, MSL is rising at a rate of approximately 2 mm per year (0.08 inches/yr) if averaged over the last hundred years,
Mythical acceleration
The rate of MSL rise has increased in response to global warming.”

• “2 mm/year” comes from averaging and adjusting coastal tide station trends
• “3 mm/year” is measurement of a different quantity: satellite-measured mid-ocean sea level.
Mythical acceleration
CRC Science Panel Report

No measurable acceleration to date
“...anticipated, but not-yet-observed, acceleration due to climate warming......it is important to note that most sea-level studies... do not observe any recent acceleration in the rate of rise.”
Spencer Rogers, June 1, 2012Coastal Construction and Erosion Specialist , NC Sea GrantMember, CRC Science Panel
• No actual increase in rate of SLR (“acceleration”) in last ~80 years!
CRC Science Panel Report

IPCC’s ThirdAssessment Report (2001)
“observational finding of no acceleration in sea level rise during the 20th century.”

SO, where does CRC Science Panel get their projected acceleration?
• Confusion: tide gauge vs. satellite data
• Church & White (2006)
• Rahmstorf (2007)

SO, where does CRC Science Panel get their projected acceleration?
• Confusion: tide gauge vs. satellite data
• Church & White (2006)
• Rahmstorf (2007)

Church and White (2006)Their claim: “A 20th century acceleration in global sea-level rise.”
• But “no 20th century acceleration has previously been detected” by other researchers.

Church and White (2006)But I reproduced their regression analysis, and found that all the acceleration was before 1925 (before most CO2 increase):
Church & White 2006 data, 1925-2001, minimum-variance unbiased estimator quadratic fit regression analysis showing a small deceleration in rate of sea level rise.

I told Drs. Church & White about it. Dr. Church replied:
Church and White (2009)In 2009, they posted updated data to their web site.
I applied their regression analysis method to the new data…
Result for 20th century: deceleration!
“…thank you … For the 1901 to 2007 period, again we agree with your result and get a non-significant and small deceleration.” (June 18, 2010 email attachment)

Sources for the error:
Acceleration myth
• Confusion: tide gauge vs. satellite data
• Church & White (2006)
• Rahmstorf (2007)

CRC Science Panel Report
“the Science Panel believes that the Rahmstorf method is robust and 1.4 meters a reasonable upper limit for projected rise.” [2010 NC SLR AR, p.11]
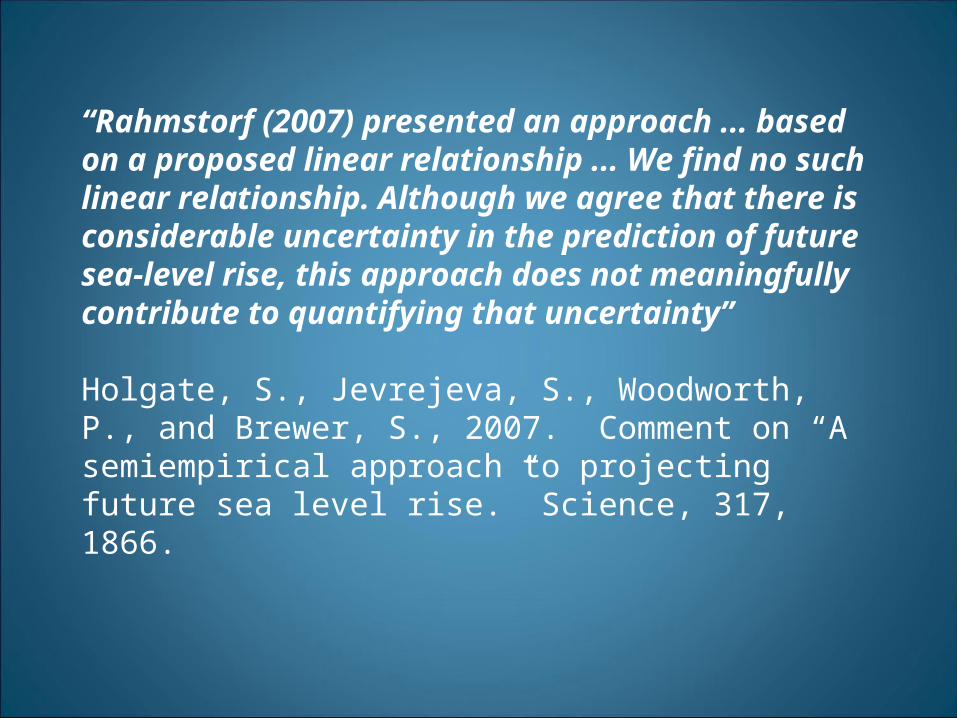
“Rahmstorf (2007) presented an approach ... based on a proposed linear relationship ... We find no such linear relationship. Although we agree that there is considerable uncertainty in the prediction of future sea-level rise, this approach does not meaningfully contribute to quantifying that uncertainty”
Holgate, S., Jevrejeva, S., Woodworth, P., and Brewer, S., 2007. Comment on “A semiempirical approach to projecting future sea level rise.” Science, 317, 1866.

“...this statistical analysis (Rahmstorf, 2007) is based on an application of statistics ... violating basic assumptions of the statistical methods used.”
Schmith, T., Johansen, S., and Thejll, 2007. Comment on “A Semi-Empirical Approach to projecting Future Sea-Level Rise,” Science, 317, 1866c.

“Rahmstorf and Vermeer (2011) have been selective in showing only data that appear to match their modeling and not the data that strongly disagree”
Houston, J.R. and Dean, R.G., 2011b. Discussion of “Sea-Level Acceleration Based on U.S. Tide Gauges and Extensions of Previous Global-Gauge Analyses” by J.R. Houston and R.G. Dean (Journal of Coastal Research, 27[3], 409-417, 2011): Response to Discussion by S. Rahmstorf and M. Vermeer (2011).

CRC Science Panel Report
“the Science Panel believes that the Rahmstorf method is robust and 1.4 meters a reasonable upper limit for projected rise.” [2010 NC SLR AR, p.11]
“In hindsight, the averaging period of 11 years that we used in the 2007 Science paper was too short to determine a robust climate trend…[Stefan Rahmstorf's 2009 mea culpa, on the RealClimate blog ]
“It turns out that Rahmstorf has pulled an elaborate practical joke on the Community…” [Steve McIntyre]
More on Rahmstorf’s Method here: tinyurl.com/rahmstuff

• Rahmstorf “projected sea-level rise in 2100 of 0.5 to 1.4 meters above the 1990 level.” (110 years)
• 2010 NC SLR Assessment Report projects for a 90 year period
CRC Science Panel Report

•Last ¾ century of anthropogenic CO2 (>30% increase) caused no acceleration in SLR.• Irrational and unscientific to presume that the next ¾ century will be different.
We’ve done the experiment!
Realistic projection for Wilmington and Southport is only about 7” by 2100 (10” for Morehead City, 16” for Duck)
P.S. -
Silliness in the news… any questions?
A “hotspot” of acceleration along the NE U.S. coast?
Greenland ice melting?
Anything else?

What everyone should know about “Global Warming” & Sea-Level Rise
By Dave BurtonMember, North Carolina Sea Level Rise Impact Study
Advisory Committee,IPCC AR5 Working Group 1 Expert Reviewer
Jacksonville, NC August 30, 2012
Slides will be here: http://www.sealevel.info/ppt/