Embed Size (px)
Citation preview
2nd IEAGHG Social Research Network Meeting, November 17-18, 2010, Yokohama City, Japan
What explains differences in change of initial perceptions of CO2 Capture and
Storage?A structural equation modelling analysis of data from
representative surveys in Germany and Norway
Diana Schumann (IEK-STE, Germany)Sturle D. Tvedt (SINTEF, Norway)
Mitg
lied
der H
elm
holtz
-Gem
eins
chaf
t

Institute of Energy and Climate Research November 17, 2010 Systems Analysis and Technology Evaluation (IEK-STE) Diana Schumann / 2
OutlinePoint of departureMeasuring change in initial perceptionsDifferences in change in initial perceptions in Germany and NorwayThe structural equation model (SEM)Preliminary results of testing the model with the German dataDiscussionNext steps for model application
Institute of Energy and Climate Research November 17, 2010 Systems Analysis and Technology Evaluation (IEK-STE) Diana Schumann / 3
Point of departure
It can be assumed that the majority of initial perceptions of CO2 capture and storage (CCS) are pseudo-opinionsPseudo-opinions are of low quality, i.e. inconsistent, unstable and people feel not confident about themPseudo-opinions can easily be changed by contextual information or slight changes in mood (cf. De Best-Waldhober et al. 2008)
Institute of Energy and Climate Research November 17, 2010 Systems Analysis and Technology Evaluation (IEK-STE) Diana Schumann / 4
Point of departure (II)
Results of representative surveys in Germany and Norway, carried out in 2009, also showed that initial perceptions of CCS are unstableHowever, the degree of change in initial perceptions of CCS systematically differ between German and Norwegian respondentsHow can these differences of changes in initial perceptions be explained?

Institute of Energy and Climate Research November 17, 2010 Systems Analysis and Technology Evaluation (IEK-STE) Diana Schumann / 5
Measuring change in initial perceptions of CCSTwo kinds of initial perceptions: 1) Regarding the use of CCS to address global
warming (general idea of CCS)2) Regarding the permission of a CCS demo plant
(concrete proposal of CCS)Both were surveyed before and after receiving information about CCS

Institute of Energy and Climate Research November 17, 2010 Systems Analysis and Technology Evaluation (IEK-STE) Diana Schumann / 6
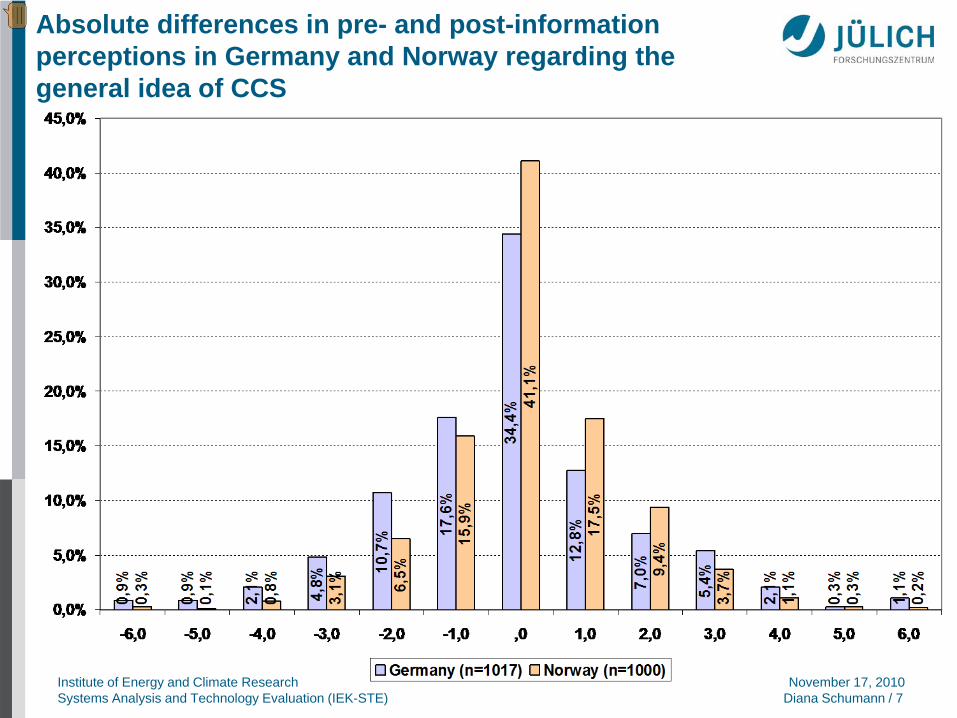
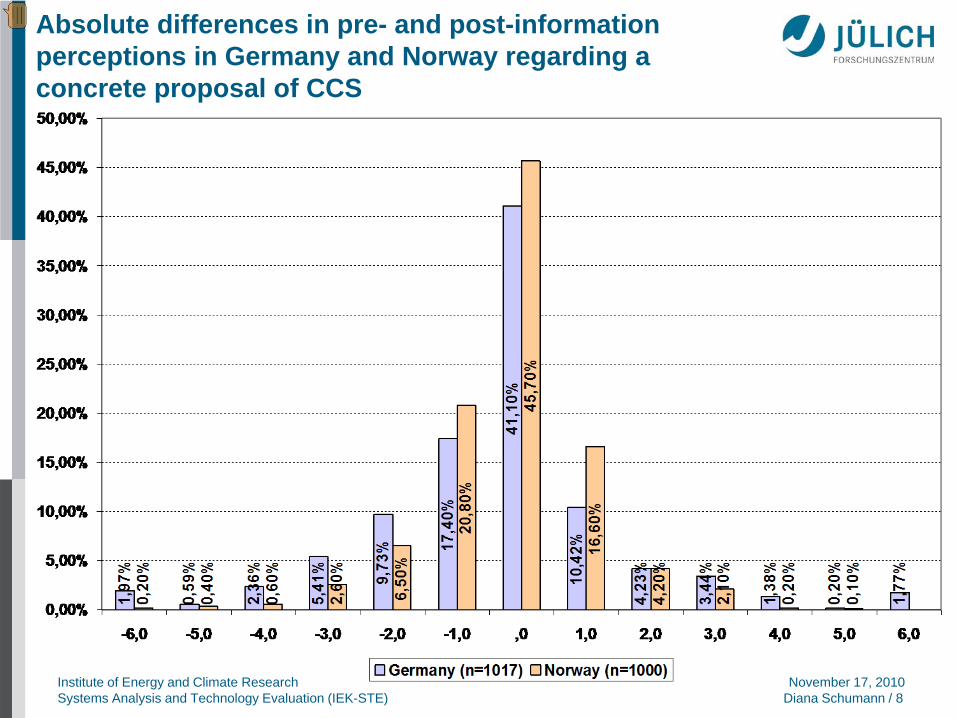
Measuring change in initial perceptions of CCS (II)Calculating the absolute differences between pre-information and post-information perceptions regarding the general idea and a concrete proposal of CCSDirections of change: negative change/positive changeExtent of change: slight change/”extreme” change
Institute of Energy and Climate Research November 17, 2010 Systems Analysis and Technology Evaluation (IEK-STE) Diana Schumann / 7
Absolute differences in pre- and post-information perceptions in Germany and Norway regarding the general idea of CCS
Institute of Energy and Climate Research November 17, 2010 Systems Analysis and Technology Evaluation (IEK-STE) Diana Schumann / 8
Absolute differences in pre- and post-information perceptions in Germany and Norway regarding a concrete proposal of CCS

Institute of Energy and Climate Research November 17, 2010 Systems Analysis and Technology Evaluation (IEK-STE) Diana Schumann / 9
Research questionsWhat are relevant factors for the change in initial perceptions?Do the factors which are relevant for the change in initial perceptions of CCS in Germany and Norway systematically differ?If yes, do these factors explain the differences in the change in initial perceptions between Germany and Norway?In order to investigate these questions structural equation modelling (SEM) is used

Institute of Energy and Climate Research November 17, 2010 Systems Analysis and Technology Evaluation (IEK-STE) Diana Schumann / 10
Why structural equation modelling?Structural equation modelling (SEM) incorporates and integrates various statistical techniques such as path analysis and factor analysisMost important advantage: SEM allows to model and test complex patterns of relationships, including a multitude of hypotheses simultaneously as a whole, including mean structure and group comparisons
Institute of Energy and Climate Research November 17, 2010 Systems Analysis and Technology Evaluation (IEK-STE) Diana Schumann / 11
Components of a structural equation modelA full structural equation model consists of three parts:
measurement model of latent exogenous variables,structural model, measurement model of latent endogenous variables

Institute of Energy and Climate Research November 17, 2010 Systems Analysis and Technology Evaluation (IEK-STE) Diana Schumann / 12
Measurement model of latent exogenous variables
Institute of Energy and Climate Research November 17, 2010 Systems Analysis and Technology Evaluation (IEK-STE) Diana Schumann / 13
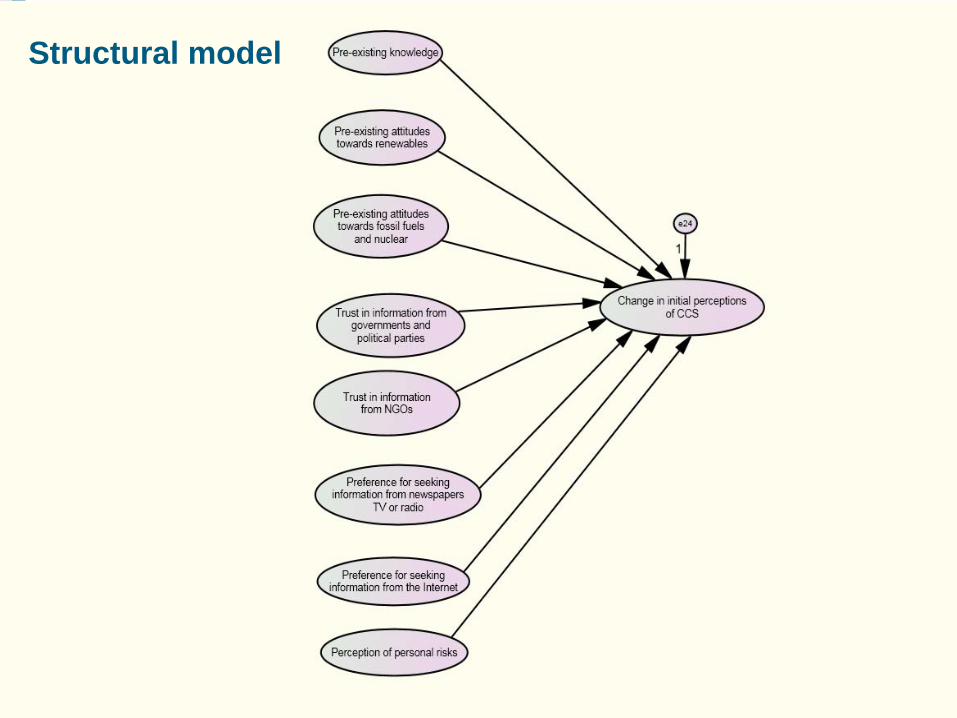
Structural model

Institute of Energy and Climate Research November 17, 2010 Systems Analysis and Technology Evaluation (IEK-STE) Diana Schumann / 14
Measurement model of the latent endogenous variables
Institute of Energy and Climate Research November 17, 2010 Systems Analysis and Technology Evaluation (IEK-STE) Diana Schumann / 15
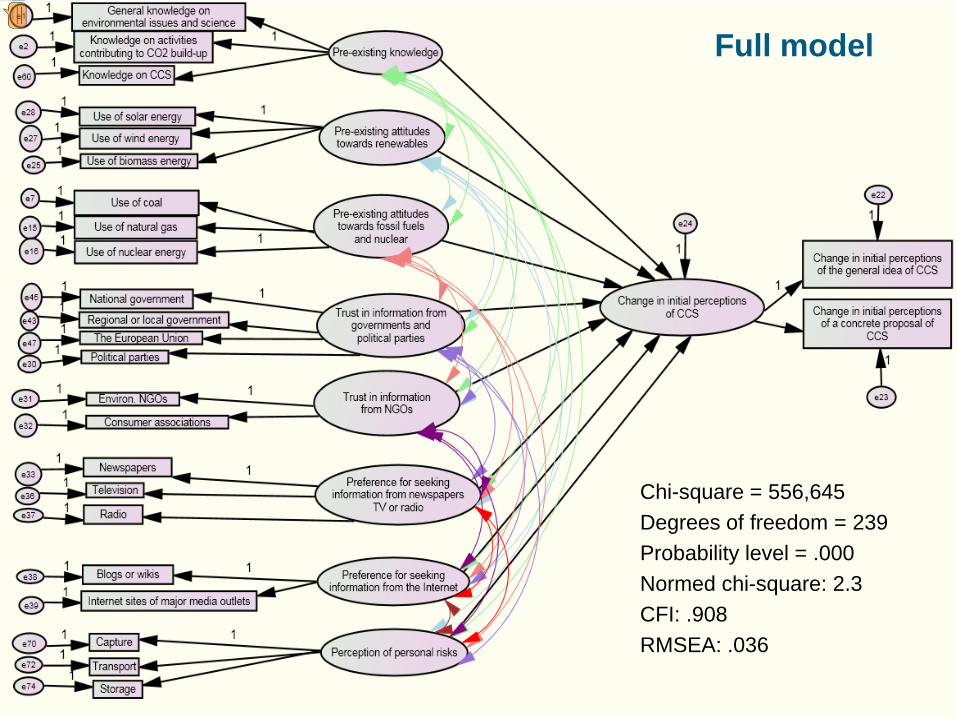
Full model
Chi-square = 556,645Degrees of freedom = 239Probability level = .000Normed chi-square: 2.3CFI: .908RMSEA: .036
Institute of Energy and Climate Research November 17, 2010 Systems Analysis and Technology Evaluation (IEK-STE) Diana Schumann / 16
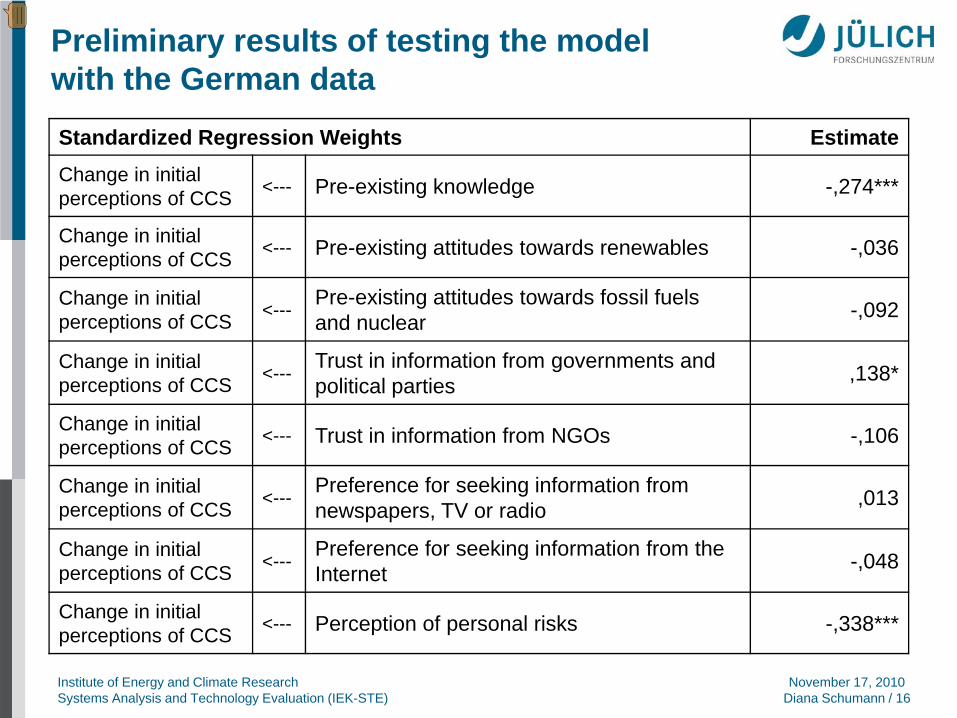
Preliminary results of testing the model with the German dataStandardized Regression Weights EstimateChange in initial perceptions of CCS <--- Pre-existing knowledge -,274***
Change in initial perceptions of CCS <--- Pre-existing attitudes towards renewables -,036
Change in initial perceptions of CCS <--- Pre-existing attitudes towards fossil fuels
and nuclear -,092
Change in initial perceptions of CCS <--- Trust in information from governments and
political parties ,138*
Change in initial perceptions of CCS <--- Trust in information from NGOs -,106
Change in initial perceptions of CCS <--- Preference for seeking information from
newspapers, TV or radio ,013
Change in initial perceptions of CCS <--- Preference for seeking information from the
Internet -,048
Change in initial perceptions of CCS <--- Perception of personal risks -,338***

Institute of Energy and Climate Research November 17, 2010 Systems Analysis and Technology Evaluation (IEK-STE) Diana Schumann / 17
Preliminary results of testing the model with the German data (II)
Covariances Esti-mate S.E. C.R. P
Pre-existing knowledge <--> Perception of personal risks ,002 ,018 ,134 ,893
Pre-existing knowledge <--> Preference for seeking
information from the Internet ,206 ,042 4,889 ***
Pre-existing knowledge <-->
Preference for seeking information from newspapers, TV or radio
-,088 ,020 -4,451 ***
Pre-existing knowledge <--> Trust in information from NGOs ,076 ,019 3,962 ***
Pre-existing knowledge <--> Pre-existing attitudes towards
fossil fuels and nuclear -,150 ,028 -5,380 ***
Pre-existing knowledge <--> Trust in information from
governments and political parties -,031 ,019 -1,633 ,103
Pre-existing knowledge <--> Pre-existing attitudes towards
renewables ,039 ,014 2,769 ,006
Institute of Energy and Climate Research November 17, 2010 Systems Analysis and Technology Evaluation (IEK-STE) Diana Schumann / 18
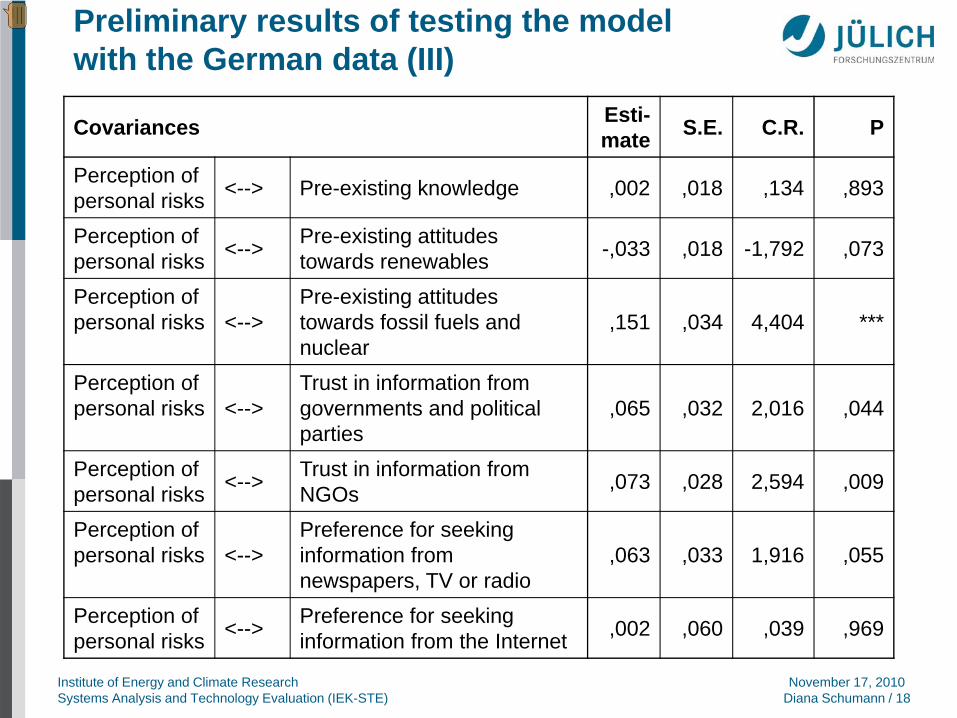
Preliminary results of testing the model with the German data (III)
Covariances Esti-mate S.E. C.R. P
Perception of personal risks <--> Pre-existing knowledge ,002 ,018 ,134 ,893
Perception of personal risks <--> Pre-existing attitudes
towards renewables -,033 ,018 -1,792 ,073
Perception of personal risks <-->
Pre-existing attitudes towards fossil fuels and nuclear
,151 ,034 4,404 ***
Perception of personal risks <-->
Trust in information from governments and political parties
,065 ,032 2,016 ,044
Perception of personal risks <--> Trust in information from
NGOs ,073 ,028 2,594 ,009
Perception of personal risks <-->
Preference for seeking information from newspapers, TV or radio
,063 ,033 1,916 ,055
Perception of personal risks <--> Preference for seeking
information from the Internet ,002 ,060 ,039 ,969
Institute of Energy and Climate Research November 17, 2010 Systems Analysis and Technology Evaluation (IEK-STE) Diana Schumann / 19
Discussion
Preliminary results of testing the model with the German data indicate that knowledge as well as perceptions of personal risks can increase the stability of initial perceptions of CCSHowever, the results also indicates that knowledge and risk perceptions of CCS are not correlated (what is also known from other technologies)Risk perceptions of lay persons regarding CCS cannot easily be changed by increasing their knowledge

Institute of Energy and Climate Research November 17, 2010 Systems Analysis and Technology Evaluation (IEK-STE) Diana Schumann / 20
Next steps for model application
Scrutinizing the plausibility of the model results in more detailCarrying out sensitivity analyses (e.g. variation of definition of constraints)Running the model with the Norwegian dataCarrying out multigroup analyses with the German and Norwegian data
Institute of Energy and Climate Research November 17, 2010 Systems Analysis and Technology Evaluation (IEK-STE) Diana Schumann / 21
Thank you very much for your attention!

Institute of Energy and Climate Research November 17, 2010 Systems Analysis and Technology Evaluation (IEK-STE) Diana Schumann / 22
Preliminary results of testing the model with the German data
Correlations Estimate
Pre-existing knowledge <--> Perception of personal risks ,006
Pre-existing knowledge <--> Preference for seeking information from the
Internet ,198***
Pre-existing knowledge <--> Preference for seeking information from
newspapers, TV or radio -,202***
Pre-existing knowledge <--> Trust in information from NGOs ,197***
Pre-existing knowledge <--> Pre-existing attitudes towards fossil fuels and
nuclear -,299***
Pre-existing knowledge <--> Trust in information from governments and
political parties -,060
Pre-existing knowledge <--> Pre-existing attitudes towards renewables ,158**
Institute of Energy and Climate Research November 17, 2010 Systems Analysis and Technology Evaluation (IEK-STE) Diana Schumann / 23
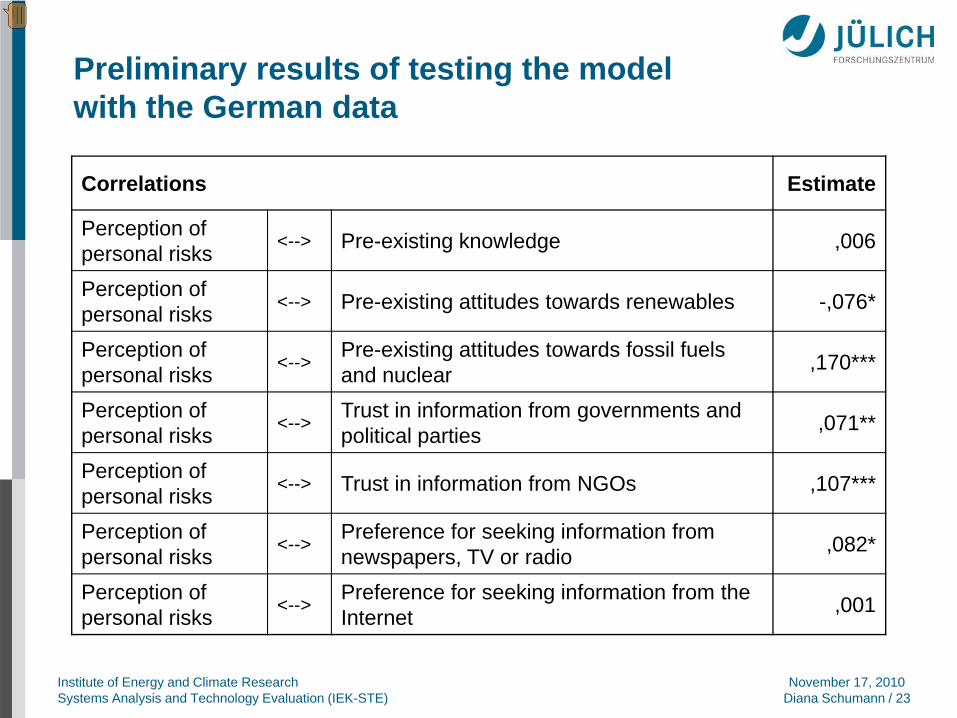
Preliminary results of testing the model with the German data
Correlations Estimate
Perception of personal risks <--> Pre-existing knowledge ,006
Perception of personal risks <--> Pre-existing attitudes towards renewables -,076*
Perception of personal risks <--> Pre-existing attitudes towards fossil fuels
and nuclear ,170***
Perception of personal risks <--> Trust in information from governments and
political parties ,071**
Perception of personal risks <--> Trust in information from NGOs ,107***
Perception of personal risks <--> Preference for seeking information from
newspapers, TV or radio ,082*
Perception of personal risks <--> Preference for seeking information from the
Internet ,001