Embed Size (px)
Citation preview

OECD Employment Outlook 2012
© OECD 2012
109
Chapter 3
Labour Losing to Capital: What Explains the Declining Labour Share?
During the past three decades, the share of national income represented by wages,salaries and benefits – the labour share – has declined in nearly all OECD countries.The chapter examines the drivers of this decline, stressing the role played by factorssuch as increased productivity and capital-deepening, increased domestic andinternational competition, the reduction of workers’ bargaining power and theevolution of collective bargaining institutions. The decline of the labour share wenthand-in-hand with greater inequality in the distribution of market income, whichmight endanger social cohesion and slow down the current recovery. Enhancedinvestment in education and use of the tax and transfer system can effectivelyreduce these risks.
3. LABOUR LOSING TO CAPITAL: WHAT EXPLAINS THE DECLINING LABOUR SHARE?
OECD EMPLOYMENT OUTLOOK 2012 © OECD 2012110
Key findingsIn recent decades, the labour share, or the share of labour compensation (wage,
salaries and benefits) in the total national income, has been declining in almost all OECD
countries. The median labour share dropped to 61.7% in the late 2000s, from 66.1% in the
early 1990s and in some countries this decline began over 30 years ago.
A declining labour share does not necessarily imply declining living standards for
workers, however. Even if average real labour incomes have grown less rapidly than
incomes from capital, workers may still be better off to the extent the decline in the labour
share was accompanied by faster economic growth. Nevertheless, the decline in the overall
labour share hides significant differences across earning groups. On average, the wage
income share of the top 1% of income earners increased by 20% in the countries for which
data are available over the past two decades. By contrast, despite rising employment at the
bottom end of the skill ladder, the wage share of the lowest educated slumped. This
suggests that the position of certain workers, notably the least educated, in the income
distribution worsened over the period. To the extent that less wealthy people tend to have
a higher consumption propensity, the worsening of their labour income share might have
an adverse effect on the level of aggregate demand and on how quickly economies can
recover from the recent crisis. More generally, the unequal distribution of both labour and
capital income growth that went hand-in-hand with the decline of the labour share
suggests that these trends might endanger social cohesion.
What explains the decline of the labour share? Total factor productivity (TFP) growth and
capital deepening – the key drivers of economic growth – are estimated to jointly account for
as much as 80% of the average within-industry decline of the labour share in OECD
countries between 1990 and 2007. This is consistent with the idea advanced by many
studies that the spread of information and communication technologies (ICTs) has created
opportunities not only for unprecedented advances in innovation and invention of new
capital goods and production processes, thereby boosting productivity, but also for
replacing workers with machines for certain types of jobs, notably those involving routine
tasks.
There is also evidence that another driver of economic growth, the rise in domestic and
international competition, had an impact on the labour share. In advanced economies, at least
10% of the decline of the labour share is accounted for by increasing globalisation – and in
particular by the pressures from the delocalisation of some parts of the production chain
as well as from import competition from firms producing in countries with low labour cost.
The significant trend towards reducing public ownership of companies operating in the
business sector also appears to have played an important part in shrinking the labour
share, probably through the impact of privatisation on incentives for profit maximisation.
This has been particularly the case in network industries, such as energy, transport and
communications, where this process was of paramount importance. In fact, large-scale
privatisation of network industries since the early 1990, while leading to strong
3. LABOUR LOSING TO CAPITAL: WHAT EXPLAINS THE DECLINING LABOUR SHARE?
OECD EMPLOYMENT OUTLOOK 2012 © OECD 2012 111
productivity enhancements, can also explain about 33% of the decline of the labour share
in these industries. By contrast, there is no evidence that deregulation of inward foreign
direct investment (FDI) had any negative impact on the labour share.
The reduction in the labour share associated with increased domestic and
international competition and reduction in public ownership could be partly explained by
their effect on workers bargaining power. There is evidence in the literature that increased
competitive pressures not only reduce the size of the rent that employers and workers
share, but also decrease the bargaining power of workers, particularly those who are low-
skilled, and thus their ability to appropriate their share. Increased import flows raise the
substitution between domestic and foreign workers, while the possibility of offshoring
improves the position of employers in bargaining. Lifting entry barriers brings new workers
into the industry, who tend to be less unionised and have less bargaining power than
workers with long job tenures in incumbent firms.
By raising the pressures on employers to reduce costs and reducing the bargaining
power of workers, increased domestic and international competition also appears to have
shaped the evolution of the coverage and structure of collective bargaining institutions. Trade
union membership has been falling in most countries and collective bargaining coverage
declined significantly in many countries, implying that an increasing share of workers
have their wage set individually. In countries with multi-employer bargaining systems,
when co-ordination between social partners was not sufficient, centralised agreements
have often been used to obtain the wage moderation required to preserve competitiveness.
At the same time, significant decentralisation has taken place in most countries, as
employers felt simultaneously the need to adjust more speedily to wage competition from
domestic or international competitors and less need for collective protection from trade
union pressure in bargaining. Compared with more centralised collective bargaining
system, local wage bargaining tends to increase wage dispersion, so that decentralisation
together with lower collective bargaining coverage probably explains part of the
deterioration of low-skilled workers’ position.
The role played by those labour market policies that typically have a strong impact on
productivity growth, such as statutory minimum wages and employment protection, is also
examined in the chapter. While the impact of the latter on the labour share is found to be
negligible, minimum wages are estimated to depress the labour share in the long-run. A
higher minimum wage is likely to induce greater investment in labour-saving innovations
and firm-sponsored training, whose benefits, in imperfect labour markets, are not fully
reaped by workers in terms of higher wages. However, the contribution of changes in
minimum wages to the observed decline of the labour share appears minor.
Should policy respond to the declining labour share and if so how? Slowing down
some of the key driving forces – technological progress and globalisation – is not a viable
option insofar as these are the key drivers of economic growth that determines the size of
the pie to be split between labour and capital. Governments can sometimes modify the
direction of technical change towards labour-augmenting technologies through tax
incentives and subsidies. But these interventions run risks insofar as they might distort the
pace and efficiency of the allocation of resources and thus depress growth in the long-run.
Alternatively and more promising, governments can equip workers to win the “race
against the machine”. Further investment in human capital, in particular by curbing the
number of school dropouts and ensuring a better match between skills taught in school
3. LABOUR LOSING TO CAPITAL: WHAT EXPLAINS THE DECLINING LABOUR SHARE?
OECD EMPLOYMENT OUTLOOK 2012 © OECD 2012112
and those in demand in the market, can go a long way to tackling the decline in the labour
share. Finally, the tax and transfer system can be used to minimise the impact of growing
inequality in market incomes on inequality in household disposable income.
IntroductionIn recent decades, the aggregate labour share – the ratio of labour compensation to
domestic output – has been declining in almost all OECD countries. In times of economic
recession, this decline has typically paused, but then subsequently resumed with a
recovery. The recent economic and financial crisis and subsequent sluggish recovery have
not deviated from this general pattern. This suggests that workers are receiving an
increasingly smaller share of national income.1
Should policy makers be concerned about these developments? In essentially all OECD
countries, while the fraction of national income going to labour decreased, economic
growth was still sufficiently rapid so that real labour compensation increased and, it has
been argued,2 the average worker is now better off. However, there is evidence that not all
workers have fared the same. Recent work has shown that labour compensation of top
income earners, both in private companies and government-controlled enterprises and
organisations, has increased dramatically (e.g. Saez and Veall, 2005; Atkinson et al., 2011),
while the position of people at the bottom end of the distribution has been worsening. This
has meant that the pre-tax distribution of income has become more unequal in most OECD
countries (see, for example, OECD, 2008a, 2011a). There is a risk that this tendency, coupled
with diverging trends between the average labour share and the average capital share,
becomes a threat to social cohesion. Moreover, the shift of income away from labour (and,
in particular, away from low-wage workers) towards capital (and top earners) might also
have a negative impact on aggregate demand, to the extent that workers with below-
average pay tend to have a higher consumption propensity than do top earners and
capitalists (see, for example, Dynan et al., 2004), which might result in a particularly
adverse effect on the speed of the recovery.
The chapter examines the recent evolution of the labour share at the aggregate and
industry level and links its observed decline with a number of possible determinants. In
particular, several explanations for the decline in the labour share have been put forward
by the literature. These include: structural transformations in the OECD economies
involving the reallocation of resources away from high-labour-share industries,
globalisation and outsourcing, increasingly faster labour-saving capital accumulation,
skill-biased technical change, privatisation of state-owned enterprises, changes in
collective bargaining systems, and the fall in workers’ bargaining power. This chapter
examines all of these explanations, identifies the key factors behind the decline in the
labour share and discusses their policy implications. In order to do so, the analysis relies
on comparable cross-country time-series of industry-level data, so that the impact of
different factors on the labour share can be identified while taking care of potential
endogeneity.
The chapter is organised as follows. Section 1 reviews the evolution of the aggregate
and industry-level labour shares and assesses the different roles of within-industry
changes and sectoral reallocation. It also considers the evolution of shares for different
workers, in particular by looking at levels of education. Section 2 focuses on the
determinants of within-industry changes in the labour share that are only indirectly
3. LABOUR LOSING TO CAPITAL: WHAT EXPLAINS THE DECLINING LABOUR SHARE?
OECD EMPLOYMENT OUTLOOK 2012 © OECD 2012 113
related to labour market institutions, namely capital accumulation and technology,
globalisation, privatisation and product market liberalisation. The role of collective
bargaining and changes in workers’ bargaining power is examined in detail in Section 3,
while Section 4 investigates the role of employment protection and the minimum wage.
The key results of the chapter and their implications for policy are summarised in the
concluding section.
1. Trends in the labour share
The evolution of the labour share in the past two decades
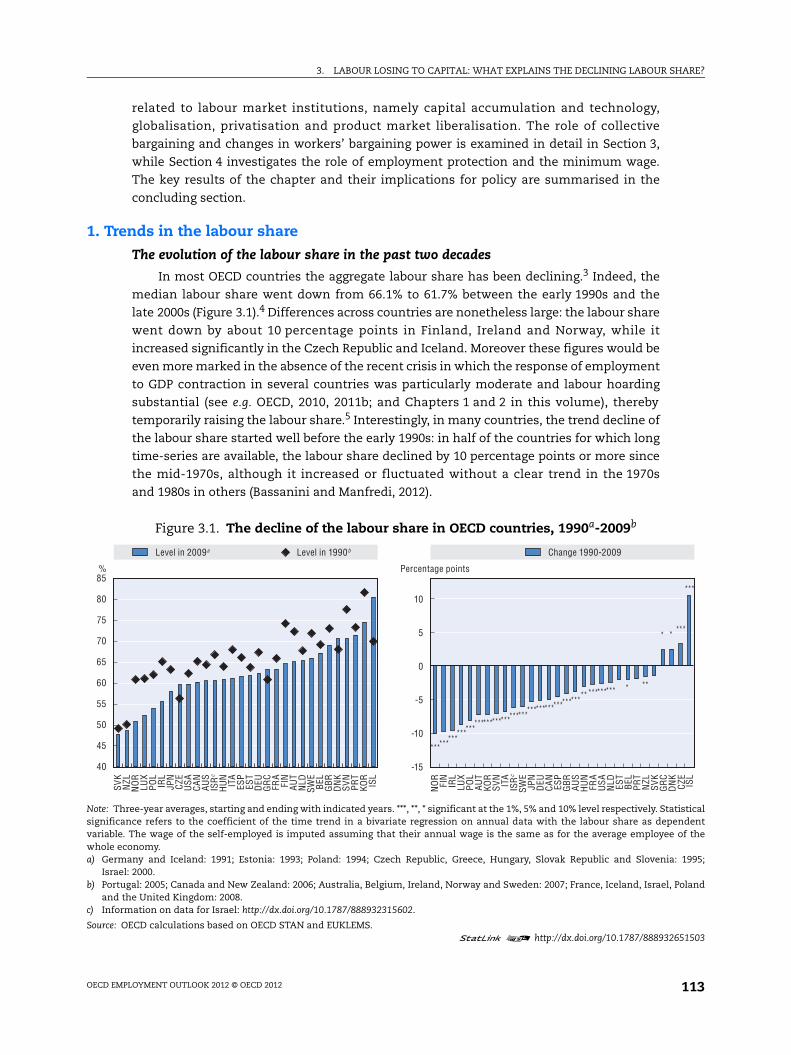
In most OECD countries the aggregate labour share has been declining.3 Indeed, the
median labour share went down from 66.1% to 61.7% between the early 1990s and the
late 2000s (Figure 3.1).4 Differences across countries are nonetheless large: the labour share
went down by about 10 percentage points in Finland, Ireland and Norway, while it
increased significantly in the Czech Republic and Iceland. Moreover these figures would be
even more marked in the absence of the recent crisis in which the response of employment
to GDP contraction in several countries was particularly moderate and labour hoarding
substantial (see e.g. OECD, 2010, 2011b; and Chapters 1 and 2 in this volume), thereby
temporarily raising the labour share.5 Interestingly, in many countries, the trend decline of
the labour share started well before the early 1990s: in half of the countries for which long
time-series are available, the labour share declined by 10 percentage points or more since
the mid-1970s, although it increased or fluctuated without a clear trend in the 1970s
and 1980s in others (Bassanini and Manfredi, 2012).
Figure 3.1. The decline of the labour share in OECD countries, 1990a-2009b
Note: Three-year averages, starting and ending with indicated years. ***, **, * significant at the 1%, 5% and 10% level respectively. Statisticalsignificance refers to the coefficient of the time trend in a bivariate regression on annual data with the labour share as dependentvariable. The wage of the self-employed is imputed assuming that their annual wage is the same as for the average employee of thewhole economy.a) Germany and Iceland: 1991; Estonia: 1993; Poland: 1994; Czech Republic, Greece, Hungary, Slovak Republic and Slovenia: 1995;
Israel: 2000.b) Portugal: 2005; Canada and New Zealand: 2006; Australia, Belgium, Ireland, Norway and Sweden: 2007; France, Iceland, Israel, Poland
and the United Kingdom: 2008.c) Information on data for Israel: http://dx.doi.org/10.1787/888932315602.
Source: OECD calculations based on OECD STAN and EUKLEMS.1 2 http://dx.doi.org/10.1787/888932651503
85
80
75
70
65
60
55
50
45
40
10
5
0
-5
-10
-15
SVK
NZL
NO
R L
UX
PO
L I
RL
JPN
CZE
CZE
USA
CAN
AU
S I
SRc
HU
N I
TA E
SP E
ST D
EU G
RC
FR
A F
IN A
UT
NLD
SWE
BEL
GBR
DN
K S
VN P
RT
KO
R
NO
RFI
NIR
LLU
XPO
LAU
T K
OR
SVN
ITA
ISR
c
SWE
JPN
DEU
CAN
ESP
GBR AU
SH
UN
FRA
USA
NLD
EST
BEL
PR
T N
ZL S
VK G
RC
DN
K
ISL
ISL
%
***************************************************** ********* * **
* * ***
***
Percentage points
Level in 2009a Level in 1990b Change 1990-2009
3. LABOUR LOSING TO CAPITAL: WHAT EXPLAINS THE DECLINING LABOUR SHARE?
OECD EMPLOYMENT OUTLOOK 2012 © OECD 2012114
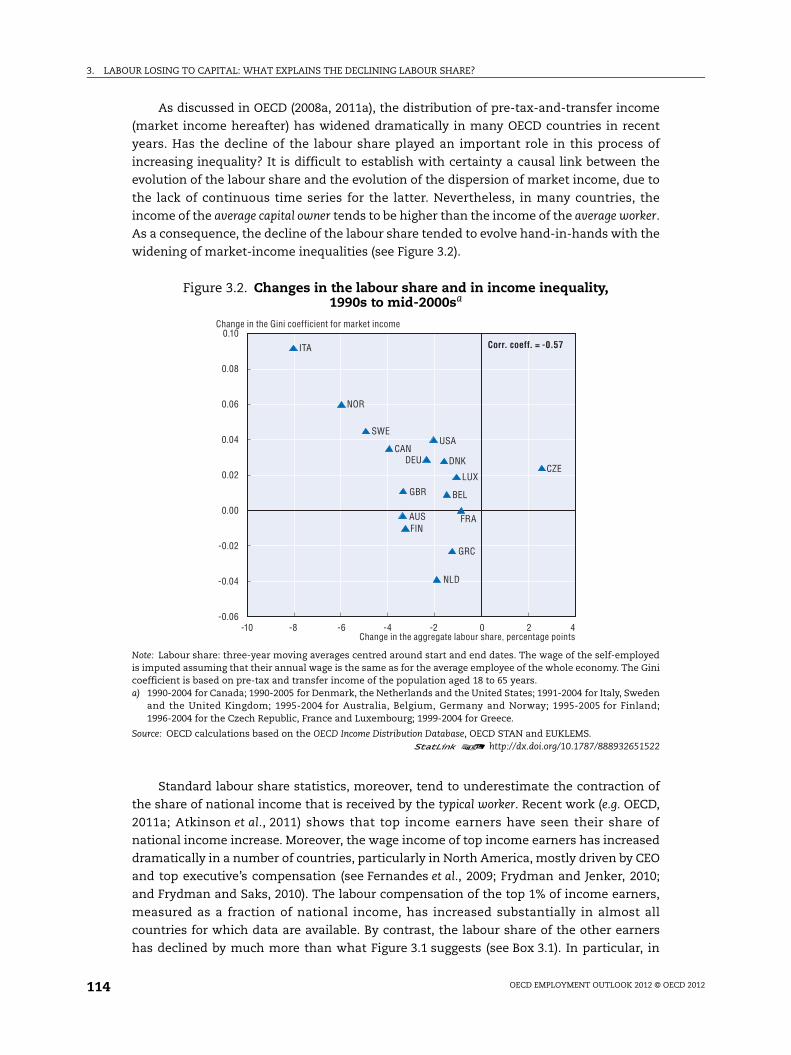
As discussed in OECD (2008a, 2011a), the distribution of pre-tax-and-transfer income
(market income hereafter) has widened dramatically in many OECD countries in recent
years. Has the decline of the labour share played an important role in this process of
increasing inequality? It is difficult to establish with certainty a causal link between the
evolution of the labour share and the evolution of the dispersion of market income, due to
the lack of continuous time series for the latter. Nevertheless, in many countries, the
income of the average capital owner tends to be higher than the income of the average worker.
As a consequence, the decline of the labour share tended to evolve hand-in-hands with the
widening of market-income inequalities (see Figure 3.2).
Standard labour share statistics, moreover, tend to underestimate the contraction of
the share of national income that is received by the typical worker. Recent work (e.g. OECD,
2011a; Atkinson et al., 2011) shows that top income earners have seen their share of
national income increase. Moreover, the wage income of top income earners has increased
dramatically in a number of countries, particularly in North America, mostly driven by CEO
and top executive’s compensation (see Fernandes et al., 2009; Frydman and Jenker, 2010;
and Frydman and Saks, 2010). The labour compensation of the top 1% of income earners,
measured as a fraction of national income, has increased substantially in almost all
countries for which data are available. By contrast, the labour share of the other earners
has declined by much more than what Figure 3.1 suggests (see Box 3.1). In particular, in
Figure 3.2. Changes in the labour share and in income inequality, 1990s to mid-2000sa
Note: Labour share: three-year moving averages centred around start and end dates. The wage of the self-employedis imputed assuming that their annual wage is the same as for the average employee of the whole economy. The Ginicoefficient is based on pre-tax and transfer income of the population aged 18 to 65 years.a) 1990-2004 for Canada; 1990-2005 for Denmark, the Netherlands and the United States; 1991-2004 for Italy, Sweden
and the United Kingdom; 1995-2004 for Australia, Belgium, Germany and Norway; 1995-2005 for Finland;1996-2004 for the Czech Republic, France and Luxembourg; 1999-2004 for Greece.
Source: OECD calculations based on the OECD Income Distribution Database, OECD STAN and EUKLEMS.1 2 http://dx.doi.org/10.1787/888932651522
0.10
0.08
0.06
0.04
0.02
0.00
-0.02
-0.04
-0.06-10 -8 -6 -4 -2 0 2 4
AUS
BEL
CAN
CZEDEU DNK
FINFRA
GBR
GRC
ITA
LUX
NLD
NOR
SWEUSA
Change in the aggregate labour share, percentage points
Change in the Gini coefficient for market income
Corr. coeff. = -0.57
3. LABOUR LOSING TO CAPITAL: WHAT EXPLAINS THE DECLINING LABOUR SHARE?
OECD EMPLOYMENT OUTLOOK 2012 © OECD 2012 115
Box 3.1. Trends in the labour share excluding top-income earners
In recent years, long time series on income of top earners have become available for many countries(see e.g. Atkinson et al., 2011). This evidence shows a general upward trend for the share of top incomeearners on total income. For example, in OECD countries for which data are available, the share of the top1% of earners has increased on average from 6.7% to 10.3% between the mid-1970s and the mid-2000s. Thisstylised fact has fuelled much of the recent debate on inequality (see OECD, 2011a).
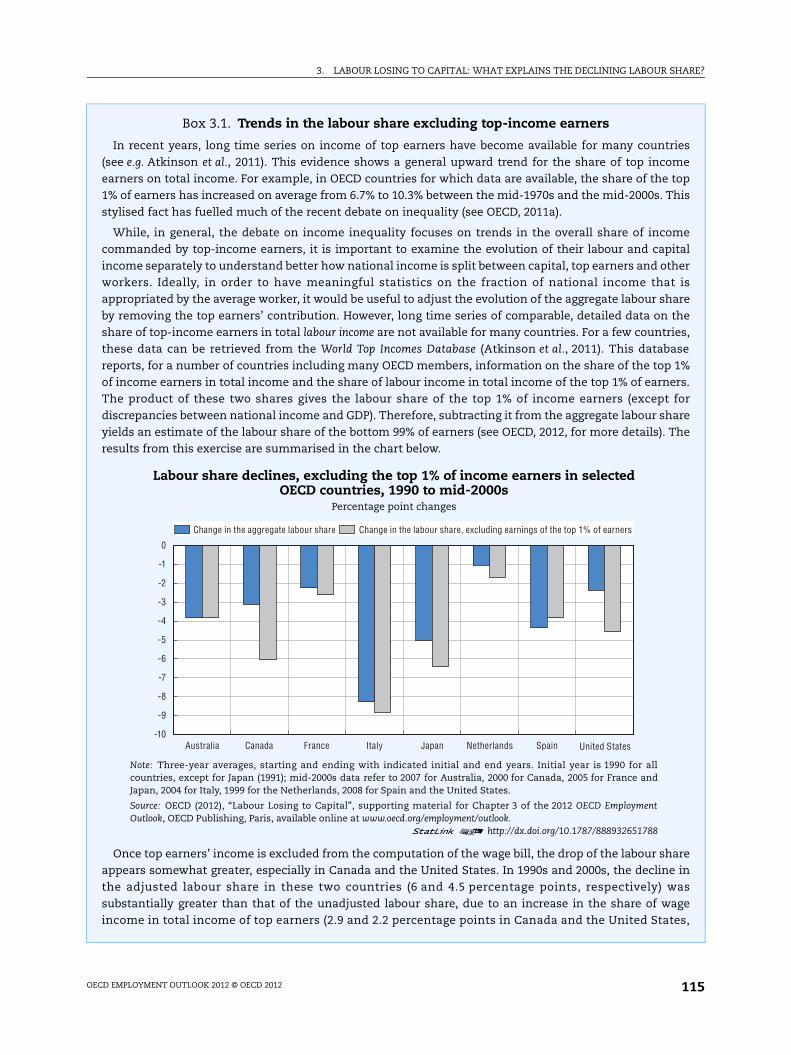
While, in general, the debate on income inequality focuses on trends in the overall share of incomecommanded by top-income earners, it is important to examine the evolution of their labour and capitalincome separately to understand better how national income is split between capital, top earners and otherworkers. Ideally, in order to have meaningful statistics on the fraction of national income that isappropriated by the average worker, it would be useful to adjust the evolution of the aggregate labour shareby removing the top earners’ contribution. However, long time series of comparable, detailed data on theshare of top-income earners in total labour income are not available for many countries. For a few countries,these data can be retrieved from the World Top Incomes Database (Atkinson et al., 2011). This databasereports, for a number of countries including many OECD members, information on the share of the top 1%of income earners in total income and the share of labour income in total income of the top 1% of earners.The product of these two shares gives the labour share of the top 1% of income earners (except fordiscrepancies between national income and GDP). Therefore, subtracting it from the aggregate labour shareyields an estimate of the labour share of the bottom 99% of earners (see OECD, 2012, for more details). Theresults from this exercise are summarised in the chart below.
Once top earners’ income is excluded from the computation of the wage bill, the drop of the labour shareappears somewhat greater, especially in Canada and the United States. In 1990s and 2000s, the decline inthe adjusted labour share in these two countries (6 and 4.5 percentage points, respectively) wassubstantially greater than that of the unadjusted labour share, due to an increase in the share of wageincome in total income of top earners (2.9 and 2.2 percentage points in Canada and the United States,
Labour share declines, excluding the top 1% of income earners in selected OECD countries, 1990 to mid-2000s
Percentage point changes
Note: Three-year averages, starting and ending with indicated initial and end years. Initial year is 1990 for allcountries, except for Japan (1991); mid-2000s data refer to 2007 for Australia, 2000 for Canada, 2005 for France andJapan, 2004 for Italy, 1999 for the Netherlands, 2008 for Spain and the United States.
Source: OECD (2012), “Labour Losing to Capital”, supporting material for Chapter 3 of the 2012 OECD EmploymentOutlook, OECD Publishing, Paris, available online at www.oecd.org/employment/outlook.
1 2 http://dx.doi.org/10.1787/888932651788
0
-1
-2
-3
-4
-5
-6
-7
-8
-9
-10Australia Canada France Italy Japan Netherlands Spain United States
Change in the aggregate labour share Change in the labour share, excluding earnings of the top 1% of earners
3. LABOUR LOSING TO CAPITAL: WHAT EXPLAINS THE DECLINING LABOUR SHARE?
OECD EMPLOYMENT OUTLOOK 2012 © OECD 2012116
Canada and the United States, the decline of the labour share of the bottom 99% of income
earners in the past two decades was about 2.9 and 2.2 percentage points larger,
respectively, than that of the aggregate labour share.
These trends in the aggregate labour share also need to be interpreted with caution
because of a number of measurement issues (see Box 3.2). Moreover, the evolution of the
labour share in the business sector is likely to be shaped by different forces than the
corresponding aggregate for the public sector, where measurement of output and factor
shares raises more complex issues.6 Therefore, the focus in the rest of this chapter is on the
evolution of the labour share in the business sector, which represents a more consistent
aggregate and where measurement issues are less problematic. Nevertheless the picture
Box 3.1. Trends in the labour share excluding top-income earners (cont.)
respectively; see OECD, 2012). In most other countries, the difference is smaller: on average, the cumulatedlabour income of the bottom 99% of earners expressed as a fraction of national income decreased by0.9 percentage points more than the unadjusted aggregate labour share. Conversely, the top 1% of earnerssaw their labour share increasing by the same amount.* The only exception is Spain, where the adjustedlabour share fell less than the unadjusted one, mostly due to a minor decrease in the share of labourincome in top earners’ income.
* Note that, as the labour share of the top 1% of earners is about 5% on average, this implies that the labour income of the top 1%of earners as a percentage of national income has increased by about 20% on average.
Box 3.2. The aggregate labour share: Measurement issues
The labour share is typically computed by dividing gross labour compensation by gross value added atcurrent basic prices. In many industries outside the business sector, however, the measurement of valueadded is problematic. For example, the value added of the public administration, as measured in thenational accounts is often equal to the sum of labour costs. As a consequence, the labour share is oftendramatically inflated in the public sector. Conversely, in industries such as mining and fuel production,value added fluctuates quite a lot subject to changes in world demand for raw materials, while wages donot, thereby inducing large fluctuations in the labour share. Another source of measurement error is theimputation of owner-occupied housing in the national accounts, which is a significant proportion of valueadded in the real estate industry but is only reported as capital income (see e.g. OECD, 2009). Finally, therevenue of the self-employed is a mix of capital and labour income, which are typically not identifiedseparately in the national accounts. There is a wide consensus that the remuneration of proprietors’ labourshould be assumed to be equal to the average compensation of wage earners (Gollin, 2002; Arpaia et al.,2009). Typically, due to data availability, average annual wages of the whole economy are used for thiscalculation. However, the share of self-employed varies significantly across industries as does averagecompensation of employees, therefore imputation rules based on average compensation in the wholeeconomy can be misleading both in terms of levels and trends.
In order to address these issues, in the remainder of this chapter the analysis focuses mainly on the labourshare in the non-agricultural/non-mining/non-fuel/non-real-estate business sector – accounting for abouttwo-thirds of the whole economy – where most of these problems are less important. In addition, the incomeof the self-employed is imputed on the basis of the average hourly wage of each industry. In other words, thelabour share in the business sector is calculated in two steps: first, labour compensation for each industry iscomputed assuming that hourly compensation of proprietors’ labour is the same as for employees in thesame industry; then, industry labour compensation is aggregated at the level of the business sector and thelabour share is computed by dividing this aggregate by business-sector’s value added.
3. LABOUR LOSING TO CAPITAL: WHAT EXPLAINS THE DECLINING LABOUR SHARE?
OECD EMPLOYMENT OUTLOOK 2012 © OECD 2012 117
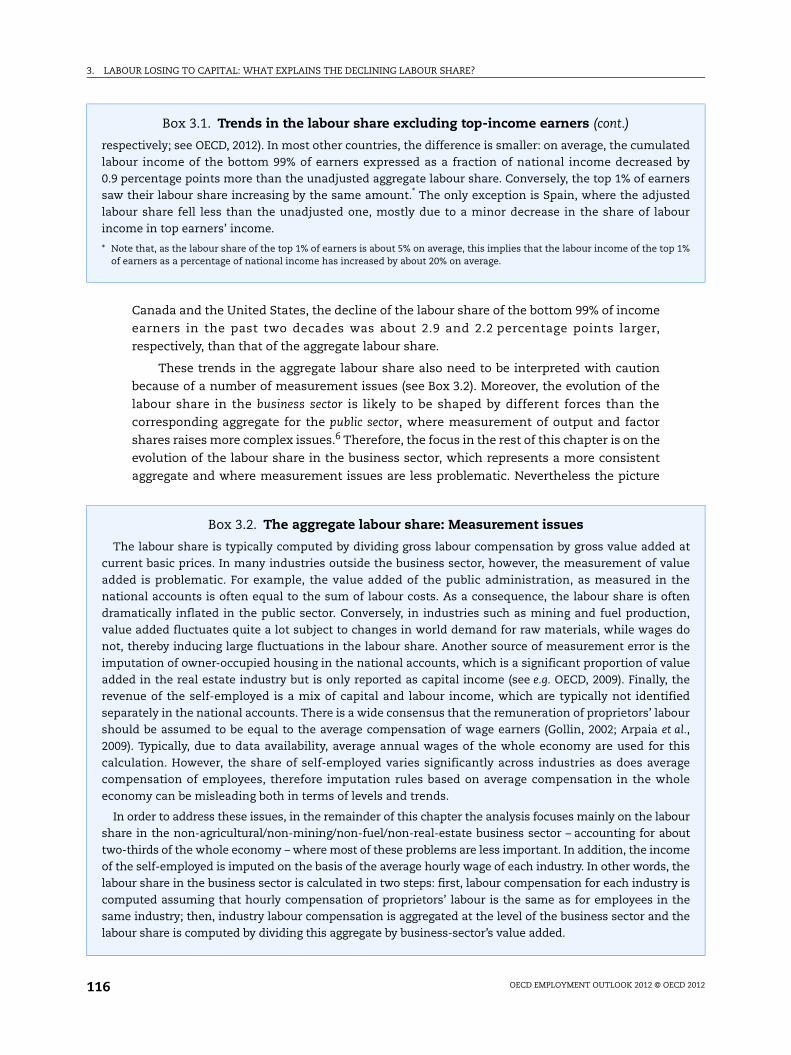
that emerges is rather similar to the results for the whole economy (Figure 3.3). The cross-
country median labour share in the business sector, excluding agriculture, mining, fuel and
real estate, was 68.2% in the OECD in 1990 and 63.6% in 2007. Among countries for which
data are available, a significant trend increase is observed only in the Czech Republic (with
a growth of 1.3 percentage points). By contrast, the labour share contracted significantly in
almost three-quarters of the countries. Very large falls in the labour share were observed in
some Scandinavian countries (Finland, and Sweden), a number of eastern European
countries (Hungary, Poland and Slovenia), many English-speaking countries (Australia,
Canada and Ireland) and Italy.7 In all these countries the decline in the business sector’s
labour share exceeded 5 percentage points. The implication is that, in these countries,
labour is obtaining an increasingly smaller share of the business-sector’s pre-tax revenue.
A number of previous studies have suggested that trends in the aggregate labour share
typically hide important compositional factors (e.g. de Serres et al., 2002). Indeed, since
the 1960s, a number of low-labour-share service industries, such as financial
intermediation, have gained importance in most countries8 while other labour-intensive
industries, such as textiles, have shrunk, thereby depressing the aggregate labour share.
Thus, a key question is whether the decline of the aggregate labour share has been the
result of a structural shift away from labour-intensive activities or whether instead it has
been the result of a decline in the labour share within each industry. This question can be
answered using a standard shift-share analysis (see Box 3.3). Based on comparable data for
20 industries in the business sector, changes in the business-sector labour share can be
decomposed into the contribution of within-industry changes in the labour share and the
contribution of changes in the value-added share of industries with high labour shares versus
those with low labour shares.
Figure 3.3. The decline of the business-sector labour share in OECD countries, 1990a-2007b
Note: Three-year averages, starting and ending with indicated years. ***, **, * significant at the 1%, 5% and 10% level, respectively.Statistical significance refers to the coefficient of the time trend in a bivariate regression on annual data with the labour share asdependent variable. The wage of the self-employed is imputed assuming that in each industry their hourly wage is the same as for theaverage employee of the industry. Estimates for Norway exclude the chemical industry and are based on average hours per employedperson rather than average hours per employee.a) Germany and Hungary: 1992; Czech Republic, Estonia, Greece, Poland, Slovak Republic and Slovenia: 1995.b) Canada: 2004; Korea and Portugal: 2005; Japan, Poland and Slovenia: 2006.
Source: OECD calculations based on OECD STAN and EUKLEMS.1 2 http://dx.doi.org/10.1787/888932651541
80
75
70
65
60
55
50
45
40
5
0
-5
-10
-15
%
POL
SVK
IRL
GR
CES
TCZ
EAU
SCA
NJP
NES
PAU
TPR
TH
UN
FIN
USA
NLD
SWE
NO
RBE
LKO
RSV
ND
EUD
NK
ITA
GBR FR
A
FIN
HU
NIR
LSW
ECA
NIT
APO
LSV
NAU
SAU
TBE
LG
BR DEU ES
PU
SAD
NK
NLD
KOR
NO
RG
RC
JPN
PRT
EST
SVK
FRA
CZE
*** ***
***** *** *** ***
****** *** *** * *** *** *** ** *** ***
**
***
Percentage points
Level in 2007a Level in 1990b Change 1990-2007
3. LABOUR LOSING TO CAPITAL: WHAT EXPLAINS THE DECLINING LABOUR SHARE?
OECD EMPLOYMENT OUTLOOK 2012 © OECD 2012118
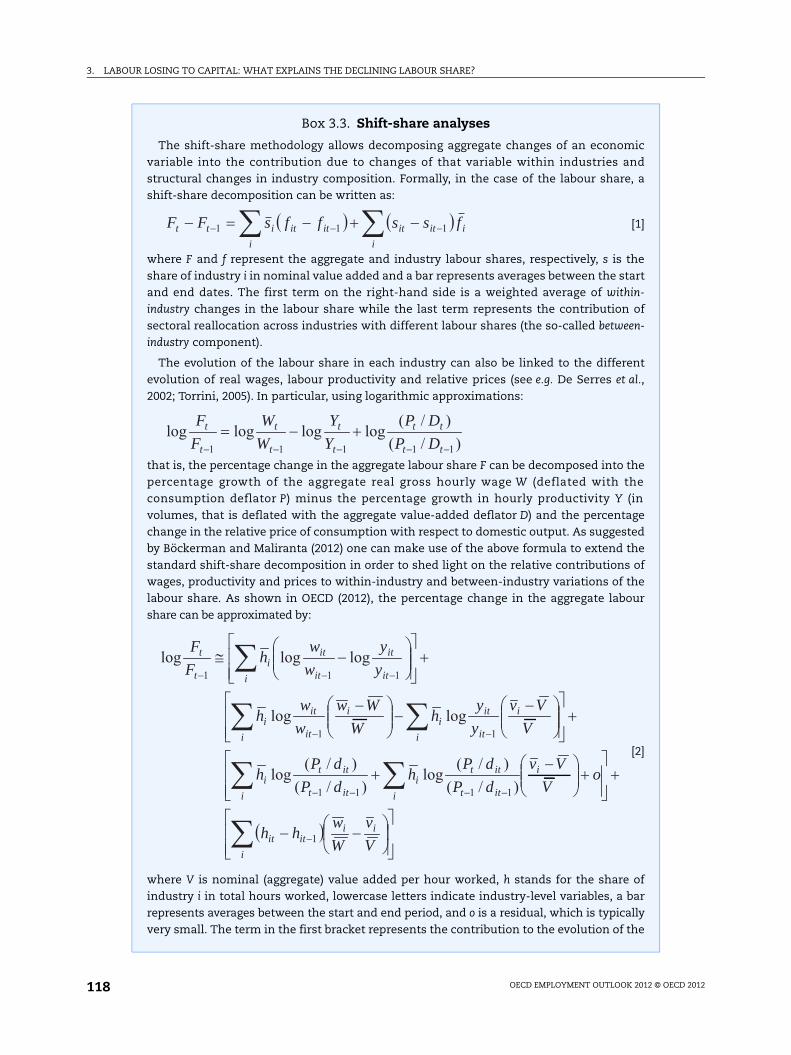
Box 3.3. Shift-share analyses
The shift-share methodology allows decomposing aggregate changes of an economicvariable into the contribution due to changes of that variable within industries andstructural changes in industry composition. Formally, in the case of the labour share, ashift-share decomposition can be written as:
[1]
where F and f represent the aggregate and industry labour shares, respectively, s is theshare of industry i in nominal value added and a bar represents averages between the startand end dates. The first term on the right-hand side is a weighted average of within-industry changes in the labour share while the last term represents the contribution ofsectoral reallocation across industries with different labour shares (the so-called between-industry component).
The evolution of the labour share in each industry can also be linked to the differentevolution of real wages, labour productivity and relative prices (see e.g. De Serres et al.,2002; Torrini, 2005). In particular, using logarithmic approximations:
that is, the percentage change in the aggregate labour share F can be decomposed into thepercentage growth of the aggregate real gross hourly wage W (deflated with theconsumption deflator P) minus the percentage growth in hourly productivity Y (involumes, that is deflated with the aggregate value-added deflator D) and the percentagechange in the relative price of consumption with respect to domestic output. As suggestedby Böckerman and Maliranta (2012) one can make use of the above formula to extend thestandard shift-share decomposition in order to shed light on the relative contributions ofwages, productivity and prices to within-industry and between-industry variations of thelabour share. As shown in OECD (2012), the percentage change in the aggregate labourshare can be approximated by:
[2]
where V is nominal (aggregate) value added per hour worked, h stands for the share ofindustry i in total hours worked, lowercase letters indicate industry-level variables, a barrepresents averages between the start and end period, and o is a residual, which is typicallyvery small. The term in the first bracket represents the contribution to the evolution of the
i
iititi
itititt fssffsFF 111
)/()/(
loglogloglog11111
tt
tt
t
t
t
t
t
t
DPDP
YY
WW
FF
i
iiitit
i
i itt
itti
i itt
itti
i i
i
it
iti
i
it
iti
i it
it
it
iti
t
t
Vv
Ww
hh
oV
VvdPdP
hdPdP
h
VVv
yy
hW
Wwww
h
yy
ww
hFF
1
1111
11
111
)/()/(
log)/()/(
log
loglog
logloglog
3. LABOUR LOSING TO CAPITAL: WHAT EXPLAINS THE DECLINING LABOUR SHARE?
OECD EMPLOYMENT OUTLOOK 2012 © OECD 2012 119
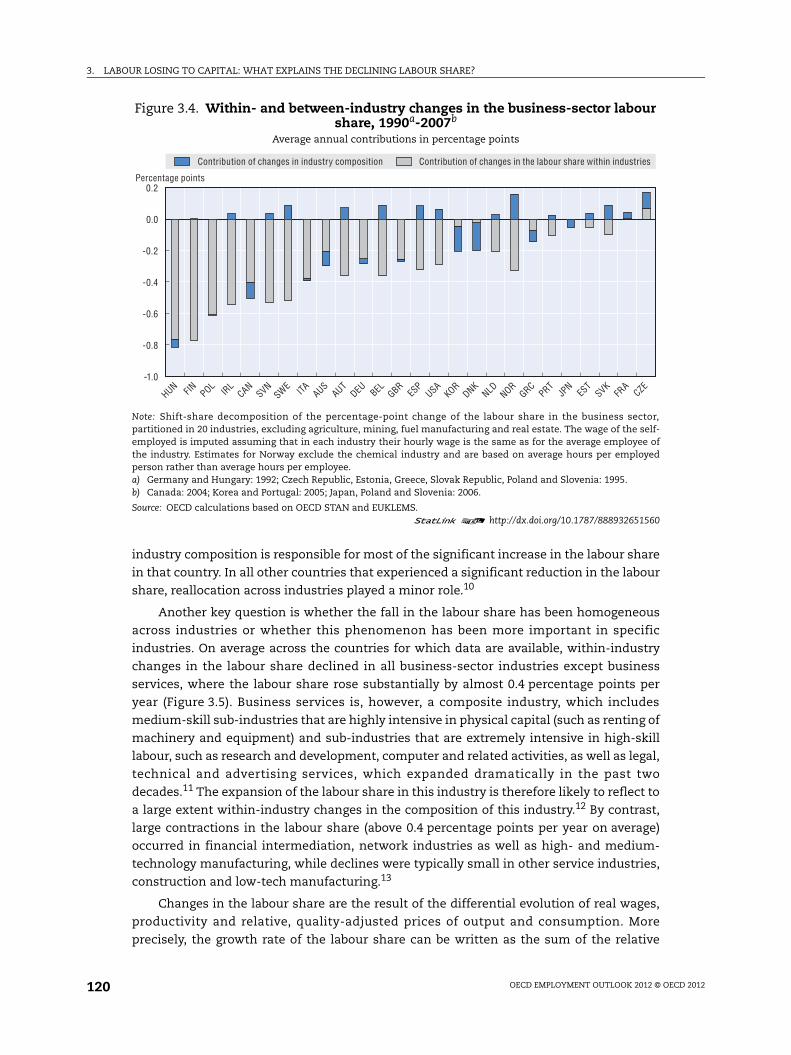
Within-industry falls in the labour share explain an overwhelming proportion of its
aggregate decrease between 1990 and 2007 (Figure 3.4). Within industries, the labour share
declined by as much as 0.7 percentage points per year in Finland, Hungary and Poland.
Moreover, in most countries where a significant contraction of the aggregate labour share
was observed, within-industry changes accounted for close to 100% of that decline, with
the partial exception of Australia, where this proportion is only two-thirds. Large between-
industry components, implying noteworthy reallocation away from high-labour-share
industries, were observed only in Denmark and Korea.9 In these two countries, structural
reallocation across industries accounted for a decrease of the business-sector labour share
greater than 0.1 percentage points per year. By contrast, in a few other countries, and
notably Austria, Belgium, Norway, Spain, Sweden and the United States, reallocation to
high-wage share industries limited somewhat the aggregate consequences of sizeable
within-industry falls in the labour share. Finally, in the Czech Republic, a similar shift in
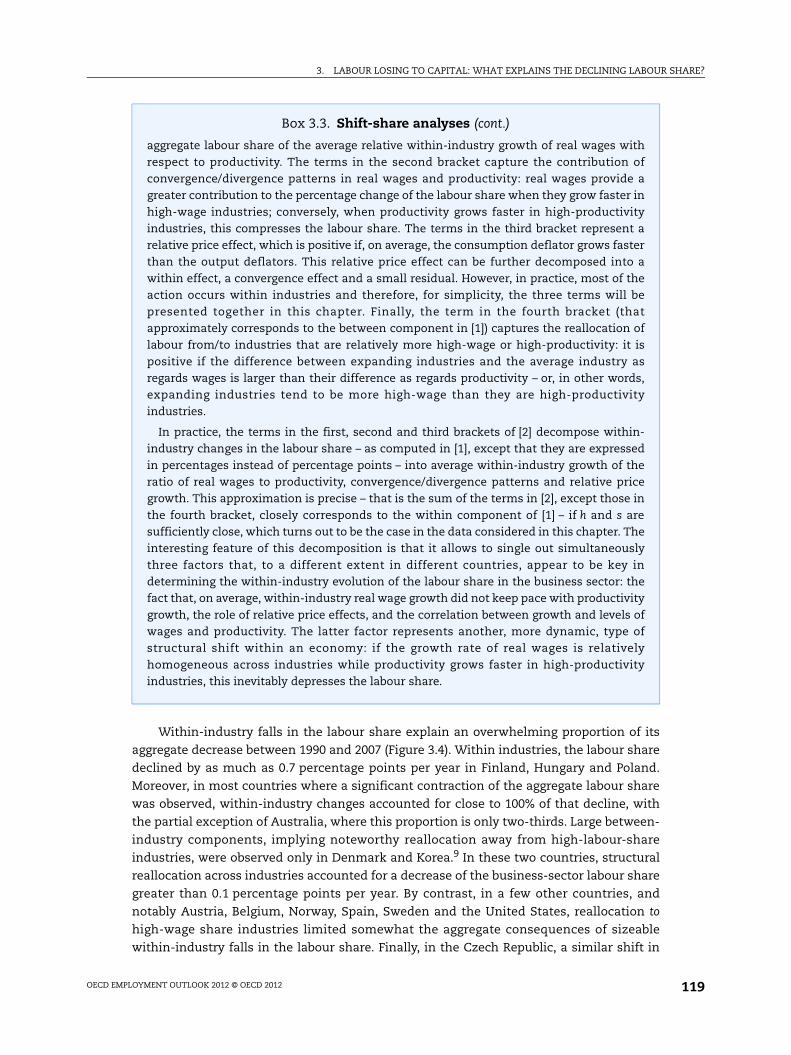
Box 3.3. Shift-share analyses (cont.)
aggregate labour share of the average relative within-industry growth of real wages withrespect to productivity. The terms in the second bracket capture the contribution ofconvergence/divergence patterns in real wages and productivity: real wages provide agreater contribution to the percentage change of the labour share when they grow faster inhigh-wage industries; conversely, when productivity grows faster in high-productivityindustries, this compresses the labour share. The terms in the third bracket represent arelative price effect, which is positive if, on average, the consumption deflator grows fasterthan the output deflators. This relative price effect can be further decomposed into awithin effect, a convergence effect and a small residual. However, in practice, most of theaction occurs within industries and therefore, for simplicity, the three terms will bepresented together in this chapter. Finally, the term in the fourth bracket (thatapproximately corresponds to the between component in [1]) captures the reallocation oflabour from/to industries that are relatively more high-wage or high-productivity: it ispositive if the difference between expanding industries and the average industry asregards wages is larger than their difference as regards productivity – or, in other words,expanding industries tend to be more high-wage than they are high-productivityindustries.
In practice, the terms in the first, second and third brackets of [2] decompose within-industry changes in the labour share – as computed in [1], except that they are expressedin percentages instead of percentage points – into average within-industry growth of theratio of real wages to productivity, convergence/divergence patterns and relative pricegrowth. This approximation is precise – that is the sum of the terms in [2], except those inthe fourth bracket, closely corresponds to the within component of [1] – if h and s aresufficiently close, which turns out to be the case in the data considered in this chapter. Theinteresting feature of this decomposition is that it allows to single out simultaneouslythree factors that, to a different extent in different countries, appear to be key indetermining the within-industry evolution of the labour share in the business sector: thefact that, on average, within-industry real wage growth did not keep pace with productivitygrowth, the role of relative price effects, and the correlation between growth and levels ofwages and productivity. The latter factor represents another, more dynamic, type ofstructural shift within an economy: if the growth rate of real wages is relativelyhomogeneous across industries while productivity grows faster in high-productivityindustries, this inevitably depresses the labour share.
3. LABOUR LOSING TO CAPITAL: WHAT EXPLAINS THE DECLINING LABOUR SHARE?
OECD EMPLOYMENT OUTLOOK 2012 © OECD 2012120
industry composition is responsible for most of the significant increase in the labour share
in that country. In all other countries that experienced a significant reduction in the labour
share, reallocation across industries played a minor role.10
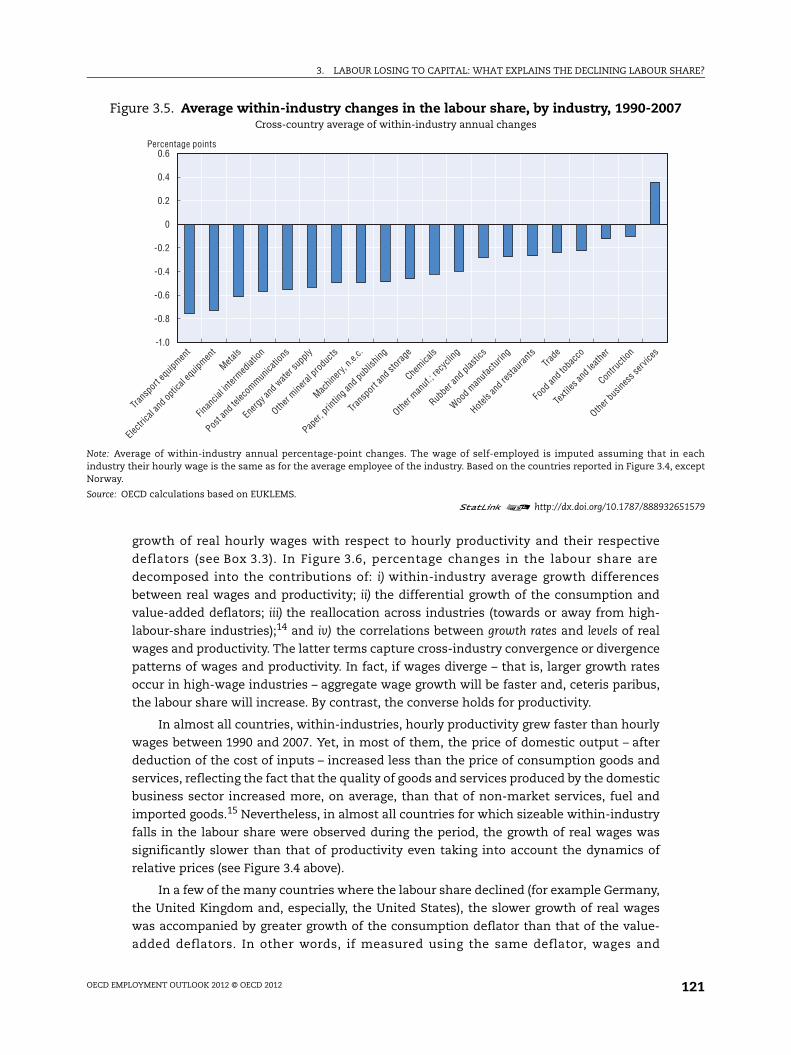
Another key question is whether the fall in the labour share has been homogeneous
across industries or whether this phenomenon has been more important in specific
industries. On average across the countries for which data are available, within-industry
changes in the labour share declined in all business-sector industries except business
services, where the labour share rose substantially by almost 0.4 percentage points per
year (Figure 3.5). Business services is, however, a composite industry, which includes
medium-skill sub-industries that are highly intensive in physical capital (such as renting of
machinery and equipment) and sub-industries that are extremely intensive in high-skill
labour, such as research and development, computer and related activities, as well as legal,
technical and advertising services, which expanded dramatically in the past two
decades.11 The expansion of the labour share in this industry is therefore likely to reflect to
a large extent within-industry changes in the composition of this industry.12 By contrast,
large contractions in the labour share (above 0.4 percentage points per year on average)
occurred in financial intermediation, network industries as well as high- and medium-
technology manufacturing, while declines were typically small in other service industries,
construction and low-tech manufacturing.13
Changes in the labour share are the result of the differential evolution of real wages,
productivity and relative, quality-adjusted prices of output and consumption. More
precisely, the growth rate of the labour share can be written as the sum of the relative
Figure 3.4. Within- and between-industry changes in the business-sector labour share, 1990a-2007b
Average annual contributions in percentage points
Note: Shift-share decomposition of the percentage-point change of the labour share in the business sector,partitioned in 20 industries, excluding agriculture, mining, fuel manufacturing and real estate. The wage of the self-employed is imputed assuming that in each industry their hourly wage is the same as for the average employee ofthe industry. Estimates for Norway exclude the chemical industry and are based on average hours per employedperson rather than average hours per employee.a) Germany and Hungary: 1992; Czech Republic, Estonia, Greece, Slovak Republic, Poland and Slovenia: 1995. b) Canada: 2004; Korea and Portugal: 2005; Japan, Poland and Slovenia: 2006.
Source: OECD calculations based on OECD STAN and EUKLEMS.1 2 http://dx.doi.org/10.1787/888932651560
0.2
0.0
-0.2
-0.4
-0.6
-0.8
-1.0
HUN FI
N P
OL IR
L C
AN S
VN S
WE IT
A A
US A
UT D
EU BEL
GBR
ESP
USA
KOR
DNK
NLD
NOR
GRC
PRT
JPN
EST
SVK
FRA
CZE
Contribution of changes in industry composition Contribution of changes in the labour share within industries
Percentage points
3. LABOUR LOSING TO CAPITAL: WHAT EXPLAINS THE DECLINING LABOUR SHARE?
OECD EMPLOYMENT OUTLOOK 2012 © OECD 2012 121
growth of real hourly wages with respect to hourly productivity and their respective
deflators (see Box 3.3). In Figure 3.6, percentage changes in the labour share are
decomposed into the contributions of: i) within-industry average growth differences
between real wages and productivity; ii) the differential growth of the consumption and
value-added deflators; iii) the reallocation across industries (towards or away from high-
labour-share industries);14 and iv) the correlations between growth rates and levels of real
wages and productivity. The latter terms capture cross-industry convergence or divergence
patterns of wages and productivity. In fact, if wages diverge – that is, larger growth rates
occur in high-wage industries – aggregate wage growth will be faster and, ceteris paribus,
the labour share will increase. By contrast, the converse holds for productivity.
In almost all countries, within-industries, hourly productivity grew faster than hourly
wages between 1990 and 2007. Yet, in most of them, the price of domestic output – after
deduction of the cost of inputs – increased less than the price of consumption goods and
services, reflecting the fact that the quality of goods and services produced by the domestic
business sector increased more, on average, than that of non-market services, fuel and
imported goods.15 Nevertheless, in almost all countries for which sizeable within-industry
falls in the labour share were observed during the period, the growth of real wages was
significantly slower than that of productivity even taking into account the dynamics of
relative prices (see Figure 3.4 above).
In a few of the many countries where the labour share declined (for example Germany,
the United Kingdom and, especially, the United States), the slower growth of real wages
was accompanied by greater growth of the consumption deflator than that of the value-
added deflators. In other words, if measured using the same deflator, wages and
Figure 3.5. Average within-industry changes in the labour share, by industry, 1990-2007Cross-country average of within-industry annual changes
Note: Average of within-industry annual percentage-point changes. The wage of self-employed is imputed assuming that in eachindustry their hourly wage is the same as for the average employee of the industry. Based on the countries reported in Figure 3.4, exceptNorway.
Source: OECD calculations based on EUKLEMS.1 2 http://dx.doi.org/10.1787/888932651579
0.6
0.4
0.2
0
-0.2
-0.4
-0.6
-0.8
-1.0
Percentage points
Trans
port
equip
ment
Electr
ical a
nd op
tical
equip
ment
Metals
Finan
cial in
termed
iation
Post a
nd te
lecom
munica
tions
Energ
y and
wate
r sup
ply
Other m
ineral
prod
ucts
Machin
ery, n
.e.c.
Paper,
ing an
d pub
lishin
g
Trans
port
and s
torag
e
Chemica
ls
Other m
anuf.
; recy
cling
Rubbe
r and
plas
tics
Wood m
anufa
cturin
g
Hotels
and r
estau
rants
Trade
Food
and t
obac
co
Texti
les an
d lea
ther
Contru
ction
Other b
usine
ss se
rvice
s
3. LABOUR LOSING TO CAPITAL: WHAT EXPLAINS THE DECLINING LABOUR SHARE?
OECD EMPLOYMENT OUTLOOK 2012 © OECD 2012122
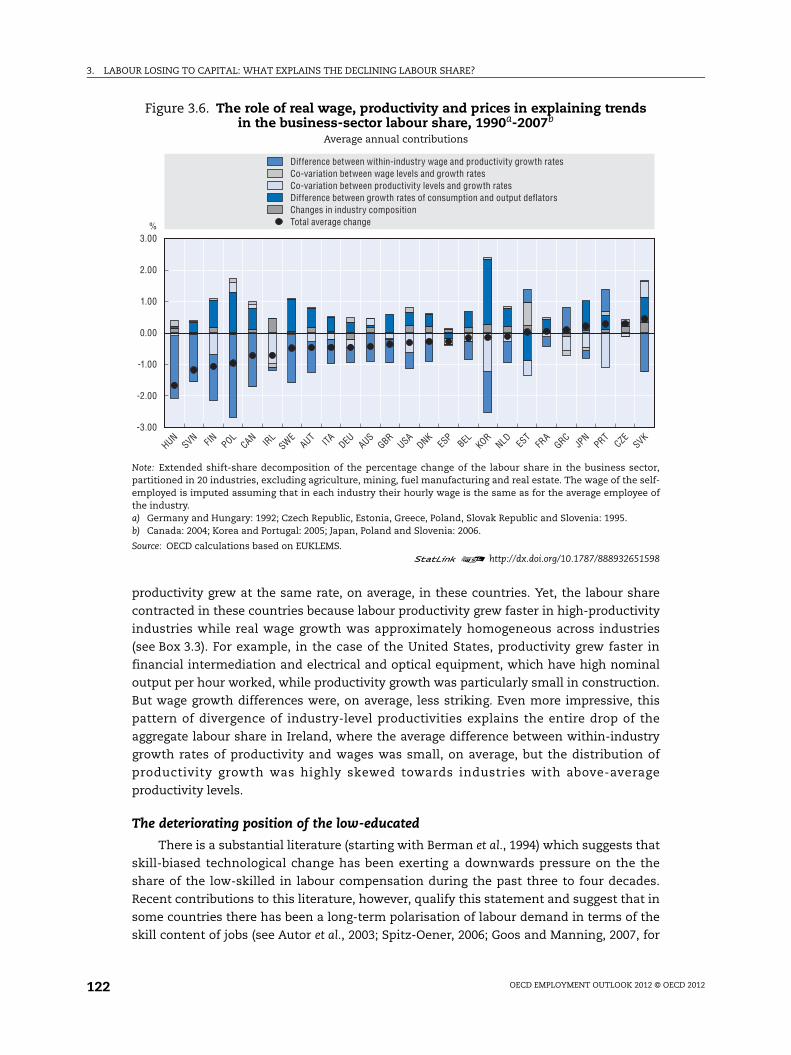
productivity grew at the same rate, on average, in these countries. Yet, the labour share
contracted in these countries because labour productivity grew faster in high-productivity
industries while real wage growth was approximately homogeneous across industries
(see Box 3.3). For example, in the case of the United States, productivity grew faster in
financial intermediation and electrical and optical equipment, which have high nominal
output per hour worked, while productivity growth was particularly small in construction.
But wage growth differences were, on average, less striking. Even more impressive, this
pattern of divergence of industry-level productivities explains the entire drop of the
aggregate labour share in Ireland, where the average difference between within-industry
growth rates of productivity and wages was small, on average, but the distribution of
productivity growth was highly skewed towards industries with above-average
productivity levels.
The deteriorating position of the low-educated
There is a substantial literature (starting with Berman et al., 1994) which suggests that
skill-biased technological change has been exerting a downwards pressure on the the
share of the low-skilled in labour compensation during the past three to four decades.
Recent contributions to this literature, however, qualify this statement and suggest that in
some countries there has been a long-term polarisation of labour demand in terms of the
skill content of jobs (see Autor et al., 2003; Spitz-Oener, 2006; Goos and Manning, 2007, for
Figure 3.6. The role of real wage, productivity and prices in explaining trends in the business-sector labour share, 1990a-2007b
Average annual contributions
Note: Extended shift-share decomposition of the percentage change of the labour share in the business sector,partitioned in 20 industries, excluding agriculture, mining, fuel manufacturing and real estate. The wage of the self-employed is imputed assuming that in each industry their hourly wage is the same as for the average employee ofthe industry. a) Germany and Hungary: 1992; Czech Republic, Estonia, Greece, Poland, Slovak Republic and Slovenia: 1995.b) Canada: 2004; Korea and Portugal: 2005; Japan, Poland and Slovenia: 2006.
Source: OECD calculations based on EUKLEMS.1 2 http://dx.doi.org/10.1787/888932651598
3.00
2.00
1.00
0.00
-1.00
-2.00
-3.00
HUN S
VN FI
N P
OL C
AN IRL
SWE
AUT
ITA
DEU
AUS
GBR U
SA D
NK E
SP B
EL KOR N
LD EST
FRA
GRC
JPN
PRT
CZE
SVK
% Total average changeChanges in industry compositionDifference between growth rates of consumption and output deflatorsCo-variation between productivity levels and growth rates Co-variation between wage levels and growth rates Difference between within-industry wage and productivity growth rates
3. LABOUR LOSING TO CAPITAL: WHAT EXPLAINS THE DECLINING LABOUR SHARE?
OECD EMPLOYMENT OUTLOOK 2012 © OECD 2012 123
extensive evidence concerning the United States, Germany and the United Kingdom,
respectively). True, the share of the high-skilled in labour compensation, and notably that
of managers and administrators as well as IT engineers, has increased enormously. But at
the bottom of the wage distribution, employment has increased significantly in a number
of elementary occupations, typically in low-paid jobs with precarious contracts in many
countries. As a consequence, the share of those in low-skilled jobs has increased as well,
while labour demand for medium-skilled occupations has fallen almost everywhere.
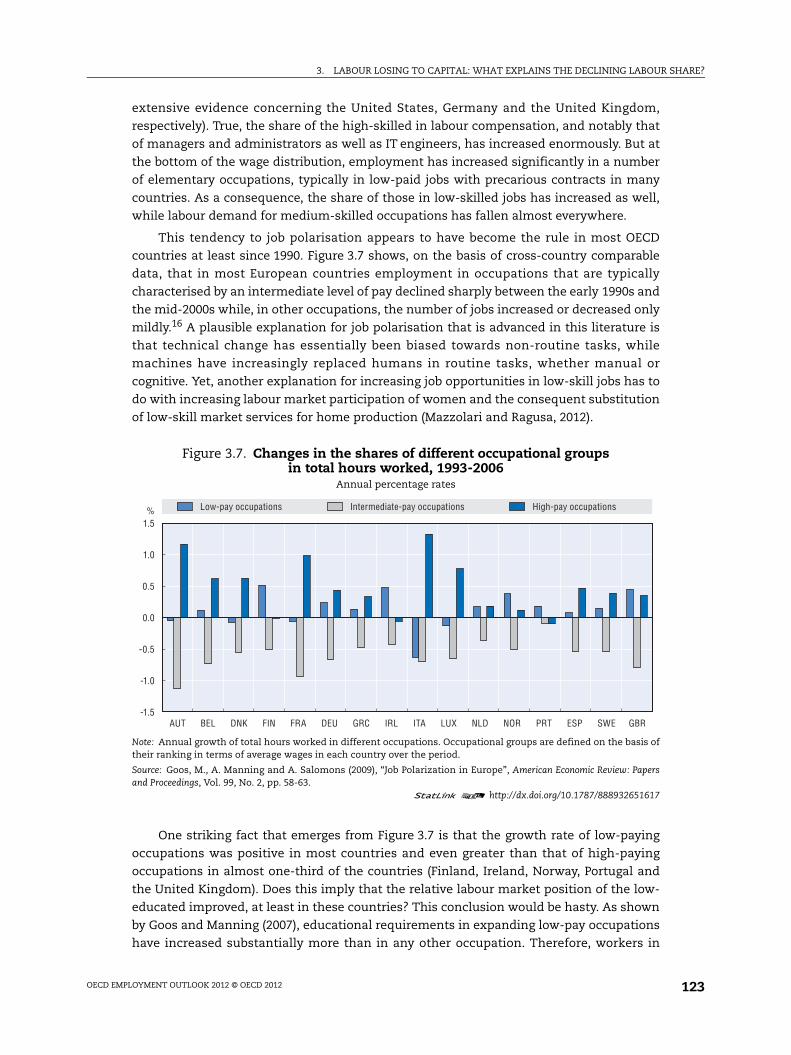
This tendency to job polarisation appears to have become the rule in most OECD
countries at least since 1990. Figure 3.7 shows, on the basis of cross-country comparable
data, that in most European countries employment in occupations that are typically
characterised by an intermediate level of pay declined sharply between the early 1990s and
the mid-2000s while, in other occupations, the number of jobs increased or decreased only
mildly.16 A plausible explanation for job polarisation that is advanced in this literature is
that technical change has essentially been biased towards non-routine tasks, while
machines have increasingly replaced humans in routine tasks, whether manual or
cognitive. Yet, another explanation for increasing job opportunities in low-skill jobs has to
do with increasing labour market participation of women and the consequent substitution
of low-skill market services for home production (Mazzolari and Ragusa, 2012).
One striking fact that emerges from Figure 3.7 is that the growth rate of low-paying
occupations was positive in most countries and even greater than that of high-paying
occupations in almost one-third of the countries (Finland, Ireland, Norway, Portugal and
the United Kingdom). Does this imply that the relative labour market position of the low-
educated improved, at least in these countries? This conclusion would be hasty. As shown
by Goos and Manning (2007), educational requirements in expanding low-pay occupations
have increased substantially more than in any other occupation. Therefore, workers in
Figure 3.7. Changes in the shares of different occupational groups in total hours worked, 1993-2006
Annual percentage rates
Note: Annual growth of total hours worked in different occupations. Occupational groups are defined on the basis oftheir ranking in terms of average wages in each country over the period.
Source: Goos, M., A. Manning and A. Salomons (2009), “Job Polarization in Europe”, American Economic Review: Papersand Proceedings, Vol. 99, No. 2, pp. 58-63.
1 2 http://dx.doi.org/10.1787/888932651617
1.5
1.0
0.5
0.0
-0.5
-1.0
-1.5AUT BEL DNK FIN FRA DEU GRC IRL ITA NLD NOR PRT ESP SWE GBRLUX
% Low-pay occupations Intermediate-pay occupations High-pay occupations
3. LABOUR LOSING TO CAPITAL: WHAT EXPLAINS THE DECLINING LABOUR SHARE?
OECD EMPLOYMENT OUTLOOK 2012 © OECD 2012124
these jobs tend to be increasingly over-qualified, so that, more frequently, workers with
intermediate level of educational attainment end up displacing workers with lower skills.
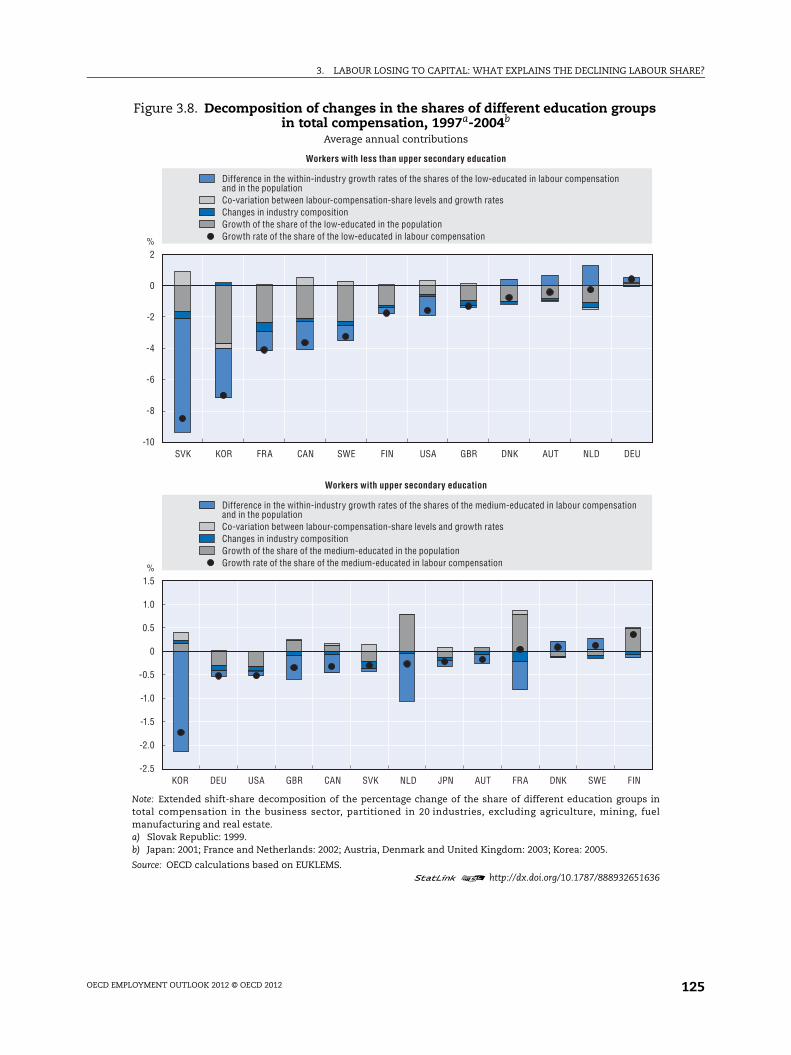
For the 13 countries for which comparable data are available, the share of those with
low education17 in total labour compensation slumped between mid-1990s and mid-2000s
(Figure 3.8). In that period, the share of the low-educated fell by 2.7% per year, while that of
those with upper secondary education was approximately stable (decreasing on average by
0.3% per year).18 These changes are only partially matched by changes in the educational
attainment of the working-age population.19 On average, the share of the low-educated in
the working-age population fell by 1.5% per year while that of those with an intermediate
level of education remained about stable. Particularly large declines in the share of the low-
educated in labour compensation occurred in the Slovak Republic and Korea, with a fall
greater than the decrease of the fraction of the low-educated in the population by 6.5% and
3% per year, respectively. By contrast, in countries with a dual-track vocational education
system (Austria, Denmark, Germany and the Netherlands in Figure 3.8, see Mühlemann
et al., 2009), the share of those with less than upper secondary education in labour
compensation declined by less than the share of the same group in the working-age
population. This confirms that at a level below upper secondary education, in these
countries the vocational system delivers outcomes in terms of skill acquisition that appear
to better equip workers to take advantage of changes in labour demand.
A shift-share analysis similar to that discussed in Box 3.3 (see OECD, 2012, for details
on the methodology) reveals that the worsening position of the low-educated is due to the
within-industry dynamics of their share in labour compensation (Figure 3.8).20 This is true
even if account is taken for the evolution of the share of each group in the population,
except for countries with a dual track system and the United Kingdom. Reallocation across
industries also contributes to explain the worsening position of the low-educated, but its
role is modest except in France where reallocation away from industries with a high share
of low-educated workers explains about 30% of the contraction that is not accounted for by
changes in the population. Taken together, these pieces of evidence suggest that the labour
market position of those with little or no education worsened significantly in OECD
countries in the past two decades. This occurred in spite of job polarisation, because of
greater competition for expanding low-skilled jobs from those with middle levels of
educational attainment.
Overall, the evidence presented in this section suggests that reallocation across
industries in recent decades has played only a minor role in explaining both the evolution
of the labour share and its distribution. By contrast, the within-industry dynamics of the
labour share appear to have been the main driver of aggregate trends in the past two
decades. It is therefore essential to identify the determinants of within-industry variations
in order to understand the evolution of the aggregate labour share. This is the objective of
the next sections.
3. LABOUR LOSING TO CAPITAL: WHAT EXPLAINS THE DECLINING LABOUR SHARE?
OECD EMPLOYMENT OUTLOOK 2012 © OECD 2012 125
Figure 3.8. Decomposition of changes in the shares of different education groups in total compensation, 1997a-2004b
Average annual contributions
Note: Extended shift-share decomposition of the percentage change of the share of different education groups intotal compensation in the business sector, partitioned in 20 industries, excluding agriculture, mining, fuelmanufacturing and real estate.a) Slovak Republic: 1999.b) Japan: 2001; France and Netherlands: 2002; Austria, Denmark and United Kingdom: 2003; Korea: 2005.
Source: OECD calculations based on EUKLEMS.1 2 http://dx.doi.org/10.1787/888932651636
2
0
-2
-4
-6
-8
-10SVK KOR FRA CAN SWE FIN USA GBR DNK AUT NLD DEU
%
1.5
1.0
0.5
0
-0.5
-1.0
-1.5
-2.0
-2.5DEUKOR USA GBR CAN SVK NLD JPN AUT FRA DNK SWE FIN
%
Workers with less than upper secondary education
Growth rate of the share of the low-educated in labour compensationGrowth of the share of the low-educated in the populationChanges in industry compositionCo-variation between labour-compensation-share levels and growth rates
Difference in the within-industry growth rates of the shares of the low-educated in labour compensationand in the population
Workers with upper secondary education
Growth rate of the share of the medium-educated in labour compensationGrowth of the share of the medium-educated in the populationChanges in industry compositionCo-variation between labour-compensation-share levels and growth rates
Difference in the within-industry growth rates of the shares of the medium-educated in labour compensationand in the population
3. LABOUR LOSING TO CAPITAL: WHAT EXPLAINS THE DECLINING LABOUR SHARE?
OECD EMPLOYMENT OUTLOOK 2012 © OECD 2012126
2. What explains the within-industry decline of the labour share?Many different explanations have been suggested in the academic literature to
account for the decline in the labour share in OECD countries. These explanations include
an increase in capital intensity, enhancement of skill-biased capital-augmenting technical
change, deregulation and privatisation, particularly in network industries, increased
globalisation, and the decline of workers’ bargaining power, whether related or not to the
evolution of collective bargaining institutions and labour market policies and regulations.
These different factors are analysed in this chapter within a unified framework adopting
an industry-level approach (see Box 3.4).21 More precisely, this section quantifies the role of
a number of factors that have been considered by the literature but are only indirectly
related to labour market institutions. It discusses the main economic and quantitative
implications of the econometric estimates concerning these factors, while the detailed
estimates, sample definition and robustness checks are presented in Bassanini and
Manfredi (2012). By contrast, the next sections focus more directly on the role of
institutions and policies, and in particular on the role of the evolution of collective
bargaining systems and workers’ bargaining power.
The role of capital intensity and technical change
Recent academic work on the decline of the labour share has pointed to the role of
capital accumulation and capital-augmenting technical change (see e.g. Bentolila and
Saint-Paul, 2003; Arpaia et al., 2009; Driver and Muñoz-Bugarin, 2010; Raurich et al., 2012;
Hutchinson and Persyn, 2012). Under standard assumptions, an increase in capital
intensity – that is in the ratio of the volume of capital services to value added – is
accompanied by an increase in both the capital-to-labour ratio and marginal productivity
of labour, which results in greater wages. If capital and labour are complementary,22 the
more than proportional rise in wages will compensate the decline in the ratio of labour to
value added and the wage share will increase. However if capital and labour tend to be
substitutable, the relative decline of labour with respect to value added will not be
compensated by a sufficient increase in the wage rate. While, under standard assumptions
and conditional on capital intensity, labour-augmenting technical change has no impact
on the labour share,23 capital-augmenting technical change would have the same effect as
increasing capital accumulation, thereby reinforcing the effect of capital intensity
(see Box 3.4). As a consequence, if capital and labour are gross substitutes and technical
change is, at least partially, capital-augmenting, both growth in capital intensity and
technical change will depress the labour share. Bentolila and Saint-Paul (2003) confirm this
theoretical conjecture by estimating a specification derived from a standard production
function, where a residual measure of efficiency – total factor productivity (TFP) – is
included as a (noisy) proxy of technical change.24 They find that the growth in capital
intensity and TFP have both a negative impact on the labour share25 and jointly over-
predict its aggregate fall in OECD countries between 1972 and 1993.
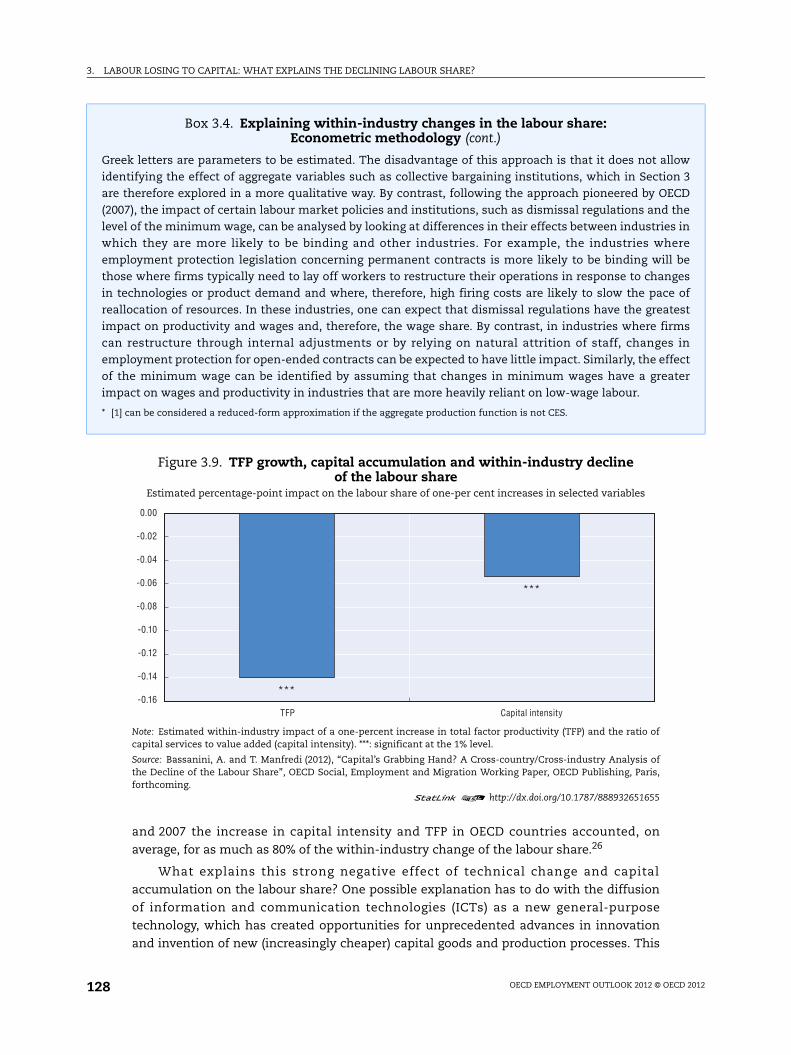
The estimation of a similar model undertaken for this chapter (see Box 3.4) for a
different period (1980-2007) yields qualitatively similar results, except for the somewhat
smaller estimated effects (Figure 3.9). The estimates suggests that an increase of capital
intensity by 1% would induce a within-industry reduction in the labour share by about
0.05 percentage points, while an increase in TFP by 1% would result in a contraction of the
labour share of 0.14 percentage points. Taken at face value, they imply that between 1990
3. LABOUR LOSING TO CAPITAL: WHAT EXPLAINS THE DECLINING LABOUR SHARE?
OECD EMPLOYMENT OUTLOOK 2012 © OECD 2012 127
Box 3.4. Explaining within-industry changes in the labour share: Econometric methodology
In a standard aggregative model of the economy – that is a model with an aggregate production functionwith labour and capital as factors of production, where technical change can be decomposed into neutral,labour-augmenting and capital-augmenting technical change, if labour and product markets arecompetitive, the labour share depends uniquely on capital intensity, the evolution of capital-augmentingtechnical change and the elasticity of substitution between capital and labour (e.g. Acemoglu, 2003;Bentolila and Saint-Paul, 2003). For instance, in the case of a CES production function, we have, in a closedeconomy, that the aggregate labour share F can be expressed as:
where B represents capital-augmenting technical change, k the capital intensity – that is in the ratio of thevolume of capital services to value added – and a function of the elasticity of substitution (= 1 – 1/),which is negative when capital and labour are gross substitutes. It can be easily shown, by using a first-order Taylor approximation of log(1 – x), that this leads to:
[1]
that can be used as a baseline to estimate the determinants of the labour share at the aggregate or industry-level.* Interestingly, [1] implies that the more capital is a gross substitute for labour, the more the increasein capital intensity and capital-augmenting technical change will depress the labour share. If labour andproduct markets are not competitive, then international and domestic product market competition andlabour market institutions (including workers’ bargaining power) will act as shifters of this relationship. Inaddition, cyclical fluctuations in union bargaining power, due for example to unemployment fluctuations,can cause additional departures from this relationship. This implies that the role of these factors can inprinciple be studied by including additional covariates.
The analysis of this chapter is based on [1], augmented by other explanatory and confounding factors andestimated using industry-level data. However, while k is observable in [1], although with some error, B isnot. Nonetheless, as suggested by Bentolila and Saint-Paul (2003), one can approximate B with a measureof total or multi-factor productivity (TFP), which is supposed to capture both capital and labour-augmenting technical change. Indeed, insofar as the latter has no theoretical impact on F conditional on k,the estimated coefficient of TFP should give an indication of the direction and intensity of the impact of B.Obviously, the larger the proportion of neutral or labour-augmenting technical change, the less adequateis TFP as a proxy of capital augmenting technical change, and therefore the smaller its coefficient inestimated versions of [1]. The key difficulty with this approach, however, is that k and B are endogenous.For example, in the model of directed technical change by Acemoglu (2003), the incentives to innovatedepend on the share of income paid to each factor, so that a decrease in the labour share encouragescapital-augmenting technological change. Since, as in a standard growth model, there is no obviousinstrument for k and B, a natural solution, adopted in this chapter when possible, is using GMM estimators(or lagged long differences when GMMs are not feasible). However, insofar as dynamic GMM estimators canbe highly inefficient (and therefore strongly biased in small and medium samples), comparisons withstandard fixed effects models are key, and fixed-effect estimates are preferred for inference whenendogeneity biases appears negligible. Indeed, the consistency between different estimates is reassuringon their reliability. Finally, in order to keep the model tractable with GMM estimators, in order to control forall aggregate variables, country-by-time effects are systematically taken into account by de-meaning allvariables, thereby avoiding the inclusion of a large number of co-variates in the specification. This impliesthat the estimated specifications would take the form (see Bassanini and Manfredi, 2012, for more details):
[2]
where TFP stands for a measure of level TFP whose changes can act as a noisy proxy for capital-augmentingtechnical change, X is a vector of other labour-share determinants and controls that vary by country i,industry j and time t, are country-by-industry and country-by-time effects, is an error term and other
)(1 ttt kBF
ttt kBConstF loglog
itijijtijtijtijt XkTFPF loglog
3. LABOUR LOSING TO CAPITAL: WHAT EXPLAINS THE DECLINING LABOUR SHARE?
OECD EMPLOYMENT OUTLOOK 2012 © OECD 2012128
and 2007 the increase in capital intensity and TFP in OECD countries accounted, on
average, for as much as 80% of the within-industry change of the labour share.26
What explains this strong negative effect of technical change and capital
accumulation on the labour share? One possible explanation has to do with the diffusion
of information and communication technologies (ICTs) as a new general-purpose
technology, which has created opportunities for unprecedented advances in innovation
and invention of new (increasingly cheaper) capital goods and production processes. This
Box 3.4. Explaining within-industry changes in the labour share: Econometric methodology (cont.)
Greek letters are parameters to be estimated. The disadvantage of this approach is that it does not allowidentifying the effect of aggregate variables such as collective bargaining institutions, which in Section 3are therefore explored in a more qualitative way. By contrast, following the approach pioneered by OECD(2007), the impact of certain labour market policies and institutions, such as dismissal regulations and thelevel of the minimum wage, can be analysed by looking at differences in their effects between industries inwhich they are more likely to be binding and other industries. For example, the industries whereemployment protection legislation concerning permanent contracts is more likely to be binding will bethose where firms typically need to lay off workers to restructure their operations in response to changesin technologies or product demand and where, therefore, high firing costs are likely to slow the pace ofreallocation of resources. In these industries, one can expect that dismissal regulations have the greatestimpact on productivity and wages and, therefore, the wage share. By contrast, in industries where firmscan restructure through internal adjustments or by relying on natural attrition of staff, changes inemployment protection for open-ended contracts can be expected to have little impact. Similarly, the effectof the minimum wage can be identified by assuming that changes in minimum wages have a greaterimpact on wages and productivity in industries that are more heavily reliant on low-wage labour.
* [1] can be considered a reduced-form approximation if the aggregate production function is not CES.
Figure 3.9. TFP growth, capital accumulation and within-industry decline of the labour share
Estimated percentage-point impact on the labour share of one-per cent increases in selected variables
Note: Estimated within-industry impact of a one-percent increase in total factor productivity (TFP) and the ratio ofcapital services to value added (capital intensity). ***: significant at the 1% level.
Source: Bassanini, A. and T. Manfredi (2012), “Capital’s Grabbing Hand? A Cross-country/Cross-industry Analysis ofthe Decline of the Labour Share”, OECD Social, Employment and Migration Working Paper, OECD Publishing, Paris,forthcoming.
1 2 http://dx.doi.org/10.1787/888932651655
0.00
-0.02
-0.04
-0.06
-0.08
-0.10
-0.12
-0.14
-0.16***
***
TFP Capital intensity
3. LABOUR LOSING TO CAPITAL: WHAT EXPLAINS THE DECLINING LABOUR SHARE?
OECD EMPLOYMENT OUTLOOK 2012 © OECD 2012 129
has boosted productivity but also allowed extensive automation of production and high
substitution between capital and labour (see e.g. Greenwood and Jovanovic, 1999;
Brynjolfsson and McAfee, 2011). This conclusion is confirmed by Arpaia et al. (2009) who,
using a structural model, suggest that in the past twenty years, technical change was in
fact capital-augmenting.27 By contrast, they argue that the high degree of substitution
between capital and labour was in fact due to high substitution between capital and low-
skilled labour and complementarity between capital and high-skilled labour. Other
scholars have advanced the possibility that, within this context, technical change could be
labour-replacing, in the sense that technological progress takes the form of machines
replacing tasks previously performed by labour. In turn, this would especially reduce job
opportunities for low-educated workers and, in practice, dampen the aggregate
productivity of low-skilled labour (see Zeira, 1998; Arthur, 2011; and the survey on
machine-replacing-labour technical change in Acemoglu, 2011).
Both interpretations appear consistent with two additional pieces of empirical
evidence. First, labour productivity growth has been associated with increases in the share
of those with tertiary education in labour compensation and contractions of the shares of
those with lower levels of education, and particularly those with less than upper secondary
education. Second, decomposing further this association, ICT capital accumulation
appears to have had an especially negative effect on the lowest educated, while TFP growth
has affected particularly the share of those with intermediate education (see Bassanini and
Manfredi, 2012). These two results taken together suggest that, in the period under
analysis, technical change embodied in ICT capital was strongly biased against the low-
educated, while disembodied technical change was strongly biased towards high-skilled
labour. While the first result is fully consistent with the literature on skill-biased technical
change, one possible explanation of the latter is that disembodied technical progress
reflects embodiment in intangible capital (entrepreneurship, output from R&D
departments, better management, high-performing human resource practices) – that is
improvements that are essentially incorporated in highly-qualified personnel.
From a policy perspective, however, it is not possible with the available data to assess
whether the negative relationship between technical progress and changes in the labour
share is a long-lasting relationship or is specific to the past decades and will progressively
disappear when the process of diffusion of ICT-based technologies slows down. On the one
hand, the standard view in the theory of economic growth is that, in the long-run, capital
and labour are complements and technical change augments the factor that cannot be
accumulated (that is labour, see e.g. Acemoglu, 2002). Hence, capital-augmenting technical
change and substitutability between capital and labour are likely to be only a temporary
phenomenon due to the rapid diffusion of ICT-based technologies and related innovations.
By contrast, within this view, to the extent that the skilled labour supply increases faster,
thereby increasing incentives to create capital goods complementary to skilled labour,
technical change would remain biased against the unskilled. On the other hand, a more
pessimistic view considers that ICT has changed the nature of technological advances,
making them more rapid but incorporated in machines whose main purpose is to replace
jobs previously held by certain categories of workers (Brynjolfsson and McAfee, 2011;
Acemoglu, 2011). If this were the case, most workers, and in particular the least educated,
would find themselves in a “race against the machine”, thereby increasingly worsening
their relative position.
3. LABOUR LOSING TO CAPITAL: WHAT EXPLAINS THE DECLINING LABOUR SHARE?
OECD EMPLOYMENT OUTLOOK 2012 © OECD 2012130
The impact of international competition, offshoring and foreign direct investment
Another key factor shaping the OECD economies over the past decades has been the
closer integration of labour and product markets. Technological changes and the
progressive removal of cross-border restrictions to trade and capital flows have made it
possible to locate production sites for both goods and services further away from the
markets for final demand, while international migration has globalised labour supply. By
allowing a fuller exploitation of economies of scale and comparative advantage through
greater exports, this process of trade expansion has provided a boost to economic growth
in OECD countries (see e.g. Felbermayr et al., 2011). Nevertheless, increased international
competition has also raised competitive pressure on businesses located in the richest
countries and reinforced the need for them to contain labour costs. Firms and activities
unable to remain competitive either downsize and, eventually, disappear or delocalise to
countries where relative labour costs appear more favourable. In the face of these
pressures, workers might accept to contain their wage claims to save their jobs, while
companies might increase the automation of the production process to remain
competitive. There is indeed much evidence that increased import penetration from, and
offshoring of production to, developing countries is associated with greater sensitivity of
domestic labour demand to labour costs (see e.g. OECD, 2007; Hijzen and Swaim; 2010;
Bloom et al., 2011).28
The available but scant aggregate evidence suggests that declines in import prices
have contributed to dampen the labour share in high-income countries, due to the fact that
imports come increasingly from developing countries, and goods imported from these
countries are typically labour intensive (e.g. Harrison, 2002; IMF, 2007).29 To the extent that
barriers to outward capital movements are limited and have decreased over time, greater
import penetration is also likely to reflect delocalisation of production abroad while still
serving domestic demand. For example ILO (2011) finds that the ratio of foreign assets and
liabilities to GDP is negatively associated with the labour share in aggregate cross-country
regressions. Aggregate analyses, however, do not allow taking into account potential
endogeneity and controlling for a full list of confounding factors.30 In this context,
industry-level estimations performed for this chapter do not suggest any association
between rising competition in domestic markets due to an increase in the penetration of
goods produced abroad and the within-industry decline of the labour share. In fact, this
decline is not found to be correlated with either changes in the relative price of imports
with respect to domestic products or with measures of import penetration and trade
exposure – defined as the sum of import penetration and export orientation31 – even when
the possible endogeneity of the latter is taken into account (see Bassanini and Manfredi,
2012, for detailed estimates).32
One needs to remain cautious, nevertheless, about drawing conclusions from these
findings. Indeed, these estimates are likely to represent a lower bound on the true effect of
fiercer import competition, if that effect is negative. In fact, competition for rich-country
markets from firms producing in countries with low labour cost is likely to be particularly
strong for domestic businesses whose production activity is intensive in low-skilled labour.
If competition from low-cost foreign producers drives these businesses out of the market
or forces them to relocate abroad, the industry will become relatively more skill-intensive.
Conditional on capital intensity, this will probably push up the labour share in these
industries, insofar as skilled labour’s bargaining power is larger – as suggested by the
empirical evidence (e.g. Cahuc et al., 2006).33 By contrast, unskilled workers will be partially
3. LABOUR LOSING TO CAPITAL: WHAT EXPLAINS THE DECLINING LABOUR SHARE?
OECD EMPLOYMENT OUTLOOK 2012 © OECD 2012 131
re-employed in other industries – less affected by import competition – thereby driving
down the labour share of these industries. As a consequence, to the extent that estimated
effects are identified through cross-industry comparisons of within-industry differences,
the estimated effects will tend to be upward-biased. Unfortunately, reliable data by skills or
educational attainment are not available at a sufficiently disaggregated level to test for this
hypothesis. Nonetheless, estimations performed for this chapter show that, in advanced
economies, greater import penetration prompts reallocation of resources away from
affected industries and towards either other domestic industries or countries with lower
labour costs (see Bassanini and Manfredi, 2012). The finding that industry downsizing is
more important in industries with the largest increase in import penetration is consistent
with the above argument and, therefore, provides some confirmation of the likely upward-
bias of within-industry estimates of the impact of import competition on the labour share.
In addition, the growth of import penetration appears more important in industries
that are typically characterised by a high labour share (see Bassanini and Manfredi, 2012).
This implies that larger trade-induced reallocation away from these industries resulted in
a fall in the share of these industries in aggregate value added, thereby contributing to a
decline in the aggregate labour share. For example, between 1990 and 2007 the rise in the
penetration of manufacturing imports and the induced pattern of cross-industry
reallocation are estimated to explain a decline in the labour share in manufacturing of
0.1 percentage points, on average, in countries with real wages above one half of the
US level (high-wage countries hereafter). This corresponds to about 3% of the whole
contraction of the manufacturing labour share in high-wage countries. The effect is
statistically significant although small.
Competition from abroad for the market of finished goods is not the only channel
through which globalisation can exert influences on the labour share, however. For
example, domestic companies can outsource abroad part of the production chain or
threaten to do so – particularly the production of unskilled-labour-intensive intermediate
inputs – as a strategy to cope with labour-cost pressures. Aggregate evidence suggests that
offshoring of intermediate stages of production is negatively related to the labour share
(Jaumotte and Tytell, 2007). At the industry-level, OECD (2007) and Hijzen and Swaim (2010)
find that intra-industry offshoring (defined as the ratio of imported same-industry inputs
to domestic output) is negatively associated with labour demand and positively associated
with its wage elasticity. Industry-level estimates performed for this chapter suggests that
delocalisation of intermediate stages of the production process, as measured by intra-
industry offshoring (defined as in OECD, 2007), exerts a small but significant downward
pressure on the wage bill relative to value added (Figure 3.10). Between 1995 and 2005,
intra-industry offshoring in manufacturing increased by 0.8 percentage points on average
in the high-wage countries for which data are available. This change is estimated to have
induced the labour share to decline by about 0.2 percentage points. As the average decline
in the labour share in these industries was about 3 percentage points during this period,
this implies that the rise in intra-industry offshoring can account for about 7% of the
within-industry reduction in the labour share.34
If delocalisation of production activities abroad exerts a downward pressure on wages
and labour demand, one could expect that inward foreign direct investment (FDI) would
have a more positive impact on workers. Indeed, foreign takeovers are usually estimated to
raise wage growth in the acquired firm. Moreover, there is evidence in the literature of
wage spillovers from FDI to other domestic firms, even if less so for unskilled workers in
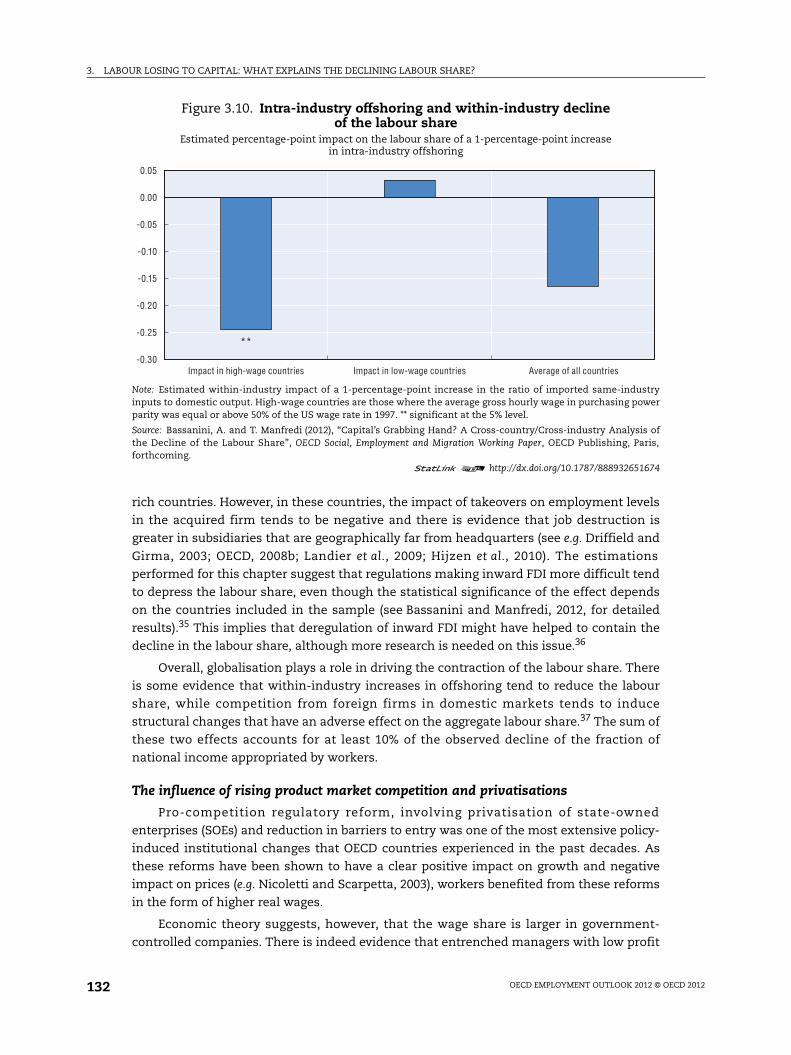
3. LABOUR LOSING TO CAPITAL: WHAT EXPLAINS THE DECLINING LABOUR SHARE?
OECD EMPLOYMENT OUTLOOK 2012 © OECD 2012132
rich countries. However, in these countries, the impact of takeovers on employment levels
in the acquired firm tends to be negative and there is evidence that job destruction is
greater in subsidiaries that are geographically far from headquarters (see e.g. Driffield and
Girma, 2003; OECD, 2008b; Landier et al., 2009; Hijzen et al., 2010). The estimations
performed for this chapter suggest that regulations making inward FDI more difficult tend
to depress the labour share, even though the statistical significance of the effect depends
on the countries included in the sample (see Bassanini and Manfredi, 2012, for detailed
results).35 This implies that deregulation of inward FDI might have helped to contain the
decline in the labour share, although more research is needed on this issue.36
Overall, globalisation plays a role in driving the contraction of the labour share. There
is some evidence that within-industry increases in offshoring tend to reduce the labour
share, while competition from foreign firms in domestic markets tends to induce
structural changes that have an adverse effect on the aggregate labour share.37 The sum of
these two effects accounts for at least 10% of the observed decline of the fraction of
national income appropriated by workers.
The influence of rising product market competition and privatisations
Pro-competition regulatory reform, involving privatisation of state-owned
enterprises (SOEs) and reduction in barriers to entry was one of the most extensive policy-
induced institutional changes that OECD countries experienced in the past decades. As
these reforms have been shown to have a clear positive impact on growth and negative
impact on prices (e.g. Nicoletti and Scarpetta, 2003), workers benefited from these reforms
in the form of higher real wages.
Economic theory suggests, however, that the wage share is larger in government-
controlled companies. There is indeed evidence that entrenched managers with low profit
Figure 3.10. Intra-industry offshoring and within-industry decline of the labour share
Estimated percentage-point impact on the labour share of a 1-percentage-point increasein intra-industry offshoring
Note: Estimated within-industry impact of a 1-percentage-point increase in the ratio of imported same-industryinputs to domestic output. High-wage countries are those where the average gross hourly wage in purchasing powerparity was equal or above 50% of the US wage rate in 1997. ** significant at the 5% level.
Source: Bassanini, A. and T. Manfredi (2012), “Capital’s Grabbing Hand? A Cross-country/Cross-industry Analysis ofthe Decline of the Labour Share”, OECD Social, Employment and Migration Working Paper, OECD Publishing, Paris,forthcoming.
1 2 http://dx.doi.org/10.1787/888932651674
0.05
0.00
-0.05
-0.10
-0.15
-0.20
-0.25
-0.30
**
Impact in high-wage countries Impact in low-wage countries Average of all countries
3. LABOUR LOSING TO CAPITAL: WHAT EXPLAINS THE DECLINING LABOUR SHARE?
OECD EMPLOYMENT OUTLOOK 2012 © OECD 2012 133
stakes (and weak budget constraints) care about their company’s level of employment
either to minimise conflicts or to increase their influence on the society (see e.g. Bertrand
and Mullainathan, 2003; Atanassov and Kim, 2009). Moreover, one can expect managers of
SOEs to be influenced by political pressures to maintain inefficiently high employment
levels (e.g. Bertrand et al., 2005). In both cases this leads to a larger wage share in SOEs,
so that their privatisation is likely to result in a decline of the labour share (Azmat
et al., 2012).38
By contrast, in a standard theoretical model with homogenous firms and workers,
deregulation of barriers to firm entry is expected to increase the labour share (see for
example Blanchard and Giavazzi, 2003). This is because greater competition in the product
markets decreases the rents accruing to the firm and, thus, the surplus that is shared with
the workers. However, price mark-ups are typically estimated to be greater than wage
mark-ups – that is the wedge between the bargained wage and the reservation wage, so
that the nominal wage bill should decrease less than nominal value added and the wage
share should increase.
The impact of barriers to entry and public ownership on the labour share is analysed
empirically in this chapter, by looking at the relationship among these three variables on a
sample of network industries (such as energy, transport and communications) in 25 OECD
countries between 1980 and 2007 (see Bassanini and Manfredi, 2012, for detailed
estimation results). The restriction of the analysis to these industries is due to data
availability, since long time series of OECD indicators on industry-specific regulations and
public ownership are available only for these industries. Nevertheless, they are industries
that were characterised by strict regulations and much government control in the 1980s
and early 1990s, but underwent massive pro-competitive liberalisation thereafter
(see Wölfl et al., 2009). They also are among the industries that experienced the greatest
fall in the labour share (see Figure 3.5). Therefore, these industries provide an interesting
“testing ground” to study the effect of deregulation and privatisation on the labour share.
The empirical analysis that has been carried out for the chapter confirms the
theoretical prediction that public ownership is positively associated with the labour share
(Figure 3.11).39 Taking the most reliable estimates at face value, the results suggest that the
average reduction in public ownership observed in network industries between 1990
and 2007 in OECD countries (about 0.1 points per year of the corresponding OECD
indicator) yielded a within-industry decline in the labour share by about 0.12 percentage
points per year.40 Put it another way, these findings suggest that the large-scale
privatisation of network industries can explain about 33% of the decline of the labour share
in these industries.
How relevant is the impact of privatisations on the evolution of the labour share for
the whole business sector? Network industries accounted on average for 15% of the
business sector’s value added in this period. Therefore, assuming that privatisations did
not contribute to the decline of the labour share outside network industries, the measured
reduction of public ownership in these industries already accounts for about 5% of the
contraction of the labour share in the whole business sector. What is more, in many
countries, sales of government shares in SOEs was not confined to network industries.41
Therefore, even if one needs to be cautious about extending the findings for network
industries to other industries, the true impact of privatisations on the decline in the
business sector’s labour share may well have been larger than what the figures above
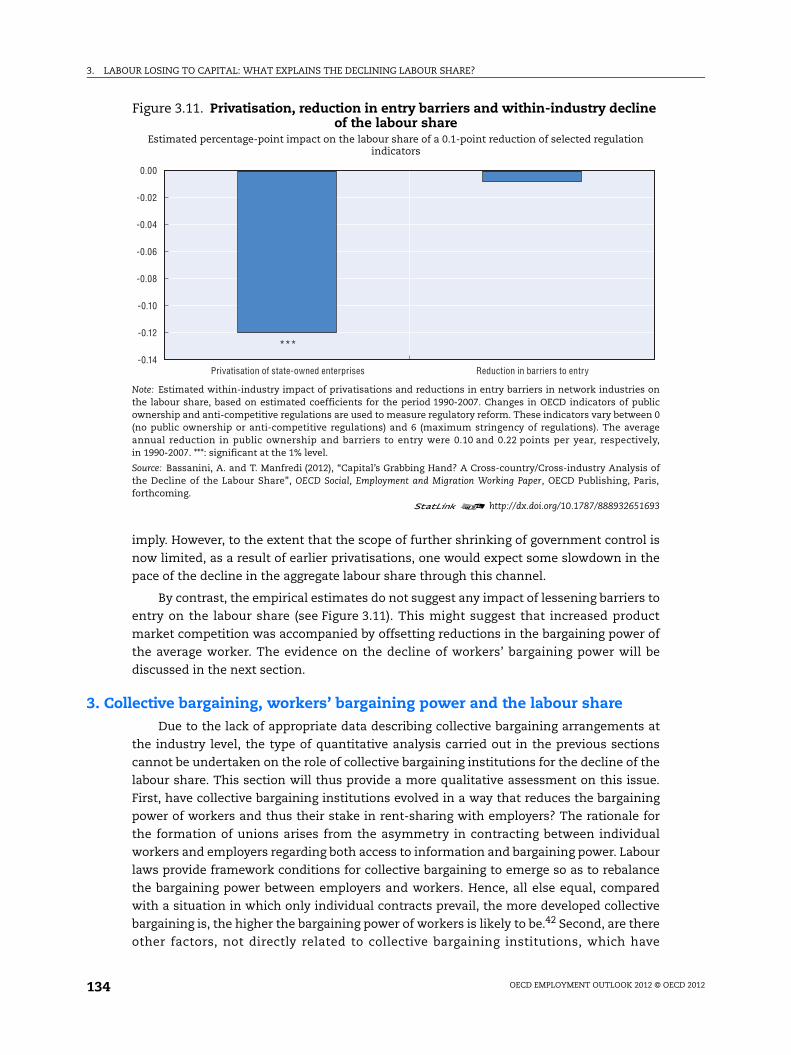
3. LABOUR LOSING TO CAPITAL: WHAT EXPLAINS THE DECLINING LABOUR SHARE?
OECD EMPLOYMENT OUTLOOK 2012 © OECD 2012134
imply. However, to the extent that the scope of further shrinking of government control is
now limited, as a result of earlier privatisations, one would expect some slowdown in the
pace of the decline in the aggregate labour share through this channel.
By contrast, the empirical estimates do not suggest any impact of lessening barriers to
entry on the labour share (see Figure 3.11). This might suggest that increased product
market competition was accompanied by offsetting reductions in the bargaining power of
the average worker. The evidence on the decline of workers’ bargaining power will be
discussed in the next section.
3. Collective bargaining, workers’ bargaining power and the labour shareDue to the lack of appropriate data describing collective bargaining arrangements at
the industry level, the type of quantitative analysis carried out in the previous sections
cannot be undertaken on the role of collective bargaining institutions for the decline of the
labour share. This section will thus provide a more qualitative assessment on this issue.
First, have collective bargaining institutions evolved in a way that reduces the bargaining
power of workers and thus their stake in rent-sharing with employers? The rationale for
the formation of unions arises from the asymmetry in contracting between individual
workers and employers regarding both access to information and bargaining power. Labour
laws provide framework conditions for collective bargaining to emerge so as to rebalance
the bargaining power between employers and workers. Hence, all else equal, compared
with a situation in which only individual contracts prevail, the more developed collective
bargaining is, the higher the bargaining power of workers is likely to be.42 Second, are there
other factors, not directly related to collective bargaining institutions, which have
Figure 3.11. Privatisation, reduction in entry barriers and within-industry decline of the labour share
Estimated percentage-point impact on the labour share of a 0.1-point reduction of selected regulation indicators
Note: Estimated within-industry impact of privatisations and reductions in entry barriers in network industries onthe labour share, based on estimated coefficients for the period 1990-2007. Changes in OECD indicators of publicownership and anti-competitive regulations are used to measure regulatory reform. These indicators vary between 0(no public ownership or anti-competitive regulations) and 6 (maximum stringency of regulations). The averageannual reduction in public ownership and barriers to entry were 0.10 and 0.22 points per year, respectively,in 1990-2007. ***: significant at the 1% level.
Source: Bassanini, A. and T. Manfredi (2012), “Capital’s Grabbing Hand? A Cross-country/Cross-industry Analysis ofthe Decline of the Labour Share”, OECD Social, Employment and Migration Working Paper, OECD Publishing, Paris,forthcoming.
1 2 http://dx.doi.org/10.1787/888932651693
0.00
-0.02
-0.04
-0.06
-0.08
-0.10
-0.12
-0.14***
Privatisation of state-owned enterprises Reduction in barriers to entry
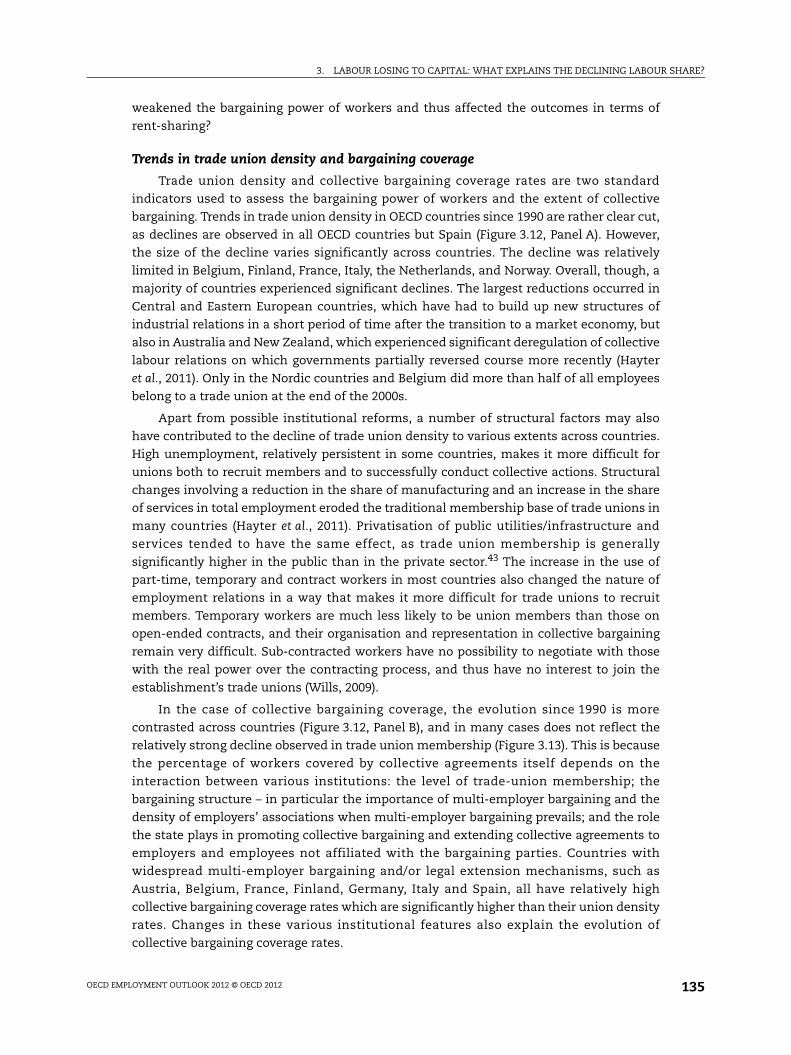
3. LABOUR LOSING TO CAPITAL: WHAT EXPLAINS THE DECLINING LABOUR SHARE?
OECD EMPLOYMENT OUTLOOK 2012 © OECD 2012 135
weakened the bargaining power of workers and thus affected the outcomes in terms of
rent-sharing?
Trends in trade union density and bargaining coverage
Trade union density and collective bargaining coverage rates are two standard
indicators used to assess the bargaining power of workers and the extent of collective
bargaining. Trends in trade union density in OECD countries since 1990 are rather clear cut,
as declines are observed in all OECD countries but Spain (Figure 3.12, Panel A). However,
the size of the decline varies significantly across countries. The decline was relatively
limited in Belgium, Finland, France, Italy, the Netherlands, and Norway. Overall, though, a
majority of countries experienced significant declines. The largest reductions occurred in
Central and Eastern European countries, which have had to build up new structures of
industrial relations in a short period of time after the transition to a market economy, but
also in Australia and New Zealand, which experienced significant deregulation of collective
labour relations on which governments partially reversed course more recently (Hayter
et al., 2011). Only in the Nordic countries and Belgium did more than half of all employees
belong to a trade union at the end of the 2000s.
Apart from possible institutional reforms, a number of structural factors may also
have contributed to the decline of trade union density to various extents across countries.
High unemployment, relatively persistent in some countries, makes it more difficult for
unions both to recruit members and to successfully conduct collective actions. Structural
changes involving a reduction in the share of manufacturing and an increase in the share
of services in total employment eroded the traditional membership base of trade unions in
many countries (Hayter et al., 2011). Privatisation of public utilities/infrastructure and
services tended to have the same effect, as trade union membership is generally
significantly higher in the public than in the private sector.43 The increase in the use of
part-time, temporary and contract workers in most countries also changed the nature of
employment relations in a way that makes it more difficult for trade unions to recruit
members. Temporary workers are much less likely to be union members than those on
open-ended contracts, and their organisation and representation in collective bargaining
remain very difficult. Sub-contracted workers have no possibility to negotiate with those
with the real power over the contracting process, and thus have no interest to join the
establishment’s trade unions (Wills, 2009).
In the case of collective bargaining coverage, the evolution since 1990 is more
contrasted across countries (Figure 3.12, Panel B), and in many cases does not reflect the
relatively strong decline observed in trade union membership (Figure 3.13). This is because
the percentage of workers covered by collective agreements itself depends on the
interaction between various institutions: the level of trade-union membership; the
bargaining structure – in particular the importance of multi-employer bargaining and the
density of employers’ associations when multi-employer bargaining prevails; and the role
the state plays in promoting collective bargaining and extending collective agreements to
employers and employees not affiliated with the bargaining parties. Countries with
widespread multi-employer bargaining and/or legal extension mechanisms, such as
Austria, Belgium, France, Finland, Germany, Italy and Spain, all have relatively high
collective bargaining coverage rates which are significantly higher than their union density
rates. Changes in these various institutional features also explain the evolution of
collective bargaining coverage rates.
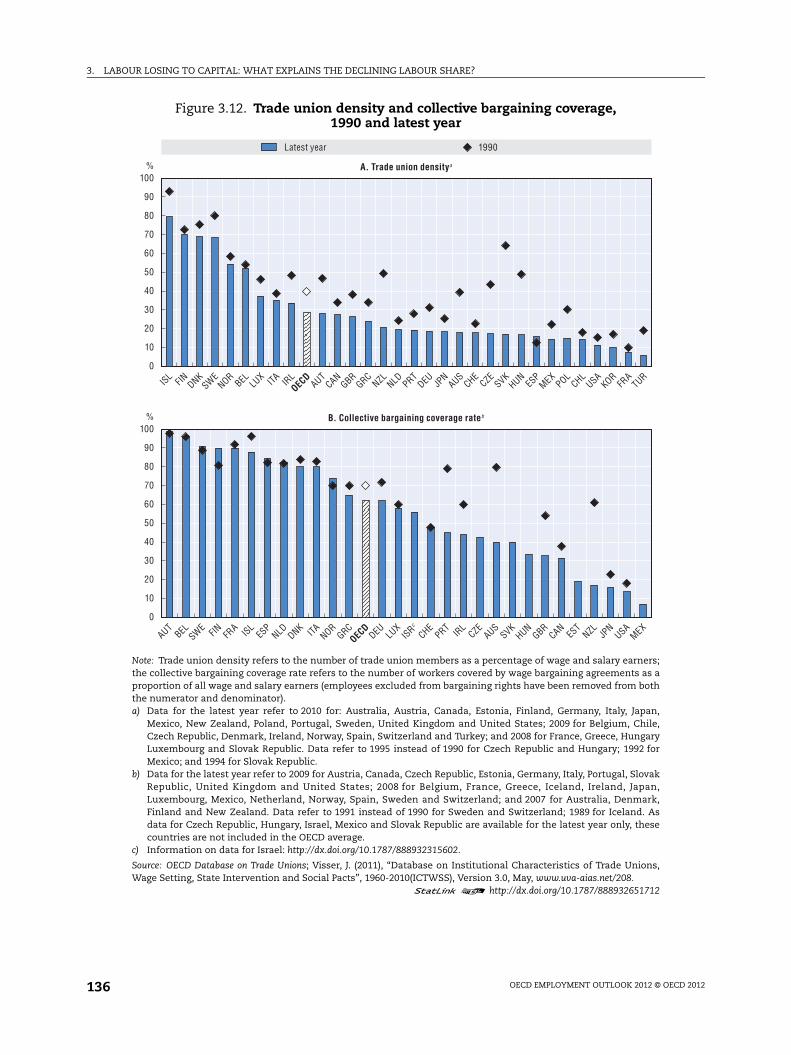
3. LABOUR LOSING TO CAPITAL: WHAT EXPLAINS THE DECLINING LABOUR SHARE?
OECD EMPLOYMENT OUTLOOK 2012 © OECD 2012136
Figure 3.12. Trade union density and collective bargaining coverage, 1990 and latest year
Note: Trade union density refers to the number of trade union members as a percentage of wage and salary earners;the collective bargaining coverage rate refers to the number of workers covered by wage bargaining agreements as aproportion of all wage and salary earners (employees excluded from bargaining rights have been removed from boththe numerator and denominator). a) Data for the latest year refer to 2010 for: Australia, Austria, Canada, Estonia, Finland, Germany, Italy, Japan,
Mexico, New Zealand, Poland, Portugal, Sweden, United Kingdom and United States; 2009 for Belgium, Chile,Czech Republic, Denmark, Ireland, Norway, Spain, Switzerland and Turkey; and 2008 for France, Greece, HungaryLuxembourg and Slovak Republic. Data refer to 1995 instead of 1990 for Czech Republic and Hungary; 1992 forMexico; and 1994 for Slovak Republic.
b) Data for the latest year refer to 2009 for Austria, Canada, Czech Republic, Estonia, Germany, Italy, Portugal, SlovakRepublic, United Kingdom and United States; 2008 for Belgium, France, Greece, Iceland, Ireland, Japan,Luxembourg, Mexico, Netherland, Norway, Spain, Sweden and Switzerland; and 2007 for Australia, Denmark,Finland and New Zealand. Data refer to 1991 instead of 1990 for Sweden and Switzerland; 1989 for Iceland. Asdata for Czech Republic, Hungary, Israel, Mexico and Slovak Republic are available for the latest year only, thesecountries are not included in the OECD average.
c) Information on data for Israel: http://dx.doi.org/10.1787/888932315602.
Source: OECD Database on Trade Unions; Visser, J. (2011), “Database on Institutional Characteristics of Trade Unions,Wage Setting, State Intervention and Social Pacts”, 1960-2010(ICTWSS), Version 3.0, May, www.uva-aias.net/208.
1 2 http://dx.doi.org/10.1787/888932651712
100
90
80
70
60
50
40
30
20
10
0
ISL FI
N D
NK S
WE N
OR B
EL L
UX IT
A IR
L A
UT C
AN G
BR G
RC N
ZL NLD P
RT D
EU JP
N A
US C
HE C
ZE S
VK H
UN E
SP M
EX P
OL C
HL U
SA K
OR F
RA T
UR
%
100
90
80
70
60
50
40
30
20
10
0
AUT
BEL
SWE
FIN
FRA
ISL
ESP
NLD
DNK
NOR
GRC
ITA
DEU
LUX
ISRc
CHE
PRT
IRL
CZE
AUS
SVK
HUN
GBR
CAN
EST
NZL
JPN
USA
MEX
%
A. Trade union densitya
Latest year 1990
OEC
D
B. Collective bargaining coverage rateb
OEC
D
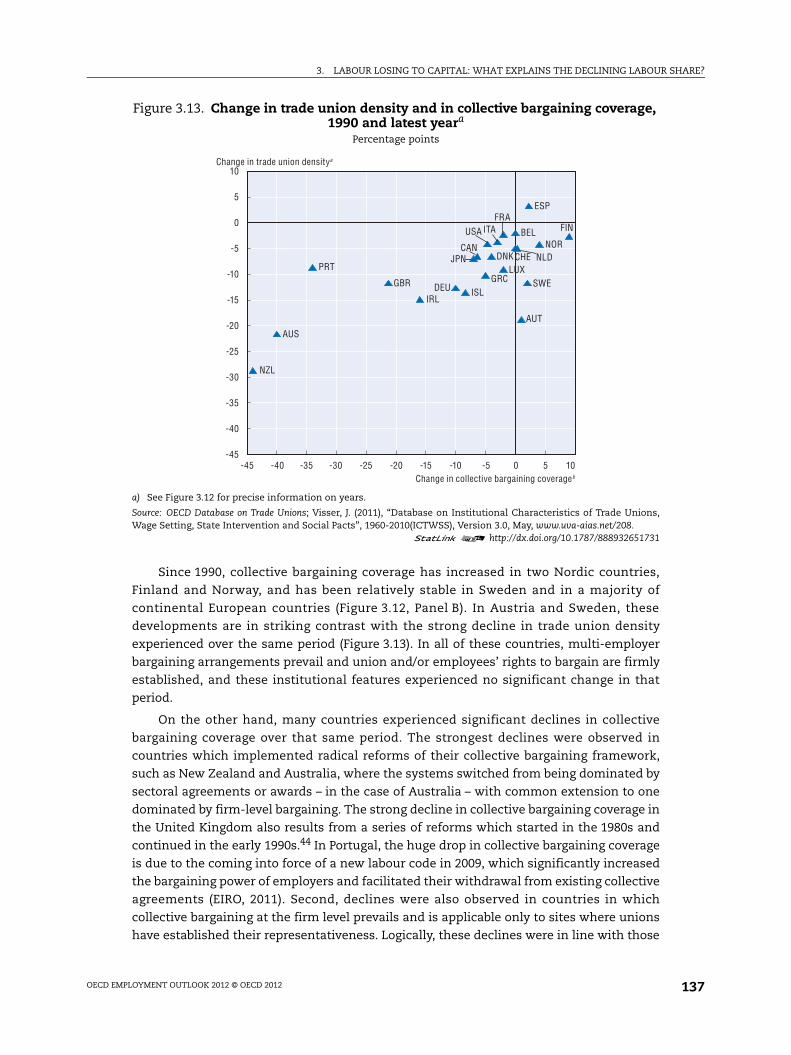
3. LABOUR LOSING TO CAPITAL: WHAT EXPLAINS THE DECLINING LABOUR SHARE?
OECD EMPLOYMENT OUTLOOK 2012 © OECD 2012 137
Since 1990, collective bargaining coverage has increased in two Nordic countries,
Finland and Norway, and has been relatively stable in Sweden and in a majority of
continental European countries (Figure 3.12, Panel B). In Austria and Sweden, these
developments are in striking contrast with the strong decline in trade union density
experienced over the same period (Figure 3.13). In all of these countries, multi-employer
bargaining arrangements prevail and union and/or employees’ rights to bargain are firmly
established, and these institutional features experienced no significant change in that
period.
On the other hand, many countries experienced significant declines in collective
bargaining coverage over that same period. The strongest declines were observed in
countries which implemented radical reforms of their collective bargaining framework,
such as New Zealand and Australia, where the systems switched from being dominated by
sectoral agreements or awards – in the case of Australia – with common extension to one
dominated by firm-level bargaining. The strong decline in collective bargaining coverage in
the United Kingdom also results from a series of reforms which started in the 1980s and
continued in the early 1990s.44 In Portugal, the huge drop in collective bargaining coverage
is due to the coming into force of a new labour code in 2009, which significantly increased
the bargaining power of employers and facilitated their withdrawal from existing collective
agreements (EIRO, 2011). Second, declines were also observed in countries in which
collective bargaining at the firm level prevails and is applicable only to sites where unions
have established their representativeness. Logically, these declines were in line with those
Figure 3.13. Change in trade union density and in collective bargaining coverage, 1990 and latest yeara
Percentage points
a) See Figure 3.12 for precise information on years.
Source: OECD Database on Trade Unions; Visser, J. (2011), “Database on Institutional Characteristics of Trade Unions,Wage Setting, State Intervention and Social Pacts”, 1960-2010(ICTWSS), Version 3.0, May, www.uva-aias.net/208.
1 2 http://dx.doi.org/10.1787/888932651731
10
5
0
-5
-10
-15
-20
-25
-30
-35
-40
-45-45 -40 -35 -30 -25 -20 -15 -10 0-5 5 10
AUS
AUT
BEL
CANCHE
DEU
DNK
ESP
FINFRA
GBR GRC
IRLISL
ITA
JPNLUX
NLDNOR
NZL
PRT
SWE
USA
Change in trade union densitya
Change in collective bargaining coverageb
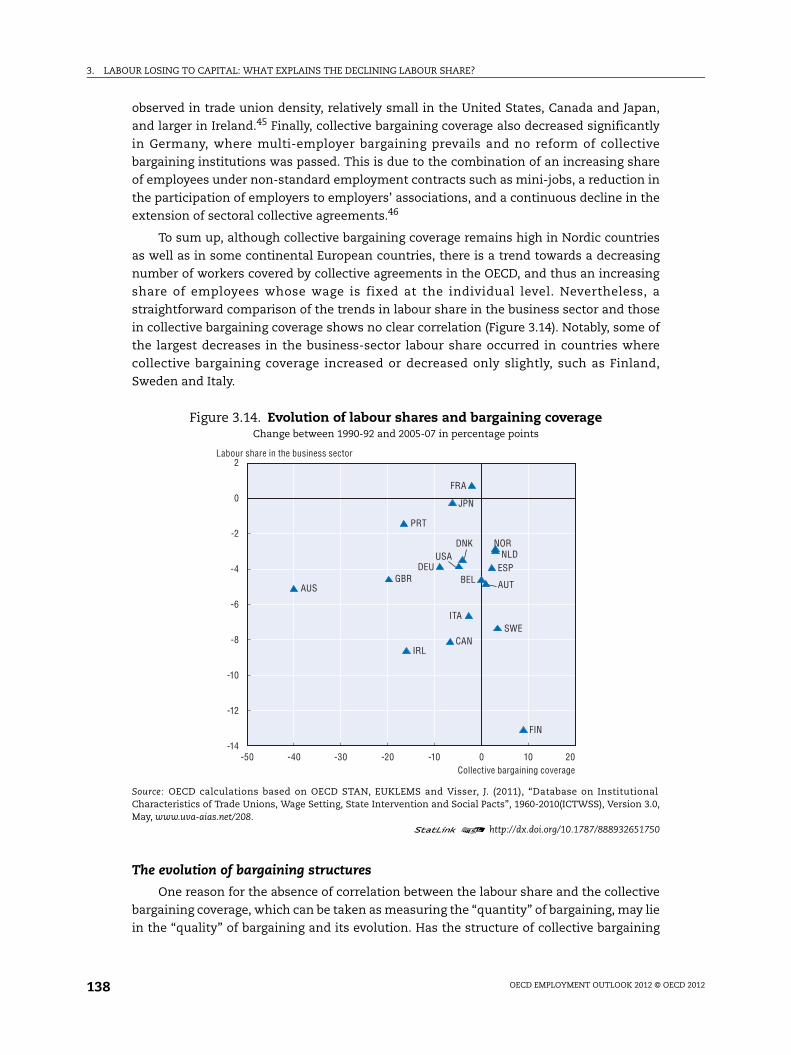
3. LABOUR LOSING TO CAPITAL: WHAT EXPLAINS THE DECLINING LABOUR SHARE?
OECD EMPLOYMENT OUTLOOK 2012 © OECD 2012138
observed in trade union density, relatively small in the United States, Canada and Japan,
and larger in Ireland.45 Finally, collective bargaining coverage also decreased significantly
in Germany, where multi-employer bargaining prevails and no reform of collective
bargaining institutions was passed. This is due to the combination of an increasing share
of employees under non-standard employment contracts such as mini-jobs, a reduction in
the participation of employers to employers’ associations, and a continuous decline in the
extension of sectoral collective agreements.46
To sum up, although collective bargaining coverage remains high in Nordic countries
as well as in some continental European countries, there is a trend towards a decreasing
number of workers covered by collective agreements in the OECD, and thus an increasing
share of employees whose wage is fixed at the individual level. Nevertheless, a
straightforward comparison of the trends in labour share in the business sector and those
in collective bargaining coverage shows no clear correlation (Figure 3.14). Notably, some of
the largest decreases in the business-sector labour share occurred in countries where
collective bargaining coverage increased or decreased only slightly, such as Finland,
Sweden and Italy.
The evolution of bargaining structures
One reason for the absence of correlation between the labour share and the collective
bargaining coverage, which can be taken as measuring the “quantity” of bargaining, may lie
in the “quality” of bargaining and its evolution. Has the structure of collective bargaining
Figure 3.14. Evolution of labour shares and bargaining coverageChange between 1990-92 and 2005-07 in percentage points
Source: OECD calculations based on OECD STAN, EUKLEMS and Visser, J. (2011), “Database on InstitutionalCharacteristics of Trade Unions, Wage Setting, State Intervention and Social Pacts”, 1960-2010(ICTWSS), Version 3.0,May, www.uva-aias.net/208.
1 2 http://dx.doi.org/10.1787/888932651750
2
0
-2
-4
-6
-8
-10
-12
-14-50 -40 -30 -20 -10 0 10 20
FIN
IRLCAN
SWEITA
AUS AUTBELGBRESPDEU
USADNK
NLDNOR
PRT
JPN
FRA
Labour share in the business sector
Collective bargaining coverage
3. LABOUR LOSING TO CAPITAL: WHAT EXPLAINS THE DECLINING LABOUR SHARE?
OECD EMPLOYMENT OUTLOOK 2012 © OECD 2012 139
institutions evolved in a way that contributed to diminish the share of value-added
accruing to workers between 1990 and the years preceding the global financial crisis?
As noted above, Australia and New Zealand are the only countries which experienced
radical change in their type of collective bargaining systems since 1990. As a result,
Australia and New Zealand now form part of the group of countries in which collective
bargaining is very decentralised, taking place mostly at the firm/establishment level, and
where there is no or little attempt or possibility to co-ordinate wage negotiations among
the various actors. This group also includes Canada, Japan, Korea, Poland, the United
Kingdom and the United States (Table 3.1). Sectoral agreements still exist in these
countries, but mostly in the public sector or in a few specific business sectors. In the other
OECD countries, changes in collective bargaining systems have taken place mostly within
the existing institutions, through incremental reforms or changes, with various degrees of
government involvement.
Central agreements to overcome co-ordination failures
In a number of European countries where sectoral bargaining was playing a major role,
governments pushed in the 1990s for the (re-)emergence of agreements at the national
level. The implementation of such agreements is very much linked to the European
economic integration process. Although economic internationalisation and financial
liberalisation was taking place in many countries and regions, market integration was
particularly deep within the European Union, bringing workers in the various countries
into competition with each other. In addition, monetary integration ruled out external
adjustment via the exchange rate to compensate for losses in national competitiveness,
and, starting from 1999 for EMU countries, the use of monetary policy instruments to
adjust to asymmetric shocks. As a result, the burden of adjustment to economic
imbalances and shocks shifted increasingly onto the labour market.47 Some European
countries had centralised and/or co-ordinated collective bargaining systems allowing for
high responsiveness of wages to shocks. For example, in Austria, Denmark and Germany,
wage negotiations in the exporting sectors set the rule for the rest of the economy, a form
of co-ordination called pattern bargaining. In other European countries, however, the co-
ordination of collective bargaining was not developed enough for wages to adjust in face of
high inflation or external deficits, or high unemployment, thus prompting government
intervention to reach agreements at the central level (Hassel, 2006; Traxler and Brandl, 2010).
Overall, since 1990, nine European countries implemented central-level collective
agreements with wage provisions.48 Wage restraints were sometimes obtained in these
pacts in exchange for tax cuts (Finland and Ireland) and/or improved benefits to the
workers (Finland). In Belgium, the Netherlands and Sweden, agreements were reached
under the threat of government intervention to freeze wages in case of failure to agree.
Compared with previous agreements at the central level, these agreements took less and
less the form of formal contracts enforceable by law and relied more on guidelines and
targets. By and large, they achieved their aim of shifting workers’ wage expectations and
delivering wage moderation.49
Increased decentralisation to provide more flexibility
At the same time, in most OECD countries, the role played by collective negotiations at
the firm/establishment level has increased, leading to a significant decentralisation of
collective bargaining systems since 1990. While the process often started in the 1980s for
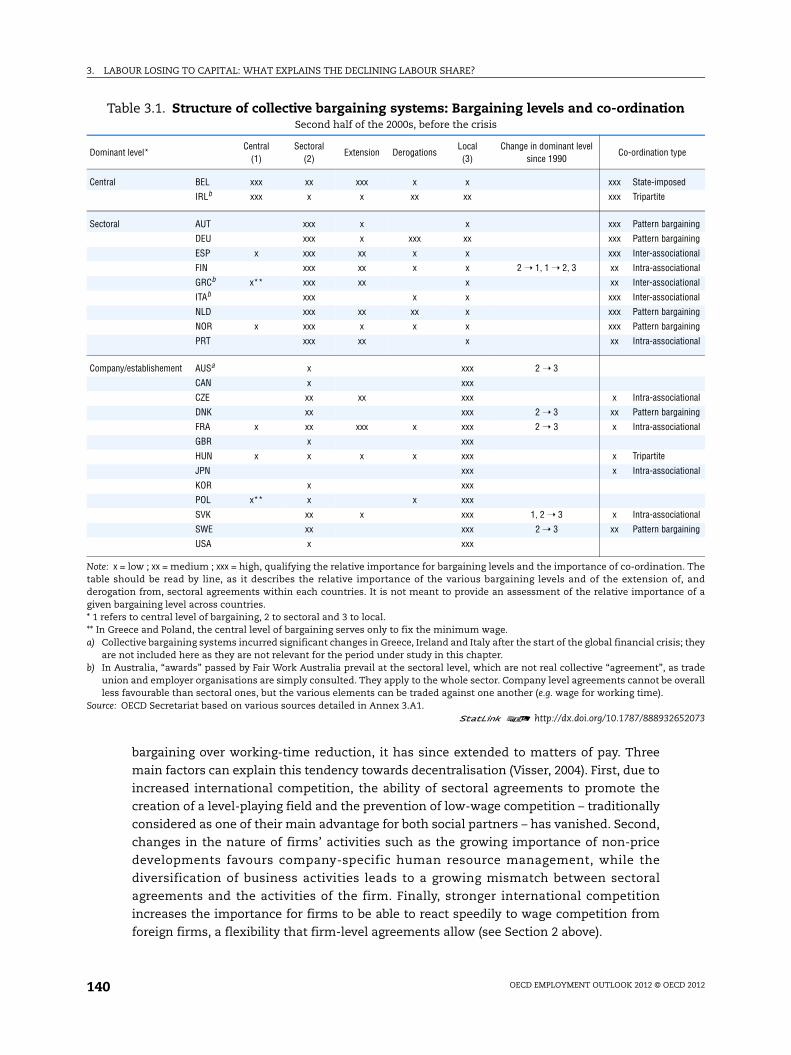
3. LABOUR LOSING TO CAPITAL: WHAT EXPLAINS THE DECLINING LABOUR SHARE?
OECD EMPLOYMENT OUTLOOK 2012 © OECD 2012140
bargaining over working-time reduction, it has since extended to matters of pay. Three
main factors can explain this tendency towards decentralisation (Visser, 2004). First, due to
increased international competition, the ability of sectoral agreements to promote the
creation of a level-playing field and the prevention of low-wage competition – traditionally
considered as one of their main advantage for both social partners – has vanished. Second,
changes in the nature of firms’ activities such as the growing importance of non-price
developments favours company-specific human resource management, while the
diversification of business activities leads to a growing mismatch between sectoral
agreements and the activities of the firm. Finally, stronger international competition
increases the importance for firms to be able to react speedily to wage competition from
foreign firms, a flexibility that firm-level agreements allow (see Section 2 above).
Table 3.1. Structure of collective bargaining systems: Bargaining levels and co-ordinationSecond half of the 2000s, before the crisis
Dominant level*Central
(1)Sectoral
(2)Extension Derogations
Local (3)
Change in dominant level since 1990
Co-ordination type
Central BEL xxx xx xxx x x xxx State-imposed
IRLb xxx x x xx xx xxx Tripartite
Sectoral AUT xxx x x xxx Pattern bargaining
DEU xxx x xxx xx xxx Pattern bargaining
ESP x xxx xx x x xxx Inter-associational
FIN xxx xx x x 2 ➝ 1, 1 ➝ 2, 3 xx Intra-associational
GRCb x** xxx xx x xx Inter-associational
ITAb xxx x x xxx Inter-associational
NLD xxx xx xx x xxx Pattern bargaining
NOR x xxx x x x xxx Pattern bargaining
PRT xxx xx x xx Intra-associational
Company/establishement AUSa x xxx 2 ➝ 3
CAN x xxx
CZE xx xx xxx x Intra-associational
DNK xx xxx 2 ➝ 3 xx Pattern bargaining
FRA x xx xxx x xxx 2 ➝ 3 x Intra-associational
GBR x xxx
HUN x x x x xxx x Tripartite
JPN xxx x Intra-associational
KOR x xxx
POL x** x x xxx
SVK xx x xxx 1, 2 ➝ 3 x Intra-associational
SWE xx xxx 2 ➝ 3 xx Pattern bargaining
USA x xxx
Note: x = low ; xx = medium ; xxx = high, qualifying the relative importance for bargaining levels and the importance of co-ordination. Thetable should be read by line, as it describes the relative importance of the various bargaining levels and of the extension of, andderogation from, sectoral agreements within each countries. It is not meant to provide an assessment of the relative importance of agiven bargaining level across countries.* 1 refers to central level of bargaining, 2 to sectoral and 3 to local.** In Greece and Poland, the central level of bargaining serves only to fix the minimum wage.a) Collective bargaining systems incurred significant changes in Greece, Ireland and Italy after the start of the global financial crisis; they
are not included here as they are not relevant for the period under study in this chapter. b) In Australia, “awards” passed by Fair Work Australia prevail at the sectoral level, which are not real collective “agreement”, as trade
union and employer organisations are simply consulted. They apply to the whole sector. Company level agreements cannot be overallless favourable than sectoral ones, but the various elements can be traded against one another (e.g. wage for working time).
Source: OECD Secretariat based on various sources detailed in Annex 3.A1.1 2 http://dx.doi.org/10.1787/888932652073
3. LABOUR LOSING TO CAPITAL: WHAT EXPLAINS THE DECLINING LABOUR SHARE?
OECD EMPLOYMENT OUTLOOK 2012 © OECD 2012 141
Decentralisation has taken place at different degrees across countries and in different
ways. The various institutions have mutated to increase flexibility and autonomy in the
determination of pay and conditions at the firm level, but this has not necessarily meant
institutional convergence (Howell and Colins Givan, 2011). The depth of decentralisation
depends on the coverage of firm-level agreements as well as on the extent to which they
matter in the determination of wages compared with higher level collective agreements. In
Denmark, France and Sweden, firm-level agreements can now be considered to be the
dominant level in wage determination (Table 3.1).50 The decentralisation process has been
organised by social partners in Denmark and Sweden, while it was initiated by the state in
France.51 In the other European countries, while it did not imply a change in the dominant
level of bargaining, firm-level bargaining also gained in importance in wage-setting.
Decentralisation has taken place in three main ways: i) sectoral agreements
increasingly include derogation clauses, allowing firm-level agreements to depart from
sectoral agreements in specified cases; ii) instead of setting standard wage increases,
sectoral agreements increasingly provide a framework for firm-level agreements; and
iii) the share of variable pay, by definition negotiated at the firm level, has been growing.
In general, firms covered by a multi-employer agreement should observe what is
called the favourability principle, meaning that firm level agreements should be more
favourable to employees than higher-level agreements. While this principle still held
in 2009 in the Czech Republic, Finland, Greece, Portugal and the Slovak Republic, in the
other European countries, the inclusion of derogation clauses in sectoral/central level
collective agreements had become increasingly frequent, especially in Germany, Ireland
and Spain. Derogation clauses are of two types: “hardship” or “inability-to-pay” clauses
allow temporary deviations from these agreements for firms facing economic difficulties;
more general “opening” or “opt-out” clauses can be invoked either by firms that cannot
afford to meet the general standard, especially small and medium-sized enterprises, or by
firms facing threats to future competitiveness and possible relocations of investment and
production sites (Visser, 2004). Actual use of these clauses has increased significantly in
Germany.52 Although to a lesser extent, the “inability-to-pay” clause included in the central
agreements since 2003 has also been regularly used in Ireland (van Klaveren, 2011). In
other countries, the use of derogation clauses remains more limited (Table 3.1).
Besides derogation clauses, the substance of sectoral agreements has also been
changed in many cases, leaving much more room for firm-level bargaining on wages. In
some cases, the determination of average wage increases still takes place at the sectoral
level, but the decision on how to distribute wage increases among employees is left to firm-
level bargaining. This is a very common practice in Denmark and Sweden, and exists in
Austria, Belgium, Germany and Italy. In the Netherlands, a large share of employees is
covered by sectoral agreements which leave the possibility to make choices at the firm
level between pay and working time. In the Czech Republic, Denmark, and the Slovak
Republic, industry-level agreements increasingly tend to set minima while actual wage
increases for the rest of the pay scale are negotiated at the firm level. This is also
occasionally the case in Spain.
What is the evidence concerning the possible effects of decentralisation on the labour
share? A few empirical studies have looked at the effects of different bargaining regimes on
wages, wage dispersion and rent-sharing, using matched employer-employee datasets.
Exploiting transitions from one regime to another, wages negotiated at the firm level are
3. LABOUR LOSING TO CAPITAL: WHAT EXPLAINS THE DECLINING LABOUR SHARE?
OECD EMPLOYMENT OUTLOOK 2012 © OECD 2012142
found to be higher in Denmark than those negotiated under sectoral agreements, but also
significantly more dispersed, and returns to education significantly higher (Dahl et al.,
2011). Decentralisation of wage bargaining would thus be one factor explaining the
deterioration of low-skilled workers position noted above. Gürtzgen (2010) and Rusinek and
Rycx (2008) looking respectively at Germany and Belgium, find that wages are much more
responsive to firm-level profits under firm-level bargaining than under sectoral bargaining,
and that rent-sharing is thus higher.
Overall, centralisation and co-ordination of wage bargaining appear to have
contributed to contain wage increases when needed on the one hand, while
decentralisation seems to have increased the link between wages and local performance
on the other. However, the links between wage-bargaining regimes and their evolution and
changes in labour share across countries are not straightforward. Countries where the
labour share has dropped significantly, for example, had different bargaining regimes
(centralised in Finland and Ireland; already fully decentralised in Canada, increasingly
decentralised in Sweden; centralised and intermediate but co-ordinated in Italy).
A shift of bargaining power away from workers
One reason explaining why trends in the labour share cannot be strictly related to the
type of collective bargaining structure nor to its evolution may be that other factors, in
particular the increased domestic and international competitive pressures (see Section 2)
and domestic and international financial liberalisation and the associated change in
corporate management – often referred to as financialisation, in addition to having driven
the changes in collective bargaining institutions described above, also reduced the
bargaining power of workers across the board (i.e. whatever the collective bargaining
regime). From a theoretical point of view, all other things equal, this reduction in workers’
bargaining power implies a reduction in the labour share (see e.g. Bentolila and Saint-Paul,
2003).
While they tend to reduce the size of the rent that employers and workers share, by
increasing the substitutability of employees, globalisation and increased international
competition also affect bargaining in the workplace and thus the rent-sharing between
employers and workers (see e.g. Rodrik, 1997): imports increase the substitution between
domestic and foreign workers and hence reduce workers’ bargaining power, while the
increasingly credible threat to relocate activities abroad improves the position of
employers in bargaining. In other words, the increasing mobility of goods and capital shifts
the threat points in the bargaining game over the dwindling economic rents. A number of
empirical studies using firm-level data confirm that imports and offshoring have tended to
deteriorate the bargaining power of workers over the past two decades (Box 3.5).
The deregulation of product or service markets, often combined in practice with
privatisation, is also affecting the bargaining power of workers. Privatisation shifts the
objective function of the managers from one that includes the employment level to one
that concentrates exclusively on profits. When combined with increased product market
competition, privatisation reduces the size of the rent as well as the bargaining power of
workers in the sector. It usually leads to a two-tier system with a relatively stable
bargaining structure at the level of the incumbent firm and a rather decentralised and
fragmented bargaining structure with low bargaining coverage at the level of the new
competitors (Schulten et al., 2008; see Box 3.5 for some empirical evidence).
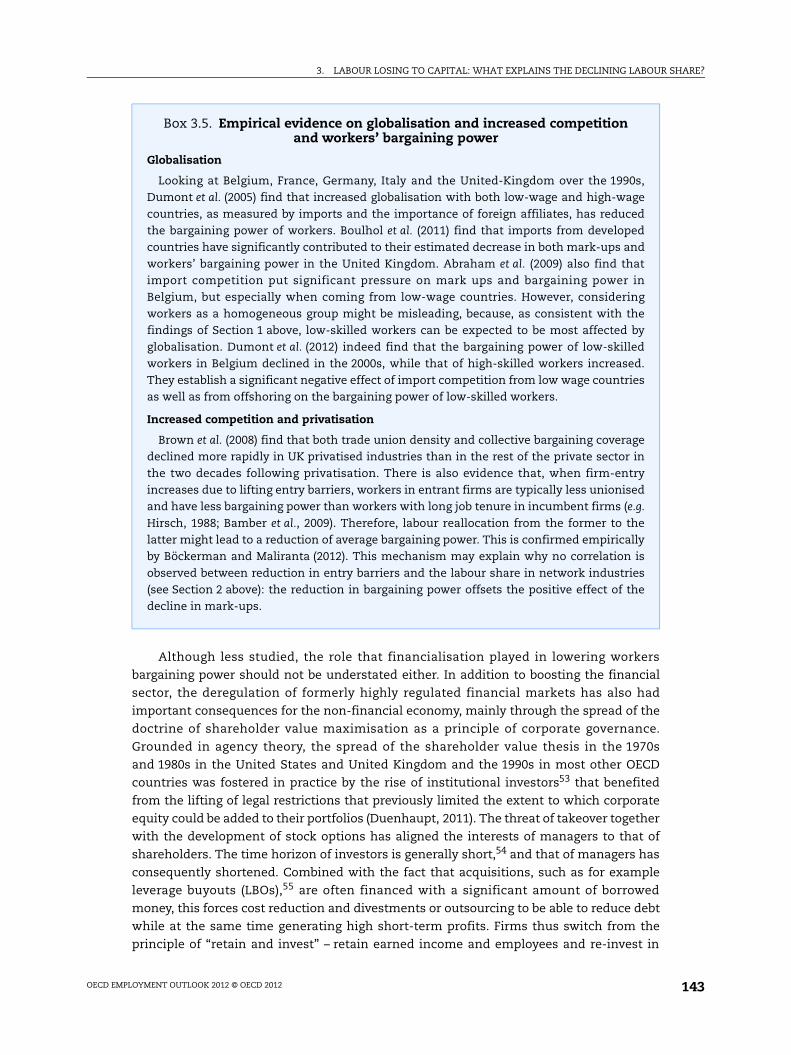
3. LABOUR LOSING TO CAPITAL: WHAT EXPLAINS THE DECLINING LABOUR SHARE?
OECD EMPLOYMENT OUTLOOK 2012 © OECD 2012 143
Although less studied, the role that financialisation played in lowering workers
bargaining power should not be understated either. In addition to boosting the financial
sector, the deregulation of formerly highly regulated financial markets has also had
important consequences for the non-financial economy, mainly through the spread of the
doctrine of shareholder value maximisation as a principle of corporate governance.
Grounded in agency theory, the spread of the shareholder value thesis in the 1970s
and 1980s in the United States and United Kingdom and the 1990s in most other OECD
countries was fostered in practice by the rise of institutional investors53 that benefited
from the lifting of legal restrictions that previously limited the extent to which corporate
equity could be added to their portfolios (Duenhaupt, 2011). The threat of takeover together
with the development of stock options has aligned the interests of managers to that of
shareholders. The time horizon of investors is generally short,54 and that of managers has
consequently shortened. Combined with the fact that acquisitions, such as for example
leverage buyouts (LBOs),55 are often financed with a significant amount of borrowed
money, this forces cost reduction and divestments or outsourcing to be able to reduce debt
while at the same time generating high short-term profits. Firms thus switch from the
principle of “retain and invest” – retain earned income and employees and re-invest in
Box 3.5. Empirical evidence on globalisation and increased competition and workers’ bargaining power
Globalisation
Looking at Belgium, France, Germany, Italy and the United-Kingdom over the 1990s,Dumont et al. (2005) find that increased globalisation with both low-wage and high-wagecountries, as measured by imports and the importance of foreign affiliates, has reducedthe bargaining power of workers. Boulhol et al. (2011) find that imports from developedcountries have significantly contributed to their estimated decrease in both mark-ups andworkers’ bargaining power in the United Kingdom. Abraham et al. (2009) also find thatimport competition put significant pressure on mark ups and bargaining power inBelgium, but especially when coming from low-wage countries. However, consideringworkers as a homogeneous group might be misleading, because, as consistent with thefindings of Section 1 above, low-skilled workers can be expected to be most affected byglobalisation. Dumont et al. (2012) indeed find that the bargaining power of low-skilledworkers in Belgium declined in the 2000s, while that of high-skilled workers increased.They establish a significant negative effect of import competition from low wage countriesas well as from offshoring on the bargaining power of low-skilled workers.
Increased competition and privatisation
Brown et al. (2008) find that both trade union density and collective bargaining coveragedeclined more rapidly in UK privatised industries than in the rest of the private sector inthe two decades following privatisation. There is also evidence that, when firm-entryincreases due to lifting entry barriers, workers in entrant firms are typically less unionisedand have less bargaining power than workers with long job tenure in incumbent firms (e.g.
Hirsch, 1988; Bamber et al., 2009). Therefore, labour reallocation from the former to thelatter might lead to a reduction of average bargaining power. This is confirmed empiricallyby Böckerman and Maliranta (2012). This mechanism may explain why no correlation isobserved between reduction in entry barriers and the labour share in network industries(see Section 2 above): the reduction in bargaining power offsets the positive effect of thedecline in mark-ups.
3. LABOUR LOSING TO CAPITAL: WHAT EXPLAINS THE DECLINING LABOUR SHARE?
OECD EMPLOYMENT OUTLOOK 2012 © OECD 2012144
physical and human capital – to a “downsize and distribute” strategy which is significantly
weakening workers’ bargaining power (Lazonick and O’Sullivan, 2000).56
Social and labour market reforms, sometimes passed without the consent of or
discussion with social partners, might also have contributed to a weakening of workers’
bargaining power. Increased competitiveness constraints have led a number of countries to
facilitate the use of temporary-agency work or fixed-term contracts, and allow the
development of atypical contracts, such as for example mini-jobs in Germany. In those
cases where it contributes to increased labour market dualism, the development of such
non-standard contract is likely to reduce workers’ bargaining power. At the same time,
reforms in the welfare state to reduce access and levels of welfare benefits for those out of
work (unemployment benefits, disability, social assistance, etc.), are likely to have lowered
the reservation wage of workers.
All these pressures on workers bargaining power are likely to have contributed to the
decline in trade union membership and collective bargaining coverage, and appear to have
induced trade unions to change their objective function. Instead of negotiating wage
increases reflecting productivity trends or the preservation of real pay or pay equality,
trade unions may increasingly be internalising the competitive constraints and the likely
effects of their wage claims on employment.57 This is likely to be true in sectoral/national
negotiations, and perhaps even more so at the local level, where concession bargaining has
become frequent.58
Increased competitive pressures and the associated decline in workers bargaining
power may also help explain the trend towards decentralisation. As a result of the
changing economic and political context, many of the benefits which employers
traditionally perceived multi-employer bargaining to have offered may no longer appear as
valuable. Employers are likely to feel less need of the protection from trade union pressure
to shape the wage-effort bargain within the workplace. Besides, lower levels of
unionisation and of bargaining coverage reduce the capacity of centralised agreements to
deliver benefits in terms of the internalisation of external wage costs, thus probably
reducing their interest for social partners (Visser, 2005). In turn, increased decentralisation
may weaken the bargaining power of trade unions if it makes it more difficult for trade
unions to hold centralised union structures together.59 The fact that low-skilled workers
have lost bargaining power while high-skilled workers may have improved theirs also
increases the difficulty for trade unions to hold a united group of workers together and
keep promoting wage compression (Acemoglu et al., 2001).
As the importance of collective bargaining institutions and their protective power for
workers has eroded, legal protections for workers have become increasingly important. In
many countries, such as Ireland, the UK, Denmark and Sweden, the dominant source of
regulation has shifted away from voluntary self-regulation at the collective level to formal
individual rights enforced through the courts (Visser, 2005). The combination of increased
competitive pressures – especially on the low-skilled – and the decreasing role of collective
bargaining institutions can also explain the introduction or increase of a legislated
minimum wage in some OECD countries, such as Australia, Ireland, New Zealand and
the United Kingdom. However, although statutory rights may be helpful for trade unions as
they establish a floor on which collective bargaining can build, there are probably limits to
what they can achieve in terms of protecting workers while preserving efficiency
(see below).
3. LABOUR LOSING TO CAPITAL: WHAT EXPLAINS THE DECLINING LABOUR SHARE?
OECD EMPLOYMENT OUTLOOK 2012 © OECD 2012 145
4. Minimum wages, employment protection and the labour shareEvidence presented in the previous sections suggests that in the two decades
preceding the crisis, rapid TFP growth and capital-deepening, reflecting capital-
augmenting technical change, were among the most important factors explaining the
within-industry decline of the labour share. Beyond collective bargaining institutions,
discussed in the previous section, other labour market policies have affected the relative
price of capital and labour, and are therefore also likely to have played a role in this process.
For example, in the past ten years, the ratio of statutory minimum to median wages has
increased by about 2 percentage points, in countries where statutory minima exist. In
addition, in a number of countries where collective bargaining coverage declined
significantly, statutory minimum wages were implemented or significantly raised as a
means to fight in-work poverty (e.g. Australia, Ireland, New Zealand and the
United Kingdom; see the previous section). In turn, however, this might have induced firms
to overinvest in labour-saving innovation (see e.g. Boone, 2000), thereby lowering the
labour share.
Exploiting the likely cross-industry differences in the impact of the minimum wage on
productivity and wages, it is possible to identify the impact of statutory minimum wages
on the labour share, using the same methodological framework adopted in Section 2
(see Box 3.4). Estimations performed for this chapter suggest that, in the short-run, an
increase in the statutory minimum wage relative to median wages is reflected in a
substantive increase of prices, wages and nominal value added, so that no significant
short-run effect on the labour share is estimated. However, in the long-run, the evidence
suggests that firms react by increasing efficiency levels and productivity beyond the wage
increase, leading to a decline in the labour share (Figure 3.15; and OECD, 2012, for detailed
methodology and estimates). These patterns are likely to result from the fact that higher
minimum wages tend to induce greater investment in capital-augmenting innovations –
prompted by the need to offset the increase in labour costs, as suggested by Boone (2000) –
and firm-sponsored training – whose benefits, in imperfect labour markets, cannot be
easily reaped by trained workers. In fact, by compressing the lower tail of the wage
distribution without necessarily affecting individual productivity prior to training,
minimum wages could increase employers’ incentive to pay for training as they can reap
the difference between productivity and wage growth after training (see e.g. Acemoglu and
Pischke, 1999 and 2003; Arulampalam et al., 2004). Once the infrastructure for training is in
place – that is, the fixed cost has been paid, it is likely to be used also for workers paid
above the minimum, in particular if the quality of training can only be imperfectly
signalled and valued on the external labour market, so that most of the productivity gains
from training accrue to the firm.
The overall quantitative impact of minimum-wage increases on the wage share is,
however, small. Taking estimates at face value, raising the ratio of the statutory minimum
to median wages by 10 percentage points – roughly corresponding to one standard
deviation of the cross-country distribution, would result in a 3% contraction of the labour
share in the average industry in the subsequent ten years (Figure 3.15). But a 10-percentage
point increase of this ratio is very large in historical perspective. Between 2000 and 2010,
the ratio of minimum to median wages increased by barely 2 percentage points, on
average, in the countries where statutory minima exist. The estimates would therefore
imply that the cumulated impact of these increases has been responsible for an average
contraction of the labour share by 0.2 percentage points.60 Nevertheless, these results
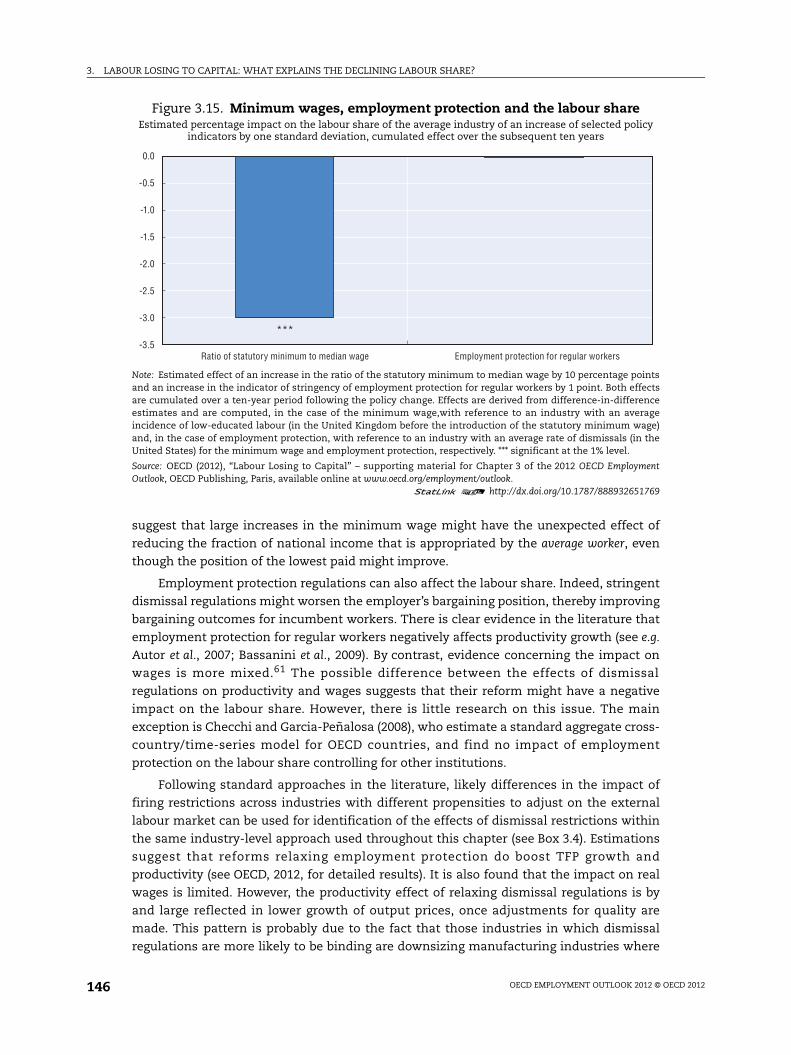
3. LABOUR LOSING TO CAPITAL: WHAT EXPLAINS THE DECLINING LABOUR SHARE?
OECD EMPLOYMENT OUTLOOK 2012 © OECD 2012146
suggest that large increases in the minimum wage might have the unexpected effect of
reducing the fraction of national income that is appropriated by the average worker, even
though the position of the lowest paid might improve.
Employment protection regulations can also affect the labour share. Indeed, stringent
dismissal regulations might worsen the employer’s bargaining position, thereby improving
bargaining outcomes for incumbent workers. There is clear evidence in the literature that
employment protection for regular workers negatively affects productivity growth (see e.g.
Autor et al., 2007; Bassanini et al., 2009). By contrast, evidence concerning the impact on
wages is more mixed.61 The possible difference between the effects of dismissal
regulations on productivity and wages suggests that their reform might have a negative
impact on the labour share. However, there is little research on this issue. The main
exception is Checchi and Garcia-Peñalosa (2008), who estimate a standard aggregate cross-
country/time-series model for OECD countries, and find no impact of employment
protection on the labour share controlling for other institutions.
Following standard approaches in the literature, likely differences in the impact of
firing restrictions across industries with different propensities to adjust on the external
labour market can be used for identification of the effects of dismissal restrictions within
the same industry-level approach used throughout this chapter (see Box 3.4). Estimations
suggest that reforms relaxing employment protection do boost TFP growth and
productivity (see OECD, 2012, for detailed results). It is also found that the impact on real
wages is limited. However, the productivity effect of relaxing dismissal regulations is by
and large reflected in lower growth of output prices, once adjustments for quality are
made. This pattern is probably due to the fact that those industries in which dismissal
regulations are more likely to be binding are downsizing manufacturing industries where
Figure 3.15. Minimum wages, employment protection and the labour shareEstimated percentage impact on the labour share of the average industry of an increase of selected policy
indicators by one standard deviation, cumulated effect over the subsequent ten years
Note: Estimated effect of an increase in the ratio of the statutory minimum to median wage by 10 percentage pointsand an increase in the indicator of stringency of employment protection for regular workers by 1 point. Both effectsare cumulated over a ten-year period following the policy change. Effects are derived from difference-in-differenceestimates and are computed, in the case of the minimum wage,with reference to an industry with an averageincidence of low-educated labour (in the United Kingdom before the introduction of the statutory minimum wage)and, in the case of employment protection, with reference to an industry with an average rate of dismissals (in theUnited States) for the minimum wage and employment protection, respectively. *** significant at the 1% level.
Source: OECD (2012), “Labour Losing to Capital” – supporting material for Chapter 3 of the 2012 OECD EmploymentOutlook, OECD Publishing, Paris, available online at www.oecd.org/employment/outlook.
1 2 http://dx.doi.org/10.1787/888932651769
0.0
-0.5
-1.0
-1.5
-2.0
-2.5
-3.0
-3.5***
Ratio of statutory minimum to median wage Employment protection for regular workers
3. LABOUR LOSING TO CAPITAL: WHAT EXPLAINS THE DECLINING LABOUR SHARE?
OECD EMPLOYMENT OUTLOOK 2012 © OECD 2012 147
product market competition is typically high and dissipates rents arising from efficiency
increases. By contrast, the impact on nominal value added growth is limited so that the
overall effect on the labour share is close to zero (Figure 3.15).
ConclusionsThis chapter has investigated the evolution of the labour share at the aggregate and
industry level, with a special attention to the past twenty years. In most OECD countries,
the labour share declined throughout this period, even though the recent economic crisis
marked a temporary pause in this trend. The contraction of the labour share is common to
most industries of the business sector and does not appear to be driven by structural shifts
in the industry composition of the economy. However, not all workers experienced the
same decline of labour compensation, measured as a fraction of national income. The
wage share of top income earners increased in many countries for which data are available.
At the same time, the position of the lowest educated worsened, in spite of rising
employment at the bottom end of the skill ladder. In addition, those at the bottom of the
earnings distribution are very unlikely to have much capital income, which reinforces the
impact of this trend on the increasing dispersion of the income distribution (see OECD,
2008a, 2011a).
What explains these divergent patterns and, more generally, the decline of the labour
share? The chapter shows that the pressure arising from delocalisations and increasing
competition from firms producing in countries with low labour cost can account for at least
10% of the overall decline of the labour share. Privatisation of state-owned enterprises,
albeit associated with significant productivity improvements, also led to a decline of the
labour share. These developments are also likely to be linked to the weakening of collective
bargaining institutions and of workers’ bargaining power.
Labour-saving – or even labour-replacing – technical change, induced by continuous
innovation in ICT-based technologies, was one of the most important forces behind the
decline of the labour share. Even though the decline in the labour share was often
associated with capital accumulation and stronger productivity growth, the average
worker benefited from the faster economic growth induced by this process, which made
average labour incomes grow in real terms, although at a less rapid pace than capital
income. However, the unequal distribution of both labour and capital income growth that
went hand-in-hand with the decline of the labour share suggests that these trends might
jeopardise social cohesion. Moreover, to the extent that less wealthy people tend to have a
higher consumption propensity, the shift of income away from low earners might also have
a negative impact on aggregate demand, which might undermine the strength of the
recovery.
Slowing down technical change and globalisation to achieve a more equal distribution
of factor shares would not be a wise choice, however. Governments can sometimes
intervene with effective industrial policies in order to modify the direction of technical
change through tax incentives and subsidies. For example, Criscuolo et al. (2012) evaluate
the UK Regional Selective Assistance programme, which was designed to co-finance
labour-intensive investment projects of firms in depressed areas. According to their
estimates, which take into account potential endogeneity, the programme has created
many unskilled jobs in a cost-effective way with small deadweight losses. However, the
scope of these interventions on a broader scale is limited insofar as they might distort
3. LABOUR LOSING TO CAPITAL: WHAT EXPLAINS THE DECLINING LABOUR SHARE?
OECD EMPLOYMENT OUTLOOK 2012 © OECD 2012148
reallocation of resources and depress growth in the long-run. As a much more promising
strategy on a large scale, governments can intervene by helping workers acquiring more
skills in order to enable them to win the “race against the machine”. For example, countries
could consider policies to increase their investment in education, particularly if targeted at
the rate of school drop-out and better matching skill acquisition to firm demands.
In addition, the tax and transfer system can play an important redistributive role so as
to contain the reflection into household disposable income of observed increases in market
income inequality without necessarily interfering with economic growth (OECD, 2011a
and 2011b). The growing share of income going to top earners suggests that this group now
has a greater capacity to pay taxes than before. In this context governments may wish to
reassess the redistributive role of taxation to ensure that wealthier individuals contribute
their fair share of the tax burden. As suggested by OECD (2011a), this re-examination
should not necessarily be confined to raising marginal tax rates on income, which might
not be the most effective measure to raise tax revenues but should include efforts for better
tax compliance; rationalising those tax exemptions that disproportionally benefit higher
income groups; and reassessing the role of taxes on all forms of property and wealth,
including their transfer.
Notes
1. As prominent news media put it, “the economic pie is growing, but […] the share of incomeproduced in the country that is flowing to workers’ bank accounts has been steadily shrinking”(New York Times, online edition, 2 February 2012): “pay for ordinary workers has not kept up witheconomic growth and rising company profits” (BBC4, Analysis, 20 February 2012), so that thegeneral perception is that “capitalists are grabbing a rising share of national income at the expenseof workers” (The Economist, 10 February 2005).
2. For example, The Economist contended just before the onset of the crisis: “Are workers gettingsmaller shares but larger slices? Yes” (Economic Focus, 4 April 2007).
3. The labour share is defined as the share of national income that is received by workers, be theyemployees or self-employed, in the form of labour compensation.
4. Three-year moving averages at the beginning and the end of the period are used to filter out short-term fluctuations.
5. See Bassanini and Manfredi (2012). This halt of the labour share’s decline during 2008-09 is likelyto be temporary, however. In fact, there is evidence that, at least in European countries, the labourshare in the non-financial business sector resumed its trend decline in 2010 (Eurostat, 2011). Adecline was also observed in the United States in 2010 (Bureau of Economic Analysis, 2011).
6. Factor shares in the public sector are difficult to measure due to the often imprecise estimates ofthe value added of the public administration in national accounts.
7. Norway experienced a large decline in the labour share of the whole economy (see Figure 3.1),which is however largely due to the offshore expansion of the oil industry. In fact when mining andfuel are excluded, no significant variation appears (Figure 3.3).
8. The most striking example of expansion of low-wage-share industry is that of the real estateindustry, which is however excluded from the analysis of the business-sector labour sharepresented in this chapter.
9. However, in these two countries, the magnitude of the between component is sensitive to thechoice of weights (see Box 3.3 and Figure 3.6).
10. Results similar to those presented in this section are obtained if the analysis is repeated for a timewindow spanning from the early 1970s to the late 2000s for countries for which long time seriesare available.
11. This resulted in large growth of the share of this industry in business-sector output, which grew atabout one quarter of a percentage point per year during that period.
3. LABOUR LOSING TO CAPITAL: WHAT EXPLAINS THE DECLINING LABOUR SHARE?
OECD EMPLOYMENT OUTLOOK 2012 © OECD 2012 149
12. Nevertheless, one needs to be cautious in interpreting these figures since value added isparticularly difficult to measure in this industry.
13. The relative stability of the labour share in low-tech manufacturing appears to be essentially dueto the large contraction of their value added and, therefore, should not be interpreted as evidenceof stability of labour demand. In fact, being in addition typically labour-intensive, these industriesappear to have contributed significantly to the between component of the shift-sharedecomposition (see also Section 2).
14. Discrepancies between Figure 3.6 and Figure 3.3 essentially come from the fact that hours workedrather than value-added shares are used in the decomposition of Figure 3.6. As a result, the largebetween components in Korea and Denmark disappear.
15. Nevertheless, quality-adjusted deflators for many non-market services (such as those of the publicadministration) are often of poor quality, and therefore the actual gap between the growth of pricedeflators might be smaller in many countries.
16. These statistics are based on an average ranking of occupations according to their average wagelevel in the countries reported in Figure 3.7. See Goos et al. (2009) for more details.
17. In this chapter low, medium and high education refer to less than upper secondary, uppersecondary and more than upper secondary education, respectively.
18. These figures are likely to represent an underestimate of the true reductions, becausecompensation shares by educational level in EUKLEMS – the source of these data – are notcomputed on the basis of national accounts but rely on surveys, such as labour force surveys, inwhich wage data are typically top-coded. To the extent that the incidence of top-coding is likely tobe greater for those with tertiary education, the shares of those with less than tertiary educationend up being overestimated.
19. The greater the degree of substitutability of different types of workers, the greater is the effect oftheir relative supply in determining their shares in labour compensation. For example, if theelasticity of substitution across workers with different educational attainment is close to 1, theevolution of education shares is independent from the supply of different types of labour. However,if workers with different skills were perfectly substitutable and relative productivity were constant(with high-educated workers being more productive than low-educated workers by a constantfactor), the evolution of the shares by educational attainment will simply match the trends in therelative size of each subpopulation. Adjusting labour shares by level of education for the relativesupply of workers of different types represents therefore an interesting benchmark: if the share ofone group falls by more than its reduction in the population, this suggests that the position of thatgroup worsened, no matter what assumption is made on the substitutability across groups.
20. Due to data limitations, the analysis is based on a coarser partition of the business-sector.
21. The evolution of the demographic structure of the population can also affect the labour share tothe extent that workers tend to be paid below their productivity when they are young. Due to lackof suitable data, this factor is left aside in the analysis. However, to the extent that the ageing ofthe workforce is widespread in OECD economies, this channel should rather serve to slow thedecline of the labour share.
22. In terms of the aggregate production function discussed in Box 3.4, capital and labour are grosscomplements if their elasticity of substitution is smaller than 1 and gross substitutes if theirelasticity of substitution is greater than 1.
23. For example, if returns to scale are constant and factors are remunerated at their marginalproductivity, the labour share can be written as the product of the marginal productivity of labourand the amount of labour divided by output. This relationship holds also if labour is expressed inefficient units (that is employment multiplied by the parameter expressing labour-augmentingtechnical change). But if labour is expressed in efficiency units, the ratio of labour to output andthe marginal product of labour can be written as a sole function of capital intensity. In other words,labour-augmenting technical change cannot shift the relationship between capital intensity andthe labour share. It can be shown that departures from perfect competition in the labour marketdo not alter this conclusion (see Bentolila and Saint-Paul, 2003).
24. Their specification is close to that presented in Box 3.4, except that they do not control for any timeor country-by-time effects.
25. This is consistent with capital and labour being gross substitutes as found in a number of studiesbased on aggregate data (see for example Masanjala and Papageorgiou, 2004). The seminal paperof Berndt (1976) also finds elasticities of substitution greater than 1, although insignificantly so.
3. LABOUR LOSING TO CAPITAL: WHAT EXPLAINS THE DECLINING LABOUR SHARE?
OECD EMPLOYMENT OUTLOOK 2012 © OECD 2012150
More generally, however, estimated elasticities of substitution reported in the literature can varyfrom significantly smaller to significantly larger than 1 (see e.g. Antràs, 2004).
26. On average, the growth rates of TFP and capital intensity were 1.3% and 0.8% per year, respectively,between 1990 and 2007 in the countries for which data are available.
27. Similar conclusions are also drawn by Guscina (2006) and Hutchinson and Persyn (2012) on thebasis of cross-country/time-series estimates.
28. By contrast, the impact on structural unemployment is more ambiguous (see e.g. Trefler, 2004;Felbermayr et al., 2011).
29. Inflows of immigrants and adverse shocks on export prices are also found to have a similar effecton the labour share in the literature (e.g. IMF, 2007; and Jaumotte and Tytell, 2007). Due to theidentification strategy adopted here, however, the contribution of these two channels cannot beestimated.
30. IMF (2007) and Jaumotte and Tytell (2007) use lagged levels of endogenous covariates asinstruments. However, to the extent that the effect of covariates might occur with some lags, thereare reasons to suspect that the orthogonality condition required for instrument validity might nothold with lagged levels.
31. More precisely, import penetration is defined as the ratio of imports to apparent demand andexport orientation as the ratio of exports to domestic output.
32. This result is consistent with findings of OECD (2011a), which using aggregate data finds thatneither rising trade integration nor financial openness had a significant impact on either wageinequality or employment trends in OECD countries. Yet, problems of potential endogeneity arenot addressed in that study.
33. There is also some evidence that the bargaining power of high-skilled workers might increase withimport penetration while that of the low-skilled declines (see Section 3).
34. What is more, in contrast with the previous literature, these estimates take into account thepossibility of reverse causality and are robust to a number of robustness checks (see Bassanini andManfredi, 2012, for details). Again, however, as companies are more likely to offshore unskilledsegments of the production chain (see Jaumotte and Tytell, 2007; and Antonietti and Antonioli,2011, for some evidence), these estimates should be considered a lower bound to the true effect.
35. The effect of regulation of inward FDI is insignificant in the full sample of countries, but becomessignificant at the 1% level upon the exclusion of France.
36. By contrast, as the literature suggests that benefits from FDI in advanced economies tend to becaptured by skilled workers (see Driffield and Girma, 2003; OECD, 2008b), deregulation of inwardFDI might contribute to explain the rising share of high-educated workers in total compensation.However, given the lack of available data, this issue cannot be further investigated here.
37. Although the effect of trade and, more generally, globalisation could be indirect (occurring throughthe effect of globalisation on productivity), the estimated effects of trade variables, offshoring orinward FDI are not sensitive to the inclusion of TFP, capital intensity or labour productivity in theregressions, which suggests that indirect effects are minor.
38. The fact that the company’s value function is positively related to both profits and employmentmakes the labour demand curve shift outward: for any given level of the wage, employment islarger. At the firm level this implies a larger wage share and, in equilibrium, lower wages andgreater employment than the combination that would maximise profits.
39. The estimated impact of privatisation is not affected by the inclusion of TFP, capital intensity orlabour productivity in the regressions, which suggests that indirect effects (occurring through theeffect of privatisation on technical change and capital accumulation) are small.
40. This estimated effect of public ownership appears almost twice as large in the 1980s. But in orderto derive the implications for trends in the labour share in that period, one needs to take intoaccount that the pace of privatisations was three times less rapid. The difference in estimatedeffects across the two periods is probably due to the evolution of governance rules for SOEs. Inparticular, while it is likely that in the 1980s different objectives from profit-maximisation werepursued by SOEs managers, this is probably much less the case for firms that were still undergovernment control in the 2000s, when SOEs were often asked to behave more like private-for-profit firms.
3. LABOUR LOSING TO CAPITAL: WHAT EXPLAINS THE DECLINING LABOUR SHARE?
OECD EMPLOYMENT OUTLOOK 2012 © OECD 2012 151
41. For example, in the 1990s, the privatisation of Iri – the largest Italian holding – and its subsidiariesinvolved a reduction of public ownership in several industries including, financial intermediation,construction, real estate and food manufacturing.
42. In the standard theoretical literature, bargaining between employer and employees is typicallyrepresented as the maximisation of a surplus function, which is defined by the firm value added,the outside options or threat points of the two parties, and a parameter of division of the rent. Thelatter defines the share of the rent that will accrue to the worker. If employees negotiateindividually with the employer, competition among workers will drive the division parameter tozero so that the employer becomes the residual claimant and workers are simply paid theirreservation wage (Farber, 1986).
43. Cross-country data on trade union density in both the private and public sector are not available.Blanchflower (2006) finds that in Canada, the United Kingdom and the United States, unionmembership rates were three to four times higher for public sector workers than for private sectorworkers in the mid-2000s. In France, the same ratio amounted to three in the first half of the 2000s(DARES, 2008).
44. The reforms greatly restricted and controlled trade union activity and thus union’s ability toconduct effective collective negotiations (Davies and Freedland, 2005).
45. Collective agreements at the central level have also played an important role in wage setting inIreland, but collective bargaining coverage relates to the firm level. The decline of trade uniondensity and bargaining coverage is partly associated with union avoidance practices ofmultinationals at new sites, in a country where attracting FDI has been a priority over the periodstudied (Lamare et al., 2009).
46. Unlike in other countries, extensions have to be approved by a committee where trade unions andemployers are equally represented (Bispinck et al., 2010).
47. This was reinforced by the adoption by the European Central Bank of the German model ofrestrictive monetary policy, targeting low inflation. See Hassel (2006) and Keune (2008).
48. This is the case of Belgium, Finland, and Ireland over the past two decades, Italy, Portugal,the Netherlands, Norway and Sweden in the 1990s mainly, and Spain in the 2000s only.
49. This was accomplished through various modalities across countries: the elimination of automaticindexation mechanisms (Finland and Italy); wage freezes (Finland and Sweden); the introductionof ceilings on wage increases explicitly linked to cost competitiveness vis-à-vis the main tradingpartners (Belgium and Norway), sometimes under the form of a legislated formula based on paydevelopments in the main trading partner (Belgium); wage increases based on expected inflation(Italy and Spain); and/or recommendations to keep wage increases negotiated at lower levels inline with productivity developments (Ireland, Italy, the Netherlands and Spain).
50. Overall, in the private sector, wages were fully determined at the firm level for 16% of Swedishemployees in 2010;for 55% of the employees, the distribution of the nationally-agreed wageincrease among employees was bargained at the firm level; and 18% of the employees had theirwage fixed at both levels, leaving only 11% of employees with their wage fully determined at thesectoral level (Annual Report 2010 of the National Mediation Office). In Denmark, 22% of privatesector employees had their wages fully determined at the firm level and 62% had a minimumdefined at the sectoral level and individual wages negotiated at the firm level in 2004 (Dahl et al.,2011). In France, 64% of the employees in firms with more than ten employees were covered bywage negotiation at the firm-level in 2008 (DARES quoted in www.worker-participation.eu/National-Industrial-Relations/Countries/France/Collective-Bargaining).
51. In Denmark and Sweden, where trade union membership is high, sectoral agreements establishedthe rules governing bargaining at the firm level, so as to create a transparent wage bargainingsystem based on objectives criteria (Ahlberg and Bruun, 2005; Andersen and Navrjberg, 2008). Bycontrast, in France, where trade union membership is low, the process of decentralisation ofcollective bargaining was launched by the government in the early 1980s by obliging employersand trade unions to negotiate on working time and wages at the firm level; a 2004 law furtherextended the possibilities for firm level agreements to deviate from sectoral agreements or labourlaws. The co-ordination between the two levels of bargaining is very limited, but sectoralagreements remain influential, as they still often provide the job classification used for wagenegotiation at the firm level; this is, however, less and less the case (Barrat et al., 2007). Besides, thestatutory minimum wage, determined by the government, defines a wage floor for the entirelabour market, thus limiting the effective margins for negotiations at both levels.
3. LABOUR LOSING TO CAPITAL: WHAT EXPLAINS THE DECLINING LABOUR SHARE?
OECD EMPLOYMENT OUTLOOK 2012 © OECD 2012152
52. Increased use of derogation clauses resulted in cuts in basic pay, reductions in agreed wageincreases, lower wage rates for job starters or reduction/suspension of bonuses (Keune, 2010;Haipeter and Lehndorff, 2009).
53. Leading institutional investors include mutual funds, pension funds, hedge funds, life insurance,and investment companies such as private equity funds.
54. Fund managers typically aim to sell-on acquisitions within a five year time frame (Clark, 2009).
55. LBOs have undergone an explosive growth since the early 2000s (ILO, 2009).
56. Amess and Wright (2007) find that LBOs have negatively affected wages in the United Kingdomover the 1999-2004 period. In the United Kingdom also, collective agreements have often beenrevised downwards after acquisitions, while straight de-recognition of trade unions and collectiveagreements occurred more rarely (Clark, 2009). Chambost et al. (2008) note that, in France, payindividualisation and increased work pressure tend to fragment staff in LBO firms and that the roleof trade unions thus becomes more limited.
57. Dumont et al. (2005) find evidence that the objective functions of trade unions increasingly includeemployment in the five European countries they study.
58. See Freyssinet and Seifert (2001), Raess and Burgoon (2006), Haipeter and Lehndorff (2009).
59. In more decentralised bargaining systems the bargaining coverage depends much more on theunions’ organisational power (Bispinck et al., 2010).
60. These estimates take into account that minimum-wage increases were distributed over time. Anestimation of the effect in the 1990s is more difficult since arbitrary assumptions would have to bemade to allow for the change in wage floors induced by the introduction of the minimum wage inIreland and the United Kingdom. Excluding these two countries, changes in the ratio of minimumto median wages were negative, on average, in that decade.
61. Leonardi and Pica (2010) analyse the effect of monetary compensation for unfair dismissal on malewages by exploiting an Italian reform that introduced this type of compensation forestablishments with less than 15 employees. They find that the reform had no impact on entrywages, although returns to tenure decreased, as suggested by Lazear (1990). OECD (2010) showsthat the wage premium to voluntary job changes is smaller where dismissal legislation is morestringent. However, that report also finds evidence that involuntary job loss is less frequent in thatcase, so that the overall impact of these regulations on wage premia to job changes is ambiguous.By contrast, van der Wiel (2010) identifies intra-firm effects of employment protection byexploiting a 1999 Dutch reform, which eliminated age-based terms-of-notice rules but implied thecoexistence within the same firm of workers under different rules for a transitory period. She findsthat those covered by more stringent rules received higher wages.
References
Abraham, F., J. Konings and S. Vanormelingen (2009), “The Effect of Globalization on Union Bargainingand Price-Cost Margins of Firms”, Review of World Economics, Vol. 145, No. 1, pp. 13-63.
Acemoglu, D. (2002), “Directed Technical Change”, Review of Economic Studies, Vol. 69, pp. 781-810.
Acemoglu, D. (2003), “Labor- and Capital-Augmenting Technical Change”, Journal of the EuropeanEconomic Association, Vol. 1, No. 1, pp. 1-37.
Acemoglu, D. (2011), “When Does Labor Scarcity Encourage Innovation?”, Journal of Political Economy,Vol. 118, No. 6, pp. 1037-1078.
Acemoglu, D. and J.S. Pischke (1999), “Beyond Becker: Training in Imperfect Labour Markets”, EconomicJournal, Vol. 109, No. 453, pp. F112-F142.
Acemoglu, D. and J.S. Pischke (2003), “Minimum Wages and On-The-Job Training”, Research in LaborEconomics, Vol. 22, pp. 159-202.
Acemoglu, D., P. Aghion and G.L. Violante (2001), “Deunionization, Technical Change and Inequality”,Carnegie-Rochester Conference Series on Public Policy, Vol. 55, No. 1, pp. 229-264, Elsevier, December.
Ahlberg, K. and N. Bruun (2005), “Sweden: Transition through collective bargaining”, in T. Blanke andE. Rose (eds.), Collective Bargaining Wages in Comparative Perspective: Germany, France, the Netherlands,Sweden and the United Kingdom, Kluwer Law International, The Hague.
3. LABOUR LOSING TO CAPITAL: WHAT EXPLAINS THE DECLINING LABOUR SHARE?
OECD EMPLOYMENT OUTLOOK 2012 © OECD 2012 153
Amess, K. and M. Wright (2007), “The Wage and Employment Effects of Leveraged Buyouts in the UK”,International Journal of the Economics of Business, Vol. 14, No. 2, pp. 179-195.
Andersen, S.K. and S.E. Navrjberg (2008), “Collective Bargaining on Wages in Denmark”, in M. Keuneand B. Galgóczi (eds.), Wages and Wage Bargaining in Europe – Developments Since the Mid-1990s, ETUI-REHS, Brussels.
Antonietti, R. and D. Antonioli (2011), “The Impact of Production Offshoring on the Skill Compositionof Manufacturing Firms: Evidence from Italy”, International Review of Applied Economics, Vol. 25,No. 1, pp. 87-105.
Antràs, P. (2004), “Is the US Aggregate Production Function Cobb-Douglas? New Estimates of theElasticity of Substitution”, Contributions to Macroeconomics, Vol. 4, No. 1.
Arpaia, A., E. Prez and K. Pichelmann (2009), “Understanding Labour Income Share Dynamics inEurope”, European Economy Economic Papers No. 379, European Commission, Brussels, May.
Arthur, W.B. (2011), “The Second Economy”, McKinsey Quarterly, October.
Arulampalam, W., A.L. Booth and M.L. Bryan (2004), “Training and the New Minimum Wage”, EconomicJournal, Vol. 114, No. 494, pp. C87-C94.
Atanassov, J. and E. Kim (2009), “Labor and Corporate Governance: International Evidence fromRestructuring Decisions”, Journal of Finance, Vol. 64, No. 1, pp. 341-374.
Atkinson, A.B, T. Piketty and E. Saez (2011), “Top Incomes in the Long Run of History”, Journal ofEconomic Literature, Vol. 49, No. 1, pp. 3-71.
Autor, D., W.R. Kerr and A.D. Kugler (2007), “Do Employment Protections Reduce Productivity? Evidencefrom US States”, Economic Journal, Vol. 117, pp. F189-F217.
Autor, D.H., F. Levy and R.J. Murnane (2003), “The Skill-Content of Recent Technological Change: AnEmpirical Investigation”, Quarterly Journal of Economics, Vol. 118, No. 4, pp. 1279-1333.
Azmat, G., A. Manning and J. van Reenen (2012), “Privatization and the Decline of Labour’s Share:International Evidence from Network Industries”, Economica, forthcoming.
Bamber, G., J.H. Gittell, T.A. Kochan and A. von Nordenflycht (2009), Up In The Air: How Airlines CanImprove Performance by Engaging Their Employees, Cornell University Press, Ithaca, NY.
Barrat, O., H. Chaput, A. Naboulet and L. Wolff (2007), “Wage Bargaining and Compensation Practicesin France: An Overview”, www.banque-france.fr/fileadmin/user_upload/banque_de_france/Economie-et-Statistiques/La_recherche/Wage-Bargaining-and-Compensation-Practices-in-France-wolff.pdf.
Bassanini, A. and A. Garnero (2012), “Dismissal Protection and Worker Flows in OECD Countries:Evidence from Cross-Country/Cross-Industry Data”, IZA Discussion Paper No. 6535, Bonn, May.
Bassanini, A. and T. Manfredi (2012), “Capital’s Grabbing Hand? A Cross-country/Cross-industryAnalysis of the Decline of the Labour Share”, OECD Social, Employment and Migration Working Paper,OECD Publishing, Paris, forthcoming.
Bassanini, A., L. Nunziata and D. Venn (2009), “Job Protection Legislation and Productivity Growth inOECD Countries”, Economic Policy, Vol. 58, pp. 349-402.
Bentolila, S. and G. Saint-Paul (2003), “Explaining Movements in the Labor Share”, Contributions toMacroeconomics, Vol. 3, No. 1.
Berman, E., J. Bound and Z. Griliches (1994), “Changes in the Demand for Skilled Labor withinUS Manufacturing: Evidence from the Annual Survey of Manufactures”, Quarterly Journal ofEconomics, Vol. 109, pp 367-397.
Berndt, E. (1976), “Reconciling Alternative Estimates of the Elasticity of Substitution”, Review ofEconomics and Statistics, Vol. 58, No. 1, pp. 59-68.
Bertrand, M. and S. Mullainathan (2003), “Enjoying the Quiet Life? Corporate Governance andManagerial Preferences”, Journal of Political Economy, Vol. 111, No. 5, pp. 1043-1075.
Bertrand, M., F. Kramarz, A. Schoar and D. Thesmar (2005), “Politically Connected CEOs and CorporateOutcomes: Evidence from France”, Crest Working Paper.
Bispinck, R., H. Dribbusch and T. Schulten (2010), “German Collective Bargaining in a EuropeanPerspective, Continuous Erosion or Re-Stabilisation of Multi-Employer Agreements”, WSI DiscussionPaper No. 171, Hans Böckler Stiftung, Dusseldorf, August.
3. LABOUR LOSING TO CAPITAL: WHAT EXPLAINS THE DECLINING LABOUR SHARE?
OECD EMPLOYMENT OUTLOOK 2012 © OECD 2012154
Blanchard, O. and F. Giavazzi (2003), “Macroeconomic Effects of Regulation and Deregulation in Goodsand Labor Markets”, Quarterly Journal of Economics, Vol. 115, pp. 879-907.
Blanchflower, D.G. (2006), “A Cross-Country Study of Union Membership”, IZA Discussion PaperNo. 2016, Bonn, March.
Bloom, N., M. Draca and J. van Reenen (2011), “Trade Induced Technical Change? The Impact ofChinese Imports on Innovation and Information Technology”, CEP Discussion Paper No. 1000.
Böckerman, P. and M. Maliranta (2012), “Globalization, Creative Destruction and Labour Share Change:Evidence on the Determinants and Mechanisms from Longitudinal Plant-Level Data”, OxfordEconomic Papers, forthcoming.
Boone, J. (2000), “Technological Progress, Downsizing and Unemployment”, Economic Journal, Vol. 110,No. 465, pp. 581-590.
Boulhol, H., S. Dobbelaere and S. Maioli (2011), “Import as Product and Labour Market Discipline”,British Journal of Industrial Relations, Vol. 49, No. 2, pp. 331-361.
Brown, W., A. Bryson and J. Forth (2008), “Competition and Retreat from Collective Bargaining”, NIESRDiscussion Paper No. 318, August.
Brynjolfsson, E. and A. McAfee (2011), Race Against the Machine, Digital Frontier Press, Lexington, Mass.
Bureau of Economic Analysis (2011), National Income and Product Accounts Tables, Last Revised on8 August 2011, Washington, DC.
Cahuc, P., F. Postel-Vinay and J.M. Robin (2006), “Wage Bargaining with On-The-Job Search: A StructuralEconometric Model”, Econometrica, Vol. 74, No. 2, pp. 323-64.
Calmfors, L. and A. Larsson (2011), “Pattern Bargaining and Wage Leadership in a Small OpenEconomy”, CESIFO Working Paper No. 3510, July.
Chambost, I., C. Hoarau, P. Pons, P. Roturier and E. Tarrière (2008), “Financiarisation des entreprises etdialogue social”, Cabinet Syndex, Paris, November.
Checchi, D. and C. García-Peñalosa (2008), “Labour Market Institutions and Income Inequality”,Economic Policy, Vol. 56, pp. 601-649.
Clark, I. (2009), “Private Equity in the UK: Job Regulation and Trade Unions”, Journal of IndustrialRelations, Vol. 51, No. 4, pp. 489-500.
Criscuolo, C., R. Martin, H. Overman and J. van Reenen (2012), “The Causal Effects of an IndustrialPolicy”, IZA Discussion Paper, No. 6323, Bonn.
Dahl, C.M., D. le Maire and J.R. Munch (2011), “Wage Dispersion and Decentralization of WageBargaining”, IZA Discussion Paper No. 6176, Bonn, November.
DARES (2008), “Le paradoxe du syndicalisme français : un faible nombre d’adhérents mais dessyndicats bien implantés”, Premières Informations et Premières Synthèses, No. 16.1, April, www.travail-emploi-sante.gouv.fr/IMG/pdf/2008.04-16.1.pdf.
Davies, P. and M. Freedland (2005), “The Evolving Structure of Collective Bargaining in Europe1990-2004, National Report for the United Kingdom”, Report for a research project Co-financed bythe European Commission and the University of Florence, http://eprints.unifi.it/archive/00001178/01/Regno_Unito.pdf.
de Serres, A., Scarpetta, S. and C. de la Maisonneuve (2002), “Sectoral Shifts in Europe and the UnitedStates: How they Affect Aggregate Labour Shares and the Properties of Wage Equations”, OECDEconomics Department Working Paper No.326, OECD Publishing, Paris.
Dølvik, J.E., (2008), “The Negotiated Nordic Labor Markets: From Bust to Boom”, Center for EuropeanStudies Working Paper Series, No. 162.
Driffield, N. and S. Girma (2003), “Regional Foreign Direct Investment and Wage Spillovers: Plant LevelEvidence from the Electronics Industry”, Oxford Bulletin of Economics and Statistics, Vol. 65, No. 4,pp. 453-474.
Driver, C. and J. Muñoz-Bugarín (2010), “Capital Investment and Unemployment in Europe: Neutralityor Not?”, Journal of Macroeconomics, Vol. 32, pp. 492-496.
Du Caju, P., E. Gautier, D. Momferatou and M. Ward-Warmedinger (2008), “Institutional Features ofWage Bargaining in 23 European Countries, the US and Japan”, National Bank of Belgium WorkingPaper Research No. 154, December.
3. LABOUR LOSING TO CAPITAL: WHAT EXPLAINS THE DECLINING LABOUR SHARE?
OECD EMPLOYMENT OUTLOOK 2012 © OECD 2012 155
Duenhaupt, P. (2011), “Financialization and the Rentier Income Share – Evidence from the USA andGermany”, International Review of Applied Economics, DOI:10.1080/02692171.2011.595705.
Dumont, M., G. Rayp and P. Willemé (2005), “Does Internationalization Affect Union Bargaining Power?An Empirical Study for Five EU Countries”, Oxford Economic Papers, Vol. 58, pp. 77-102.
Dumont, M., G. Rayp and P. Willemé (2012), “The Bargaining Position of Low-skilled and High-skilledWorkers in a Globalizing World”, Labour Economics, Vol. 19, pp. 312-319.
Dynan, K.E., J. Skinner and S. Zeldes (2004), “Do the Rich Save More?”, Journal of Political Economy,Vol. 112, No. 2, pp. 397-444.
EIRO (2011), “Portugal: EIRO Annual Review-2009”, European Industrial Relations Observatory, Dublin,www.eurofound.europa.eu/eiro/studies/tn1004019s/pt1004019q.htm.
Eurofound (2005), “Changes in National Collective Bargaining Systems Since 1990”, EuropeanFoundat ion for the Improvement of L iv ing and Working Condit ions , Dubl in ,www.eurofound.europa.eu/eiro/2005/03/study/TN0503102S.htm.
Eurofound (2010), “Derogation Clauses on Wages in Sectoral Collective Agreements in Seven EuropeanCountries”, European Foundation for the Improvement of Living and Working Conditions, Dublin,www.eurofound.europa.eu/pubdocs/2010/87/en/1/EF1087EN.pdf.
Eurofound (2011), “Extension of Collective Bargaining in the EU”, European Foundation for theImprovement of Living and Working Conditions, Dublin, www.eurofound.europa.eu/pubdocs/2011/54/en/1/EF1154EN.pdf.
European Commission (2011), “Wage Setting: Institutional Features”, Commission Note, ADHOC/11/030511/EN, European Commission, Brussels, http://gesd.free.fr/wagescom11.pdf.
Eurostat (2011), GDP – Statistics Explained, Eurostat, Luxembourg.
Farber, H.S. (1986), “Analysis of Union Behaviour”, in O. Ashenfelter and R. Layard (eds.), Handbook ofLabor Economics, Amsterdam.
Felbermayr, G., J. Prat, H.J. Schmerer (2011), “Trade and Unemployment: What do the Data Say?”,European Economic Review, Vol. 55, No. 6, pp. 741-758.
Fernandes, N., M.A. Ferreira, P. Matos and K.J. Jenter (2009), “The Pay Divide: (Why) Are US TopExecutives Paid More?”, ECGI Working Paper No. 255/2009.
Freyssinet, J. and H. Seifert (2001), “Negotiating Collective Agreements on Employment andCompetitiveness”, European Foundation for the Improvement of Living and Working Conditions,Dublin, www.uni-mannheim.de/edz/pdf/ef/01/ef0124en.pdf.
Frydman, C. and D. Jenter (2010), “CEO Compensation”, Annual Review of Financial Economics, Vol. 2,No. 1, pp. 75-102.
Frydman, C. and R.E. Saks (2010), “Executive Compensation: A New View from a Long-TermPerspective, 1936-2005”, Review of Financial Studies, Vol. 23, No. 5, pp. 2099-2138.
Gollin, D. (2002), “Getting Income Shares Right”, Journal of Political Economy, Vol. 110, No. 2, pp. 458-474.
Goos, M. and A. Manning (2007), “Lousy and Lovely Jobs: The Rising Polarization of Work in Britain”,Review of Economics and Statistics, Vol. 89, No. 1, pp. 118-33.
Goos, M., A. Manning and A. Salomons (2009), “Job Polarization in Europe”, American Economic Review:Papers and Proceedings, Vol. 99, No. 2, pp. 58–63.
Greenwood, J. and B.J. Jovanovic (1999), “Accounting for Growth”, in: C. Hulten (ed.), Studies in Incomeand Wealth: New Directions in Productivity Analysis, University of Chicago Press for NBER, Chicago.
Gürtzgen, N. (2010), “Rent-Sharing and Collective Wage Contracts–Evidence from GermanEstablishment-Level Data”, Applied Economics, Vol. 42, No. 22, pp. 2835-2854.
Guscina, A. (2006), “Effects of Globalization on Labor’s Share in National Income”, IMF Working Paper,No. 06/294.
Haipeter, T. and S. Lehndorff (2009), “Collective Bargaining on Employment”, Industrial and EmploymentRelations Department Working Paper No. 3, ILO, May.
Harrison, A. (2002), “Has Globalization Eroded Labor’s Share? Some Cross-Country Evidence”, Paperpresented at the Joint Conference of the IDB and the World Bank: The FDI Race: Who Gets thePrize? Is it Worth the Effort?, October.
3. LABOUR LOSING TO CAPITAL: WHAT EXPLAINS THE DECLINING LABOUR SHARE?
OECD EMPLOYMENT OUTLOOK 2012 © OECD 2012156
Hassel, A. (2006), Wage Setting, Social Pacts and the Euro – A New Role for the State, Amsterdam UniversityPress, Amsterdam, http://dare.uva.nl/document/133275.
Hayter, S., T. Fashoyin and T.A. Kochan (2011), “Collective Bargaining for the 21st Century”, Journal ofIndustrial Relations, Vol. 53, No. 2, pp. 225-247.
Hijzen, A. and P. Swaim (2010), “Offshoring, Labour Market Institutions and the Elasticity of LabourDemand”, European Economic Review, Vol. 54, No. 8, pp. 1016-1034.
Hijzen, A., P. Martins, T. Schank and R. Upward (2010) “Do Foreign-Owned Firms Provide better WorkingConditions than their Domestic Counterparts? A Comparative Analysis”, IZA Discussion PapersNo. 5259, Bonn.
Hirsch, B. (1988), “Trucking Regulation, Unionization and Labor Earnings: 1973-85”, Journal of HumanResources, Vol. 23, No. 3, pp. 296-319.
Howell, C. (2009), “The Transformation of French Industrial Relations: Labor Representation and theState in a Post-Dirigiste Era”, Politics and Society, Vol. 37, No. 2, pp. 229-256.
Howell, C. and R. Koilns Givan (2011), “Rethinking Institutions and Industrial Change in EuropeanIndustrial Relations”, British Journal of Industrial Relations, Vol. 49, No. 2, pp. 231-255.
Hutchinson, J. and D. Persyn (2012), “Globalisation, Concentration and Footloose Firms: in Search of theMain Cause of the Declining Labour Share”, Review of World Economics, forthcoming.
ILO (2009), World of Work Report 2009, International Institute for Labour Studies, Geneva.
ILO (2011), World of Work Report 2011, International Institute for Labour Studies, Geneva.
IMF (2007), World Economic Outlook, IMF, Washington, DC.
Jaumotte, F. and I. Tytell (2007), “How Has The Globalization of Labor Affected the Labor Income Sharein Advanced Countries?”, IMF Working Paper, No. 07/298.
Kalinova, B., A. Palerm and S. Thomsen (2010), “OECD’s FDI Restrictiveness Index: 2010 Update”, OECDWorking Papers on International Investment, No. 2010/03, OECD Publishing, Paris.
Keune, M. (2008), “Wage Moderation, Decentralisation of Collective Bargaining and Low Pay”, inM. Keune and B. Galgóczi (eds.), Wages and Wage Bargaining in Europe – Developments Since the Mid-1990s, ETUI-REHS, Brussels.
Keune, M. (2010), “Derogation Clauses on Wages in Sectoral Collective Agreements in Seven EuropeanCountries”, Eurofound, www.eurofound.europa.eu/pubdocs/2010/87/en/2/EF1087EN.pdf.
Lamare, J.R., P. Gunnigle, P. Marginson and G. Murray (2009), “Multinationals’ Union AvoidancePractices at New Sites: Transatlantic Variations”, Paper for MNCs Symposium, IIRA WorldCongress, Sydney, August.
Landier, A., V. Nair and J. Wulf (2009), “Trade-offs in Staying Close: Corporate Decision Making andGeographic Dispersion”, Review of Financial Studies, Vol. 22, No. 3, pp. 1119-1148.
Lazear, E. (1990), “Job Security Provisions and Unemployment”, Quarterly Journal of Economics, Vol. 55,pp. 699-726.
Lazonick, W. and M. O’Sullivan (2000), “Maximising Shareholder Value: a New Ideology for CorporateGovernance”, Economy and Society, Vol. 29, No. 1, pp. 13-35.
Leonardi, M. and G. Pica (2010), “Who Pays for It? The Heterogeneous Wage Effects of EmploymentProtection Legislation”, IZA Discussion Paper, No. 5335, Bonn.
Masanjala, W. and C. Papageorgiou (2004), “The Solow Model with CES Technology: Nonlinearities andParameter Heterogeneity”, Journal of Applied Econometrics, Vol. 19, pp. 171-201.
Mazzolari, F. and G. Ragusa (2012), “Spillovers from High-Skill Consumption to Low-Skill LaborMarkets”, Review of Economics and Statistics, forthcoming.
Mühlemann, S., S. Wolter and A. Wüest (2009), “Apprenticeship Training and the Business Cycle”,Empirical Research in Vocational Education and Training, Vol. 1, No. 2.
Nicoletti, G. and S. Scarpetta (2003), “Regulation, Productivity and Growth: OECD Evidence”, EconomicPolicy, Vol. 18, No. 36, pp. 9-72.
OECD (2007), OECD Employment Outlook, OECD Publishing, Paris.
OECD (2008a), Growing Unequal – Income Distribution and Poverty in OECD Countries, OECD Publishing,Paris.
3. LABOUR LOSING TO CAPITAL: WHAT EXPLAINS THE DECLINING LABOUR SHARE?
OECD EMPLOYMENT OUTLOOK 2012 © OECD 2012 157
OECD (2008b), OECD Employment Outlook, OECD Publishing, Paris.
OECD (2009), “Real Wages, Productivity and the Determinants of the Labour Share: A StructuralApproach”, ECO/CPE/WP1(2009)6, Official document from the OECD Economics Department.
OECD (2010), OECD Employment Outlook, OECD Publishing, Paris.
OECD (2011a), Divided We Stand – Why Inequality Keeps Rising, OECD Publishing, Paris.
OECD (2011b), OECD Employment Outlook, OECD Publishing, Paris.
OECD (2012), “Labour Losing to Capital”, Supporting Material for Chapter 3 of the 2012 OECDEmployment Outlook, OECD Publishing, Paris, available online at www.oecd.org/employment/outlook.
Raess, D. and B. Burgoon (2006), “The Dogs that Sometimes Bark: Globalization and Works CouncilBargaining in Germany”, European Journal of Industrial Relations, Vol. 12., No. 3, pp. 287-309.
Raurich, X., H. Sala and V. Sorolla (2012), “Factor Shares, the Price Markup and the Elasticity ofSubstitution between Capital and Labor”, Journal of Macroeconomics, forthcoming.
Romo, O.M. (2008), “Wages and Wage Bargaining in Ireland”, in M. Keune and B. Galgóczi (eds.), Wagesand Wage Bargaining in Europe, ETUI-REHS, Brussels.
Rodrik, D. (1997), Has Globalization Gone Too Far?, Institute for International Economics, Washington,DC.
Rusinek, M. and F. Rycx (2008), “Rent-Sharing under Different Bargining Regimes: Evidence fromLinked Employer-Employee Data”, IZA Discussion Paper No. 3406, Bonn, March.
Saez, E. and M.R. Veall (2005), “The Evolution of High Incomes in Northern America: Lessons fromCanadian Evidence”, American Economic Review, Vol. 95, No. 3, pp. 831-849.
Schulten, T., T. Brandt and C. Hermann (2008), “Liberalisation and Privatisation of Public Services andStrategic Options for European Trade Unions”, European Review of Labour and Research, Vol. 14,No. 285, pp. 295-311.
Spitz-Oener, A. (2006), “Technical Change, Job Tasks and Rising Educational Demand: Looking Outsidethe Wage Structure”, Journal of Labor Economics, Vol. 24, No. 2, pp. 235-270.
Torrini, R. (2005), “Profit Share and the Returns on Capital Stock in Italy: The Role of Privatizationbehind the Rise in the 1990s”, CEP Discussion Paper No. 671.
Traxler, F. and B. Brandl (2010), “Preconditions for Pacts on Incomes Policy: Bringing Structures backin”, European Journal of Industrial Relations, Vol. 16, No. 1, pp. 73-90.
Trefler, D. (2004), “The Long and Short of Canada US Free Trade Agreement”, American Economic Review,Vol. 94, No. 4, pp. 870-895.
van der Wiel, K. (2010), “Better Protected, Better Paid: Evidence on How Employment Protection AffectsWages”, Labour Economics, Vol. 17, pp. 16-26.
van Klaveren, M. (2011), “Sector-level bargaining and possibilities for deviations at company level –Ireland”, Eurofound, www.eurofound.europa.eu/pubdocs/2010/875/en/1/EF10875EN.pdf.
Visser, J. (2004), “Recent Trends and Persistent Variations in Europe’s Industrial Relations”,www.csmb.unimore.it/on-line/Home/Prova/documento36007711.html.
Visser, J. (2005), “Beneath the Surface of Stability: New and Old Modes of Governance in EuropeanIndustrial Relations”, European Journal of Industrial Relations, Vol. 11, pp. 287-306.
Visser, J. (2011), “Data Base on Institutional Characteristics of Trade Unions, Wage Setting, StateIntervention and Social Pacts”, 1960-2010(ICTWSS), Version 3.0, May, www.uva-aias.net/208.
Wills, J. (2009), “Subcontracted Employment and its Challenge to Labor”, Labor Studies Journal, Vol. 34,No. 4, December.
Wölfl, A., I. Wanner, T. Kozluk and G. Nicoletti (2009), “Ten Years of Product Market Reforms in OECDCountries, Insights from a Revised PMR indicator”, OECD Economics Department Working PaperNo. 695, OECD Publishing, Paris.
Zeira, J. (1998), “Workers, Machines and Economic Growth”, Quarterly Journal of Economics, Vol. 113,No. 4, pp. 1091-1113.
3. LABOUR LOSING TO CAPITAL: WHAT EXPLAINS THE DECLINING LABOUR SHARE?
OECD EMPLOYMENT OUTLOOK 2012 © OECD 2012158
ANNEX 3.A1
Data Construction and Sources
Industry-level dataEarnings and hourly wage data refer to total gross annual earnings and average hourly
wages, respectively of wage and salary employees. Employment and hours worked refer to
annual averages for wage and salary employees. Real value added is obtained by deflating
nominal value added in each industry with the industry-specific double deflator. Data are
from the EUKLEMS Database except for Norway, where they come from the OECD STAN
Database and refer to total employment. Capital services and TFP data are also from the
EUKLEMS Database and are constructed using double-deflated value added. EUKLEMS data
obtained through interpolation and/or estimated on the basis of conjectures were removed
from the sample, following the criteria detailed in the 2011 OECD Employment Outlook. For
the computation of the labour share in each industry, average hourly compensation of
self-employed is assumed to be equal to the average hourly wage of the industry.
The distributions by educational attainment of earnings, wage and hours also come
from the EUKLEMS Database. Education is divided into three categories: low-education (less
than upper secondary); medium education (upper secondary); and high education (more
than upper secondary). The business sector, in this case, is partitioned in 9 industries for
reasons of data reliability (as in the 2011 OECD Employment Outlook).
The industry-specific US dismissal rate is from Bassanini and Garnero (2012). The data
are available at https://sites.google.com/site/bassaxsite/home/files/BGdata.zip. It is derived from
various waves of the CPS Displaced Workers Supplement (2000-06, even years). An
individual is considered to have been dismissed if he/she lost his/her job in the most recent
year covered by each survey, because of plant closing or moved, insufficient work, or
position or shift abolished. Only wage and salary employees in the private-for-profit sector
are considered.
The share of workers in the United Kingdom with less than secondary education prior
to the introduction of the minimum wage in 1999 is the average share in each industry over
all available quarters between 1994 and 1998. The source is the UK Labour Force Survey.
The indexes of anti-competitive product market regulation, including public
ownership and barriers to entry, come from the OECD Regulatory Database (www.oecd.org/
document/1/0,3746,en_2649_%2037421_2367297_1_1_1_37421,00.html). They vary from 0 to 6
from the least to the most restrictive. Time-varying aggregate data are available for three
industries (Energy, Transport and Communications) from 1975 to 2008.
3. LABOUR LOSING TO CAPITAL: WHAT EXPLAINS THE DECLINING LABOUR SHARE?
OECD EMPLOYMENT OUTLOOK 2012 © OECD 2012 159
Import-weighted real exchange rates are defined as follows:
where x stands for the import-weighted real exchange rate, m is to the import share from
country l in industry i of country k at a fixed time period t0 (early 1980s in these data) – the
import weights thus vary across industries and countries but are constant over time – e is
the nominal bilateral exchange rate between countries k and l at time t – which varies
across partner countries and time, but not across industries – the p variables refer to price
levels, as approximated by the GDP deflator, in countries l and k respectively. An increase
in the industry-specific exchange rate represents a real depreciation in the price of output
produced in industry i of country k relative to its trading partners (weighted by import
shares). Put differently, an increase in the industry-specific exchange rate represents an
improvement in the terms of trade in industry i for country k. The source is the 2007 OECD
Employment Outlook.
Import penetration is defined as the ratio of imports to apparent demand (imports
plus output minus exports). Trade exposure is the sum of import penetration and export
propensity, the latter defined as the ratio of exports to domestic output. The source of both
variables is the OECD STAN Database. For industry i in country k, intra-industry offshoring
is defined as the ratio of imported intermediate purchases from the same industry to that
industry’s domestic output:
where M refers to the imports of intermediates from industry i by industry i and Y refers to
domestic output in industry i. This indicator is computed using OECD Input-Output tables,
available for 1995, 2000 and 2005.
OECD industry-specific indicators on regulatory barriers to inward FDI concern foreign
equity limits, screening and approval, restrictions on top foreign personnel, and other
restrictions concerning notably reciprocity rules and profit/capital repatriation. For each of
these components the indicator vary between 0 and 1 from the least to the most
restrictive. They are available between 1997 and 2006 at approximately five year intervals.
Missing data were interpolated. In the regressions, missing 2007 data are replaced
with 2006 data. All components, except restrictions on top foreign personnel, were lumped
together by simple addition. The source is Kalinova et al. (2010).
Aggregate dataEarnings data are deflated using the private consumption deflator, drawn from the
OECD Economic Outlook (EO) Database. When comparisons of deflators are made, the
difference between aggregate value added deflators in the EO and EUKLEMS Databases is
netted out, in order to purge the comparison from different degrees of quality-adjustment
across deflators. For the computation of the aggregate labour share, average annual
compensation of self-employed is assumed to be equal to the average annual wage of the
industry. 1997 USD purchasing power parities data, used for the definition of high-wage
countries, are from EUKLEMS. Data on earnings inequality are from the OECD Income
Distribution Database (www.oecd.org/els/social/inequality).
I
i
L
lktltkltikltikt ppemx
1 1
/0
ikt
iktikt Y
Mo
3. LABOUR LOSING TO CAPITAL: WHAT EXPLAINS THE DECLINING LABOUR SHARE?
OECD EMPLOYMENT OUTLOOK 2012 © OECD 2012160
EP indicators come from the OECD Indicators of Employment Protection (www.oecd.org/
employment/protection). All indicators vary from 0 to 6 from the least to the most stringent.
Minimum wages are measured as the ratio of the statutory minimum wage to median
earnings of full-time workers. The deviation of the logarithm of the real minimum wage
in 2000 USD purchasing power parities from the OECD average of each year is used as
instrument. The source of all these variables is the OECD Employment Database
(www.oecd.org/els/employment/database).
Collective bargaining coverage is the share of workers covered by a collective
agreement, in percentage. The source is the ICTWSS Database (www.uva-aias.net/207). Data
were averaged or interpolated when information is not available at the annual level.
The degree of corporatism is proxied with the ICTWSS index of bargaining
co-ordination, which takes values from 1 to 5 from the least to the most co-ordinated. The
source of this variable is the ICTWSS Database (www.uva-aias.net/207).
Unemployment benefit generosity is measured on the basis of gross average
replacement rates (in percentage of pre-displacement wage), defined as average
unemployment benefit replacement rate across two income situations (100% and 67% of
average worker earnings), three family situations (single, with dependent spouse, with
spouse in work) and three different unemployment durations (first year, second and third
years, and fourth and fifth years of unemployment). The source is the OECD Benefits and
Wages Database (www.oecd.org/els/social/workincentives).
The tax wedge considered in this chapter is the wedge between the labour cost for the
employer and the corresponding net take-home pay of the employee for single-earner
couples with two children earning 100% of average worker earnings. It is expressed as the
sum of personal income tax and all social security contributions as a percentage of total
labour cost. The source of all these variables is the OECD Taxing Wages Database
(www.oecd.org/ctp/taxingwages).
Sources for Table 3.1The table was constructed by compiling various sources.
Importance of the various levels of bargaining
Eurofound (2005); European Commission (2011); country notes on national industrial
relations from the website “Worker participation” from ETUI, www.worker-participation.eu/
Nat ional- Industr ia l -Re lat ions ; E IRO’s industr ia l relat ions country prof i les,
www.eurofound.europa.eu/eiro/country_index.htm; various country readings: Dølvik (2008), for
Denmark, Finland, Norway and Sweden; Howell (2009) and Barrat et al. (2007) for France;
Romo (2008); Ahlberg and Bruun (2005) for Sweden.
Extension of sectoral agreements
Eurofound (2011); ETUI’s Worker participation country notes on industrial relations for
Ireland and the Netherlands (www.worker-participation.eu/National-Industrial-Relations);
Bispinck et al. (2010) for Spain.
Use of derogation clauses
Eurofound (2010) for Austria, Belgium, France, Germany, Ireland, Italy and Spain;
Haipeter and Lehndorf (2009) for Denmark and Hungary; Eurofound (2005) for Sweden.
3. LABOUR LOSING TO CAPITAL: WHAT EXPLAINS THE DECLINING LABOUR SHARE?
OECD EMPLOYMENT OUTLOOK 2012 © OECD 2012 161
Change in the dominant bargaining level since 1990
For Denmark: Andersen, and Navrbjerg (2008) and Dølvik (2008); for Finland and
Sweden, Dølvik (2008); for France, ETUI’s workers participation country note on national
industrial relations (www.worker-participation.eu/National-Industrial-Relations) and Barrat et
al. (2007); for Slovak Republic, ETUI’s workers participation country note on national
industrial relations (www.worker-participation.eu/National-Industrial-Relations).
Type and intensity of co-ordination between the various bargaining actors and levels
Du Caju et al. (2008); ETUI’s worker participation country notes on national industrial
relations (www.worker-participation.eu/National-Industrial-Relations); Traxler and Brandl (2010);
EIRO’s industrial relations country profiles; Calmfors and Larsson (2011); Barrat et al. (2007).