Embed Size (px)
Citation preview

248
Volume 20 ✤ Number 2 ✤ Winter 2009 ✤ pp. 248–273
a
What Factors Are Associated With Grade Acceleration?
An Analysis and Comparison of Two U.S. Databases
Ryan WellsUniversity of Massachusetts Amherst
David Lohman Maureen MarronThe University of Iowa
Acceleration is an educational intervention intended to present talented youth with appropriate levels of academic challenge. Formally, acceleration is defined as “progress though an edu-cational program at rates faster or ages younger than conven-tional” (Pressey, 1949, p. 2). Within this definition, 18 forms of acceleration have been identified (Southern & Jones, 2004), 3 of which are early admission to kindergarten, early admission to first grade, and grade skipping. In all three situations, a child is placed ahead of age peers into a classroom with older students. For purposes of this paper, we will use grade acceleration to refer to these three forms of acceleration.
Although grade acceleration has been much studied (Rogers, 2004), there are still gaps in the literature. First, past research has focused primarily on the outcomes of grade acceleration rather than on the predictors or correlates of being accelerated. Second,
Copyright © 2009 Prufrock Press, P.o. Box 8813, Waco, TX 76714sum
mary
Wells, R., Lohman, D., & Marron, M. (2009). What factors are associated with grade acceleration? An analysis and comparison of two U.S. databases. Journal of Advanced Academics, 20, 248–273.
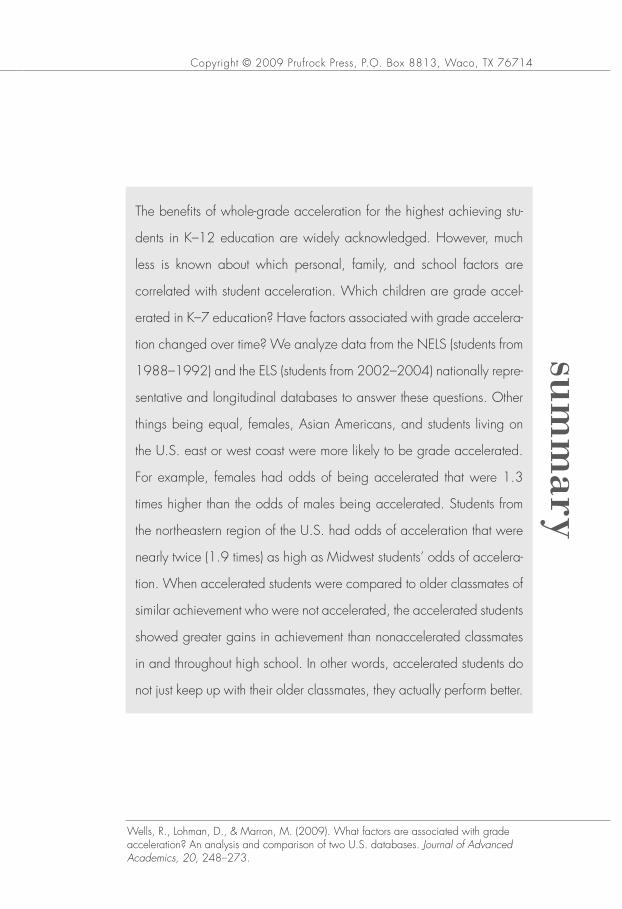
The benefits of whole-grade acceleration for the highest achieving stu-
dents in K–12 education are widely acknowledged. However, much
less is known about which personal, family, and school factors are
correlated with student acceleration. Which children are grade accel-
erated in K–7 education? Have factors associated with grade accelera-
tion changed over time? We analyze data from the NELS (students from
1988–1992) and the ELS (students from 2002–2004) nationally repre-
sentative and longitudinal databases to answer these questions. other
things being equal, females, Asian Americans, and students living on
the U.S. east or west coast were more likely to be grade accelerated.
For example, females had odds of being accelerated that were 1.3
times higher than the odds of males being accelerated. Students from
the northeastern region of the U.S. had odds of acceleration that were
nearly twice (1.9 times) as high as Midwest students’ odds of accelera-
tion. When accelerated students were compared to older classmates of
similar achievement who were not accelerated, the accelerated students
showed greater gains in achievement than nonaccelerated classmates
in and throughout high school. In other words, accelerated students do
not just keep up with their older classmates, they actually perform better.

250 Journal of Advanced Academics
FACToRS ASSoCIATED WITH GRADE ACCELERATIoN
studies often examine grade-accelerated youth in isolation rather than in comparison to a nonaccelerated cohort of similar ability or achievement. Third, because educational attitudes and policies change, newer studies are always needed.
The Present Study
In this study, we examined data from two national longitudi-nal data sets that followed different student cohorts, specifically, the National Educational Longitudinal Study (NELS) and the Educational Longitudinal Study (ELS), both collected by the National Center for Education Statistics (NCES). The NELS includes a base-year study of a national sample of 24,599 U.S. eighth-grade students in 1988 and multiple follow-up studies. We used data from 1988 to determine the characteristics of stu-dents who had been accelerated before eighth grade. We also used data from the 1992 follow-up study to investigate academic outcomes during high school following whole-grade accelera-tion during elementary school.
To determine changes across time in the correlates and pre-dictors of acceleration, we also examined data from a more recent cohort of students in the ELS. Data from the ELS include a base-year study of 16,252 U.S. 10th graders in 2002 and a first follow-up in 2004 when these students were in 12th grade. We used data from 2002 to determine the characteristics of students who had been accelerated before 10th grade, and we used data from 2004 to examine some academic outcomes of whole-grade acceleration for these students. Across both data sets, we investi-gated the demographic and family characteristics that predicted grade acceleration and some of the cognitive and affective out-comes of grade acceleration.
Outcomes of Acceleration
Academic Outcomes. Research across many decades has consistently reported positive effects for academic acceleration (Colangelo,

251Volume 20 ✤ Number 2 ✤ Winter 2009
Wells, Lohman, & Marron
Assouline, & Gross, 2004; Gross & van Vliet, 2005; Kulik, 2004; Kulik & Kulik, 1992; Vialle, Ashton, Carlon, & Rankin, 2001). Rogers’ (1992) meta-analysis of 314 quantitative or qualitative studies on acceleration found that most showed positive out-comes. Subsequently, Rogers (2004) observed that research on grade skipping “comprises one of the strongest and most-con-sistent bodies of research in the field of gifted education” (p. 55). Some of the most convincing evidence has come from studies in which accelerated students were compared with nonacceler-ated students of similar ability. For example, the 26 controlled studies of acceleration in Kulik and Kulik’s meta-analysis fell into two groups: comparisons between accelerated and nonacceler-ated students of the same age and IQ and comparisons between accelerated and nonaccelerated students in the same grade with the same IQ. When students of the same age were compared, achievement tests scores for accelerated students exceeded the achievement of their nonaccelerated age mates by 0.8 standard deviations or approximately one year on a grade-equivalent scale. When students in the same grade with similar IQ scores were compared, the achievement of accelerated students did not differ from the achievement of their older, nonaccelerated classmates.
Social and Emotional Outcomes. Students who are accelerated tend to report more positive social and emotional feelings than before acceleration (Kulik & Kulik, 1992; Rogers, 2002; Vialle et al., 2001). For example, Vialle et al. found that students reported high levels of satisfaction academically and emotion-ally regarding acceleration, especially when they were included in the design and execution of the curriculum plan. Gross (2003) reported that profoundly gifted children (IQ 160 and above) who were radically accelerated had more positive and healthier levels of social self-esteem than their nonaccelerated counter-parts. Based on this type of research, Southern, Jones, and Fiscus (1989) observed that many leaders in gifted education consid-ered the acceleration controversy settled. However, Colangelo et al. (2004) have since shown that despite much positive empirical
252 Journal of Advanced Academics
FACToRS ASSoCIATED WITH GRADE ACCELERATIoN
research, acceleration is still viewed unfavorably by many teach-ers and school administrators.
Predictors of Acceleration
Few researchers have examined the predictors of grade accel-eration. Studying the predictors of grade acceleration may be important for several reasons. First, although participation rates in gifted education are lower for students from low-income fami-lies or racial-ethnic minorities (Donovan & Cross, 2002), it is not known whether these students are less likely to be grade accelerated than other students who show similar levels of aca-demic achievement. For example, Vialle et al. (2001) found that accelerated students believe that parental advocacy and support are essential for successful acceleration. Families of gifted chil-dren tend to exhibit a number of positive characteristics, which include a focus on children, a generally enriched family environ-ment, and parents who model hard work and high achievement (Winner, 1996). However, the specific ways in which parental behaviors and attitudes influence whether a child initially will be grade accelerated are less well understood. This study will help to fill that gap by examining the relationships between grade accel-eration and parental involvement and parental rules or guidelines.
Although U.S. regional practices with regard to acceleration may differ, studies have not documented what these regional differences might be. If region matters, then subsequent studies may need to control for its potentially confounding effects when the effects of acceleration across different studies are compared.
In all, past research has much to say about the positive out-comes of grade acceleration for prepared students. However, much of this research is lacking in statistical rigor, primarily because it has neglected to compare grade-accelerated youth to similar-achievement nonaccelerated youth. One exception is Swiatek and Benbow’s (1991) longitudinal study of ability matched accelerated and nonaccelerated gifted students, which focused on post-high-school outcomes and self-concept measures. The accelerated and nonaccelerated students who participated in the study did not
253Volume 20 ✤ Number 2 ✤ Winter 2009
Wells, Lohman, & Marron
differ on the academic and psychosocial outcome variables that were studied. Two of the psychosocial variables were the NELS self-esteem and locus of control scales, which were also used in this study. However, the students who participated in Swiatek and Benbow’s study had concluded their high school experience at least 5 years before the investigation. In contrast, students in the present studies were either in 8th or 10th grade when data were first collected, and therefore, some of these students were less removed from the grade acceleration that they had experi-enced at some time during elementary school.
Using NELS data, Sayler and Brookshire’s (1993) analysis focused on the social, emotional, and behavioral adjustment of accelerated students when they were in the eighth grade. Sayler and Brookshire compared the mean scores of accelerated stu-dents with the mean scores for two nonoverlapping comparison groups—a random sample of students who reported participa-tion in gifted classes during grade 8 and a random sample of all students. The accelerated students reported no unusual social isolation or severe emotional difficulties and reported fewer behavioral problems than the nonaccelerated students.
In summary, the vast majority of studies of grade accelera-tion have focused on outcomes of acceleration rather than on the predictive factors. We used data collected in 1988 and 2002 to examine both predictors and outcomes of grade acceleration in the United States at two different points in time. We also extended earlier research by using logistic regression, a statistical method generally recommended when the outcome of interest has only two categories, such as grade-accelerated versus nonac-celerated students.
Data and Methods
To obtain a historical view of acceleration predictors and out-comes across a 24-year time span in the United States, we used data from two sources: the National Educational Longitudinal Study (NELS) and the Educational Longitudinal Study (ELS).

254 Journal of Advanced Academics
FACToRS ASSoCIATED WITH GRADE ACCELERATIoN
Both data sets were collected by the National Center for Education Statistics (NCES). We examined the predictors and outcomes of three forms of grade acceleration: early entrance to kindergarten, early entrance to first grade, and grade skipping.
The NELS includes data from multiple follow-ups on a national sample of 24,599 students who were initially studied as eighth graders in 1988. We used data from the 1988 base-year study to determine the characteristics of students who had been accelerated before eighth grade. We also used data from the 1992 follow-up study to investigate high school academic outcomes of grade accel-eration (specifically, early entrance to kindergarten, early entrance to first grade, and grade skipping) during elementary school.
To track more recent changes in acceleration predictors and outcomes, we relied on the ELS data set. Data from the ELS were gathered on a cohort of 16,252 U.S. high school students who were in 10th grade in 2002. The first follow-up was conducted in 2004 when these students were in 12th grade. We used data from 2002 to determine the characteristics of students who had been accelerated before 10th grade, and we used data from 2004 to examine some academic outcomes of grade acceleration for these students. Some cases were dropped from the regression analyses due to missing data for the variables of interest. This resulted in a final sample size of 23,341 for NELS and 11,344 for ELS.
In addition to completing comprehensive questionnaires, students took short achievement tests in mathematics and reading for NELS and ELS-2002. The ELS test score in the 12th grade (2004) only measures math ability and not reading. Because the NCES also gave questionnaires to students’ parents, teachers, principals, and librarians, the datasets provide multiple perspectives on educational policies, family context, school facil-ities, and school climate.
To obtain a nationally representative sample of students, NCES used a two-stage sample selection process. First, a stratified random sample of schools was drawn, and then a stratified ran-dom sample of students was taken from within each school. This two-stage method requires that analyses account for the complex survey design and multilevel nature of the data. Weighting data

255Volume 20 ✤ Number 2 ✤ Winter 2009
Wells, Lohman, & Marron
during analysis is also necessary to account for a design that over-samples particular types of schools and students (NCES, 2002). We accounted for both requirements by using appropriate proce-dures in Stata, a statistical software package (King & Zeng, 2001).
Determining whether students had been grade accelerated during elementary school was not a completely straightforward process. One item on the NELS questionnaire (but not on the ELS questionnaire) asked whether a student had ever skipped a grade before eighth grade. However, responses to the NELS grade-skipping question may not accurately identify gifted stu-dents, because skipping kindergarten, for example, may have been reported simply because kindergarten was not offered. Furthermore, as pointed out by Sayler and Brookshire (1993), selecting those students whose parents indicated that their chil-dren had skipped a grade “produced a sample that included large numbers of nongifted students, individuals who had been retained in the early grades and later ‘accelerated’ back to their original cohort group” (p. 151). Specifically in the NELS data, 170 of the 510 students who reported skipping a grade also reported having been held back.
Students who have been grade accelerated will be younger than their classmates. Therefore, we used age rather than ques-tionnaire responses to determine whether students had been grade accelerated. Using age rather than questionnaire responses also allowed us to make parallel comparisons between NELS and ELS data. Following Sayler and Brookshire (1993), we indicated that students had been accelerated if they were at least 2 years younger than the normal age for youth in that grade or if they were 1 year younger than usual but were born on or after January 1 of the appropriate year. We did not include students who were 1 year younger than usual at the beginning of the school year and who had a birthday between September and December of that year, because some of these students might not have been grade accelerated. However, it does consider students who were 4 years old at the beginning of kindergarten but turned 5 after January 1 as early entrants, even though the local cut-off date might not have classified them as such.
256 Journal of Advanced Academics
FACToRS ASSoCIATED WITH GRADE ACCELERATIoN
For example, a student entering eighth grade in September 1987 was typically 13 years old (70% of the sample). Students who were 11 years old (0.14% of the sample) were considered grade accelerated. Students who were 12 years old (8.88% of the sample) and would not turn 13 until at least January 1988 were also considered grade accelerated. For ELS data, 71.25% of the entering 10th graders were 15 years old, 0.03% were 13 years old, and 5.37% were 14 years old. This process resulted in 336 grade-accelerated students in the NELS and 100 in the ELS data. This is a conservative estimate because our procedures likely excluded some students who were legitimately grade accelerated but who might have been slightly old for their grade. The trade off is that we minimized the chance that we included nonaccelerated stu-dents in our grade-accelerated category. In addition, only about 55% of the students in NELS identified by their ages as grade accelerated for this study had been reported in the questionnaire as grade skippers, suggesting that we are legitimately including students who had been allowed early entrance to kindergarten or first grade as well. Parents responding to the questionnaire would not have identified these accelerated learners as grade-skippers.
After the population of accelerated students was defined, we selected variables that we hypothesized would best predict grade acceleration and some of the most likely cognitive and affective outcomes of grade acceleration. Selection of variables was deter-mined in part by other studies of acceleration (e.g., Sayler & Brookshire, 1993) and giftedness (see Konstantopoulos, Modi, & Hedges, 2001).
Predictor Variables
The three demographic characteristics we expected to be predictive of acceleration were gender (male or female), race/ethnicity (White, Asian, Hispanic, and African American), and socioeconomic status (SES).
Gender. Boys and girls participate in gifted programs with equal frequency. Are they accelerated equally often? Developmentally,
257Volume 20 ✤ Number 2 ✤ Winter 2009
Wells, Lohman, & Marron
girls mature more quickly than boys, and boys more often are held back in school because they are identified as immature or as having behavioral problems.
Race/Ethnicity. Participation rates in gifted education are lower for low-income or racial/ethnic minority students (Donovan & Cross, 2002), but research has not addressed whether poor and minority students are less likely to be grade-accelerated than other students who show similar levels of academic achievement.
Socioeconomic Status. The variable estimating socioeconomic sta-tus derived by NCES was based on an equally weighted compos-ite of father/guardian’s education, mother/guardian’s education, family income, father/guardian’s occupation, and mother/guard-ian’s occupation. Although a family’s SES could change between a grade skip in K–7 and data collection in 8th or 10th grade, we included this as an approximate measure of family SES at the time of acceleration.
Other predictor variables included parenting style and region of the country. We included factor scores for parental guidelines/rules and parent-child discussion. The factor concerning paren-tal rules/guidelines was created from survey questions asking how often parents checked on homework, required chores to be done, limited TV watching, and limited time with friends. The factor concerning parent-child discussion was created from survey ques-tions asking how often students and parents discussed school programs, school activities, and things studied in class. Again, these practices were measured after the actual skip took place, but we assume that they represent parental practices that were at least somewhat consistent with parental behavior at the time of grade acceleration.
Finally, we included region of the U.S. to examine possible differences in grade acceleration across the nation. Although families may have moved between a grade skip and the time of the questionnaire, we assumed that few moved from their respective region and that movement was not likely to be sub-
258 Journal of Advanced Academics
FACToRS ASSoCIATED WITH GRADE ACCELERATIoN
stantially greater from one region to another, a factor that would bias the results.
Outcome Variables
The outcome variables included participation in an Advanced Placement (AP) program, a gifted and talented program, or an International Baccalaureate (IB) program; 12th-grade test scores on the NCES achievement tests; and test score improvement between 8th and 12th grades for NELS and between 10th and 12th grades for ELS.
Past research has typically not examined the predictors and outcomes of grade acceleration while also using a comparison to a nonaccelerated cohort or controlling for either ability or achievement. When accelerated students are not compared to a nonaccelerated cohort, results do not allow one to determine the extent to which acceleration causes differences in the outcomes that are observed. Therefore, we included a composite of stu-dents’ mathematics and reading test scores at the time of the first data collection (8th grade in NELS and 10th grade in ELS) as a control for achievement.
Although this is not a measure of student ability at the time of the skip, it does effectively compare similar-achievement accel-erated and nonaccelerated students. Grade-accelerated students in these analyses are, therefore, compared to their post-skip class-mates with similar-achievement levels in 8th or 10th grade.
We included all variables in our analyses, and because exper-imental control is not possible—ethically or logistically—in this type of research, we used other methods of statistical analysis. The most common procedure in extant research has been to compare the means of accelerated and nonaccelerated cohorts (e.g., Sayler & Brookshire, 1993). We performed these analyses for each data set after first selecting a similar-sized, nonacceler-ated cohort to the accelerated cohort. We equated the groups on mean and variance of the achievement test scores.
Although useful, these comparisons removed a large num-ber of cases from the data and did not control for other factors.

259Volume 20 ✤ Number 2 ✤ Winter 2009
Wells, Lohman, & Marron
Discriminant analysis and multiple regression thus were con-sidered because these two techniques often give similar results (O’Gorman & Woolson, 1991; Pedhazur, 1997). However, logis-tic multiple regression is more common than discriminant analy-sis when the outcome of interest has only two categories, such as grade-accelerated versus nonaccelerated students. In addition, discriminant analysis assumes multivariate normality, an assump-tion that our variables did not satisfy. Logistic regression has been shown to be preferable when the assumption of normality is vio-lated (Press & Wilson, 1978). With logistic regression, the entire sample of students is included and the binary dependent variable (whether or not a student had been accelerated) is regressed on all independent variables simultaneously (including a variable for academic achievement used as a key control).
Because grade acceleration is a rare event, we were also concerned about the large imbalance between the number of accelerated and nonaccelerated students. Approximately 1.4% of students in the NELS and approximately 0.6% in the ELS data were grade accelerated. When logistic regression is used, a common rule of thumb is that the number of positive outcomes (i.e., number of students that had been grade accelerated) must be larger than the number of independent variables. Our design met this criterion, but we wanted to ensure that our study was methodologically sound. Therefore, we investigated the use of logistic regression with rare events data (King & Zeng, 2001). Indeed, results can be biased when the percentage of the sample that experiences a positive outcome (in our case, grade accel-eration) is very small. However, this effect is combined with the effect that is based on the overall size of the data set, which in our case was very large (N = 23,341 for NELS and N = 11,344 for ELS). We used the recommended procedures in Stata (King & Zeng, 2001) to account for rare events data, but the results did not differ substantively from those obtained using traditional logistic regression, which is likely due in part to the large overall sample sizes. Therefore, we present results from traditional (i.e., non-rare-events) logistic regression.
260 Journal of Advanced Academics
FACToRS ASSoCIATED WITH GRADE ACCELERATIoN
Our final analyses switched from using grade acceleration as the dependent variable to using grade acceleration as an inde-pendent variable to test if acceleration is associated with other academic and acceleration-related outcomes in high school. Specifically, we ran regression models with only two indepen-dent variables: whether students were grade accelerated and a control for academic achievement. The outcomes were participa-tion in an Advanced Placement (AP) program, a gifted and tal-ented program, or an International Baccalaureate (IB) program; 12th-grade test scores on the NCES achievement tests; and test score improvement between 8th and 12th grades for NELS and between 10th and 12th grades for ELS.
Twelfth-grade test scores were regressed only on the grade-acceleration variable. When the controls for 8th- and 10th-grade test scores were included, the model represents a student’s change; that is, this model estimates the differences in 12th-grade scores, assuming that previous scores are all equal.
Results
Descriptive statistics for each variable used in the NELS and ELS cohorts are reported in Table 1. All variables in Table 1 that can only have values of 0 and 1—namely, grade accel-erated, female, Asian American, Hispanic, African American, Northeast, South, and West—can easily be converted to percent-ages by moving the decimal point two places. For example, the mean of 0.014 for NELS grade accelerated students can be read as 1.4% of the NELS cohort were grade accelerated. Similarly, only 0.6% of the 10th-grade cohort from 2002 were accelerated. Grade acceleration appears to have been more common in the years preceding 1988 than in the years preceding 2002.
Results of our regression analyses on the predictors of grade acceleration are presented in Table 2. Because younger grade-accelerated students and their older nonaccelerated classmates are being compared, it cannot be assumed that the independent variable for the achievement test score in the 8th and 10th grades

261Volume 20 ✤ Number 2 ✤ Winter 2009
Wells, Lohman, & Marron
Table 1Descriptive StatisticsNELS ELS
Variable M SD Range M SD RangeGrade
accelerated.014 .118 0, 1 .006 .078 0, 1
Test scorea 92.2 18.2 46.6, 200 70.3 19.7 23.5, 116Female .503 .500 0, 1 .524 .499 0, 1Ethnicity
Asian American
.063 .243 0, 1 .096 .295 0, 1
Hispanic .128 .334 0, 1 .129 .335 0, 1African
American.122 .328 0, 1 .110 .312 0, 1
SESb -.059 .804 -2.97, 2.56 .091 .733 -2.11, 1.82Parenting
Rules/guidelinesc
-.024 .908 -1.34, 7.52 -.004 .998 -2.39, 1.76
Discussion with childd
-.020 .923 -1.77, 6.57 -.001 1.003 -2.32, 1.78
RegionNortheast .199 .399 0, 1 .186 .389 0, 1South .346 .476 0, 1 .356 .479 0, 1West .201 .400 0, 1 .206 .404 0, 1Note. For nELS, N = 23,341; for ELS, N = 11,344. Mean values for variables with a range of 0, 1 can be interpreted as percentages by moving the decimal point two places. For example, in the nELS database, 1.4% of the students were grade-accelerated, 50.3% were female, and 6.3% were Asian American. anELS = Eighth-grade composite of mathematics and reading; ELS = 10th-grade composite of mathematics and reading.b nCES estimates of socioeconomic status (SES) were based on an equally weighted com-posite of father/guardian’s education, mother/guardian’s education, family income, father/guardian’s occupation, and mother/guardian’s occupation. cThe Parenting Rules/Guidelines factor score was created from survey questions asking how often parents checked on homework, required chores to be done, limited TV watching, and limited time with friends.dThe Parenting Discussion with Child factor score was created from survey questions ask-ing how often students and parents discussed school programs, school activities, and things studied in class. Unlike the nELS, the ELS data also included questions for how often parents and children discussed college preparatory exams and college plans.

262 Journal of Advanced Academics
FACToRS ASSoCIATED WITH GRADE ACCELERATIoN
is a predictor. Rather, this variable is used as a control so that other comparisons can be made assuming that initial achieve-ment between the two groups was more or less equal. However, when both NELS and ELS data were used, the variable was found to be significantly positive, which means that younger
Table 2Logistic Regression Models for
Grade Acceleration Before Eighth GradeNELS ELSa
Log Odds (SE)Odds Ratio Log Odds (SE)
Odds Ratio
Test scorea 0.016** (0.003) 1.016 0.008** (0.003) 1.008Female 0.261* (0.129) 1.298 0.235* (0.096) 1.265Ethnicity
Asian 1.154** (0.195) 3.171 0.748 (0.579) 2.113Hispanic 0.794** (0.211) 2.212 1.191** (0.144) 3.290African
American0.918** (0.232) 2.504 1.182 (0.809) 3.261
SES 0.547** (0.117) 1.728 0.146 (0.379) 1.157Parenting
Rules/guidelines
-0.274** (0.076) .760 0.275* (0.126) 1.317
Discussion with child
0.157** (0.053) 1.170 -0.192 (0.132) .825
RegionNortheast 0.642** (0.224) 1.900 0.990** (0.288) 2.691South -0.068 (0.207) .934 0.246 (0.194) 1.279West 0.440* (0.210) 1.553 0.768** (0.176) 2.155
Constant -6.783** (0.357) -7.018** (0.578)Note. The Stata svy command that was used for the nELS data could not be used for the ELS data because of the inadequate number of clusters per stratum. Instead, weights and cluster analyses were applied, but the stratified nature of the data could not be accounted for. For nELS, N = 23,341, Log likelihood = -1613.441, McFadden’s pseudo-R2 = .064; for ELS, N = 11,344, Log likelihood = -351.48, McFadden’s pseudo-R2 = .041.anELS = Eighth-grade composite of mathematics and reading; ELS = 10th-grade composite of mathematics and reading
*p < .05.** p < .01. ***p < .001.

263Volume 20 ✤ Number 2 ✤ Winter 2009
Wells, Lohman, & Marron
grade-accelerated students on average obtained higher achieve-ment test scores than their older nonaccelerated classmates in 8th and 10th grade. In other words, accelerated students were not just keeping up with their older classmates, but were in fact performing significantly better.
Basic demographic variables for gender, race, and SES are reported next. For all multiple regression results reported in the tables, two values are reported. First the log-odds is reported. This is the raw logit coefficient output by statistical software. However, the logit coefficient can be difficult to interpret. Therefore, an odds ratio is also reported. The odds ratio is the increase in the odds of being grade-accelerated when that inde-pendent variable is changed one unit (0 to 1 for dummy variables, and a one standard deviation increase for continuous variables) while all other variables are held constant.
For the results in Table 2, a student with a test score that was one SD above the mean would have odds of having been accelerated that are 1.016 times higher than a student with a test score at the mean. For the female odds ratio, it is a comparison of odds between females and males while holding other variables constant. Therefore, a female has odds of having been accelerated that are approximately 1.3 times higher than the odds of a simi-lar male having been accelerated.
When those factors represented by other variables in the model were held constant, racial/ethnic minority students in general were more likely than their White peers in 1988, and Hispanic students more likely than Whites in 2002, to have been accelerated. No racial/ethnic minority group was less likely than Whites to have been accelerated in either group. We also tested variables using standard mean comparisons without controlling for achievement or other variables and found that in both the NELS and the ELS data, only Asian American students were more highly represented than Whites in the grade-accelerated compared to the nonaccelerated cohort. In other words, Hispanic and African American students are not more likely than Whites to be accelerated. Rather, for students of similar initial achieve-ment, with similar SES, of the same gender, having similar
264 Journal of Advanced Academics
FACToRS ASSoCIATED WITH GRADE ACCELERATIoN
parental influences, and from the same region of the country, the logistic regression results show that some racial/ethnic minority groups were more likely than Whites to have been accelerated.
Socioeconomic status correlates positively with most edu-cational outcomes. In this study, SES also had a statistically significant positive association with grade acceleration in the NELS cohort, but did not have a significant effect in the ELS cohort. Specifically, the odds of being accelerated for a student in the NELS cohort who had a SES score one standard deviation higher than the mean were approximately 1.7 times higher than the odds for a student with a SES score at the mean. In general, it makes sense to see fewer statistically significant results in the ELS cohort than in the NELS cohort because both the ELS sample size and the percentage of the sample that was grade accelerated are smaller.
The variables that sampled particular parental influences showed inconsistent results. An odds ratio with a value less than 1 indicates lower odds of grade acceleration. Therefore, in the NELS cohort, a student with a factor score for parental rules/guidelines that is one standard deviation higher than the mean value has odds of being accelerated that are only about three fourths (0.76) of the odds of someone with a mean score on that score being accelerated. On the other hand, youth with par-ents who had more rules and guidelines were more likely to have been grade accelerated in 2002. Similarly, youth with parents who involved children in academic discussions were more likely to be accelerated in the NELS data but not in the ELS data.
Our final set of variables tested whether grade acceleration had been more frequently allowed in some parts of the country. For both time periods, students from the northeastern and west-ern regions were more likely than students from the Midwest to have been grade accelerated. For example, a student from the northeast region had odds of being accelerated that were nearly twice (1.900) the odds of a student from the Midwest being accelerated (see Table 2). However, there were no statistically significant differences between students from the South and the Midwest in this regard.

265Volume 20 ✤ Number 2 ✤ Winter 2009
Wells, Lohman, & Marron
After we obtained the results for predictors of accelera-tion, we examined high school academic performance following grade acceleration during elementary school. For these analyses, we only present the log-odds values. Therefore, the specific value of the coefficient is not immediately interpretable or interesting, but what we discuss for simplicity is the statistical significance (indicated by asterisks) and the positive or negative sign of the coefficient (indicating a positive or negative association). These results are presented in Tables 3 and 4. Grade-accelerated stu-dents were more likely to be in a gifted and talented program during high school and to have improved their achievement test scores more between 8th and 12th grade than students who were older, had similar achievement, and were in the nonaccelerated group in 1992. Grade-accelerated students were also more likely than nonaccelerated peers to score higher on 12th-grade exams, even without controlling for 8th-grade achievement.
When grade-accelerated students were compared to older, similar-achievement, nonaccelerated students in 2004, there were no statistically significant differences (with alpha set at the .05 level) on any of the outcomes that we examined. However, in comparison to classmates who had similar achievement levels
Table 3Logistic Regression Models for Academic and Acceleration
outcomes—NELS (Log odds)AP (SE) HSGT (SE) Grade 12 (SE)
Step 1Accelerated 0.103 (0.226) 1.026* (0.190) 10.278* (2.533)
Step 2Grade 8 -0.017* (0.001) 0.045* (0.002) 0.870* (0.013)Accelerated 0.103 (0.226) 1.026* (0.190) 3.957* (1.240)
Note. The negative result concerning the effect of eighth-grade test scores on participa-tion in an AP program is unexpected. We do not have an immediate explanation for this counterintuitive result. AP = Advanced Placement program; HSGT = high school gifted and talented program; Grade 12 = 12th-grade test score; Grade 8 = 8th-grade test score; Accelerated = grade accelerated.
*p < .001.

266 Journal of Advanced Academics
FACToRS ASSoCIATED WITH GRADE ACCELERATIoN
in 10th grade, grade-accelerated students were marginally more likely to score higher on 12th-grade math achievement tests and also marginally more likely to participate in an International Baccalaureate program.
Discussion
The NELS and ELS data sets used in this study contain 23,341 and 11,344 students, respectively, who were systemati-cally sampled to be representative of the nation. Of necessity, most educational research must be conducted with samples that are either small or not representative of the larger population to which inferences are ultimately made. However, even with samples of this size, the number of students who were acceler-ated was small in the NELS data (N = 336) and perilously small (N = 100) in the ELS data set. Regional talent searches can eas-ily gather much larger samples. This allows greater confidence in the statistical analyses that are performed. However, one cannot easily make inferences about the population of students beyond those who participated in the talent search. Therefore, each kind of study has its advantages and its limitations.
Table 4Logistic Regression Models for Academic and Acceleration
outcomes—ELS (log odds)AP (SE) IB (SE) Grade 12 (SE)
Step 1Accelerated 0.344 (0.290) 0.999* (0.520) 2.292* (0.538)
Step 2Grade 10 0.060** (0.004) -0.020 (0.014) 1.319** (0.007)Accelerateda 0.344 (0.290) 0.999* (0.520) 1.750* (1.019)
Note. AP = Advanced Placement program; HSGT = high school gifted and talented pro-gram; Grade 12 = 12th-grade test score; Grade 10 = 10th-grade test score; Accelerated = grade accelerated.aFor IB, p = 0.055; for Grade 12, p = 0.051.
*p < .10. **p < .001.

267Volume 20 ✤ Number 2 ✤ Winter 2009
Wells, Lohman, & Marron
One of the first results of this study emerged from a com-parison of the number of accelerated students in the two surveys. The fact that the 2002 cohort had a smaller percentage of acceler-ated students than the 1988 cohort suggests that grade accelera-tion declined in popularity over this time. This decrease could be the result of more schools offering programming options such as enrichment activities or single-subject acceleration for gifted stu-dents, or it could represent a shift away from grade acceleration on the part of parents and schools. However, because the percentages of accelerated students in both the NELS and ELS surveys are small, the difference could simply reflect sampling error.
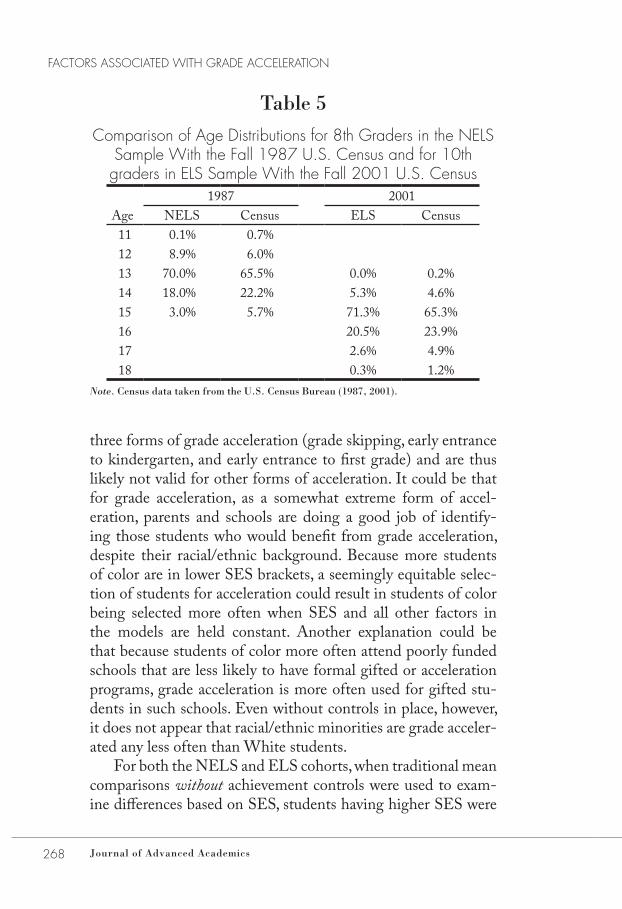
In a rough test of the percentages of young students in our sample, we compared the data sets to census data from the appro-priate years (see Table 5). We could only compare those younger than the “traditional” age because the census data do not allow us to construct a grade-acceleration variable. For 8th graders in fall 1987, 11- and 12-year-olds represented about 9% of the NELS data and about 6.6% of the census data. For 10th graders in fall 2001, 13- and 14-year-olds represented about 5.4% of the ELS data and about 4.7% of the census data. Although this is a crude estimate, it may support the notion that NELS could be over-representing young students. Therefore, the finding that grade acceleration is decreasing should be viewed cautiously.
We also found that girls were more likely than boys to have skipped a grade during elementary school. This could be evi-dence of selection procedures that favor areas in which girls gen-erally show advantages (such as reading, writing, and language usage). It is possible that boys were more likely to have experi-enced single-subject acceleration (e.g., in mathematics) rather than whole-grade acceleration. Another possible explanation is that boys’ maturity and/or behaviors affect their likelihood for being selected to skip grades. More research, both quantitative and qualitative, should attempt to uncover the reasons that girls appear to grade skip more often.
Although the results show that grade acceleration by race/ethnicity may be fairly equitable, they can easily be misinter-preted. In fact, these results are only for a combined measure of
268 Journal of Advanced Academics
Factors associated With Grade acceleration
three forms of grade acceleration (grade skipping, early entrance to kindergarten, and early entrance to first grade) and are thus likely not valid for other forms of acceleration. It could be that for grade acceleration, as a somewhat extreme form of accel-eration, parents and schools are doing a good job of identify-ing those students who would benefit from grade acceleration, despite their racial/ethnic background. Because more students of color are in lower SES brackets, a seemingly equitable selec-tion of students for acceleration could result in students of color being selected more often when SES and all other factors in the models are held constant. Another explanation could be that because students of color more often attend poorly funded schools that are less likely to have formal gifted or acceleration programs, grade acceleration is more often used for gifted stu-dents in such schools. Even without controls in place, however, it does not appear that racial/ethnic minorities are grade acceler-ated any less often than White students.
For both the NELS and ELS cohorts, when traditional mean comparisons without achievement controls were used to exam-ine differences based on SES, students having higher SES were
Table 5comparison of age distributions for 8th Graders in the nels
sample With the Fall 1987 U.s. census and for 10th graders in els sample With the Fall 2001 U.s. census
1987 2001Age NELS Census ELS Census11 0.1% 0.7%12 8.9% 6.0%13 70.0% 65.5% 0.0% 0.2%14 18.0% 22.2% 5.3% 4.6%15 3.0% 5.7% 71.3% 65.3%16 20.5% 23.9%17 2.6% 4.9%18 0.3% 1.2%
Note. Census data taken from the U.S. Census Bureau (1987, 2001).

269Volume 20 ✤ number 2 ✤ Winter 2009
Wells, Lohman, & Marron
more likely to be accelerated. When achievement, race, gender, parental influences, and region were controlled, SES still exerted a positive influence on the likelihood of being accelerated for the NELS cohort, but no longer had a significant effect in the ELS cohort (see Table 2). Whether this outcome shows a more equi-table selection of students by SES in more recent years is uncer-tain. What is certain is that efforts to identify gifted students should continue to be made, even among those disadvantaged by low SES. Future research should further explore the connections of race/ethnicity and social class for all forms of acceleration, including grade acceleration. Unfortunately, SES cannot be well measured without information on family income, parent educa-tion, and parental occupational status. At best, most researchers can assess whether a child qualifies for free and reduced lunch programs—another important advantage of data sets such as NELS.
Parental influences had inconsistent effects in this study. Children with parents who more often discuss academic matters with them may be more likely to have been accelerated, although this conclusion is only supported for the NELS cohort.
The region of the country in which students attend school affects the likelihood that they will be grade accelerated. The coastal regions have more students who have been accelerated in comparison to the Midwest. Possible explanations for this finding may include differences in the average size or composi-tion of coastal versus Midwest schools. Perhaps Midwest schools more often use other acceleration techniques rather than whole-grade acceleration. Importantly, however, the variance explained by all of the factors in this study was relatively small. Therefore, although the results herein are valid and informative, other explanations for grade acceleration are likely to exist and should be explored. One possibility is that our focus should have been on states as a geographic unit rather than regions of the country. State policy on entrance age to kindergarten and grade skip-ping is more likely to determine acceleration than is region of the country because of the state and local level of control over

270 Journal of Advanced Academics
FACToRS ASSoCIATED WITH GRADE ACCELERATIoN
educational policy. A larger sample size of accelerated students would be required to perform analyses at the state level.
When outcomes rather than predictors of grade accelera-tion are considered, it appears that younger grade-accelerated students are more likely to have been in a high school gifted and talented program than similar-achievement classmates. One explanation of this finding is the halo effect, that is, these stu-dents are perceived by teachers or administrators to be gifted because they may be visibly younger or their past skip may be common knowledge. More likely, it reflects the fact that ability tests are age normed. Entrance to many gifted and talented pro-grams is contingent upon IQ scores, which would be higher for younger grade-accelerated children than their older classmates who show similarly high levels of achievement. This explanation is reinforced by the finding that participation in AP programs was not greater for grade-accelerated students than classmates who showed similar levels of achievement. Entrance to AP courses depends on achievement test scores or other indices of accomplishment (e.g., grades) that are grade normed rather than age normed.
This study has explored the predictors of grade acceleration in the United States and how academic acceleration may have an effect upon academic and other outcomes. Importantly, these analyses have allowed comparisons between grade-accelerated students and students with similar achievement—an improve-ment over many past studies. Although valuable, this study is but one step on the path to a better understanding of the predictors and outcomes of grade-acceleration practices. Further research should continue this line of inquiry to explore acceleration prac-tices, how these practices are implemented, and the effects that they have on participating students.
References
Colangelo, N., Assouline, S., & Gross, M. U. M. (2004). A nation deceived: How schools hold back America’s brightest students (Vols.

271Volume 20 ✤ Number 2 ✤ Winter 2009
Wells, Lohman, & Marron
1–2). Iowa City: The University of Iowa, The Connie Belin and Jacqueline N. Blank International Center for Gifted Education and Talent Development.
Donovan, M. S., & Cross, C. T. (Eds.). (2002). Minority students in special and gifted education. Washington, DC: National Academy Press.
Gross, M. U. M. (2003). Exceptionally gifted children. New York: Routledge-Falmer.
Gross, M. U. M., & van Vliet, H. E. (2005). Radical acceleration and early entry to college: A review of the research. Gifted Child Quarterly, 49, 154–171.
King, G., & Zeng, L. (2001). Logistic regression in rare events data. Political Analysis, 9, 137–163.
Konstantopoulos, S., Modi, M., & Hedges, L. V. (2001). Who are America’s gifted? American Journal of Education, 109, 344–382.
Kulik, J. A. (2004). Meta-analytic studies of acceleration. In N. Colangelo, S. Assouline, & M. U. M. Gross (Eds.), A nation deceived: How schools hold back America’s brightest students (Vol. 2, pp. 13–22). Iowa City: The University of Iowa, The Connie Belin & Jacqueline N. Blank International Center for Gifted Education and Talent Development.
Kulik, J. A., & Kulik, C. C. (1992). Meta-analytic findings on grouping programs. Gifted Child Quarterly, 36, 73–77.
National Center for Education Statistics. (2002). Quick guide to using the NELS:88/2000 data: Base-year to fourth follow-up data file user’s manual: Appendix A (NCES 2002–323). Washington, DC: Author. Retrieved from http://nces.ed.gov/surveys/nels88/pdf/QuickGuide.pdf
O’Gorman, T. W., & Woolson, R. F. (1991). Variable selection to discriminate between two groups: Stepwise logistic regression or stepwise discriminant analysis? The American Statistician, 45, 187–193.
Pedhazur, E. J. (1997). Multiple regression in behavioral research: Explanation and prediction (3rd ed.). New York: Wadsworth.
Press, S. J., & Wilson, S. (1978). Choosing between logistic regres-sion and discriminant analysis. Journal of the American Statistical Association, 73, 669–705.
Pressey, S. L. (1949). Educational acceleration: Appraisals and basic problems (Ohio State University Studies, Bureau of Educational Research Monograph No. 31). Columbus: Ohio State University Press.

272 Journal of Advanced Academics
FACToRS ASSoCIATED WITH GRADE ACCELERATIoN
Rogers, K. B. (1992). A best-evidence synthesis of the research on accel-eration options for gifted learners. In N. Colangelo, S. G. Assouline, & D. L. Ambroson (Eds.), Talent development: Proceedings from the 1991 Henry B. and Jocelyn Wallace National Research Symposium on Talent Development (pp. 406–409). Unionville, NY: Trillium.
Rogers, K. B. (2002). Re-forming gifted education: Matching the program to the child. Scottsdale, AZ: Great Potential Press.
Rogers, K. B. (2004). The academic effects of acceleration. In N. Colangelo, S. Assouline, & M. U. M. Gross (Eds.), A nation deceived: How schools hold back America’s brightest students (Vol. 2, pp. 47–57). Iowa City: The University of Iowa, The Connie Belin & Jacqueline N. Blank International Center for Gifted Education and Talent Development.
Sayler, M. F., & Brookshire, W. K. (1993). Social, emotional, and behav-ioral adjustment of accelerated students, students in gifted classes, and regular students in eighth grade. Gifted Child Quarterly, 37, 150–154.
Southern, W. T., & Jones, E. D. (2004). Types of acceleration: Dimensions and issues. In N. Colangelo, S. Assouline, & M. U. M. Gross (Eds.), A nation deceived: How schools hold back America’s brightest students (Vol. 2, pp. 5–12). Iowa City: The University of Iowa, The Connie Belin & Jacqueline N. Blank International Center for Gifted Education and Talent Development.
Southern, W. T., Jones, E. D., & Fiscus, E. D. (1989). Practitioner objections to the academic acceleration of gifted children. Gifted Child Quarterly, 33, 29–35.
Swiatek, M. A., & Benbow, C. P. (1991). Ten-year longitudinal follow-up of ability-matched accelerated and unaccelerated gifted stu-dents. Journal of Educational Psychology, 83, 528–538.
U.S. Census Bureau. (1987). Table 22. Single grade of enrollment and high school graduation status for people 3 years old and over, by age (single years for 3 to 24 years), sex, race, and Hispanic origin: October 1987. Retrieved from http://www.census.gov/population/socdemo/school/p20-443/tab22.pdf
U.S. Census Bureau. (2001). Table 2. Single grade of enrollment and high school graduation status for people 3 years old and over, by age (single years for 3 to 24 years), sex, race, and Hispanic origin: October 2001. Retrieved from http://www.census.gov/population/socdemo/school/cps2001/tab02.pdf
Vialle, W., Ashton, T., Carlon, G., & Rankin, F. (2001). Acceleration: A coat of many colours. Roeper Review, 24, 14–19.

273Volume 20 ✤ Number 2 ✤ Winter 2009
Wells, Lohman, & Marron
Winner, E. (1996). Gifted children: Myths and realities. New York: Basic Books.