Embed Size (px)
Citation preview
Morrison and Mason
So What is a Low Cost Carrier?: Working paper
Working Paper 2007
William G. Morrison
Associate Professor, School of Business and Economics Wilfrid Laurier University, Waterloo, Canada
Keith J. Mason Senior Lecturer, Dept of Air Transport
Cranfield University, England, UK [email protected]
October 2007
Copyright © 2007
What is a low cost carrier?

ABSTRACT
Meaningful definitions of and distinctions between airline business models are not easily
formulated, particularly when one considers the extremely dynamic nature of the
industry. The paper outlines and discusses common business model descriptors that are
applied to airlines. We outline a product and organizational architecture (POA) approach
to classifying and relating key elements of airline business models. Using indices to
create benchmark metrics, the POA model is used to examine and compare six European
airlines. The analysis shows that there are important differences in the business models
of airlines who are all commonly referred to as ‘low cost carriers’. Our paper
demonstrates how differences in the business models adopted by the different airlines
contribute to their relative profitability.
Keywords: Low cost carrier; product and organizational architecture; airline business
models.
Morrison and Mason
1
1. Introduction
In 1979, Southwest Airlines developed the first alternative business model to
successfully compete with the hub-and-spoke network carriers in the US domestic
market. However it was not until after 1996, when the Irish airline Ryanair reinvented
itself as a European version of Southwest that the term ‘low-cost carrier’ (LCC) emerged
and became embedded in academic literature and popular culture.1
Aviation and network carriers2 in particular have suffered an unprecedented series of
negative demand shocks in recent years: the macroeconomic slump in 2000, 9-11,
SARS, the Iraq conflict, the war on terror and oil price hikes. Yet, the industry was
already in the midst of an evolution in its structure by the turn of the century.
Deregulation of air travel in Europe in the late 1990’s and globalization more generally
contributed to the emergence of an increasing number of airlines with business models
that seem to fundamentally differ from those of network carrier incumbents. To the
extent that the business strategies of these airlines have been viewed as derivative of
the Southwest Airlines model, they have become known under the common rubric ‘low
cost carrier’ (LCC). For example, Ito and Lee (2002) assign US airlines to either be a LCC
or a “major network carrier” 3 but do not define what an LCC is. The airlines they include
as LCCs are Southwest; JetBlue; Frontier; ATA and Air Tran (combined with ValueJet),
while the airlines classified as major network carriers are Alaska; America West;
American; Continental; Delta; Northwest; TWA; United and US Airways.
More recently other terms have been used such as ‘low fares airlines’ and ‘value-based
airlines’ however there seems to be no consistent vision of how the elements of airline
business models usefully distinguish one airline from another. Is there in fact a single
business model or set of strategies that are well described by the term ‘low-cost carrier’?
Without the means to unambiguously describe what it is that airlines are doing, we are
positioned poorly to obtain insights into questions of market structure and competition,
efficiency, and government regulation. In this paper we unravel how the various
elements of airline business models interrelate to define an overall strategy, using the
product and organizational architecture (POA) model developed in Morrison and Mason
(2007). Section 2 provides a discussion of some potential descriptors of air carriers and
the implied elements of business strategy that follow from them. In section 3, we
1 Other airlines often referred to as ‘low-cost carriers’ include but are not limited to; Westjet in Canada; Virgin Blue in Australia; Hapag Lloyd and German Wings in Germany; Flybe and BMIbaby in the UK. 2 In this paper we take „network“ carriers to be airlines that tend to have large hub and spoke networks, and fly a combination of short haul and long haul domestic and international routes, e.g. BA, American Airlines, Air France-KLM, etc. 3 Ito and Lee p3.
Morrison and Mason
2
outline POA analysis and its application to airline business models, then in section 4, we
examine business strategies of six airlines (all commonly referred to as ‘low cost
carriers’), using publicly available data to construct indices that relate to the components
of the POA model. A brief conclusion is offered in section 5.
2. Airline business model descriptors
Consider the following airline business model designations:
1. Non-network carrier: Any airline that is not a traditional ‘network’ carrier. 2. Low-cost carrier: A carrier for which the single most important objective is the
attainment of the lowest possible cost structure. 3. Low-fare airline: A carrier that attempts to systematically offer lower fares by
offering less convenience (through use of secondary airports) than network carriers.
4. Value-based airline: A carrier that has a low-cost structure and a pricing structure aimed at competing in markets where demand supports a premium for convenience (through use of primary airports).
Descriptor1 indirectly defines an airline business model by stating what it is not and this
may be appropriate if the only goal is to distinguish airlines that have deviated from the
traditional strategy and structure of network carriers. However, this creates another
question: what exactly is a network carrier? Network carriers (NCs) are usually
characterized as large airline companies that fly both domestic and international routes
combining short-haul (feeder) and long-haul (connecter) links in a hub-and-spoke
network. The network structure enables NCs to take advantage of economies of density
and to charge for the provision of a service bundle that includes the provision of
connectivity through their hubs and the provision of convenience elements such as
baggage transfers to connecting flights. NCs have also traditionally utilized complex yield
management systems and historically sold the bulk of their tickets through travel
agencies. Finally, NCs are usually characterized as creating different service bundles
within each flight and have designed their services to capture the preferences and
willingness-to-pay of business travellers.
The problem with descriptor1 is that it does not weight the elements of the NC definition
in terms of importance in the business model. If an airline adopts all except one
element of the NC model, should it be viewed as an NC or as an non-network carrier? To
be analytically useful, a business model definition should apply to a stable set of
characteristics.

Morrison and Mason
3
Another problem is that many ‘network carriers’ appear to be in the process of evolving
towards the business models of non-network carriers, a point emphasized in a recent US
aviation competition brief:
“…the service quality differential between low fare carriers and legacy [network] carriers has narrowed as certain low-fare carriers have, to various degrees, improved their product by flying newer planes, installing premium cabins, initiating or improving frequent flyer programs, offering improved in-flight amenities such as live television, offering less restrictive rules for changing tickets and increasing both the density or scope of their networks. Meanwhile, in their efforts to reduce their costs, many legacy [network] carriers have cut back on some of the features that have traditionally differentiated them from low-fare carriers, such as eliminating complementary food service, reducing capacity and frequency thereby narrowing the convenience differential they offer travelers, and substituting smaller regional jet aircraft for larger mainline aircraft.”4
Rather than a stable set of business model characteristics, the quote suggests that a
dynamic evolution is underway – one in which both NC and Non-NC models are changing
and in some ways becoming more similar. Is it possible that NC and NNC models will
eventually converge on a single (dominant) organizational structure and business
strategy?
Focusing on costs
Rather than defining carriers in terms of what they are not, a more natural focus would
be to define them in terms of what they are, and descriptor 2 suggests a focus (perhaps
relative to NCs) on achieving low costs. This approach is evident in a recent Economist
magazine article, which describes the emergence of low cost carriers (LCCs) in the
following way:
“When low-cost airlines were first launched in Europe after the liberalization of Europe's domestic airline market was completed in 1997, Ryanair and easyJet, the pioneers, explicitly and expertly mimicked American budget airlines such as Southwest and ValuJet (now Air Tran). The essential elements of the business model were: a single-type fleet of planes; fast turn-rounds; use of cheap secondary airports; no frills—definitely no moisturizer in the toilets; and enticingly low fares that rose only as a flight filled up.” 5
The underlying notion of descriptor2 is that when an airline makes as its central objective
the attainment of the lowest possible cost structure, other aspects of the business model
(pricing, product development, finance, marketing, strategy etc.) are formed as a
consequence. One might argue that this most closely describes the approach taken by
Ryanair. Indeed, Ryanair CEO Michael O’Leary states in Ryanair’s 2002 financial
statements:
“Ryanair’s immediate success in Germany highlights yet again the consumer behaviour law already established by Southwest Airlines and
4 Office of Aviation and International Affairs (2002), P1 5 Economist (2004).
Morrison and Mason
4
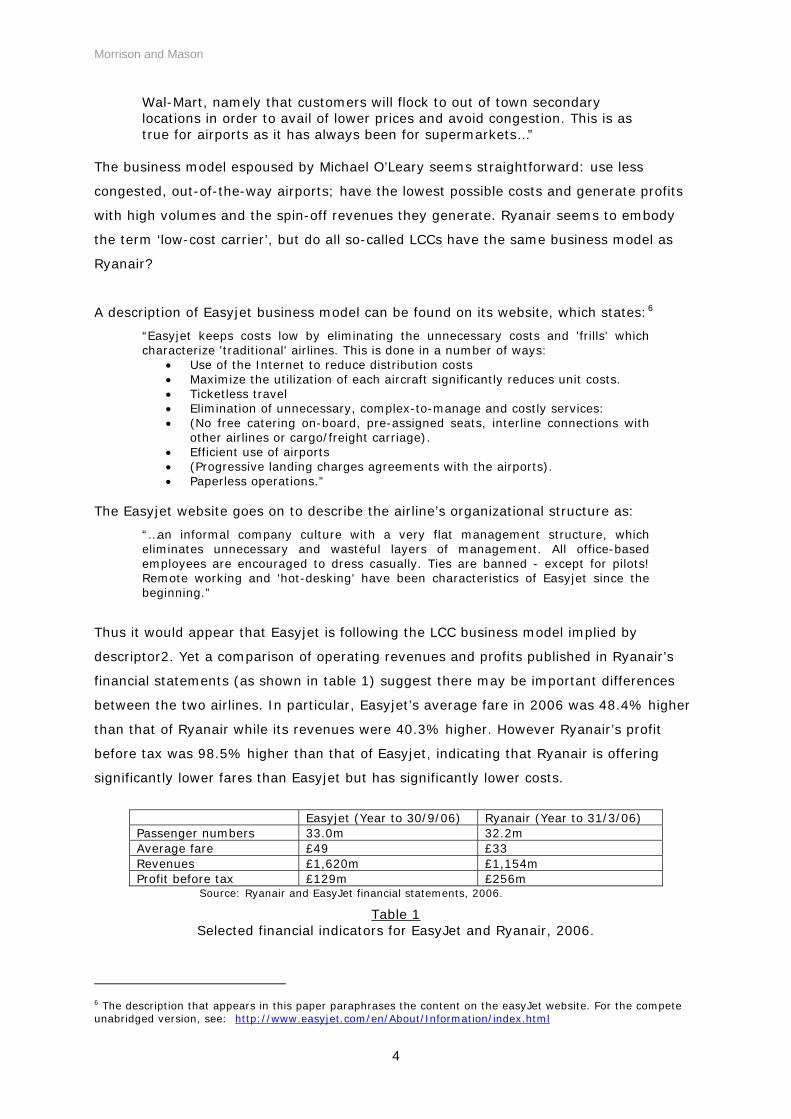
Wal-Mart, namely that customers will flock to out of town secondary locations in order to avail of lower prices and avoid congestion. This is as true for airports as it has always been for supermarkets…”
The business model espoused by Michael O’Leary seems straightforward: use less
congested, out-of-the-way airports; have the lowest possible costs and generate profits
with high volumes and the spin-off revenues they generate. Ryanair seems to embody
the term ‘low-cost carrier’, but do all so-called LCCs have the same business model as
Ryanair?
A description of Easyjet business model can be found on its website, which states:6
“Easyjet keeps costs low by eliminating the unnecessary costs and 'frills' which characterize 'traditional' airlines. This is done in a number of ways:
• Use of the Internet to reduce distribution costs • Maximize the utilization of each aircraft significantly reduces unit costs. • Ticketless travel • Elimination of unnecessary, complex-to-manage and costly services: • (No free catering on-board, pre-assigned seats, interline connections with
other airlines or cargo/freight carriage). • Efficient use of airports • (Progressive landing charges agreements with the airports). • Paperless operations.”
The Easyjet website goes on to describe the airline’s organizational structure as:
“…an informal company culture with a very flat management structure, which eliminates unnecessary and wasteful layers of management. All office-based employees are encouraged to dress casually. Ties are banned - except for pilots! Remote working and 'hot-desking' have been characteristics of Easyjet since the beginning.”
Thus it would appear that Easyjet is following the LCC business model implied by
descriptor2. Yet a comparison of operating revenues and profits published in Ryanair’s
financial statements (as shown in table 1) suggest there may be important differences
between the two airlines. In particular, Easyjet’s average fare in 2006 was 48.4% higher
than that of Ryanair while its revenues were 40.3% higher. However Ryanair’s profit
before tax was 98.5% higher than that of Easyjet, indicating that Ryanair is offering
significantly lower fares than Easyjet but has significantly lower costs.
Easyjet (Year to 30/9/06) Ryanair (Year to 31/3/06) Passenger numbers 33.0m 32.2m Average fare £49 £33 Revenues £1,620m £1,154m Profit before tax £129m £256m
Source: Ryanair and EasyJet financial statements, 2006.
Table 1 Selected financial indicators for EasyJet and Ryanair, 2006.
6 The description that appears in this paper paraphrases the content on the easyJet website. For the compete unabridged version, see: http://www.easyjet.com/en/About/Information/index.html

Morrison and Mason
5
One interpretation of this data is that Easyjet has not been as successful in implementing
an LCC strategy as Ryanair; however another interpretation is that Easyjet is following a
different business model in which costs are a focus but not the driver of their overall
strategy. In one interpretation, both airlines are LCCs, in the other Ryanair is an LCC but
Easyjet is not.
Low fares
Descriptor3 shifts the emphasis from low costs to low fares. The term ‘low fare carrier’
or ‘low fare airline’ appears to have become the definition of choice for airlines often
referred to as LCCs. This could be a strategic choice designed to avoid a possible
association of low costs with ‘cutting corners’ and low quality in the minds of travellers or
policy-makers. Nevertheless, the formation of the European Low Fares Airline Association
(ELFAA) as a lobby group in Brussels has created a self-selection mechanism through
which members of ELFAA are airlines who wish to be regarded as ‘low fare’ carriers.
Table 2 indicates the current airline members of ELFAA.
Of course, the ability to sustain lower average fares relative to NCs is in part related to
an airline’s costs, which suggests that cost efficiency is a necessary condition for a
business strategy based on low fares. What is the ‘low fares model’? An ELFAA position
paper (2004) states that the low fare model consists of the following seven elements:
1. Operating from mostly secondary underutilized regional airports. 2. Fast turnarounds. 3. Direct point-to-point flights, no transfers, short-haul routes. 4. Standardized fleet (only one aircraft type) with higher seating density 5. Distribution primarily through direct channels (internet, call centres). 6. No frills, extras paid for (e.g. catering excess baggage). 7. Highly incentivised workforce (variable portion of salary up to 40%).7
ELFAA Members
EasyJet (United Kingdom)
Sky Europe (Slovakia)
Flybe (United Kingdom)
Sterling (Denmark)
Myair.com (Italy)
Sverige Flyg (Sweden)
Norwegian Air Shuttle (Norway)
transavia.com (The Netherlands)
Ryanair (Ireland)
Wizz Air (Hungary)
Source: http://www.elfaa.com
Table 2 Members of the European Low Fares Airline Association, August 2007
7 ELFFAA (2004), p

Morrison and Mason
6
Value-based Airlines
One important differentiating factor between airlines is the desire to either use or avoid
the use of primary airports. Easyjet offers direct flights between London Gatwick and
Toulouse Blagnac Airport (which is a fifteen minute drive from downtown Toulouse) in
direct competition with British Airways. If Easyjet prices are lower than those of British
Airways between London and Toulouse, this might seem to qualify the airline as a low
fares carrier, when measured by relative prices. By comparison, Ryanair’s service
between London and the Toulouse area connects London Stansted with Carcassonne – a
town that is some 90 km south-east of Toulouse at fares that are lower than those of
Easyjet’s flights to Blagnac. Thus, if using subsidiary airports is a necessary condition of
being a low-fares airline, Easyjet may be more appropriately described as a ‘value-based
carrier’ as defined by descriptor4. The term ‘value-based carrier’ appears to have
originated in Australia in papers and submissions prepared by the consulting group
NECG. Ergas and Findlay (2004) state that value-based airlines (VBAs):
“…differ in the extent to which they seek to attract high yielding business travelers. VBAs typically adopt different business and marketing strategies relative to a rival FSC, including with respect to frequencies and lounge facilities, for whom attracting business travellers is particularly crucial. This is not to imply that VBAs do not target business travellers: they must to be viable. But the approach they use to doing so can and usually does differ from that employed by full service airlines.”
More specifically, Ergas and Findlay argue that VBAs focus on offering a smaller bundle of
core ‘standard feature’ services compared with traditional NCs. Thus Easyjet may charge
a price premium by servicing Toulouse Blagnac, and although its cost strategy may be
focused upon the attainment of cost efficiencies, it may pay more in airport charges in
order to offer convenience.
Can NC’s become LCCs?
Descriptors 2-4 do not explicitly exclude the possibility of a network carrier being a low
cost or low fare carrier. Consequently, a question arises as to whether this is possible –
Are low cost, low fare or value-based models the exclusive domain of non-network
carriers?
Consider the service offered by Air France and Easyjet between Toulouse Blagnac (TLS)
and Paris Orly (ORY); a flight commonly referred to in France as the ‘navette’ or shuttle.
Table 3 provides a comparison of the service offered by Easyjet and Air France on this
city pair market, for a return flight booked on August 18th 2007, departing TLS on
September 19th and returning on September 26th. Since the possibilities of connecting
flights beyond Orly exists are limited this city pair is essentially a short-haul, point-to-
point market.8 Both airlines utilize similar aircraft and since Toulouse airport is not
8 The vast majority Air France connecting flights are operated from Paris CDG or Amsterdam Schiphol.

Morrison and Mason
7
congested, the average turnaround times for either Air France or Easyjet in Toulouse is
approximately 25 minutes. Each airline has similar punctuality records for ‘navette’ short-
haul flights and it is likely that their punctuality records in the TLS-ORY market are even
closer.
Both airlines sell fares for this flight directly on their website using secure credit card
payment and electronic ticketing. As table 3 indicates, a passenger looking for the
cheapest economy class fare with a preference for some choice over seat allocation and
two pieces of hold baggage faces similar prices from each airline with the Air France price
just €13.77 higher than Easyjet.
Easyjet Air France
Airfare Economy: €97.989 Business: not offered
€111.7510 €476.75
Turnaround time at TLS 25mins 25mins
Punctuality (on time within 15 mins)11
77% (August 2007)
84.4% (July 2007, for ‘Navette’
flights)
Equipment A31912 A319/A320
Seating configuration Economy: 156 Business: 0
Economy: 96 Business: 46
Pre-assigned seats No Yes
Flights per day 4 17
Complementary on-board services No Yes
Frequent flier program No Yes
Table 3 Service from TLS to ORY for Easyjet and Air France, August 2007.
Based on the definition provided by ELFAA, one could argue that Air France has adopted
elements 1, 2, 3, and 5 of the ‘low fares model’. One could also argue that while Air
France employs a mixed fleet over its entire network, it exclusively employs Airbus
A319/A320 equipment in this market and therefore have also adopted element 4 of the
low fares model. Table 3 also indicates some important differences in the service
offerings of these competitors. Air France offers complementary newspapers plus a
9 This price is calculated on the assumption that the booking made using a credit card and that the passenger wishes to check two pieces of baggage in the hold. Passengers willing to be called last for boarding and checking only one piece of hold baggage would pay the lower price of €77.48. 10 This price includes booking charges and allowance for two pieces of hold baggage. 11 Source: airline websites 12 Easyjet also operates B737 aircraft which have a slightly lower capacity of 149 seats.

Morrison and Mason
8
complementary drink and snack, and has a frequent flier program. By comparison,
Easyjet does not have a loyalty program, does not offer newspapers and sells beverages
and snacks for an additional charge. In addition Air France offers a much greater
frequency of flights between Toulouse and Paris, with at least 16 flights per day
compared with four flights for Easyjet. In addition the seating configuration for Air France
shows a focus on attracting business travellers with a approximately one third of its cabin
allocated to business class seats, at a fare which is 426% higher than the lowest cost
economy fare. If one expands the comparison beyond a single city pair market to the
entire operations of an airline the distinction in business focus between Air France and
Easyjet become more acute, since Air France overall has a large mixed fleet and operates
a complex hub-and-spoke network, offering connectivity between many cities in both
short and long-haul markets.
Consider another price comparison between airlines Ryanair and SN Brussels. SN
Brussels operates a flight from Toulouse Blagnac to Brussels Zavetem Airport, while
Ryanair operates a flight between Carcassonne, France and Charleroi Sud, Belgium.
Table 4 presents details of trips booked with each airline, via the internet on September
19 2007 for a round-trip flight departing October 17th (evening) or 18th (morning) and
returning October 26. As already stated, Carcassonne is located approximately 90km
from Toulouse, while Charleroi is located approximately 46KM from Brussels.
Total trip cost components Airline: Ryanair CCF-CRL
Airline: SN Brussels TLS-BRU
Flights per day
1 3
Airfare (1 adult) Includes: taxes, online booking fee Excludes: cancellation/travel insurance
€65.74 Flight duration = 1:35
€163.08 Flight duration = 1:45
Ground transportation from Toulouse (city) to airport (return)
€36.60 Trip duration = 1:25
€6.00 Trip duration = 0:20.
Ground transportation from airport to downtown Brussels (return)
€20.00 Bus trip duration – 1:00
€4.80 Train trip duration = 20 min.
Hold baggage charge (1 bag) €12.00 (1 checked bag @32kg)
€0.00 (1 bag checked @20kg )
Total trip cost
€134.34 €173.88
Total travel time (flight +ground transportation duration)
4:00 2:25
Table 4 Travel from Toulouse to Brussels:
Comparing Ryanair and SN Brussels: September 2007.
Morrison and Mason
9
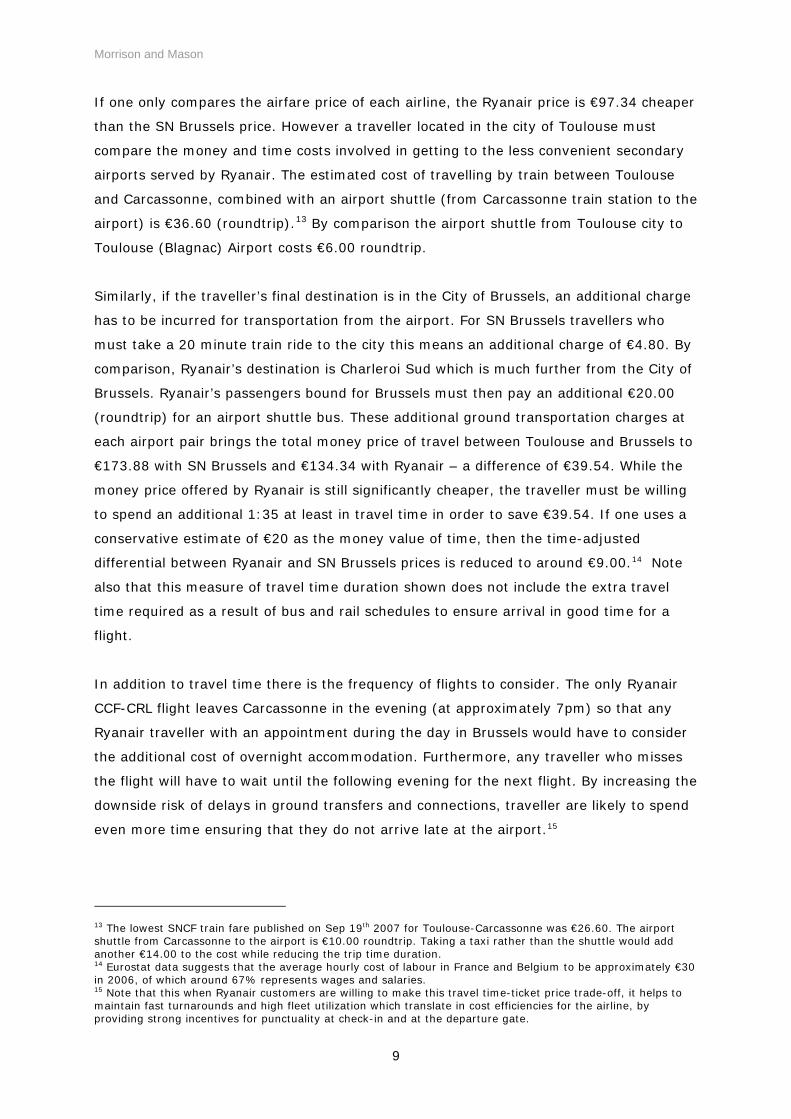
If one only compares the airfare price of each airline, the Ryanair price is €97.34 cheaper
than the SN Brussels price. However a traveller located in the city of Toulouse must
compare the money and time costs involved in getting to the less convenient secondary
airports served by Ryanair. The estimated cost of travelling by train between Toulouse
and Carcassonne, combined with an airport shuttle (from Carcassonne train station to the
airport) is €36.60 (roundtrip).13 By comparison the airport shuttle from Toulouse city to
Toulouse (Blagnac) Airport costs €6.00 roundtrip.
Similarly, if the traveller’s final destination is in the City of Brussels, an additional charge
has to be incurred for transportation from the airport. For SN Brussels travellers who
must take a 20 minute train ride to the city this means an additional charge of €4.80. By
comparison, Ryanair’s destination is Charleroi Sud which is much further from the City of
Brussels. Ryanair’s passengers bound for Brussels must then pay an additional €20.00
(roundtrip) for an airport shuttle bus. These additional ground transportation charges at
each airport pair brings the total money price of travel between Toulouse and Brussels to
€173.88 with SN Brussels and €134.34 with Ryanair – a difference of €39.54. While the
money price offered by Ryanair is still significantly cheaper, the traveller must be willing
to spend an additional 1:35 at least in travel time in order to save €39.54. If one uses a
conservative estimate of €20 as the money value of time, then the time-adjusted
differential between Ryanair and SN Brussels prices is reduced to around €9.00.14 Note
also that this measure of travel time duration shown does not include the extra travel
time required as a result of bus and rail schedules to ensure arrival in good time for a
flight.
In addition to travel time there is the frequency of flights to consider. The only Ryanair
CCF-CRL flight leaves Carcassonne in the evening (at approximately 7pm) so that any
Ryanair traveller with an appointment during the day in Brussels would have to consider
the additional cost of overnight accommodation. Furthermore, any traveller who misses
the flight will have to wait until the following evening for the next flight. By increasing the
downside risk of delays in ground transfers and connections, traveller are likely to spend
even more time ensuring that they do not arrive late at the airport.15
13 The lowest SNCF train fare published on Sep 19th 2007 for Toulouse-Carcassonne was €26.60. The airport shuttle from Carcassonne to the airport is €10.00 roundtrip. Taking a taxi rather than the shuttle would add another €14.00 to the cost while reducing the trip time duration. 14 Eurostat data suggests that the average hourly cost of labour in France and Belgium to be approximately €30 in 2006, of which around 67% represents wages and salaries. 15 Note that this when Ryanair customers are willing to make this travel time-ticket price trade-off, it helps to maintain fast turnarounds and high fleet utilization which translate in cost efficiencies for the airline, by providing strong incentives for punctuality at check-in and at the departure gate.
Morrison and Mason
10
The above example illustrates that if we use a delivered (total travel cost) price rather
than a more narrowly defined airfare, we can observe two airlines with similar delivered
prices but different focus in terms of the types of airports they serve. If SN Brussels has
a similar delivered price to Ryanair, should SN Brussels which operates a mixed fleet -
flying regional jets between Brussels and Toulouse and larger wide body aircraft on long
haul flights - be classified as a low fares airline or a value-based airline?
It seems clear from the above discussion of airline business model definitions that no
single descriptor seems to adequately capture the common and differentiating elements
in the structure, focus and strategies of airline business models. However the product
and organizational architecture (POA) model developed in Morrison and Mason (2007)
offers a potentially consistent way of measuring and comparing airline business models.
The next section provides a brief overview of the POA conceptual model and provides an
illustration of how the model can be empirically applied using publicly available airline
data.
3. Product and organizational architecture
Synthesizing complex airline business models requires identification of key stylized
components of product architecture – the service quality elements that define the
product relative to consumer preferences, and organizational architecture – the vertical
structure, production and distribution choices of the airline. This product and
organizational architecture (POA) approach as developed in Morrison and Mason (2007)
can be applied directly to airline business models. Figure 1 illustrates the general POA
approach to defining a firm’s business model and competitive environment. On the one
hand, product architecture gives rise to a core product bundle that positions the firm in
terms of consumer preferences (benefit drivers) and the competitive environment (as
defined by the market structure). On the other hand, the product design also implies a
choice set for inputs and possible organizational structures (cost drivers) which define
the firm’s cost position. Taken together, both product and organizational architecture
contribute to the creation and sustainability of profits.
Applying the POA model to airlines
Figure 2 shows an application of the POA approach to airline business models. Product
architecture is separated into three elements of service quality: connectivity,
convenience and comfort. These three elements have the property that they follow a
general ordering with respect to the degree with which costs are fixed or ‘avoidable’. In
Morrison and Mason
11
particular, connectivity implies a choice of network design that distinguishes hub-and-
spoke (airline-supplied connectivity) from point-to-point (passenger-supplied) networks.
This is perhaps the most important core element that can distinguish between different
airline business models.
Some of the elements of convenience are linked to network structure decisions, but
nevertheless imply a lesser degree of fixed investment for some airlines. In particular,
use of primary airports and ‘checked-through’ baggage services tend to follow from the
choice of a hub-and-spoke network, however an airline operating a point-point network
may also choose to offer convenience through use of a primary airport.
Elements of comfort in determining the quality of service are to some degree more
variable than the other two categories, yet these elements will vary in importance for the
overall architecture of the product. In some markets elements of comfort might be
regarded as ‘frills’ while in other markets the same elements could be regarded as more
essential; the offering of in-flight meals on short haul versus long-haul flights for
example. The 3Cs thus define the product in relation to consumer preferences, which
impacts market demand within the competitive environment. However the 3Cs also
impact the magnitude and avoidability of production costs which in turn affects pricing
flexibility and the airline’s competitive position.
Organizational architecture
Within the organizational architecture the size and composition of the fleet along with the
organizational design are elements that follow on primarily from the product architecture.
In particular, the decision over network structure is key because the complexity of
operating a hub-and-spoke network requires certain functions relating to coordination,
yield management etc which implies a more vertically integrated organization. In
contrast, an airline operating a point-to-point network has relatively more opportunities
to form a ‘nexus of contracts’ organizational structure in which many functions are
contracted out.
In terms of carriage, all airlines now take advantage of internet based booking systems,
yet even here point-to-point network carriers can offer more simplicity in the process
with implications for both cost and benefit drivers

Morrison and Mason
12
Source: Morrison and Mason (2007)
Figure 1 General product and organizational architecture of a firm
Component choice
Product Architecture
Organizational Architecture
Operating costs
Product position
Pricing strategy
In-house Contracted out
Core bundle design
Input choices
Profitability
Market structure
Revenues
Vertical boundaries
Sunk or unavoidable costs Avoidable costs

Morrison and Mason
13
Source: Morrison and Mason (2007)
Figure 2 Schemata of Product and Organizational Architecture of Airlines
COMPONENT CHOICE
INPUT CHOICES
Connectivity Convenience Comfort
Product Architecture
Hub-and-spoke network
Point-to-point network Punctuality
Airport location
On-board service quality
Flight frequency Seating comfort
Baggage service Airport services
Fleet size
Fleet mix Internet booking
Travel agency
Core bundle design
Organizational Architecture
Dist. / Sales Aircraft IT Labour
Admin staff
Airport staff
Cabin crew
Pilots
Operating costs
Product position
Pricing
Market structure
Operating profits
Yield management
Maintenance
Airports
Airport location
Airport market power
Operating Revenues
On-board services
Market size
Market concentration
Number of competitors
Vertical boundaries
Sunk or unavoidable costs Avoidable costs

Morrison and Mason 14
14
Using indices to form benchmark metrics in the POA model16
To apply the POA model to the elements of airline business models identified in figure 2,
a number of separate indices have been developed and then formed into more aggregate
indexes. By constructing indices in this way, the interaction between the different
elements in the business model and their importance to the overall performance of an
airline can be more easily identified.
Indices were developed for each of the following areas:
• Profitability • Cost drivers • Revenue achievement • Connectivity • Convenience • Comfort • Distribution/Sales • Aircraft productivity • Labour productivity • Airports Attractiveness • Market Structure
Profitability, costs and revenues.
A profitability index was constructed by simply using the operating ratio of the carriers in
the benchmark group. While profitability identifies the overall success of the business,
an airline’s unit cost [operating cost per average seat kilometer (ASK)] summarizes the
various organizational architecture decisions made. It summarises the key cost values for
the airline. This index is therefore a summary of the carriers’ strategies with respect of
IT, distribution and sales, aircraft, labour, and the airports served. Each of these items
(with the exception of IT17) is treated with a separate index as detailed below.
The revenue index incorporates a number of benchmarks. The prime measure is yield
per RPK. Also included is operating revenue per sector (GBP). This will highlight
differences between the large aircraft/high density aircraft and the smaller aircraft/higher
yield operators. The final benchmark item included here is a simple measure of average
fare paid per passenger (this incorporates ancillary revenues where these are reported
separately).
16 A more complete discussion of the methodology used to develop our indices and the interrelationship
between the individual indexes can be found in Morrison and Mason (2007). 17 The IT infrastructure within an airline can have significant influence over that business’ costs. Unfortuanately, IT costs are not routinely reported in airline annual reports and therefore a separate IT index has not been possible to construct.
Morrison and Mason
15
Connectivity, convenience and comfort
While some low cost airlines seem to pursue a strategy of serving a large number of
small markets, others seek to usurp the short haul networks of traditional network
carriers. Also, while some airlines have quite a dense network from their main base, the
coverage of the network elsewhere may be quite limited and therefore the number of
departure per airport per day indicates the coverage of the network. Therefore, the
connectivity index seeks to account for network density. It is calculated from four
benchmark statistics: the number of departures per airport per day; the average
frequencies per route per week; the number of routes offered and the total number of
destinations available at the airport.
Along with network density some airlines have positioned themselves to provide a more
convenient service by offering a higher frequency, using airports either better located or
with better surface transport links than those offered by secondary airports, also a
punctual service, and offering improved baggage services. Consequently the following
benchmarks were used to create a convenience index; the average weekly frequency per
route18, the weighted average distance of the airport served to the city centre; the
proportion of flights offered from primary airports, the proportion of flights departed on
within 15 minutes, and the Skytrax19 baggage score.
The comfort index is composed of measures for seat pitch and width for each airline
along with the average number of passengers per flight (fewer passengers per flight are
assumed to be more comfortable than more)20. The final variable included in the comfort
index is the number of passengers per cabin crew member.
Distribution and Sales
Low cost airlines have been at the forefront of using the internet to reduce their
distribution costs. Two variables are included in this index; the percentage of sales made
via the airline’s online reservation system; and the airline’s cost per passenger of
ticketing, sales and promotion (TSP).
Aircraft and Labour Productivity
Low cost carriers tend to work their aircraft assets hard to spread the cost of the aircraft
across as wide a number of passengers as possible. Therefore the aircraft productivity
18 While this benchmark statistic is also included in the connectivity index it is also a clear measure of convenience. 19 Skytrax ratings for baggage handling for General handling, on-board baggage policy, excess baggage policy were aggregated and used fort his rating. 20 Although it is recognised that, depending on the type of aircraft equipment, smaller aircraft are not necessarily more comfortable for passengers than larger aircraft.
Morrison and Mason
16
index captures both the daily utilisation of the aircraft and also the number of sectors
each aircraft operates a day. While average sector length will affect each airline’s ability
to improve utilisation and the number of sectors performed a day per aircraft it is not
included in this index as it can then be used to assess sector length impacts on the
various performance indices. The uniformity of the fleet has often been highlighted as
one of the key cost saving items for low cost airlines. A third variable in this index is
then the percentage that the most populous aircraft type/mark accounts for in the fleet.
The labour productivity index has several components and summarises the airline’s
employees productivity in relation to the number of passengers carried and ASKs along
with the cost of personnel per ASK. One area where low cost carriers have been able to
reduce costs is in the reduction of non-flying employees so a higher proportion of flying
employees is likely to increase employee productivity and this ratio is also included in
this index. To recognize and try to reflect the effect of outsourcing that might otherwise
inflate the employees productivity ratings, the passengers per employee ratio has been
deflated by the percentage of total costs are accounted for by employee costs. This
proportion may be considered a proxy measure for amount of outsourcing that a
company does. If the proportion of employee costs over total costs is small then it is
more likely that the airline outsourced operational activities, whereas an airline with a
higher proportion of employee costs over total costs are likely to have undertaken more
operational activities in-house. While we recognize the potential flaws using this ratio to
adjust the benchmark labour productivity variable (i.e. one airline pays considerably
lower wages), we would also argue that outsourcing is a significant part of the low cost
model. Yet the degree to which an airline outsources is very difficult to measure from
published sources, therefore we are left with this proxy for outsourcing as a deflator on
labour productivity.
Airport Attractiveness
One of the key sources of lower costs for some LCCs has been in airport charges. This
index attempts to rate the airlines’ success at managing this cost item. Four benchmark
variables are included. Firstly the airport/en-route costs per passenger is calculated.
Secondly, smaller airports are likely to offer lower landing fees and thus a variable is
included for the weighted average annual passengers at the airport. Where an LCC
operates to an airport with higher number of network carriers present the opportunity to
negotiate lower fares is reduced, and thus the third variable included is the weighted
average number of network carriers at the airports served. Finally the percent of city
pair routes that are monopolies for the LCC indicates provides a measure of how
important the airline is to the airport and thus a measure of negotiating power.

Morrison and Mason
17
Market Structure
The final index provides a measure of the market structures that each airline operates
within. The median and average HHI scores are calculated across each airline’s network.
This index also incorporates the average number of competitors per route each airline
faces, the average city size served and the average share of capacity (by seats) per
route.
4. What is a (successful) low cost carrier?
The original concept for this research was to highlight the point that for airlines often
referred to as “low cost carriers”, the ‘low cost’ rubric is potentially misleading given that
a number of different business models are actually being practiced. However, the POA
approach can also give an indication as to whether any one model is more successful
than any other.
Using the indices as defined in the previous section, we have developed a dataset of
benchmark metrics for six airlines. The airlines considered were; EasyJet, Ryanair,
Norwegian, Flybe, SkyEurope and Air Berlin for both fiscal years 2005 and 2006. The
airlines in the sample represent a range of business models and inclusion of a two year’s
of data for each airline means that changes in business model or performance can be
identified. Where possible the items in the conceptual model were included in the
analysis. As the benchmarks are calculated using published data sources (generally the
annual reports of the various airlines in question and Air Transport Intelligence21), not
every item in the conceptual model could be mapped directly by the benchmarks.
However, every attempt has been made to construct a benchmark dataset that as closely
reflects the items in the conceptual model.
Of the airlines in the benchmark panel Ryanair and EasyJet were both profitable in both
selected years. Newly established Sky Europe is some way off being profitable. Recently
established Norwegian and FlyBe (which changed its operation from regional services to
low cost carrier in 2002), are profitable in one of the two years. Air Berlin that is the
third largest carrier of the group behind Ryanair and EasyJet has moved into a profitable
position in 2006 after beginning to refocus its operations in the low cost sector over the
past couple of years. Ex-regional carrier, FlyBe is the only one of the carriers that
operates a number of different aircraft and does not have either B737 or A320 type
aircraft in its fleet. 21 www.rati.com
Morrison and Mason
18
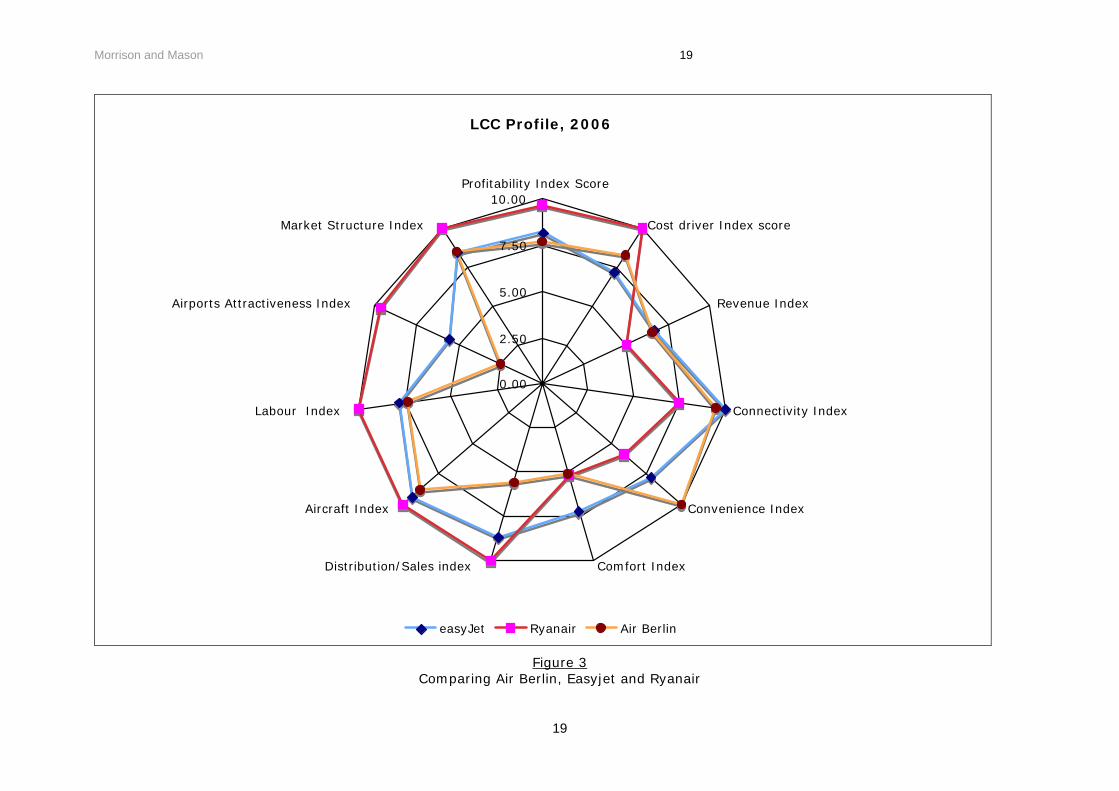
The figures 3 and 4 illustrate index profiles of the six airlines in 2006. The further a
carrier is toward the outermost point on a spoke the closer they are to being the best in
class for that particular index. A score of 10 for any index means the airline is the best
in class. We can see that Ryanair has a profile that is best in six of the eleven indexes
(and as such it is also included in the second chart for reference). They are best for
profitability, cost, distribution, labour, airports, and market structure. They are second
best for aircraft productivity.
It would seem therefore that, in this benchmarking exercise, Ryanair is best in delivering
an organizational architecture that attains the best profitability. Part of that success
leads to and derives from, a market structure where they dominate the small markets
that they serve. It is in the product architecture area where Ryanair is not the best in
class. In fact it is worst in class for Revenue, Comfort and Convenience. It would seem
that the carriers that pursue revenues backed by additional comfort and convenience are
those that have failed to achieve good profitability suggesting that in general such a
model is less successful in the ‘low cost’ sector. It also suggests that perhaps that there
is room for only one lowest-cost carrier.
Morrison and Mason 19
19
LCC Profile, 2006
0.00
2.50
5.00
7.50
10.00Profitability Index Score
Cost driver Index score
Revenue Index
Connectivity Index
Convenience Index
Comfort Index Distribution/Sales index
Aircraft Index
Labour Index
Airports Attractiveness Index
Market Structure Index
easyJet Ryanair Air Berlin
Figure 3 Comparing Air Berlin, Easyjet and Ryanair

Morrison and Mason 20
20
LCC Profile, 2006
0.00
2.50
5.00
7.50
10.00Profitability Index Score
Cost driver Index score
Revenue Index
Connectivity Index
Convenience Index
Comfort Index Distribution/Sales index
Aircraft Index
Labour Index
Airports Attractiveness Index
Market Structure Index
FlyBe SkyEurope Ryanair Norwegian
Figure 4 Comparing Flybe, SkyEurope, Norwegian and Ryanair

Morrison and Mason 21
21
Connectivity and profits
Connectivity remains the index that does not have a clear outcome, as indicated by
figure 5, which relates connectivity to profitability.
Operating Ratio and Connectivity Index
70.0%
80.0%
90.0%
100.0%
110.0%
120.0%
130.0%
140.0%
0.00 1.00 2.00 3.00 4.00 5.00 6.00 7.00 8.00 9.00 10.00
Connectivity Index
easyJet Ryanair Norwegian FlyBe SkyEurope Air Berlin
2005
2006
2006
20052005
2006
2005
2006
20062005
2006
2005
Figure 5
Ryanair scores more highly than Flybe, Norwegian and SkyEurope on account of its
significantly higher number of routes. EasyJet has the best connectivity index scores due
to its higher network density, higher frequencies, and tendency to serve larger airports
that have more available destinations. However, easyJet’s network density has fallen
consistently since 2003 when it had 12 departures per airport per day and an average
weekly flight frequency of 32.6 per route. In 2006 the airline had reduced its number of
departures per airport per day to 9.4 and reduced its weekly average frequency per route
to 18.6 – still the highest in the benchmark panel but a significant change in strategy. As
new European countries entered the EU, both Ryanair and EasyJet have been looking to
extend their network and increase the number of routes offered. Ryanair, with its
already low density strategy, has done so without further thinning its network density,
however, easyJet’s new strategy of network expansion has been at the cost of its route
density and flight frequency. During this period of new opportunities, first mover
advantage would seem to have been important. However, it is still not clear at this time
whether network connectivity is vital to the success of a LCC and it will be a couple of
more year’s before this becomes clear.

Morrison and Mason
22
Service quality and costs
Figure 6 provides a nice illustration of the cost implications of product design by relating
the cost and comfort indexes of the airlines. The figure shows that Ryanair display low
levels of comfort but enjoying the best cost index in the benchmark panel. In contrast
Sky Europe with high crew to passenger ratios and lower average passengers per flight
and FlyBe with the advantage of smaller aircraft have the best comfort index values but
low cost index scores.
Cost Index and Comfort Index
0.00
1.00
2.00
3.00
4.00
5.00
6.00
7.00
8.00
9.00
10.00
0.00 1.00 2.00 3.00 4.00 5.00 6.00 7.00 8.00 9.00 10.00
Comfort Index
easyJet Ryanair Norwegian FlyBe SkyEurope Air Berlin
2005
2006
2006
2005
20062005
2005
2006
20062005
20052006
Figure 6
Sector distance and profitability
Regarding sector length, most of the carriers in the benchmark panel have average stage
lengths of between 800 and 1,100 km (see figure 7). With the inclusion of newly
purchased Deutsche BA in its figures, Air Berlin has significantly changed it operating
pattern in 2006 and joins all other benchmark airlines with the exception of FlyBe in the
central range of average sector lengths.22 As a previously regional carrier offering very
short sectors FlyBe offer a different model to those offered by the rest of the benchmark
group. It’s marginal profitability suggests that its model is not particularly successful
however its performance is no worse than Norwegian or Air Berlin that follow the normal
low cost model more closely.
22 Formerly, British Airways owned Deutsche BA.

Morrison and Mason
23
Operating Profit and Sector Length
70.0%
80.0%
90.0%
100.0%
110.0%
120.0%
130.0%
140.0%
0 200 400 600 800 1,000 1,200 1,400 1,600
Average Sector Distance
easyJet Ryanair Norwegian FlyBe SkyEurope Air Berlin
2005
2006
2005
2006
2006
20052006
20052006
2005
2006
2005
Figure 7
Operating Ratio and Sectors per day
70.0%
80.0%
90.0%
100.0%
110.0%
120.0%
130.0%
140.0%
0.00 1.00 2.00 3.00 4.00 5.00 6.00 7.00 8.00 9.00 10.00
Sectors per day
easyJet Ryanair Norwegian FlyBe SkyEurope Air Berlin
2005
2006
2006
20052005
2006
20052006
Figure 8

Morrison and Mason
24
Aircraft utilization and profitability
While there most carriers in the benchmark group have similar average stage lengths,
one important part of the low cost model is the effective use of aircraft assets. The two
leading carriers, Ryanair and EasyJet both get more flights per day out of their aircraft
assets than the other carriers in the panel (see figure 8). Additional flights per day mean
more opportunities to share the cost of aircraft ownership and overhead cost over a
larger number of passengers. Given their significantly shorter sector lengths it flies,
Flybe may be able to increase the number of sectors it operates per day and thereby,
possibly, contribute to making its model a success.
5. Conclusion
We have argued in this paper that meaningful definitions of and distinctions between
airline business models are not easily formulated, particularly when one considers the
extremely dynamic nature of the industry. In order to provide a more coherent and
consistent understanding of airline competition and strategy, we have applied a product
and organizational architecture (POA) approach to classifying and relating key elements
of airline business models.
The application of the POA model to six European airlines has shown that there are
important differences in the business models of airlines who are all commonly referred to
as ‘low cost carriers’. Our paper demonstrates how differences in the business models
adopted by the different airlines contribute to their profitability. More specifically,
amongst the sample airlines examined, our analysis suggests that the positioning of
some airlines to offer increased comfort and convenience in a bid to achieve higher yields
is marginally successful but is not as profitable as the pure low cost approach practised
by Ryanair.
There may well be a first mover advantage enjoyed by Ryanair and EasyJet. Certainly
size and market power are shown to contribute to the POA strategy of both airlines. Yet,
we can see that even between these two airlines, Ryanair stands alone as the lowest-cost
carrier, providing some indication that strategically, when one airline establishes a lowest
cost position in its product and organizational architecture, competitors are forced to
choose a different POA strategy. Casual support for this is provided by recent marketing
efforts by Easyjet, aimed at driving up the proportion of traffic that is business related.
The direct objective of targeting this market is to drive up yield, but there is also
strategic value adjusting their POA strategy thereby avoiding head-to-head direct
competition with their lowest-cost competitor.

Morrison and Mason
25
The analysis can be extended in two ways. First by continuing to collect data covering a
larger number of years, we can investigate how the POA of airlines in the sample have
evolved over time. Secondly, the POA model can usefully be applied to analyse other
airline models (subject to availability of data) – network carriers, premium only cabin
carriers, long haul low cost carriers – and between carriers in similar sectors in different
regions – low cost airlines in North America, Europe and Asia.

Morrison and Mason 26
26
Acknowledgements
We wish to acknowledge support from the Centre for Transportation Studies at the University of British Columbia. Also, we thank GARS workshop participants in Hamburg, Germany and ATRS conference participants in Nagoya, Japan for useful comments on a previous draft.
Bibliography Dresner, M. and R. Windle 1996. The Impact of Low-cost carriers on Airport and Route
Competition, Journal of Transport Economics & Policy, 30(3), pp 309-328. Economist, The; 2004. Turbulent Skies, print edition, June 8th. European Low Fare Airlines Association 2004. “Liberalisation of European Air
Transport:The Benefits of Low Fares Airlines to Consumers, Airports, Regionsand the Environment”; http://www.elfaa.com/publications.htm
Ergas H. and Findlay C. 2004. Value Based Airlines, NECG Conference paper #0777.023,
presented at the ANU/NECG Conference on the Performance of Air Transport Markets.
Fernandez, M., & Kropac, M., 2004. Low-cost carrier: Hintergrunde und problematik des
billigflugtrends im europaischen luftverkehr. Aussenwirtschaft, 59(4), 407-434. Forsyth P. 2003. Low-cost carriers in Australia: experiences and impacts, Journal of Air
Transport Management, 9(5). Francis G., Alessandro F., and Humphreys I. 2003. Airport–airline interaction: the
impact of low-cost carriers on two European airports, Journal of Air Transport Management, 9(4) , pp 267-273.
Gillen G. and Lall A., 2004. Competitive advantage of low-cost carriers: some
implications for airports, Journal of Air Transport Management, 10(1). Gillen D. and Morrison W., 2003. Bundling, Integration and the Delivered Price of Air
Travel: Are Low-cost Carriers Full-service Competitors?, Journal of Air Transport Management, 9(1).
Ito, H., & Lee, D. 2003. Low-cost carrier growth in the U.S. airline industry: Past,
present, and future., Department of Economics, Working Papers. Mason, K.J. (2000), "The Propensity for Business Travellers to use Short Haul, Low Cost
Airlines", Journal of Transport Geography, Vol.8, No.2, pp. 107-119. Shaked A. and Sutton J. 1983. Natural Oligopolies, Econometrica, 51, pp1469-1484.
Morrison W. and Mason K., 2007. Defining and comparing competitive business models in
the context of product and organizational architecture, working paper. Willams G., 2001. Will Europe's charter carriers be replaced by "nofrills" scheduled
airlines?, Journal of Air Transport Management, 7(5), pp 277-286. Windle, R., & Dresner, M., 1999. Competitive responses to low-cost carrier entry,
Transportation Research: Part E: Logistics and Transportation Review, 35(1), pp 59 -75.