Embed Size (px)
Citation preview

1
What is a normal blood glucose?
Maria Güemes, Sofia A. Rahman, Khalid Hussain
Genetics and Genomic Medicine Programme, UCL Institute of Child Health and
Department of Paediatric Endocrinology, Great Ormond Street Hospital for Children
NHS, 30 Guilford Street, London, WC1N 1EH, UK.
Correspondence: Professor Khalid Hussain, Genetics and Genomic Medicine
Programme, UCL Institute of Child, 30 Guilford Street, London, WC1N 1EH UK.
Email: [email protected]
2
Summary:
Glucose is the key metabolic substrate for tissue energy production. In the perinatal period the
mother supplies glucose to the foetus and for most of the gestational period the normal lower
limit of foetal glucose concentration is around 3mmol/L. Just after birth, for the first few hours of
life in a normal term neonate appropriate for gestational age, blood glucose levels can range
between 1.4 to 6.2mmol/L but by about 72 hours of age fasting blood glucose levels reach
normal infant, child and adult values (3.5-5.5mmol/L). Normal blood glucose levels are
maintained within this narrow range by factors which control glucose production and glucose
utilization. The key hormones which regulate glucose homeostasis include insulin, glucagon,
adrenaline, nor-adrenaline, cortisol and growth hormone. Pathological states that affect either
glucose production or utilization will lead to hypoglycaemia. Although hypoglycaemia is a
common biochemical finding in children (especially in the newborn) it is not possible to define by
a single (or a range of) blood glucose value/s. It can be defined as the concentration of glucose
in the blood or plasma at which the individual demonstrates a unique response to the abnormal
milieu caused by the inadequate delivery of glucose to a target organ (for example, the brain).
Hypoglycaemia should therefore be considered as a continuum and the blood glucose
concentration should be interpreted in the context of the clinical presentation, counter-regulatory
hormonal responses and in relation to the intermediate metabolites.
3
Introduction
Blood glucose is the most important substrate for energy production during the perinatal,
neonatal and postnatal periods. Apart from the first few days of life, normal fasting blood
glucose concentrations are kept within a narrow physiological range of 3.5-5.5mmol/L.
Continuous blood glucose monitoring shows that blood glucose concentrations may “flicker” on
either side of these two values (especially post meal) but then rapidly and spontaneously revert
to within this normal range[1]. Fasting and post-prandial normal blood glucose levels are
maintained within this narrow range by a complex interplay of hormones which control glucose
production and glucose utilization. Glucose is produced in the liver by glycogenolysis
(breakdown of stored glycogen) and gluconeogenesis (formation of glucose from non-
carbohydrate sources such as lactate, alanine and glycerol). Apart from the liver, there is now
evidence to show that the kidney also plays an important role as a gluconeogenic organ[2]. The
key hormones which regulate glucose homeostasis include insulin, glucagon, adrenaline, nor-
adrenaline, cortisol and growth hormone (GH). Insulin typically regulates glucose homeostasis
in the post-prandial state whereas the other hormones control blood glucose levels during the
fasting state. Glucagon and adrenaline are the main line of defense against hypoglycaemia
whereas cortisol and GH have a permissive role in regulating blood glucose levels.
During the perinatal period, the foetus is dependent on a continuous supply of glucose from the
mother[3]. In a normal foetus there is no endogenous glucose production, however under
conditions where there is reduced glucose supply, the foetus has the capability to generate
glucose endogenously[4]. The rate at which the foetus undertakes glucose utilization and
oxidation is determined by the maternal arterial blood glucose concentration[5].
After birth, the continuous supply of glucose to the foetus is interrupted and for the first few
hours after birth, there is a transitional phase of physiologically low normal blood glucose levels

4
(transitional neonatal hypoglycaemia) which normalize around 72 hours after birth. It is during
these first few hours after birth that blood glucose concentrations show marked physiological
variability and this represents a normal transition phase of glucose physiology.
Any pathological states which affect glucose production or utilization will lead to hypoglycaemia.
In the neonatal, infancy and childhood periods, the finding of biochemical hypoglycaemia is
common. However, despite the commonality of hypoglycaemia, in our current state of
knowledge about glucose physiology, it is not possible to define hypoglycaemia by a particular
blood glucose value/s. The brain is the key organ for glucose utilization and there is no doubt
that low blood glucose levels can lead to neuronal energy deficiency and hence lead to brain
injury[6]. There are no evidence based studies that define a particular blood glucose which
leads to irreparable brain damage.
Having an understanding of the physiological and biochemical mechanisms that regulate normal
blood glucose levels will help in the diagnostic approach to a child with hypoglycaemia. A low
blood glucose level has to be interpreted in the context of the clinical scenario, the presence or
absence of alternative substrates, the method used to measure blood glucose and in the
neonatal period in relation to feeds. As hypoglycaemia is a common biochemical finding, making
the correct diagnosis is extremely important as this will guide the clinician in patient
management. Any child presenting with unexplained hypoglycaemia will need a full biochemical
diagnostic work up searching for the underlying cause of the hypoglycaemia.
The aims of this review are to highlight the difficulty in defining hypoglycaemia, to describe the
physiological and biochemical mechanisms that regulate blood glucose levels during the
perinatal, neonatal and infancy periods and to review what “normal” blood glucose levels are
during these periods.
5
Why is it difficult to define hypoglycaemia?
Hypoglycaemia cannot be defined by a particular blood glucose value especially in the newborn
period. The majority of appropriate for age term newborns show transient low blood glucose
concentrations (transitional neonatal hypoglycaemia, discussed below) and this is a normal
physiological adaptation process. Several different approaches have been used to define
hypoglycaemia but none of these are satisfactory[7]. A single low blood glucose value cannot be
applied universally to every individual patient.
In the newborn and infancy periods, hypoglycaemia cannot be defined by the onset of signs and
symptoms as these tend to be non-specific and are not easy to recognize in this age group
(unlike older children and adults). Hypoglycemic symptoms vary from being nonspecific, such as
poor feeding, lethargy, and irritability, to more severe ones, like apnea, seizures, or coma.
Hence, the relevance of a careful detailed clinical assessment is of the utmost importance. The
responses of the brain to hypoglycaemia (neuroglycopaenic symptoms arise when insufficient
glucose is available to fuel the brain) occur over a range of blood glucose levels and these
responses can be modified by previous episodes (antecedent) of hypoglycaemia and by the
presence of alternative brain fuels (like ketone bodies and lactate). It is not possible to define a
single blood glucose value which leads to brain damage as this will depend on the frequency,
severity and duration of hypoglycaemia.
In adults, clinical hypoglycaemia is defined as a blood glucose level which is low enough to
cause symptoms and signs of impaired brain function[8]. Guidelines in adults emphasize the
value of Whipple's triad for confirming hypoglycemia i.e., symptoms and/or signs consistent with
hypoglycaemia, a documented low blood glucose concentration, and relief of signs/symptoms
when blood glucose concentration is restored to normal. The same approach has been
recommended for older children who are able to describe their symptoms [9]. However, this
6
cannot be applied to the younger infants and of course neonates, as they cannot convey their
symptoms.
When interpreting a blood glucose result, the method of collection of the blood sample will be
important as some methods (especially bed side test strips) may be inaccurate. Whole blood
glucose values are about 15% less compared to those in the serum and plasma. On the other
hand, venous blood glucose concentrations are 10% lower than arterial. For measurement of
blood glucose, blood samples should be collected into fluoride containing tubes to inhibit
glycolysis.
Significant hypoglycaemia is not and can never be defined by a single number that can be
applied universally to every individual patient. Rather, it is characterized by a value(s) that is
unique to each individual and varies with both their state of physiologic maturity and the
influence of pathology. It can be defined as the concentration of glucose in the blood or plasma
at which the individual demonstrates a unique response to the abnormal milieu caused by the
inadequate delivery of glucose to a target organ (for example, the brain). The “unique” response
refers to the biochemical changes which are activated then the blood glucose level is lowered
with/without the accompanying clinical manifestations. This response will be modulated by the
availability of alternative fuels, the counter-regulatory hormonal responses and any episodes of
antecedent hypoglycaemia. Thus, it is not possible to define a blood glucose level that requires
intervention in every newborn infant because there is uncertainty over the level and duration of
hypoglycaemia that can cause brain damage, and little is known of the vulnerability, or lack of it,
of the brain of infants at different gestational ages for such damage. It is therefore clear that
hypoglycaemia is a continuum and the blood glucose concentration should be interpreted in the
context of the clinical presentation, counter-regulatory hormonal responses, in relation to feeds
and in relation to the intermediate metabolites (fatty acids and ketone bodies). Thus, the blood

7
glucose concentration has to be interpreted in the context of the clinical scenario and the
presence of alternative fuels.
Perinatal glucose physiology
The mother supplies glucose to the placenta and foetus with the placenta acting as a barrier
regulating the transfer of nutrients and glucose to the foetus. For placental glucose to be
transported to the foetus from the maternal circulation there has to be a net maternal-to-foetal
plasma glucose concentration gradient that is determined by placental as well as the foetal
glucose consumption[5]. Glucose is transferred to the placenta where it is partitioned between
glucose consumption by the placenta and that transferred to the foetus.
Glucose is taken up from the maternal plasma by the GLUT 1 transporter protein and
transported to the foetus by facilitative diffusion according to concentration-dependent
kinetics[10]. GLUT 1 is the main glucose transporter protein isoform in maternal-facing
microvillus and foetal-facing syncytiotrophoblast membranes. The increase in the surface area
and the maintenance of a high GLUT 1 density accounts for the increase in placental glucose
transport in the latter part of pregnancy[11]. Studies in sheep have shown that in the second half
of pregnancy, foetal glucose demand grows much more rapidly (about a 10 fold increase) than
placental glucose transfer capacity and this then requires a decrease in foetal glucose
concentration to balance glucose supply and demand[12]. The increased glucose transport
leads to significant deposition of glycogen and fat stores, especially in the third trimester.
Blood glucose values in the normal foetus
The foetus consumes glucose as its principle metabolic fuel for energy production. The foetal
glucose concentration is a function of both gestational age and the maternal glucose
concentration. At around 20 weeks of gestational age there is a linear relationship between
maternal and foetal glucose concentrations[13]. For most of the gestational period (and
8
especially after 20 weeks) the foetus is exposed to circulating glucose concentrations only
slightly below those of maternal plasma. With a normal maternal glucose concentration of 3.5-
5.5mmol/L, the mean foetal-maternal plasma glucose difference at term is only 0.5mmol/L, thus
in the term healthy foetus the normal glucose concentration is around 3mmol/L[3].
Glucose contributes nearly to 80% of the total energy requirement of the foetus and the
remaining 20% of foetal energy needs is provided by lactate, amino acids and glycerol[14]. The
foetus utilizes glucose at a higher rate than that observed in adults (5-7 mg/kg/min vs 2-
3mg/kg/min). Under normal conditions there is no foetal glucose production (by glycogenolysis
or gluconeogenesis), but glucose production is stimulated in the foetus exposed to prolonged
periods of low glucose supply (for example during fasting or placental insufficiency). Glycogenic
enzymes are present in foetal liver as early as 8 weeks of gestation and the hepatic glycogen
content increases from 3.4mg/g at 8 weeks of gestation to 50mg/g at term.
Insulin is the main anabolic hormone in foetal life and islet pancreatic beta-cells can be detected
in the pancreas as early as 10-12th weeks of gestation[15]. Foetal pancreatic beta-cells release
insulin poorly in response to changes in the blood glucose concentration and the response to a
glucose load is blunted. Insulin becomes detectable around 10-12 weeks of gestation in the
foetus and during the perinatal period insulin is more important for regulating growth rather than
regulating glucose metabolism.
Glucose physiology in the normal term neonate: making the transition to an
independent existence
At birth the healthy term newborn must adapt to an independent existence. The transplacental
supply of nutrients including glucose is interrupted and the newborn must now initiate metabolic
and endocrine responses to maintain adequate circulating blood glucose concentrations. For
extrauterine adaptation there must be adequate glycogen stores, intact and functional
9
glycogenolytic, gluconeogenic, lipogenic and ketogenic mechanisms and appropriate counter-
regulatory hormonal responses. Figure 1 shows the metabolic, endocrine and physiological
changes which occur at the time of birth to allow a normal term newborn to adapt to an
independent existence.
An appropriate for gestational age normal infant shows an immediate postnatal fall
(physiologically normal) in blood glucose concentrations during the first 2-4 hours of life. During
this transitional phase, “normal” blood glucose values can range from as low as 1.4mmol/L to as
high as 6.2mmol/L[16, 17]. The lowest mean blood glucose documented within the first few
hours of birth can be as low as 2.3mmol/L[18]. Studies that have documented “normal” blood
glucose concentrations in healthy, appropriate for gestational age newborns in the first hours of
life are listed in table 1 [16 - 23].
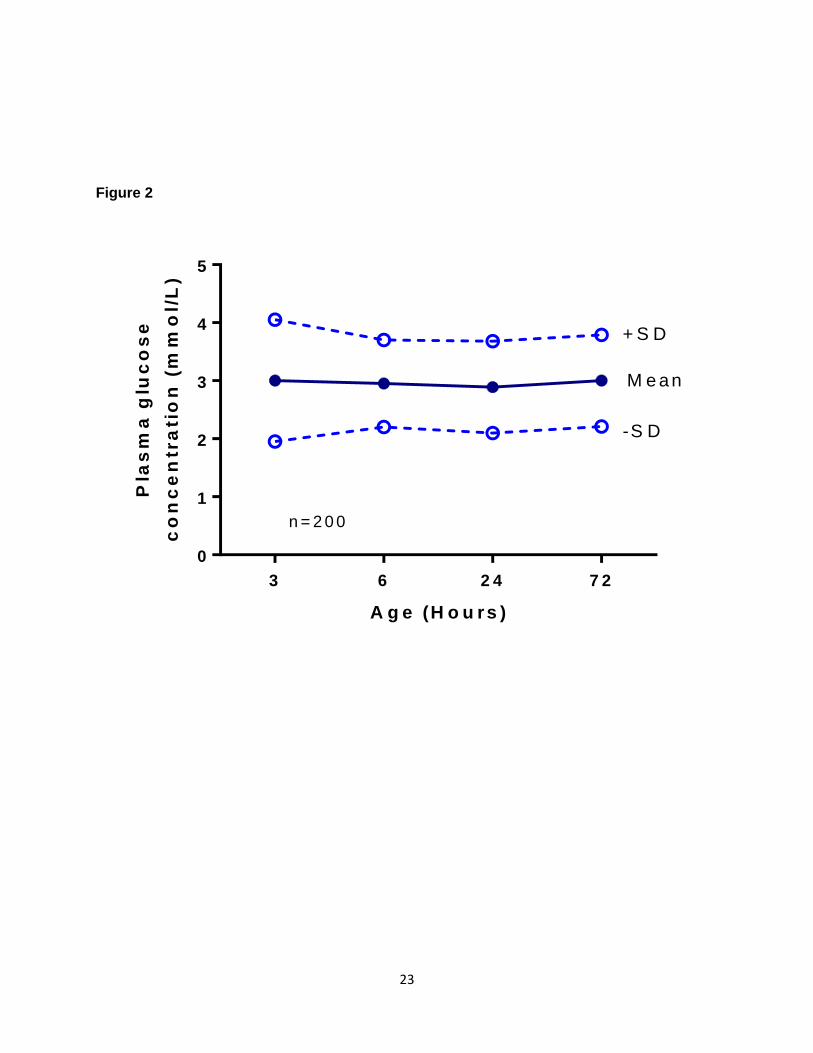
Healthy term breastfed babies have significantly lower blood glucose concentrations (mean
3.6mmol/l; range 1.5–5.3), than those who are bottle-fed (mean 4.0mmol/l; range 2.5–6.2), but
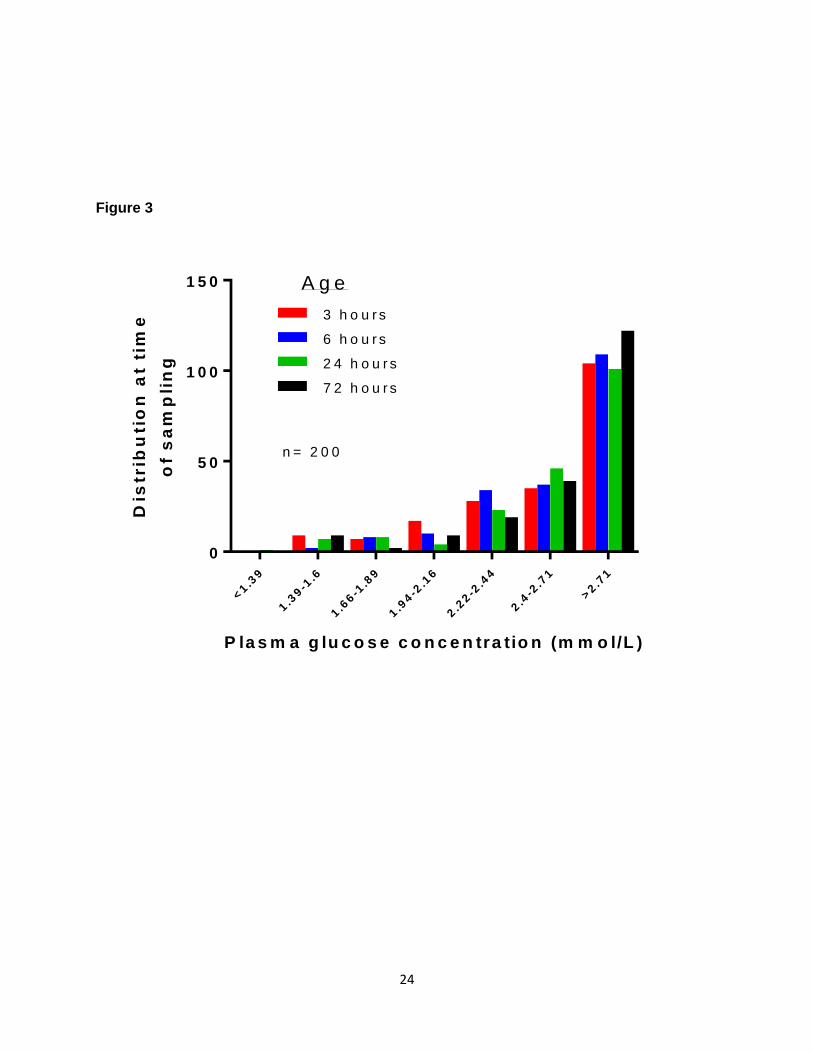
their ketone body concentrations are elevated in response to breast feeding[17, 23]. Figure 2
shows the results of a study [23] with the serial mean and +/-SD plasma glucose levels within
the first 72 hours of life in exclusively breast fed infants and Figure 3 shows the distribution of
these blood glucose levels.
In addition to the low blood glucose levels, the serum insulin concentrations are inappropriately
high during this transitional phase of normal glucose physiology, suggesting a transient
alteration in the set point for insulin secretion during this period [24, 25]. However, despite the
marked variability in the blood glucose levels and transient alteration in the set point for insulin
secretion during the first few hours of life, after about 72 hours of age, all term healthy newborns
reach fasting blood glucose levels comparable to those of children and adults (3.5-5.5mmol/L).
The above endocrine and metabolic profiles observed in appropriate for gestational age normal
10
infants in the first a few days of life suggest that these are relatively low blood glucose levels in
comparison to older babies where the glucose set point for suppression of insulin secretion is
reduced[25].
The drop in the glucose levels noted after birth appears essential to facilitate physiological
transition for neonatal survival, which includes increased glucose production by glycogenolysis,
gluconeogenesis, stimulation of appetite, adaptation to fast/feed cycles, and promotion of
oxidative fat metabolism using lipid from fat stores and ingested milk feeds[26]. The trigger for
the metabolic and endocrine adaptation with reference to glucose control is unclear, but surges
in catecholamines and glucagon secretion are thought to be important. The raised plasma
insulin to glucagon ratio is reversed at birth allowing glucagon to activate adenylate cyclase and
increase the activity of cAMP-dependent protein kinase A (PKA). This in turn, activates
phosphorylase kinase which facilitates glucose release into the circulation.
The catecholamine surge and an increase in TSH (thyroid stimulating hormone) activates
lipolysis and lipid oxidation, resulting in increases in the levels of glycerol and free fatty
acids[27]. Free fatty acids are transported to the liver to generate ketone bodies which are used
as an alternative source of fuel. Major changes occur in the function of several physiological
systems after birth which enables the neonate to adapt to postnatal nutrition. Successful enteral
feeding in healthy term newborns triggers the secretion of gut peptides and plays a key role in
triggering a cascade of developmental changes in gut structure and function, and in the relation
of pancreatic endocrine secretion to intermediary metabolism[28].
Hence, full-term infants are functionally and metabolically programmed to make the transition
from their intrauterine dependent environment to their extra-uterine existence without the need
for metabolic monitoring or interference with the natural breastfeeding process. This complex
11
metabolic and endocrine adaptation process is incomplete and compromised when the infant is
born prematurely or following intrauterine growth retardation.
Maintenance of a normal blood glucose level: Integration of the physiological
changes associated with feeding and fasting.
Normal fasting blood glucose levels in infants, children and adults are maintained within a
narrow range (3.5-5.5mmol/L) despite the frequent feed and fasting cycles. Insulin plays a major
role in regulating glucose production and utilization during both the fed and fasted state.
Following the ingestion of a meal, the plasma glucose concentration starts to increase within 15
minutes[29]. This increase in the plasma glucose level and the stimuli from neurogenic and
entero-insular axis (gastric inhibitory peptide (GIP) and glucagon-like peptide 1 (GLP-1))
stimulates insulin secretion from the pancreatic beta-cells. Peak levels of plasma glucose are
reached around 30-60 minutes following ingestion after which it starts to decrease until
absorption is complete, usually about 4-5 hours later, with plasma insulin concentrations
following a similar time course.
Following the ingestion of a meal, there is a marked suppression of endogenous glucose
production from the liver, the magnitude of which is largely determined by the insulin and
glucagon responses[30]. Endogenous glucose production may be suppressed up to 50-60%
with about 25 grams less glucose being delivered into the systemic circulation[31].
Postprandially, plasma glucose levels are determined by a balance between the rates of
glucose removal from the systemic circulation and the rate of delivery of glucose into the
systemic circulation. Also, postprandially the processes of glycogenolysis, gluconeogenesis,
lipolysis and ketogenesis are all suppressed. The tissues mainly responsible for the removal of
glucose from the systemic circulation include the liver, small intestine, brain, muscle and
12
adipose tissue. The magnitude of glucose uptake by the tissues, except for the brain, is largely
determined by the plasma insulin concentration. Glucose uptake by the brain is determined by
the plasma glucose concentration and is independent of the plasma insulin concentration.
The 4-6 hours interval following the ingestion of a meal is sometimes referred to as the post
absorptive state. During this interval, a steady state is reached whereby glucose production is
equal to the rate of glucose consumption and plasma glucose concentrations are maintained
within a normal range. During this state, it is estimated that glucose turnover (glucose
production and utilization) is approximately 10micromol/kg/min[32]. In this state, non-insulin
dependent utilization of glucose accounts for 80%, mainly by the brain (which accounts for 50%
of the total), red blood cells, kidneys and the gastro-intestinal system. During this phase,
glucose concentrations are maintained by interactions between insulin and the various counter-
regulatory hormones including glucagon, cortisol, GH, adrenaline and nor-adrenaline. Glucagon
allows the controlled release of stored glycogen from the liver and insulin restrains the effects of
glucagon by preventing accelerated lipolysis and proteolysis. The counter-regulatory hormones
including cortisol and GH play permissive roles in setting the sensitivity of the peripheral tissues
to glucagon and insulin.
As the period of the fast is lengthened, utilization of glucose by the tissues decreases while
utilization of free fatty acids and ketone bodies increases[33]. There is a reduction in hepatic
glucose output, which is accounted for mainly by a decrease in glycogenolysis, with an increase
in the rate of gluconeogenesis. The increased gluconeogenesis is thought to be related to the
increased secretion of glucagon and other counter-regulatory hormones, as well as the
reduction in insulin secretion. The increased glucagon secretion is associated with reduced
insulin secretion allowing stored fats to be converted to glycerol and fatty acids and proteins to
be converted to amino acids for gluconeogenesis. The liberated free fatty acids are transported
13
to the liver bound to albumin, where they can either undergo beta-oxidation in the mitochondria
or be re-esterified to triacylglycerol’s and phospholipids. The process of beta-oxidation yields
acetyl-Co which can then be converted to ketone bodies, acetoacetate and 3β-hydroxybutyrate,
via the hydroxymethylglutaryl-CoA (HMG-CoA) pathway, or it can undergo complete oxidation in
the tricarboxylic acid cycle.
The major gluconeogenic precursors after an overnight fast are lactate, glycerol and alanine.
The majority of the lactate and alanine generated after an overnight fast originate from plasma
glucose and represent recycling of carbon atoms. The first reaction in gluconeogenesis
involves the conversion of pyruvate to oxaloacetate to phosphoenolpyruvate. The second of
these reactions converts fructose-1, 6-biphosphate to fructose-6-biphosphate. This is the rate-
limiting step for the process of gluconeogenesis. The final step involves the conversion of
glucose-6-phosphate to free glucose.
Young children differ from adults in that they have limited glycogen stores which are only
adequate for a period of starvation of approximately 12 hours after which the maintenance of a
normal blood glucose concentration is dependent on gluconeogenesis. Haymond et al[34]
showed that children fasted for 30 hours and had the lowest glucose and alanine concentrations
as compared to adult men and women. For this reason, children are unable to tolerate
prolonged periods of starvation.
Children have higher glucose production rates in comparison to adults in order to meet
the increased metabolic demands of the brain that, relative to body size, is much larger
than in adults. Bier et al[35] measured glucose production rates in infants and children using
6,6-dideuteroglucose and showed that the brain size was the principal determinant of
factors that regulate hepatic glucose output throughout life.
14
Sunehag et al[36] have shown that the rate of gluconeogenesis, on a body weight basis, is
greater in children between the ages of 8 and 9 years than in adolescents between the ages of
14 and 16 years, whereas the fraction of glucose production derived from gluconeogenesis was
essentially identical between the two groups of subjects. The same study showed that
gluconeogenesis contributed to 50% of glucose production in the childhood period. The fasting
newborn and young children demonstrate a high glucose utilization rate per kilogram body
weight relative to adult requirements. Hence for these reasons, children are more susceptible to
hypoglycaemia in comparison to adults.
Muscle and other tissues become progressively more dependent on free fatty acids and ketone
bodies for their continued energy requirements as the period of the fast is prolonged. Ketone
bodies are produced in the liver, mainly from the oxidation of fatty acids, and are exported to
peripheral tissues for use as an energy source. They are particularly important for the brain,
which has no other substantial non-glucose-derived energy source. Ketone bodies replace
glucose as the predominant fuel for nervous tissue, thereby reducing the obligatory requirement
of the brain[37].
During the period of a fast there is a complex interaction of metabolic and hormonal
mechanisms, which produces significant variations in the concentrations of the counter-
regulatory hormones and intermediary metabolites. Children differ in their response to fasting in
comparison to adults[34]. For example, studies in adults have shown that the levels of free fatty
acids, glycerol, and ketones in the blood gradually increase as the period of starvation is
extended[38]. During a brief period of fasting in the childhood period, ketosis and ketonuria
develop readily, suggesting that children convert more rapidly to a fuel economy based largely
on fat. Thus infants and children develop hypoglycaemia more readily.
15
Conclusions
Apart from the immediate neonatal period, the normal range of fasting blood glucose
concentration is 3.5-5.5mmol/L. Blood glucose concentrations are kept within this range by a
complex interplay of hormones which control glucose production and utilization. In term
appropriate for age healthy newborns within the first few hours of life, “normal” blood glucose
concentrations can range between 1.4 to 6.2mmol/L, but by about 72 hours of life they reach
values of 3.5-5.5mmol/L. Hypoglycaemia should be considered as a continuum and the blood
glucose concentration should be interpreted in the context of the clinical presentation, counter-
regulatory hormonal responses and in relation to the intermediate metabolites.
16
Legends
Figure 1: The metabolic, endocrine and the physiological changes which occur at the time of
birth to allow a normal term newborn to adapt to an independent existence.
Table 1: Studies that have published “normal” blood glucose concentrations (BM) in healthy,
appropriate for gestational age (AGA) newborns in the first hours of life.
Figure 2: Plasma glucose concentrations measured serially in 200 term appropriate size for
gestational age and exclusively breast-fed infants, at 3, 6, 24 and 72 hours of age (adapted
from[23]).
Figure 3: Plasma glucose concentration distribution at the time of sampling in 200 term
appropriate size for gestational age and exclusively breast-fed infants, at 3, 6, 24 and 72 hours
of age (adapted from[23]).
17
References
1. Kaufman FR. Role of the continuous glucose monitoring system in pediatric patients.
Diabetes Technol Ther. 2000;2 Suppl 1:S49-52
2. Mitrakou A. Kidney: its impact on glucose homeostasis and hormonal regulation. Diabetes
Res Clin Pract. 2011 Aug;93 Suppl 1:S66-72.
3. Kalhan SC, D’Angelo L, Savin SM, et al. Glucose production in pregnant women at term
gestation: Sources of glucose for human fetus. J Clin Invest 1979;63:388-94
4. DiGiacomo JE, Hay WW Jr. Fetal glucose metabolism and oxygen consumption during
sustained hypoglycemia. Metabolism. 1990 Feb;39(2):193-202
5. Hay WW Jr. Regulation of placental metabolism by glucose supply. Reprod Fertil Dev.
1995;7(3):365-75.
6. Burns CM, Rutherford MA, Boardman JP, et al. Patterns of cerebral injury and
neurodevelopmental outcomes after symptomatic neonatal hypoglycemia. Pediatrics. 2008
Jul;122(1):65-74. doi: 10.1542/peds.2007-2822.
7. Cornblath M, Hawdon JM, Williams AF, et al. Controversies regarding definition of neonatal
hypoglycemia: suggested operational thresholds. Pediatrics. 2000 May;105(5):1141-5.
8. Cryer PE, Axelrod L, Grossman AB, et al. Evaluation and management of adult hypoglycemic
disorders: an Endocrine Society Clinical Practice Guideline. J Clin Endocrinol Metab
2009;94(3):709-28.
9. Thornton PS, Stanley CA, De Leon DD, et al. Recommendations from the Pediatric
Endocrine Society for Evaluation and Management of Persistent Hypoglycemia in Neonates,
Infants, and Children. J Pediatr. 2015 May 6. pii: S0022-3476(15)00358-3.
10. Hay WW Jr. Placental transport of nutrients to the fetus. Horm Res. 1994;42(4-5):215-22
11. Jansson T, Wennergren M, Illsley NP. Glucose transporter protein expression in human
placenta throughout gestation and in intrauterine growth retardation. J Clin Endocrinol Metab.
1993 Dec;77(6):1554-62.

18
12. Molina RD, Meschia G, Battaglia FC, et al. Gestational maturation of placental glucose
transfer capacity in sheep. Am J Physiol. 1991 Sep;261(3 Pt 2):R697-704.
13. Bozzetti P, Ferrari MM, Marconi AM, et al. The relationship of maternal and fetal glucose
concentrations in the human from midgestation until term. Metabolism. 1988 Apr;37(4):358-63.
14. Rao PN, Shashidhar A, Ashok C. In utero fuel homeostasis: Lessons for a clinician. Indian J
Endocrinol Metab. 2013 Jan;17(1):60-8.
15. Piper K, Brickwood S, Turnpenny LW, et al. Beta-cell differentiation during early human
pancreas development. Journal of Endocrinology. 2004;181:11-23.
16. Hoseth E, Joergensen A, Ebbesen F, et al. Blood glucose levels in a population of healthy,
breast fed, term infants of appropriate size for gestational age. Arch Dis Child Fetal Neonatal
Ed. 2000 Sep;83(2):F117-9
17. Hawdon, JM, Ward-Platt MP, Aynsley-Green A. Patterns of metabolic adaptation for preterm
and term infants in the first neonatal week. Arch Dis Child 1992;67:357–65.
18. Sweet DG, Hadden D, Halliday HL. The effect of early feeding on the neonatal blood
glucose level at 1-hour of age. Early Hum Dev. 1999;55(1):63-6.
19. Acharya PT, Payne WW. Blood Chemistry of Normal Full-Term Infants in the First 48 Hours
of Life. Arch Dis Child. 1965;40:430-5.
20. Srinivasan G, Pildes RS, Cattamanchi G, et al. Plasma glucose values in normal neonates:
a new look. J Pediatr. 1986;109(1):114-7.
21. Heck LJ, Erenberg A. Serum glucose levels in term neonates during the first 48 hours of life.
J Pediatr. 1987;110(1):119-22.
22. Dollberg S, Bauer R, Lubetzky R, et al. A reappraisal of neonatal blood chemistry reference
ranges using the Nova M electrodes. Am J Perinatol. 2001;18(8):433-40.
23. Diwakar KK, Sasidhar MV. Plasma glucose levels in term infants who are appropriate size
for gestation and exclusively breast fed. Arch Dis Child Fetal Neonatal Ed. 2002;87(1):F46-8.
24. Hawdon JM, Aynsley-Green A, Alberti KG, et al. The role of pancreatic insulin secretion in
neonatal glucoregulation. Healthy term and preterm infants. Arch Dis Child 1993;68:274-9
19
25. Stanley CA, Anday EK, Baker L, et al. Metabolic fuel and hormone responses to fasting in
newborn infants. Pediatrics 1979;64:613-9
26. Stanley CA, Rozance PJ, Thornton PS, et al. Re-evaluating "transitional neonatal
hypoglycemia": mechanism and implications for management. J Pediatr. 2015 Jun;166(6):1520-
1525.e1.
27. Sperling MA, Ganguli S, Leslie N, et al. Fetal-perinatal catecholamine secretion: role in
perinatal glucose homeostasis. Am J Physiol. 1984 Jul;247(1 Pt 1):E69-74.
28. Aynsley-Green A, Lucas A, Lawson GR, et al. Gut hormones and regulatory peptides in
relation to enteral feeding, gastroenteritis, and necrotizing enterocolitis in infancy. J Pediatr.
1990 Jul;117(1 Pt 2):S24-32.
29. Mitrakou A, Kelley D, Veneman T, et al. Contribution of abnormal muscle and liver glucose
metabolism to postprandial hyperglycemia in NIDDM. Diabetes. 1990 Nov;39(11):1381-90.
30. Mitrakou A, Vuorinen-Markkola H, Raptis G, et al. Simultaneous assessment of insulin
secretion and insulin sensitivity using a hyperglycemia clamp. J Clin Endocrinol Metab. 1992
Aug;75(2):379-82.
31. Firth RG, Bell PM, Marsh HM, et al. Postprandial hyperglycemia in patients with noninsulin-
dependent diabetes mellitus. Role of hepatic and extrahepatic tissues. J Clin Invest. 1986
May;77(5):1525-32.
32. Bolli GB, Gottesman IS, Cryer PE, et al. Glucose counterregulation during prolonged
hypoglycemia in normal humans. Am J Physiol. 1984 Aug;247(2 Pt 1):E206-14.
33. Fukao T, Mitchell G, Sass JO, et al. Ketone body metabolism and its defects. J Inherit
Metab Dis. 2014 Jul;37(4):541-51.
34. Haymond MW, Karl IE, Clarke WL, et al. Differences in circulating gluconeogenic substrates
during short-term fasting in men, women, and children. Metabolism. 1982 Jan;31(1):33-42.
35. Bier DM, Leake RD, Haymond MW, et al. Measurement of "true" glucose production rates in
infancy and childhood with 6,6-dideuteroglucose. Diabetes. 1977 Nov;26(11):1016-23.
20
36. Sunehag AL, Treuth MS, Toffolo G, et al. Glucose production, gluconeogenesis, and insulin
sensitivity in children and adolescents: an evaluation of their reproducibility. Pediatr Res. 2001
Jul;50(1):115-23.
37. Zhang Y, Kuang Y, Xu K, et al. Ketosis proportionately spares glucose utilization in brain. J
Cereb Blood Flow Metab. 2013 Aug;33(8):1307-11.
38. Cahill GF Jr. Starvation in man. Clin Endocrinol Metab. 1976 Jul;5(2):397-415.

21

22
Table 1
BM: Blood glucose concentration. AGA: Appropriate size for gestational age. NVD: Normal vaginal delivery. C-section: Caesarean section. NICU: Neonatal intensive care unit. ¥ When available *Whole blood values reported using Nova Stat were adjusted to plasma glucose values using a correction factor of 1.135
Publication Author, year [Reference]
Study size (n) Age (hours
of life)
BM in mmol/l, Mean ± SD¥
(range)¥
Feeding mode when sampled
Subjects’ characteristics Study design
Method of analysis
Acharya and Payne, 1965 (19)
14 0 4.0 ± 0.9 (2.5-5.3)
Not specified Term, AGA, no maternal or
neonatal complications
Not specified
Nelson-Somogyi photometric assay [assay also
measures other reducing sugars]
14 1 3.5 ± 1.1 (1.7-5.9)
14 2 3.3 ± 1.0 (1.7-5.2)
14 3 3.5 ± 1.1 (2.2-6.2)
14 5 3.5 ± 1.2 (2.2-5.4)
14 7 3.3 ± 1.1 (1.9-4.9)
14 9 3.3 ± 0.8 (1.8-4.9)
14 11 3.6 ± 1.5 (2.3-7.9)
14 18 3.5 ± 0.9 (2.3-5.8)
14 24 3.2 ± 0.8 (1.6-4.3)
14 36 3.1 ± 0.9 (1.6-5.0)
14 48 3.3 ± 0.7 (2.2-5.0)
Srinivasan et al, 1986 (20)
52 1 3.11 ± 1.06 (0.9–6.6)
Not fed Full term, AGA (2.5-4.0Kg), no
maternal or neonatal complications
Longitudinal
Beckman glucose oxidase analyzer 52 2
3.33 ± 0.61 (2.17-5.33)
51 3 3.89 ± 0.72
(2.2-5.4)
Heck and Erenberg, 1987 (21)
113 1 3.33 ± 1.00 Not fed
Term (37 – 42 weeks), no maternal or neonatal
complications
Longitudinal Beckman glucose oxidase analyzer
107 2 3.39 ± 0.83
Hawdon et al, 1992 (17)
9 NVD 0 4.3
Breast or formula
Term (>37 weeks), AGA, white ethnicity, born by NVD or C-
section, no maternal or neonatal complications
Cross-sectional
Cobas fast centrifugal analyser
24 C-section 0 3.4
11 NVD 1-12 3.1
11 C-section 1-12 3.3
9 NVD 12-24 3.7
10 C-section 12-24 3.3
27 Day 2 3.5
27 Day 3 3.4
21 Day 4 4.1
20 Day 5 4.0
20 Day 6 4.2
Sweet et al, 1999 (18)
22 1 2.34 ± 0.91 Breast Babies >37 weeks, normal
Apgars, not admitted to NICU, no maternal diabetes
Cross-sectional
HemoCue B-Glucose system 24 1 2.52 ± 0.84 Formula
29 1 2.58 ± 0.94 Not fed
Hoseth et al, 2000 (16)
22 1 2.9 ± 0.7 (1.4-4.0)
Breast Term (37 – 42 weeks), AGA, normal Apgars, no maternal
or neonatal complications
Cross-sectional Glucose dehydrogenase
photometric method
27 2 3.2 ± 0.8 (2.0-4.9)
Dollberg et al, 2001 (22)
50 2-4 3.97±0.76*
(1.8-5.8) Not specified
Term (38 – 41 weeks), AGA, normal Apgars, no maternal
or neonatal complications
Cross-sectional Nova Stat
Profile M glucose oxidase electrode
Diwakar and Sasidhar, 2002 (23)
200
3 3.0 ± 1.05 (1.4-8.3)
Fed and not fed Term (37 – 42 weeks), AGA, normal Apgars, no maternal
or neonatal complications
Longitudinal Hitachi 902 Nova Biomedical Corp
6 2.95 ± 0.75
(1.6-5.4)
24 2.89 ± 0.79
(1.3-7.6)
72 3.0 ± 0.79 (1.4 – 7.1)
23
Figure 2
3 6 2 4 7 2
0
1
2
3
4
5
A g e (H o u rs )
Pla
sm
a g
luc
os
e
co
nc
en
tra
tio
n (
mm
ol/
L)
M e an
+ S D
-S D
n = 2 0 0
24
Figure 3
<1.3
9
1.3
9-1
.6
1.6
6-1
.89
1.9
4-2
.16
2.2
2-2
.44
2.4
-2.7
1
>2.7
1
0
5 0
1 0 0
1 5 0
P la s m a g lu c o s e c o n c e n tra tio n (m m o l/L )
Dis
trib
uti
on
at
tim
e
of
sa
mp
lin
g
3 h o u r s
6 h o u r s
2 4 h o u r s
7 2 h o u r s
A g e
n = 2 0 0