Embed Size (px)
Citation preview

WHAT IS DEFECT ?
Price of Non-Conformance

WHAT DO YOU THINK ABOUT?
1. Missing the key input product
2. Getting the wrong information from buyer
3. Passing the incomplete and inaccurate information to vendors (factories)
4. Lack of communication during the product development in Pre-Production and production dept.
5. Delay in reply during the materialization of enquiries to orders.
6. Non-availability of product specification
7. Not checking the product as per agreed specifications.
8. Not sharing the customer specification to vendors (factories)
9. Communicating the wrong production status of product
10. Do not forecast any delay during production and accordingly do not update the buyer.
11. No need to optimize the resources
12. Fire everyone from QC deptt. to avoid inspection.

QUALITY COSTS
The term “Quality Costs” is associated solely with defective product
a) the costs of making defective products
b) the costs of finding defective products
c) the costs of repairing defective products
d) the costs of avoiding defects
Cost of Quality is generally known as the sum of costs incurred to
prevent non-conformances and the costs incurred when non-
conformance in products and system occurs.

CATEOGIRES OF COST OF QUALITY
COST OF QUALITY
Cost of Non-ConformanceCost of Poor Quality
Cost of Conformance
External FailureCosts
Internal FailureCosts
AppraisalCosts
Prevention Costs
COST OF CONFORMANCE
The cost of doing things right the first time.
The cost of Prevention and Appraisal.
The cost incurred in efforts to maintain and improve quality.

COST OF CONFORMANCE
The cost incurred in order to maintain or improve quality.
1. PREVENTION COSTS
2. APPRAISAL COSTS

PREVENTION COSTS
Costs of all activities associated with reducing / preventing failures
or improving quality.
There are the costs of any action taken to investigate, prevent or
reduce the risk of non-conformity or defect.

EXAMPLES OF PREVENTION COSTS
Quality Training
Vendor Assurance / Rating
Quality Improvement Programs
Planning and Writing of Procedures and Instructions.
Collection, Analysis and Reporting of Quality Data
Design Review/New-Product Review
Design Qualification Tests
Quality Planning
Marketing Surveys/Research
Contract Review
Process Validation
Preventive Maintenance
SPC/Process Control
QA functions and salaries
Improvement Projects

APPRAISAL COSTS
Costs of all activities associated with measuring, evaluating or
auditing the conformance of product to quality requirements.
Costs of all activities incurred to discover the condition of the
product, mainly during the “first time though”.
These are the costs of evaluating the achievement of quality
requirements including the cost of verification and control
performed at any stage of the quality loop.

EXAMPLES OF APPRAISAL COSTS In-coming Inspection
In-process Inspection
Final Testing and Inspection
Production Trials
Field Performance Tests
Calibration
Laboratory Expenses
Third Party Product Cost
Review of Test and Inspection Data
Certification Cost
Product and Service Quality Audits
Qualification of Supplier product
QC Function Salaries and Expenditure

COST OF NON-CONFORMANCE
The costs of internal and external failures.
The cost resulting from products or services not conforming to
customer/user requirements.
The cost incurved as a result of things not being done right the first
time.

COST OF NON-CONFORMANCE
The costs incurred due to non-conformance in product or service prior and after shipment
1. INTERNAL FAILURE COSTS
2. EXTERNAL FAILURE COSTS

INTERNAL FAILURE COSTS
These are costs which would disappear if no defects existed in the
product prior to shipment to the customer.
The costs resulting from failing to conform to specified
requirement prior to delivery of product or the furnishing of a
customer to the customers.
These are the costs arising within the organization due to non-
conformity or defects at any style of the Quality loop.

EXAMPLES OF INTERNAL FAILURE COSTS
Rework
Scrape/Rejects
Downtime
Sub-contractors Faults
Replacement of Purchase Materials
Defect/Failure Analysis
Re-inspection and Re-testing
Down grading
Accidents
In proper Invoicing
Disposition Costs
Yield Losses
Excessive Inventory Costs
Overtime Costs Due to Poor Planning
Product/Service Design Failure
Corrective Actions and Redesign

EXTERNAL FAILURE COSTS
These costs resulting from failing to conform to specified
requirements after the delivery.
These costs also would disappear if there were no defects.
These are the costs arising after delivery to the customer due to
non-conformities.

EXAMPLES OF EXTERNAL FAILURE COSTS
Complaints
Warranty Claims
Bad Debt
Returned Material
Concessions / Quality rebate
Loss of sale
Product liability
Penalties
Loss of Customer/user good will (Administration Costs)
Field repairs/reworks
Overdue Accounts receivable
Equipment failure at customer end

MODEL FOR OPTIMUM QUALITY COSTS:
CO
ST P
ER G
OO
D U
NIT
OF
PRO
DU
CT
QUALITY OF CONFORMANCE, %0 100
COSTS OF APPRAISALPLUS PREVENTION
FAILURECOSTS
TOTAL QUALITYCOSTS
TOoo
TOoo
(a) TRADITIONAL PROCESSES

MODEL FOR OPTIMUM QUALITY COSTS:
CO
ST P
ER G
OO
D U
NIT
OF
PRO
DU
CT
QUALITY OF CONFORMANCE, %0 100
COSTS OF APPRAISALPLUS PREVENTION
FAILURECOSTS
TOTAL QUALITYCOSTS
(b) EMERGING PROCESSES

OPTIMUM SEGMENT OF QUALITY COST MODEL
Zone of Improvement Zone of Indifference Zone of High Appraisal
Projects Costs
Failure Costs > 70% Failure Cost ~ 50% Failure Costs < 40%
Prevention < 10% Prevention ~ 10% Appraisal > 50%
Find Break Through If no Profitable Study Cost Per Defect
Projects; Pursue Projects can be Found, Detected, Verify Validity of
Shift Emphasis to Control Standards; Reduce
Inspection; Try Audit of
Decisions
TOTAL QUALITY COSTS
OPTIMUM
100% Defective Quality of Conformance 100% Good

QUALITY COSTS DATA SOURCES
1. Established accounts
2. Analysis of ingredients of established accounts
3. Basic accounting documents
4. Estimates
a) Temporary records
b) Work sampling
c) Allocation
d) Standard cost data
e) Opinion of knowledgeable persons

QUANTIFICATION OF COST OFQUALITY (COQ)
Step 1: Source of COC and CONC Data
Production Records
QC Records
Operation Records
Accounting Records
Step 2: Develop and Formulate Accounting Basis
Step 3: Executive Costing of COQ Items
Whole Account
This method requires gathering existing financial data from company accounts. If accounts are set up to capture costs, such as training and rework, information from the accounts can be used to measure COQ.
Unit Pricing
This method is effective when a defect or problem is recurring. To use defect pricing, simply multiply the cost of one defective unit by number of defective units.

QUANTIFICATION OF COST OFQUALITY (COQ)
Whole Person
This method is used when people are employed is recurring. To use purpose of working on or handling defects.
Labour / Resource Claiming
This method involves calculating actual expenditure on a specific activity, such as the amount of time spent by an employee performing a task or the amount of financial outlay for a one-time expense. This information might come from time sheet, vouchers or any other method for determining exactly how much was spent.

INTREPRETATION AND PRESENTATION TO MANAGEMENT
Quality Costs as a percent of Sales
= Total Quality Costs x 100
Net Sales
Quality Costs Compared to Profit
= Total Quality Costs x 100
Net Profit
Quality Costs compared to the magnitude of current problems in
terms of
a) number of employees
b) number of inventory items.
c) space

INTREPRETATION AND PRESENTATION TO MANAGEMENT
Quality Costs as a percent of Manufacturing Costs
= Total Quality Costs x 100
Total manufacturing Costs

EXERCISE NO. 2

SAMPLE COST OF QUALITY SHEET
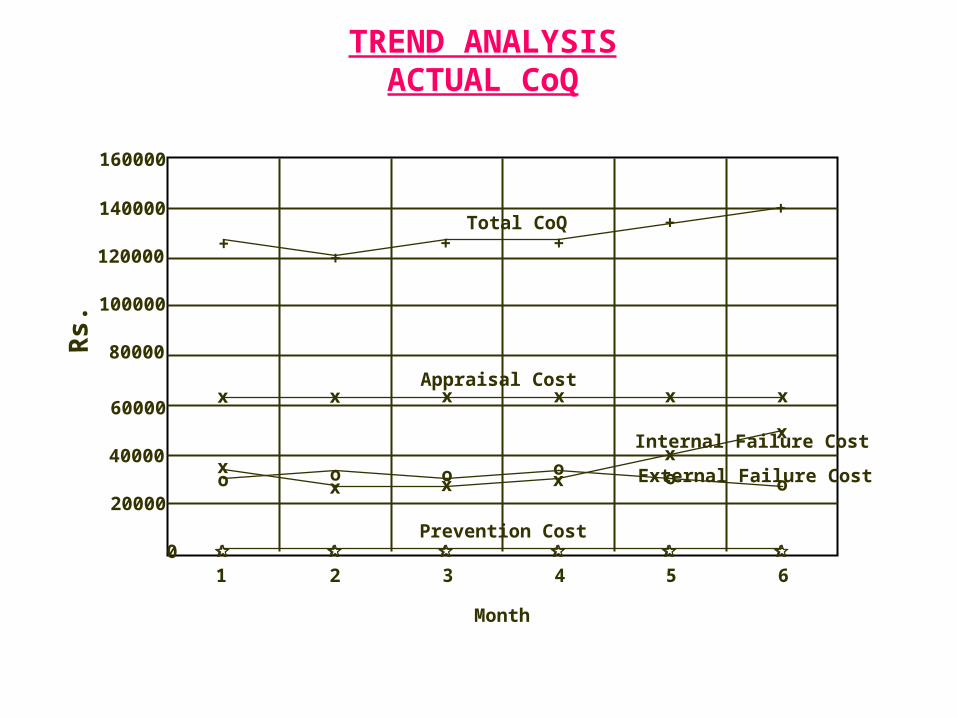
TREND ANALYSISACTUAL CoQ
160000
140000
120000
100000
80000
60000
40000
20000
0
++
x
x
o
x
o
x
+ ++
+
x x x x
1 2 3 4 5 6
oxox o
x
o
x
Prevention Cost
Appraisal Cost
Total CoQ
Internal Failure Cost
External Failure Cost
Month
Rs.

TREND ANALYSISCoQ as %age of Sales
0
++
x
x
o
x
o
x
++
+ +
x x x x
1 2 3 4 5 6
oxox
ox
o
x
Prevention Cost
Appraisal Cost
Total CoQ
Internal Failure Cost
External Failure Cost
Months
%ag
e of
Sal
es
1
2
3
4
5
6
7
8
9