Embed Size (px)
Citation preview
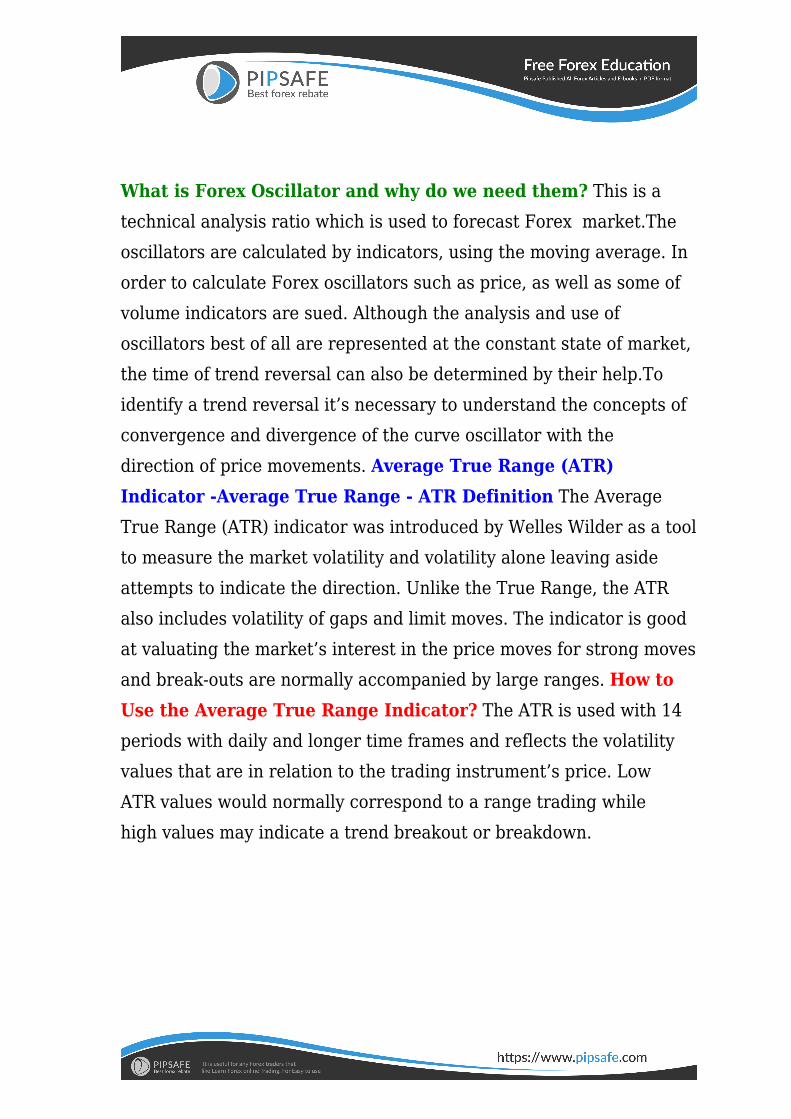
What is Forex Oscillator and why do we need them? This is atechnical analysis ratio which is used to forecast Forex market.Theoscillators are calculated by indicators, using the moving average. Inorder to calculate Forex oscillators such as price, as well as some ofvolume indicators are sued. Although the analysis and use ofoscillators best of all are represented at the constant state of market,the time of trend reversal can also be determined by their help.Toidentify a trend reversal it’s necessary to understand the concepts ofconvergence and divergence of the curve oscillator with thedirection of price movements. Average True Range (ATR)Indicator -Average True Range - ATR Definition The AverageTrue Range (ATR) indicator was introduced by Welles Wilder as a toolto measure the market volatility and volatility alone leaving asideattempts to indicate the direction. Unlike the True Range, the ATRalso includes volatility of gaps and limit moves. The indicator is goodat valuating the market’s interest in the price moves for strong movesand break-outs are normally accompanied by large ranges. How toUse the Average True Range Indicator? The ATR is used with 14periods with daily and longer time frames and reflects the volatilityvalues that are in relation to the trading instrument’s price. LowATR values would normally correspond to a range trading whilehigh values may indicate a trend breakout or breakdown.
AverAge True rAnge (ATr) IndIcATor cAlculATIon Average TrueRange is a moving average of the True Range which is the greatest ofthe following three values: • The distance from today’s high totoday’s low. • The distance from yesterday’s close to today’s high. •The distance from yesterday’s close to today’s low. Bollinger BandIndicator (How to Use Bollinger Bands) PurPose The BollingerBands indicator (named after its inventor) displays the currentmarket volatility changes, confirms the direction, warns of a possiblecontinuation or break-out of the trend, periods of consolidation,increasing volatility for break-outs as well as pinpoints local highsand lows. usAge (How to Use Bollinger Bands in Forex) Theindicator consists of the three moving averages: • Upper band - 20-day simple moving average (SMA) plus double standard pricedeviation. • Middle band - 20-day SMA. • Lower band - 20-day SMAminus double standard price deviation. The increasing distancebetween the upper and the lower bands while volatility is growing,suggests of a price developing in a trend which direction correlateswith the direction of the Middle line. In contrast to the above, at
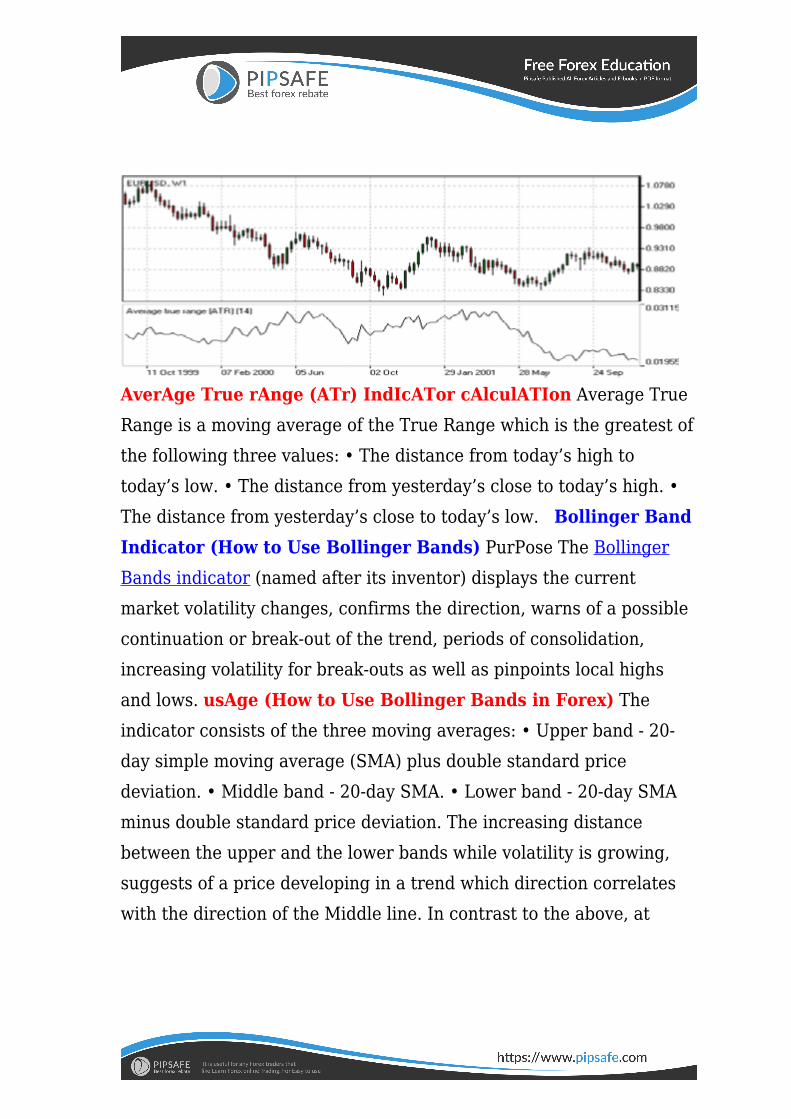
times of decreasing volatility when the bands are closing in, weshould be expecting the price to move side wards in a range.
The price moving outside the Bands may indicate either the trend’scontinuation (when the bands are floating apart as the volatilityincreases) or the U-turn of the trend if the initialmovement is exhausted. Either way each of the scenarios must beconfirmed by other indicators such as RSI,ADX or MACD. Anyhow theprice crossing of the Middle line from below or above may beinterpreted as a signal to buy or to sell respectively. BollInger BAndIndIcATor cAlculATIon (Bollinger Bands Indicator To trading)The middle line (ML) is a regular Moving Average: ML = SUM[CLOSE, N]/N The top line (TL) is ML a deviation (D) higher: TL =ML + (D*StdDev) The bottom line (BL) is ML a deviation (D) lower.BL = ML — (D*StdDev) Commodity Channel Index (CCI)Indicator (How to Use the CCI Indicator) PurPose TheCommodity Channel Index is an indicator by Donald Lambert. Despitethe original purpose to identify new trends, it’s nowadays widely usedto measure the current price levels in relation to the average one.usAge (How to Trade CCI in Forex Market) The indicator
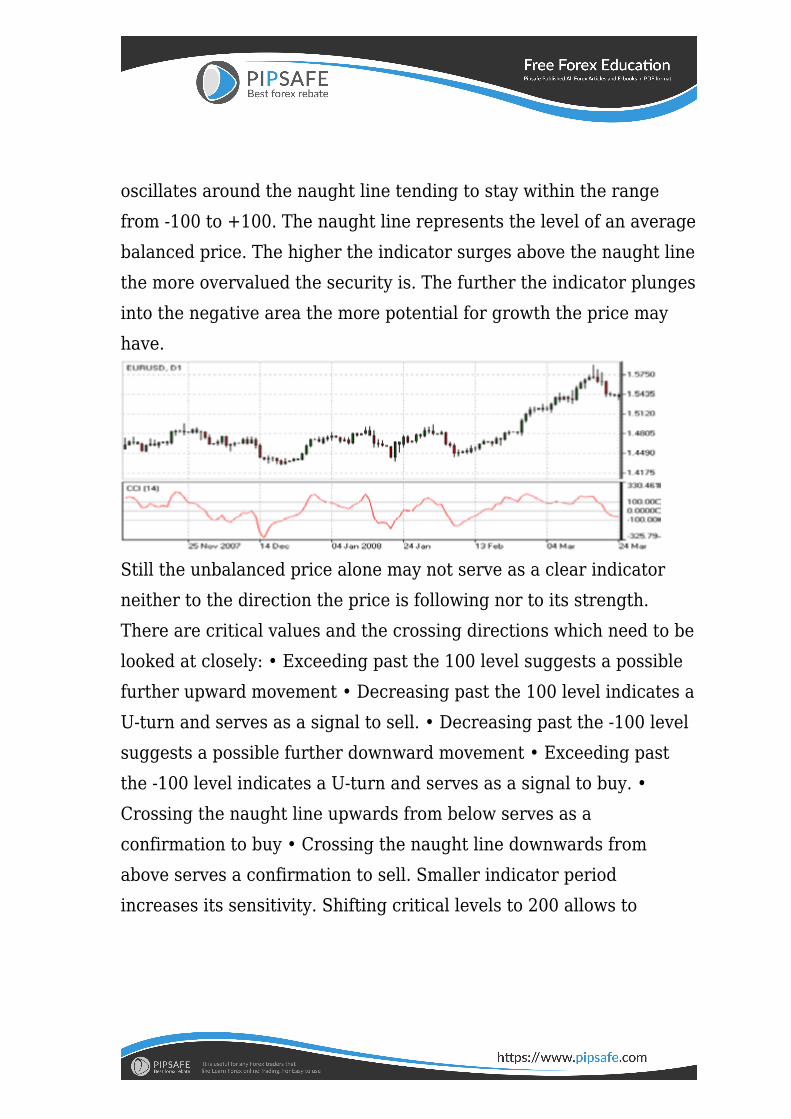
oscillates around the naught line tending to stay within the rangefrom -100 to +100. The naught line represents the level of an averagebalanced price. The higher the indicator surges above the naught linethe more overvalued the security is. The further the indicator plungesinto the negative area the more potential for growth the price mayhave.
Still the unbalanced price alone may not serve as a clear indicatorneither to the direction the price is following nor to its strength.There are critical values and the crossing directions which need to belooked at closely: • Exceeding past the 100 level suggests a possiblefurther upward movement • Decreasing past the 100 level indicates aU-turn and serves as a signal to sell. • Decreasing past the -100 levelsuggests a possible further downward movement • Exceeding pastthe -100 level indicates a U-turn and serves as a signal to buy. •Crossing the naught line upwards from below serves as aconfirmation to buy • Crossing the naught line downwards fromabove serves a confirmation to sell. Smaller indicator periodincreases its sensitivity. Shifting critical levels to 200 allows to
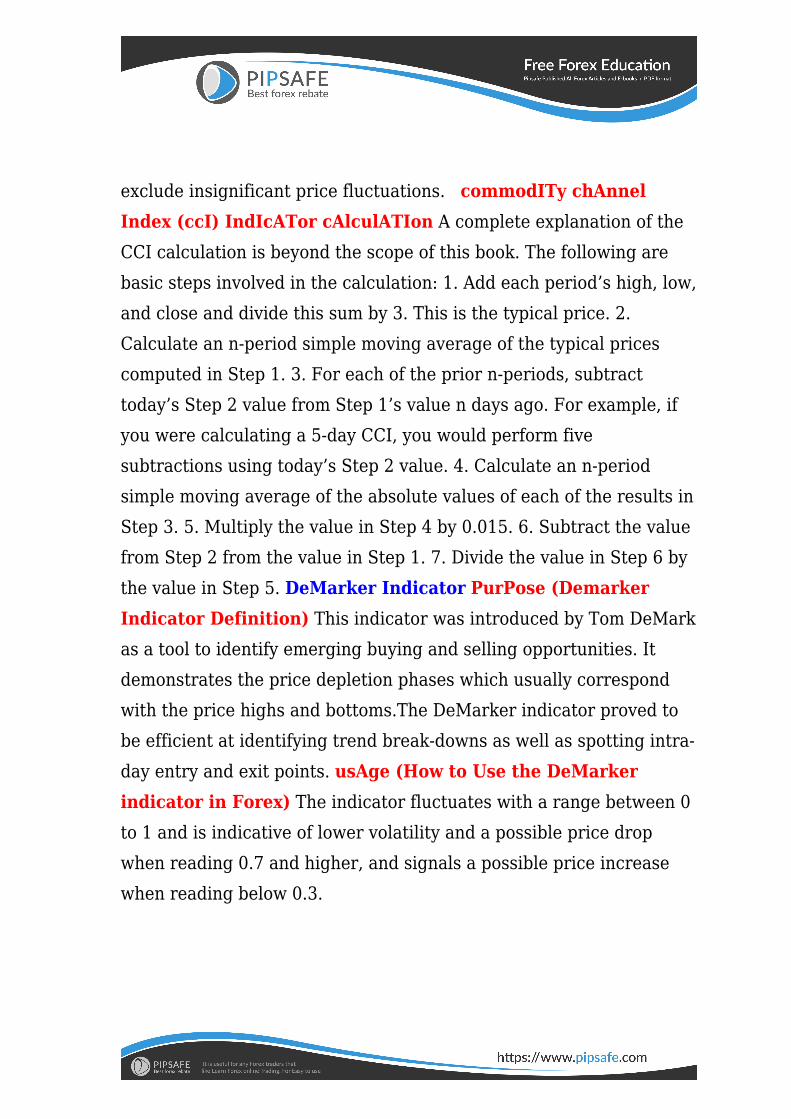
exclude insignificant price fluctuations. commodITy chAnnelIndex (ccI) IndIcATor cAlculATIon A complete explanation of theCCI calculation is beyond the scope of this book. The following arebasic steps involved in the calculation: 1. Add each period’s high, low,and close and divide this sum by 3. This is the typical price. 2.Calculate an n-period simple moving average of the typical pricescomputed in Step 1. 3. For each of the prior n-periods, subtracttoday’s Step 2 value from Step 1’s value n days ago. For example, ifyou were calculating a 5-day CCI, you would perform fivesubtractions using today’s Step 2 value. 4. Calculate an n-periodsimple moving average of the absolute values of each of the results inStep 3. 5. Multiply the value in Step 4 by 0.015. 6. Subtract the valuefrom Step 2 from the value in Step 1. 7. Divide the value in Step 6 bythe value in Step 5. DeMarker Indicator PurPose (DemarkerIndicator Definition) This indicator was introduced by Tom DeMarkas a tool to identify emerging buying and selling opportunities. Itdemonstrates the price depletion phases which usually correspondwith the price highs and bottoms.The DeMarker indicator proved tobe efficient at identifying trend break-downs as well as spotting intra-day entry and exit points. usAge (How to Use the DeMarkerindicator in Forex) The indicator fluctuates with a range between 0to 1 and is indicative of lower volatility and a possible price dropwhen reading 0.7 and higher, and signals a possible price increasewhen reading below 0.3.
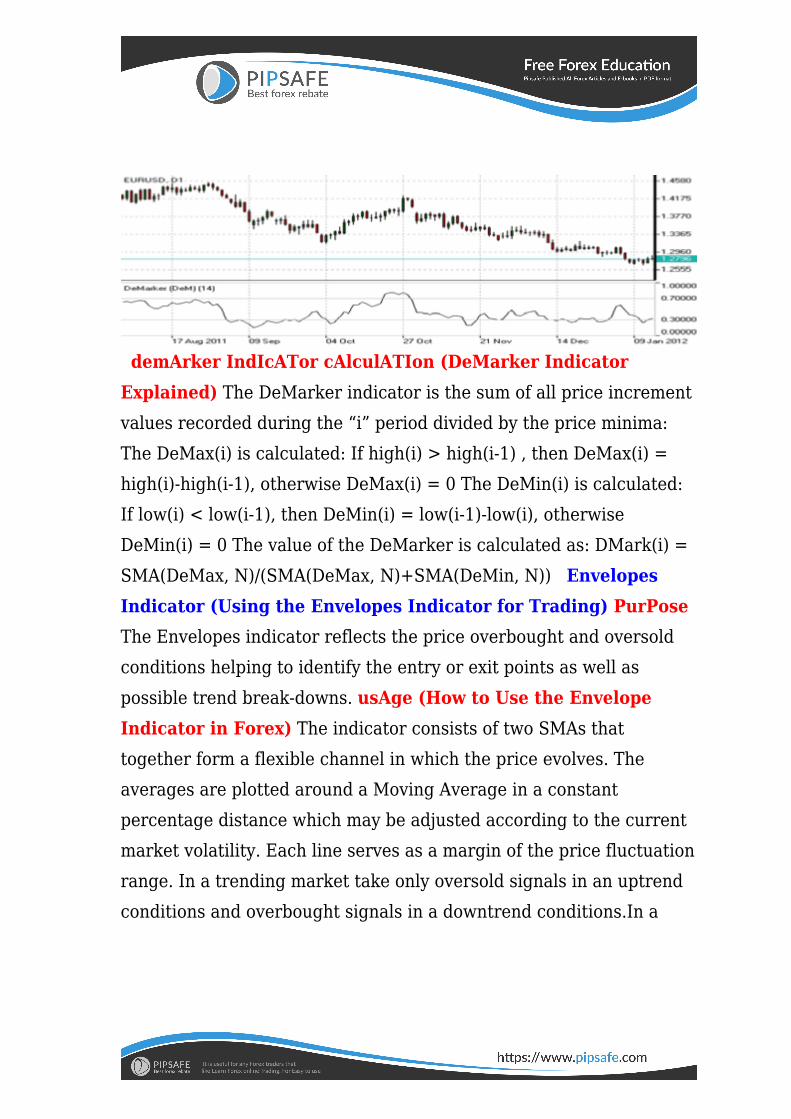
demArker IndIcATor cAlculATIon (DeMarker IndicatorExplained) The DeMarker indicator is the sum of all price incrementvalues recorded during the “i” period divided by the price minima:The DeMax(i) is calculated: If high(i) > high(i-1) , then DeMax(i) =high(i)-high(i-1), otherwise DeMax(i) = 0 The DeMin(i) is calculated:If low(i) < low(i-1), then DeMin(i) = low(i-1)-low(i), otherwiseDeMin(i) = 0 The value of the DeMarker is calculated as: DMark(i) =SMA(DeMax, N)/(SMA(DeMax, N)+SMA(DeMin, N)) EnvelopesIndicator (Using the Envelopes Indicator for Trading) PurPoseThe Envelopes indicator reflects the price overbought and oversoldconditions helping to identify the entry or exit points as well aspossible trend break-downs. usAge (How to Use the EnvelopeIndicator in Forex) The indicator consists of two SMAs thattogether form a flexible channel in which the price evolves. Theaverages are plotted around a Moving Average in a constantpercentage distance which may be adjusted according to the currentmarket volatility. Each line serves as a margin of the price fluctuationrange. In a trending market take only oversold signals in an uptrendconditions and overbought signals in a downtrend conditions.In a
ranging market the price reaching the top line serves as a sell signal,while the price at the lower line generates a signal to buy.
enveloPes IndIcATor cAlculATIon Upper Band = SMA(CLOSE,N)*[1+K/1000] Lower Band = SMA(CLOSE, N)*[1-K/1000] Where:SMA — Simple Moving Average; N — averaging period; K/1000 — thevalue of shifting from the average (measured in basis points). ForceIndex Indicator - How to Day Trade with the Force IndexPurPose The Force Index indicator invented by Alexander Eldermeasures the power behind every price move based on their threeessential elements, e.g., direction, extent and volume. The oscillatorfluctuates around the zero, i.e., a point of a relative balance betweenpower shifts. usAge (How to Use Force Index Indicator) TheForce Index allows to identify the reinforcement of different timescale trends: • The indicator should be made more sensitive bydecreasing its period for short trends. • The indicator should besmoothed by increasing its period for longer trends. • The ForceIndex may strongly imply a trend change: • Break-down of an uptrendwhen the indicator’s value is changing from positive to negative andprice and indicator show divergence. • Break-down of a downtrend
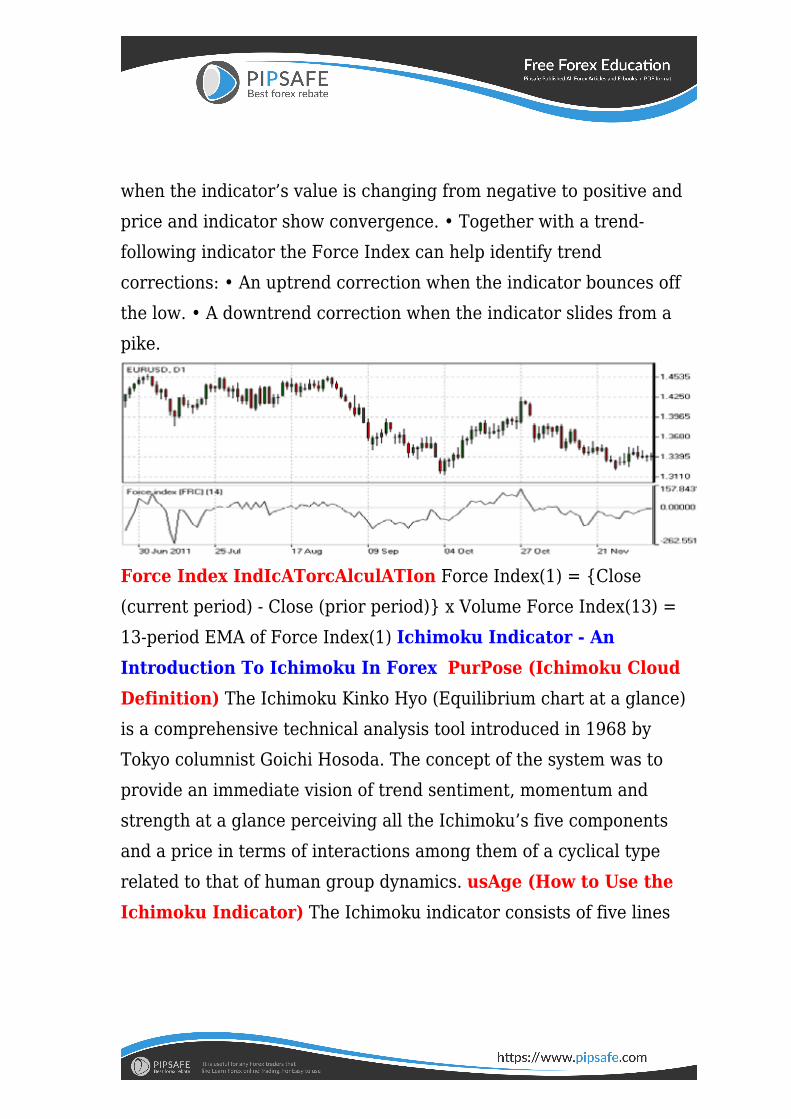
when the indicator’s value is changing from negative to positive andprice and indicator show convergence. • Together with a trend-following indicator the Force Index can help identify trendcorrections: • An uptrend correction when the indicator bounces offthe low. • A downtrend correction when the indicator slides from apike.
Force Index IndIcATorcAlculATIon Force Index(1) = {Close(current period) - Close (prior period)} x Volume Force Index(13) =13-period EMA of Force Index(1) Ichimoku Indicator - AnIntroduction To Ichimoku In Forex PurPose (Ichimoku CloudDefinition) The Ichimoku Kinko Hyo (Equilibrium chart at a glance)is a comprehensive technical analysis tool introduced in 1968 byTokyo columnist Goichi Hosoda. The concept of the system was toprovide an immediate vision of trend sentiment, momentum andstrength at a glance perceiving all the Ichimoku’s five componentsand a price in terms of interactions among them of a cyclical typerelated to that of human group dynamics. usAge (How to Use theIchimoku Indicator) The Ichimoku indicator consists of five lines
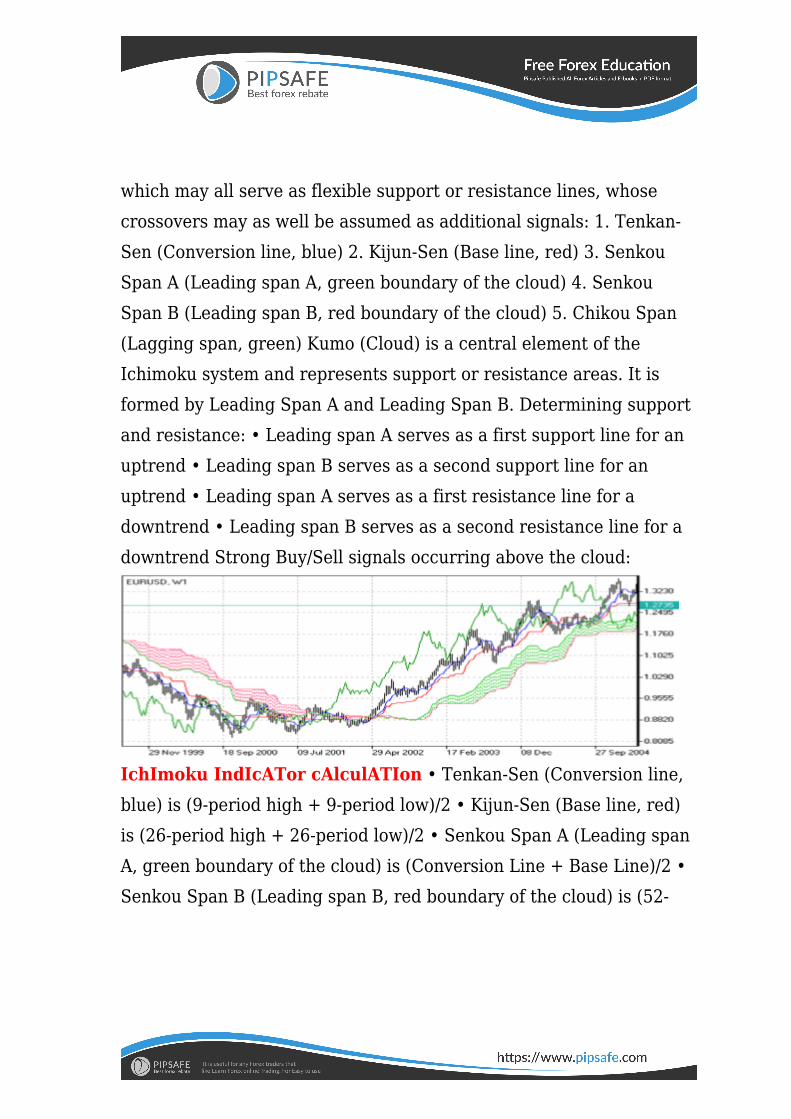
which may all serve as flexible support or resistance lines, whosecrossovers may as well be assumed as additional signals: 1. Tenkan-Sen (Conversion line, blue) 2. Kijun-Sen (Base line, red) 3. SenkouSpan A (Leading span A, green boundary of the cloud) 4. SenkouSpan B (Leading span B, red boundary of the cloud) 5. Chikou Span(Lagging span, green) Kumo (Cloud) is a central element of theIchimoku system and represents support or resistance areas. It isformed by Leading Span A and Leading Span B. Determining supportand resistance: • Leading span A serves as a first support line for anuptrend • Leading span B serves as a second support line for anuptrend • Leading span A serves as a first resistance line for adowntrend • Leading span B serves as a second resistance line for adowntrend Strong Buy/Sell signals occurring above the cloud:
IchImoku IndIcATor cAlculATIon • Tenkan-Sen (Conversion line,blue) is (9-period high + 9-period low)/2 • Kijun-Sen (Base line, red)is (26-period high + 26-period low)/2 • Senkou Span A (Leading spanA, green boundary of the cloud) is (Conversion Line + Base Line)/2 •Senkou Span B (Leading span B, red boundary of the cloud) is (52-
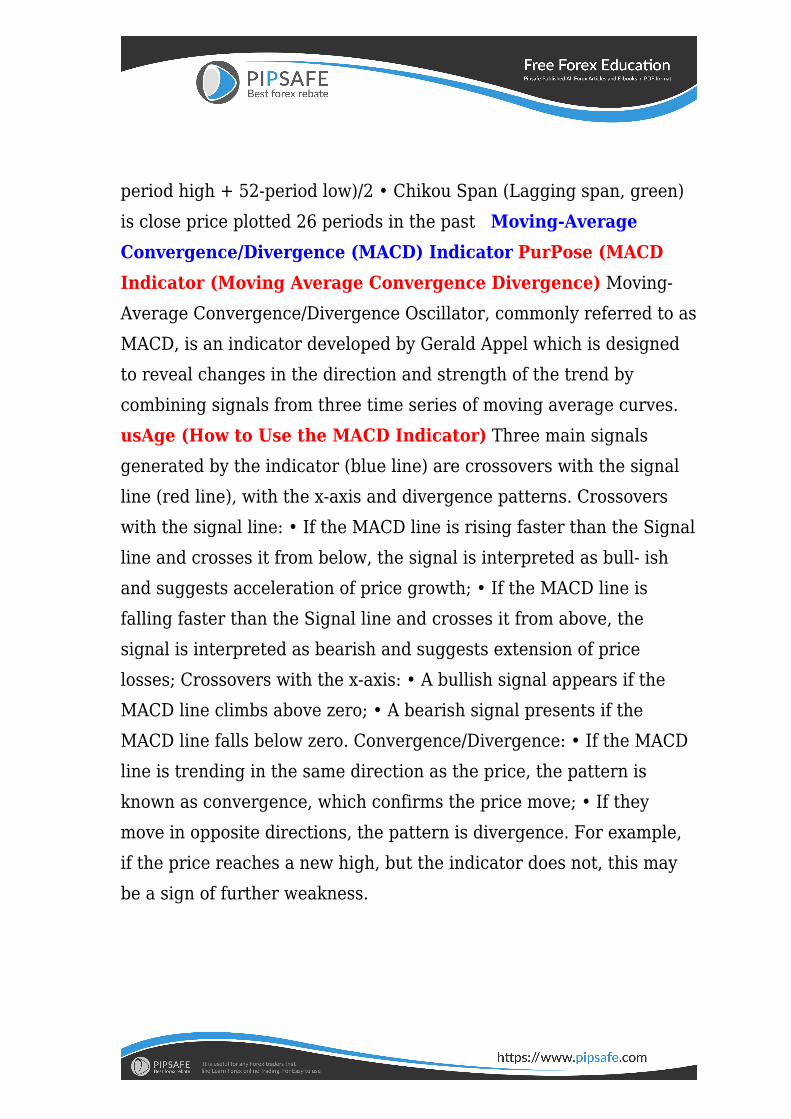
period high + 52-period low)/2 • Chikou Span (Lagging span, green)is close price plotted 26 periods in the past Moving-AverageConvergence/Divergence (MACD) Indicator PurPose (MACDIndicator (Moving Average Convergence Divergence) Moving-Average Convergence/Divergence Oscillator, commonly referred to asMACD, is an indicator developed by Gerald Appel which is designedto reveal changes in the direction and strength of the trend bycombining signals from three time series of moving average curves.usAge (How to Use the MACD Indicator) Three main signalsgenerated by the indicator (blue line) are crossovers with the signalline (red line), with the x-axis and divergence patterns. Crossoverswith the signal line: • If the MACD line is rising faster than the Signalline and crosses it from below, the signal is interpreted as bull- ishand suggests acceleration of price growth; • If the MACD line isfalling faster than the Signal line and crosses it from above, thesignal is interpreted as bearish and suggests extension of pricelosses; Crossovers with the x-axis: • A bullish signal appears if theMACD line climbs above zero; • A bearish signal presents if theMACD line falls below zero. Convergence/Divergence: • If the MACDline is trending in the same direction as the price, the pattern isknown as convergence, which confirms the price move; • If theymove in opposite directions, the pattern is divergence. For example,if the price reaches a new high, but the indicator does not, this maybe a sign of further weakness.
movIng-AverAge convergence/dIvergence (mAcd)oscIllATorcAlculATIon MACD line = 12-period EMA – 26-period EMASignal line = 9-period EMA Histogram = MACD line – Signal lineMomentum Indicator - Momentum Indicator Explained PurPoseMomentum is an indicator that shows trend direction and measureshow quickly the price is changing by com- paring current and pastprices. usAge (How to Use Momentum Indicators) The indicatoris represented by a line, which oscillates around 100. Being anoscillator, momentum should be used within price trend analysis.Crossing the x-axis: • It is believed that if the indicator climbs above100 during an uptrend, it is a bullish signal; • Otherwise if theindicator falls below 100 during a downtrend, a bearish signalappears. Falling out of its normal range: • Extreme points mean thatthe price has posted its strongest gain or loss for a particular numberof moving periods, supporting trend strength; • At the same time ifthe price movement was too rapid, they may indicate possibleoverbought and oversold areas. Divergence patterns: • If the pricehits a new high, but the indicator does not, that could mean thatinvestor sentiment is actually lower; • And on the contrary if the
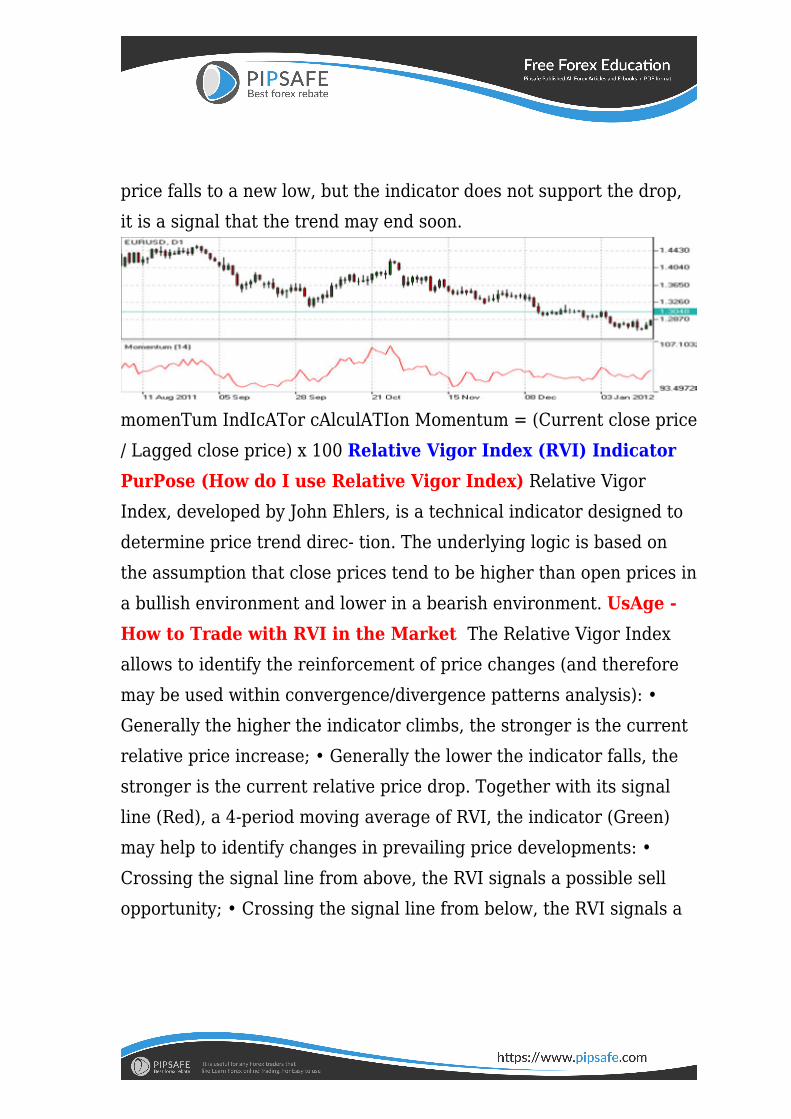
price falls to a new low, but the indicator does not support the drop,it is a signal that the trend may end soon.
momenTum IndIcATor cAlculATIon Momentum = (Current close price/ Lagged close price) x 100 Relative Vigor Index (RVI) IndicatorPurPose (How do I use Relative Vigor Index) Relative VigorIndex, developed by John Ehlers, is a technical indicator designed todetermine price trend direc- tion. The underlying logic is based onthe assumption that close prices tend to be higher than open prices ina bullish environment and lower in a bearish environment. UsAge -How to Trade with RVI in the Market The Relative Vigor Indexallows to identify the reinforcement of price changes (and thereforemay be used within convergence/divergence patterns analysis): •Generally the higher the indicator climbs, the stronger is the currentrelative price increase; • Generally the lower the indicator falls, thestronger is the current relative price drop. Together with its signalline (Red), a 4-period moving average of RVI, the indicator (Green)may help to identify changes in prevailing price developments: •Crossing the signal line from above, the RVI signals a possible sellopportunity; • Crossing the signal line from below, the RVI signals a
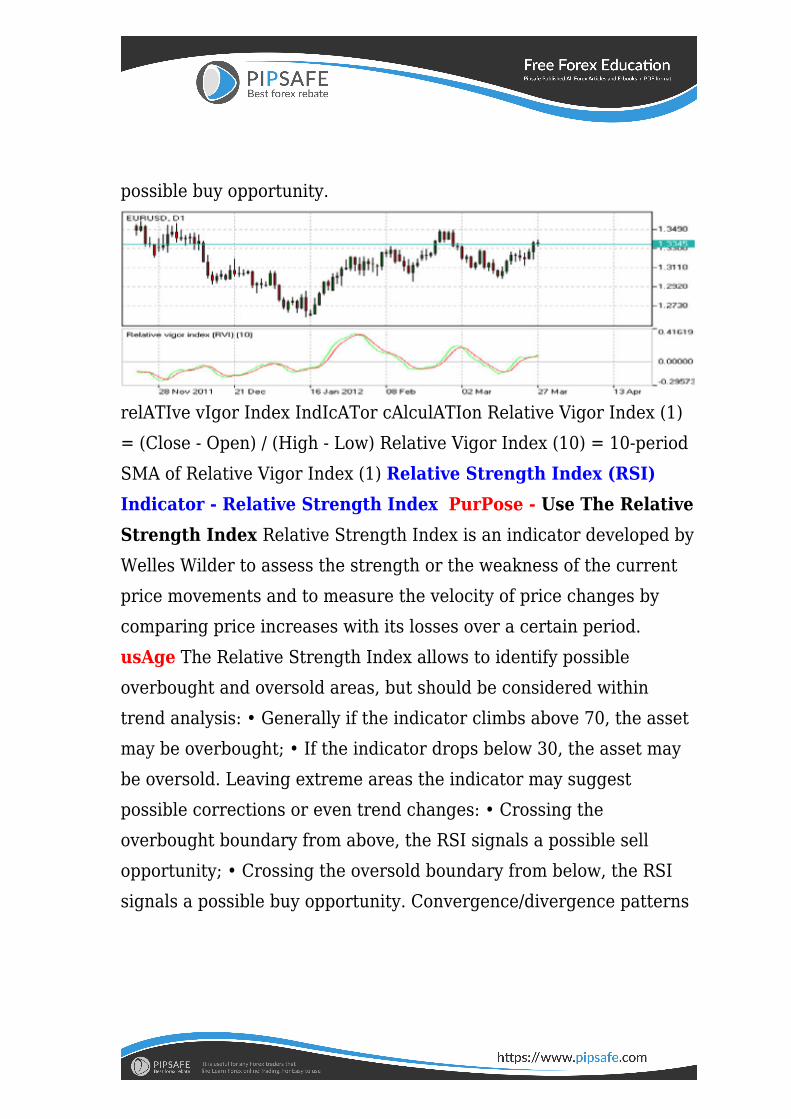
possible buy opportunity.
relATIve vIgor Index IndIcATor cAlculATIon Relative Vigor Index (1)= (Close - Open) / (High - Low) Relative Vigor Index (10) = 10-periodSMA of Relative Vigor Index (1) Relative Strength Index (RSI)Indicator - Relative Strength Index PurPose - Use The RelativeStrength Index Relative Strength Index is an indicator developed byWelles Wilder to assess the strength or the weakness of the currentprice movements and to measure the velocity of price changes bycomparing price increases with its losses over a certain period.usAge The Relative Strength Index allows to identify possibleoverbought and oversold areas, but should be considered withintrend analysis: • Generally if the indicator climbs above 70, the assetmay be overbought; • If the indicator drops below 30, the asset maybe oversold. Leaving extreme areas the indicator may suggestpossible corrections or even trend changes: • Crossing theoverbought boundary from above, the RSI signals a possible sellopportunity; • Crossing the oversold boundary from below, the RSIsignals a possible buy opportunity. Convergence/divergence patterns
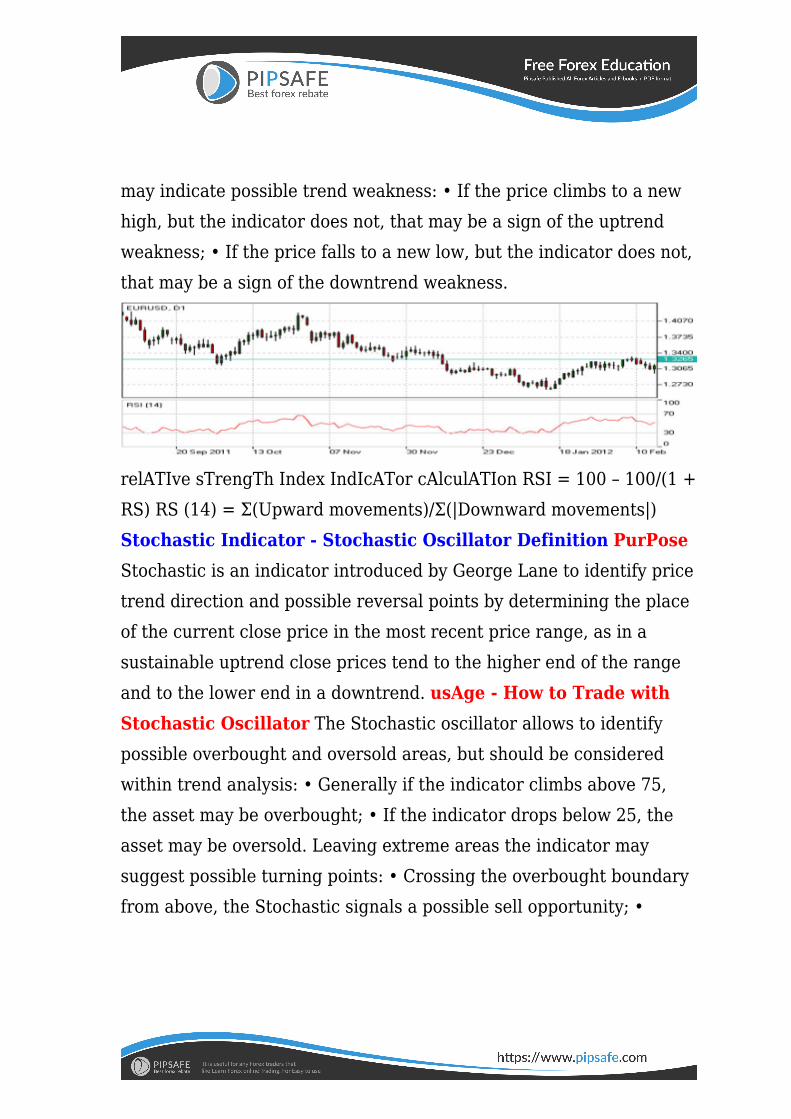
may indicate possible trend weakness: • If the price climbs to a newhigh, but the indicator does not, that may be a sign of the uptrendweakness; • If the price falls to a new low, but the indicator does not,that may be a sign of the downtrend weakness.
relATIve sTrengTh Index IndIcATor cAlculATIon RSI = 100 – 100/(1 +RS) RS (14) = Σ(Upward movements)/Σ(|Downward movements|)Stochastic Indicator - Stochastic Oscillator Definition PurPoseStochastic is an indicator introduced by George Lane to identify pricetrend direction and possible reversal points by determining the placeof the current close price in the most recent price range, as in asustainable uptrend close prices tend to the higher end of the rangeand to the lower end in a downtrend. usAge - How to Trade withStochastic Oscillator The Stochastic oscillator allows to identifypossible overbought and oversold areas, but should be consideredwithin trend analysis: • Generally if the indicator climbs above 75,the asset may be overbought; • If the indicator drops below 25, theasset may be oversold. Leaving extreme areas the indicator maysuggest possible turning points: • Crossing the overbought boundaryfrom above, the Stochastic signals a possible sell opportunity; •
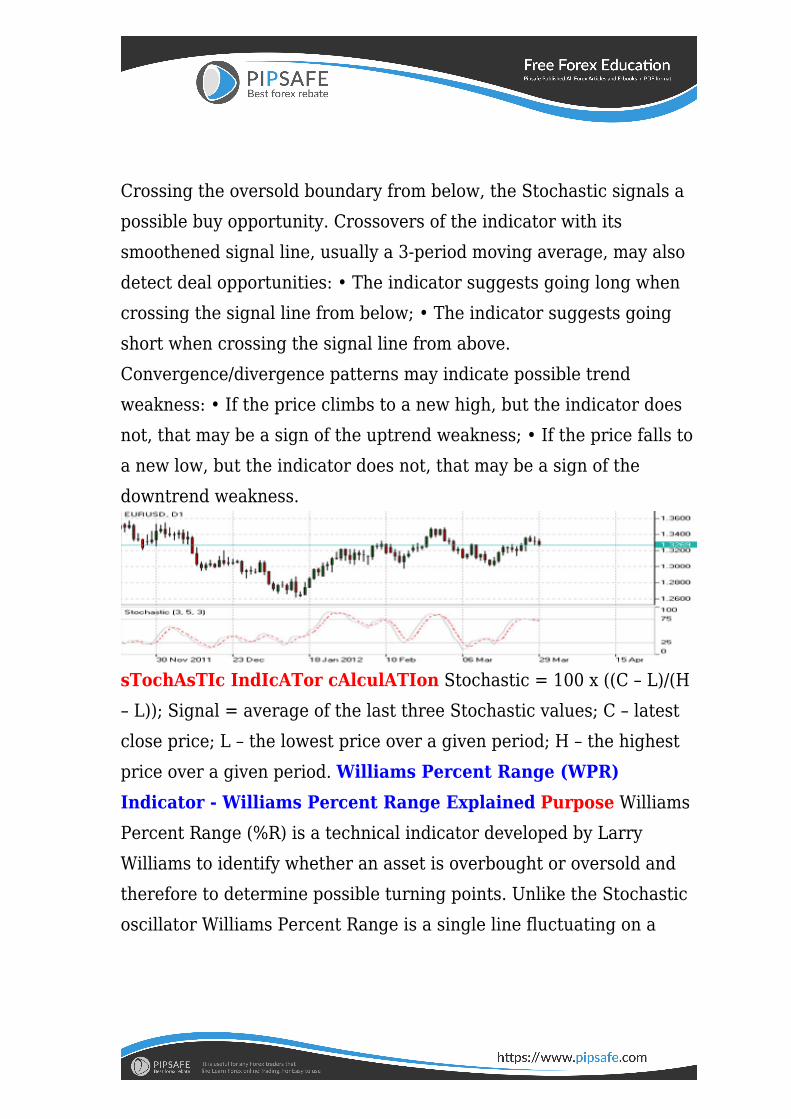
Crossing the oversold boundary from below, the Stochastic signals apossible buy opportunity. Crossovers of the indicator with itssmoothened signal line, usually a 3-period moving average, may alsodetect deal opportunities: • The indicator suggests going long whencrossing the signal line from below; • The indicator suggests goingshort when crossing the signal line from above.Convergence/divergence patterns may indicate possible trendweakness: • If the price climbs to a new high, but the indicator doesnot, that may be a sign of the uptrend weakness; • If the price falls toa new low, but the indicator does not, that may be a sign of thedowntrend weakness.
sTochAsTIc IndIcATor cAlculATIon Stochastic = 100 x ((C – L)/(H– L)); Signal = average of the last three Stochastic values; C – latestclose price; L – the lowest price over a given period; H – the highestprice over a given period. Williams Percent Range (WPR)Indicator - Williams Percent Range Explained Purpose WilliamsPercent Range (%R) is a technical indicator developed by LarryWilliams to identify whether an asset is overbought or oversold andtherefore to determine possible turning points. Unlike the Stochasticoscillator Williams Percent Range is a single line fluctuating on a
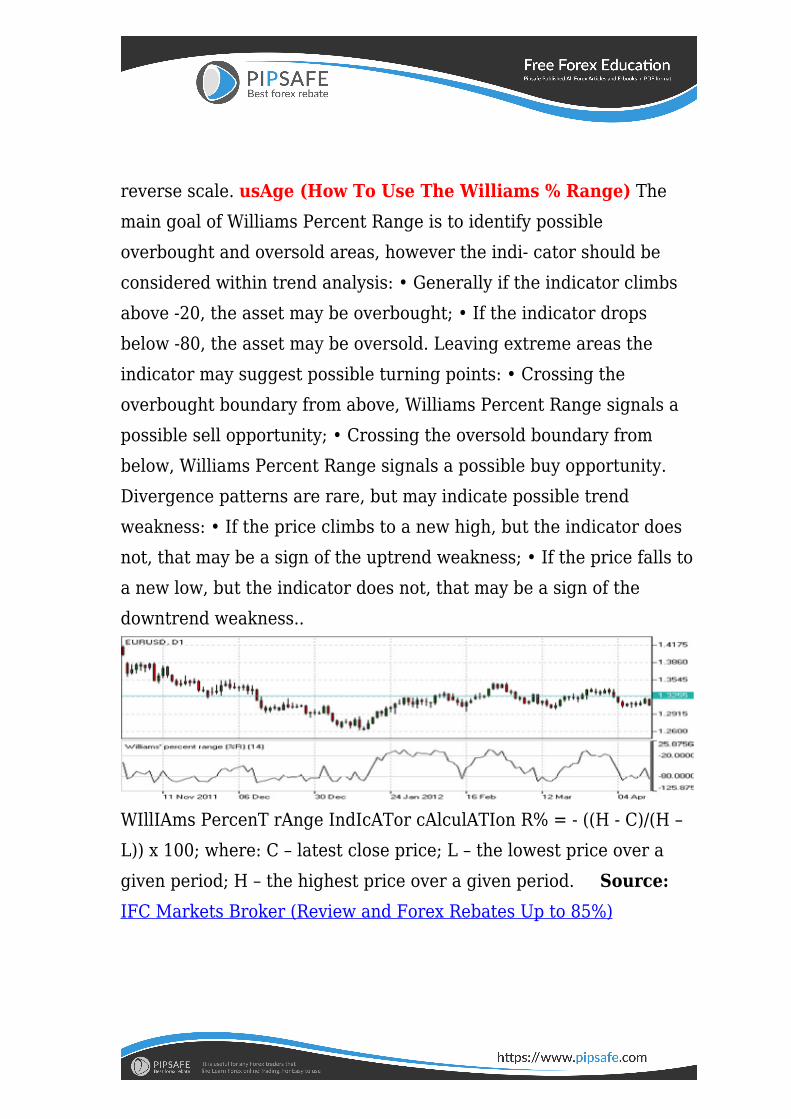
reverse scale. usAge (How To Use The Williams % Range) Themain goal of Williams Percent Range is to identify possibleoverbought and oversold areas, however the indi- cator should beconsidered within trend analysis: • Generally if the indicator climbsabove -20, the asset may be overbought; • If the indicator dropsbelow -80, the asset may be oversold. Leaving extreme areas theindicator may suggest possible turning points: • Crossing theoverbought boundary from above, Williams Percent Range signals apossible sell opportunity; • Crossing the oversold boundary frombelow, Williams Percent Range signals a possible buy opportunity.Divergence patterns are rare, but may indicate possible trendweakness: • If the price climbs to a new high, but the indicator doesnot, that may be a sign of the uptrend weakness; • If the price falls toa new low, but the indicator does not, that may be a sign of thedowntrend weakness..
WIllIAms PercenT rAnge IndIcATor cAlculATIon R% = - ((H - C)/(H –L)) x 100; where: C – latest close price; L – the lowest price over agiven period; H – the highest price over a given period. Source:IFC Markets Broker (Review and Forex Rebates Up to 85%)