Embed Size (px)
Citation preview
MTP-5 data analyze
Anna GnevashevaElena Khavina
Svetlana LisovaMaria Parfenova
Ekaterina Perminova
NABOS-2013
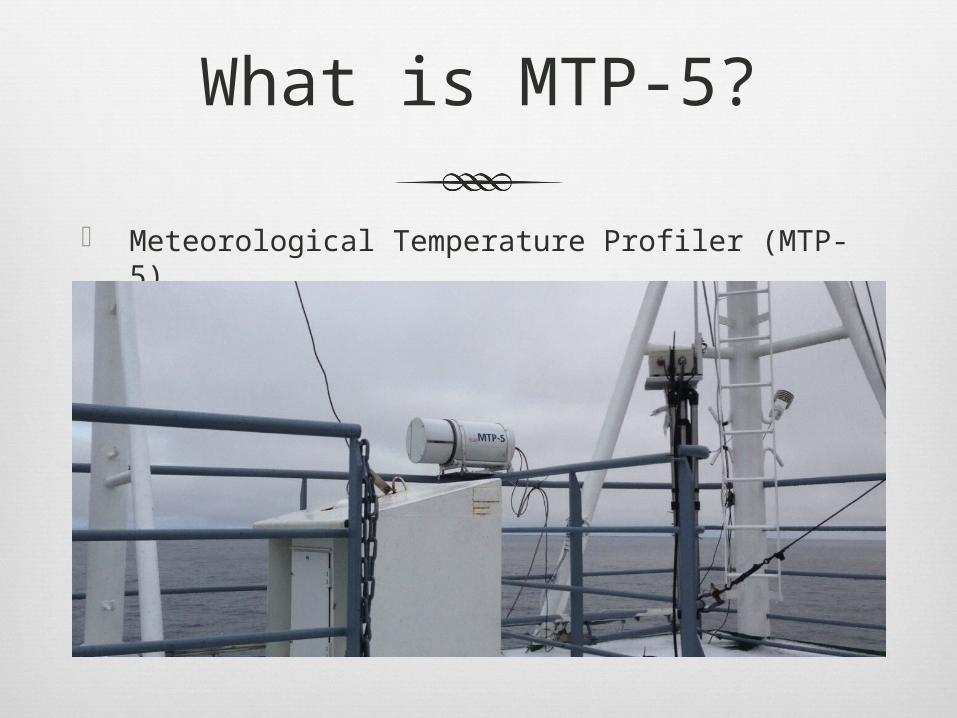
What is MTP-5?
Meteorological Temperature Profiler (MTP-5)
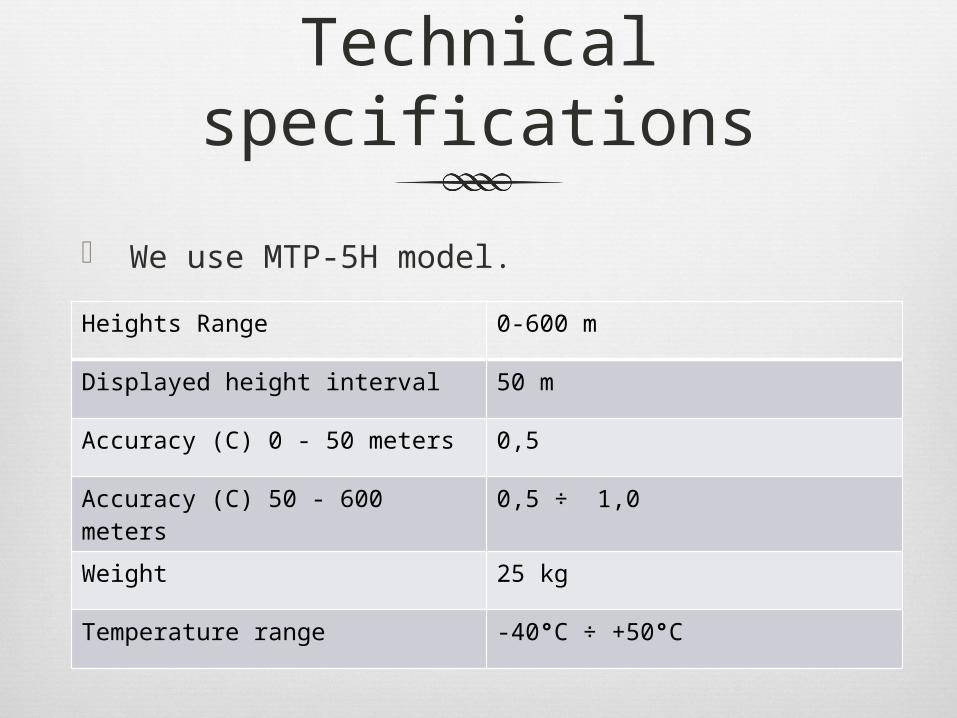
Technical specifications
We use MTP-5H model.
Heights Range 0-600 m
Displayed height interval 50 m
Accuracy (C) 0 - 50 meters 0,5
Accuracy (C) 50 - 600 meters 0,5 ÷ 1,0
Weight 25 kg
Temperature range -40°C ÷ +50°C
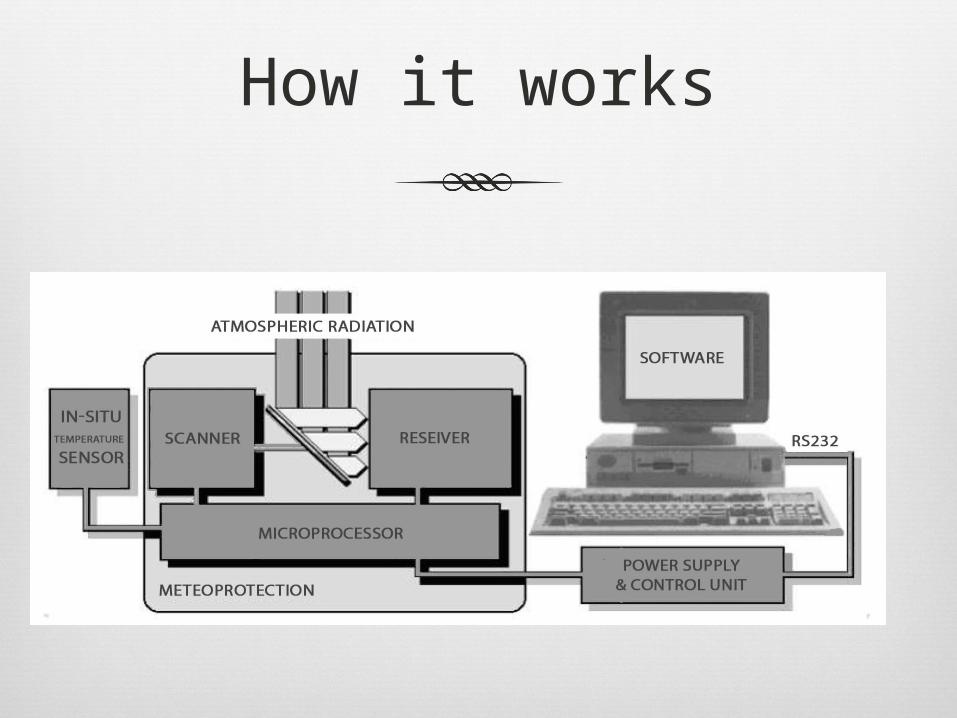
How it works
How it works
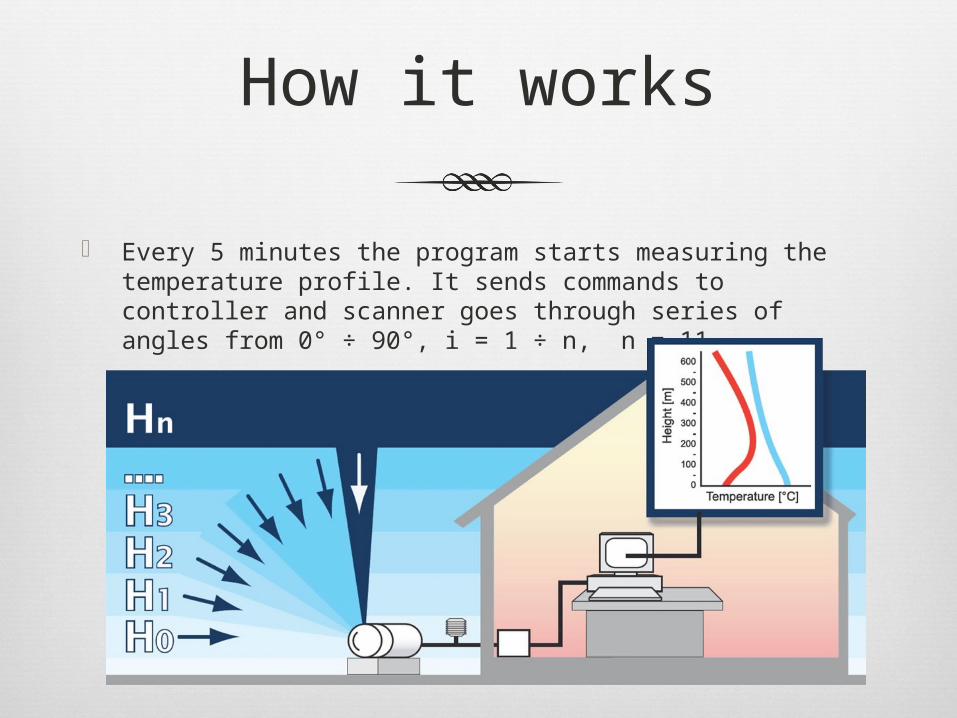
Every 5 minutes the program starts measuring the temperature profile. It sends commands to controller and scanner goes through series of angles from 0° ÷ 90°, i = 1 ÷ n, n = 11.
How it works
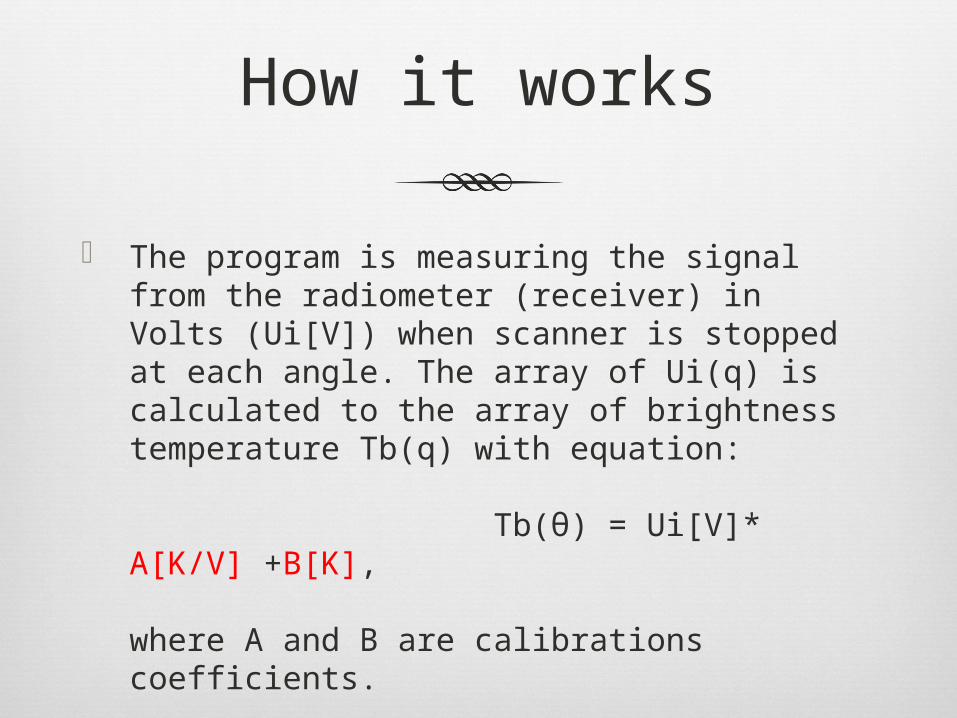
The program is measuring the signal from the radiometer (receiver) in Volts (Ui[V]) when scanner is stopped at each angle. The array of Ui(q) is calculated to the array of brightness temperature Tb(q) with equation:
Tb(θ) = Ui[V]* A[K/V] +B[K],
where A and B are calibrations coefficients.
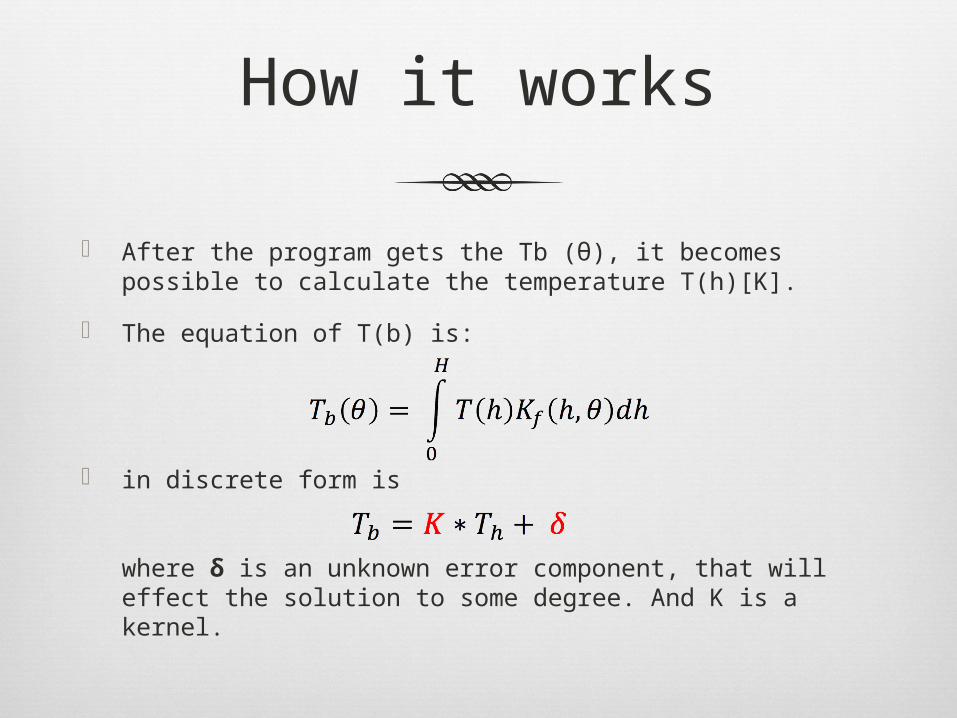
in discrete form is
where δ is an unknown error component, that will effect the solution to some degree. And K is a kernel.
How it works
After the program gets the Tb (θ), it becomes possible to calculate the temperature T(h)[K].
The equation of T(b) is:
How it works
“As the working frequencies chosen in the center of molecular oxygen absorption band, where the attenuation is very high, fog, changes in water vapor density, clouds and weak rain do not influence the measurements. So we have a good T(b).”
MTP-5 official presentation
Is MTP-5 good in cloud weather?
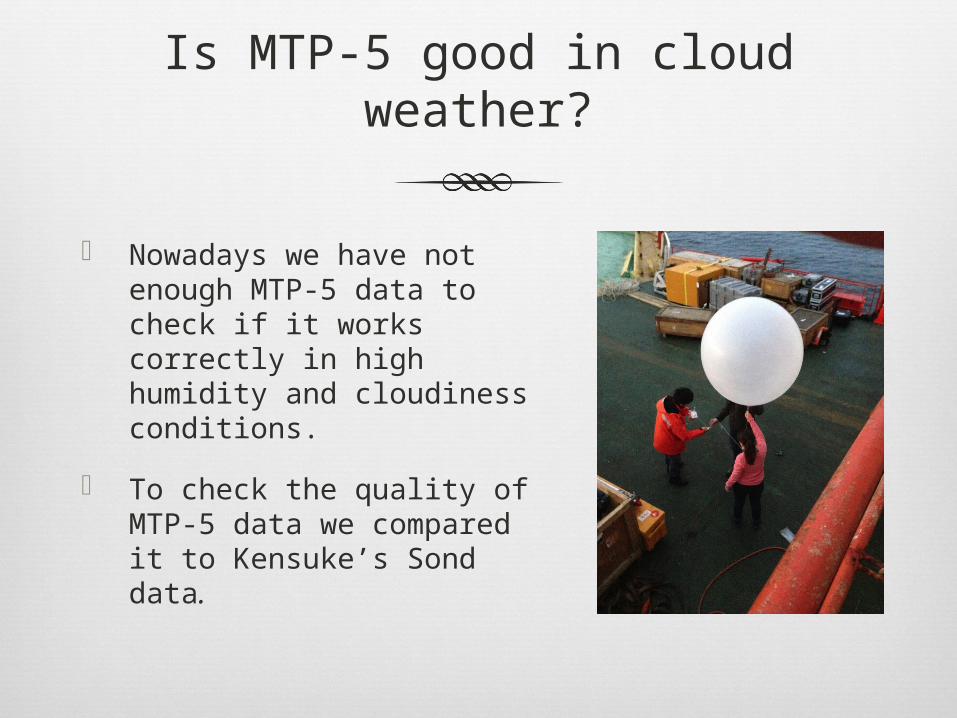
Nowadays we have not enough MTP-5 data to check if it works correctly in high humidity and cloudiness conditions.
To check the quality of MTP-5 data we compared it to Kensuke’s Sond data.
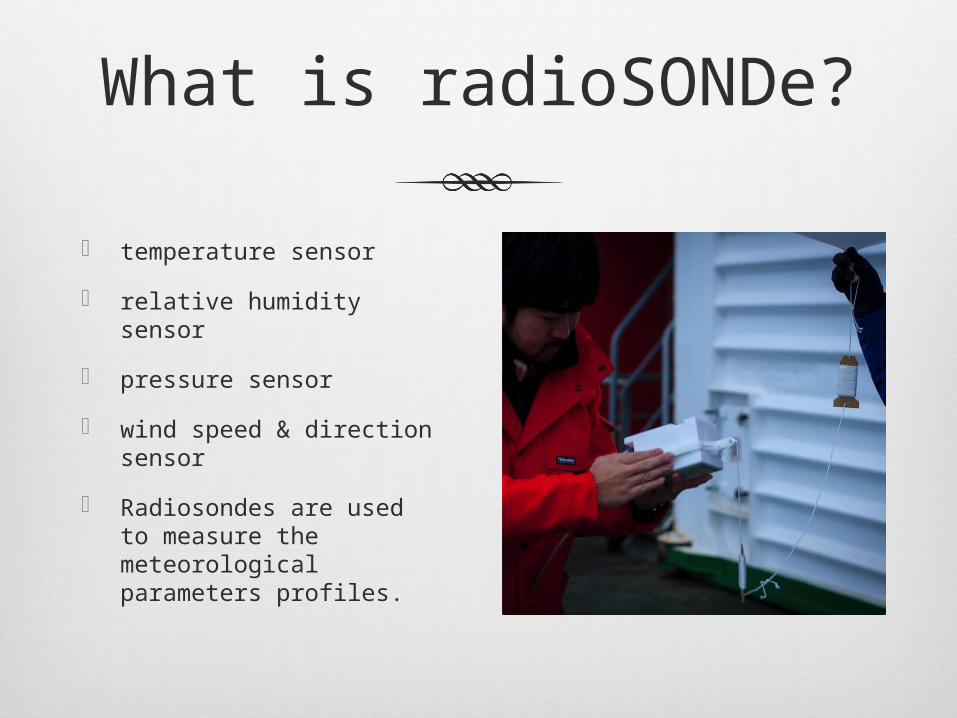
What is radioSONDe?
temperature sensor
relative humidity sensor
pressure sensor
wind speed & direction sensor
Radiosondes are used to measure the meteorological parameters profiles.
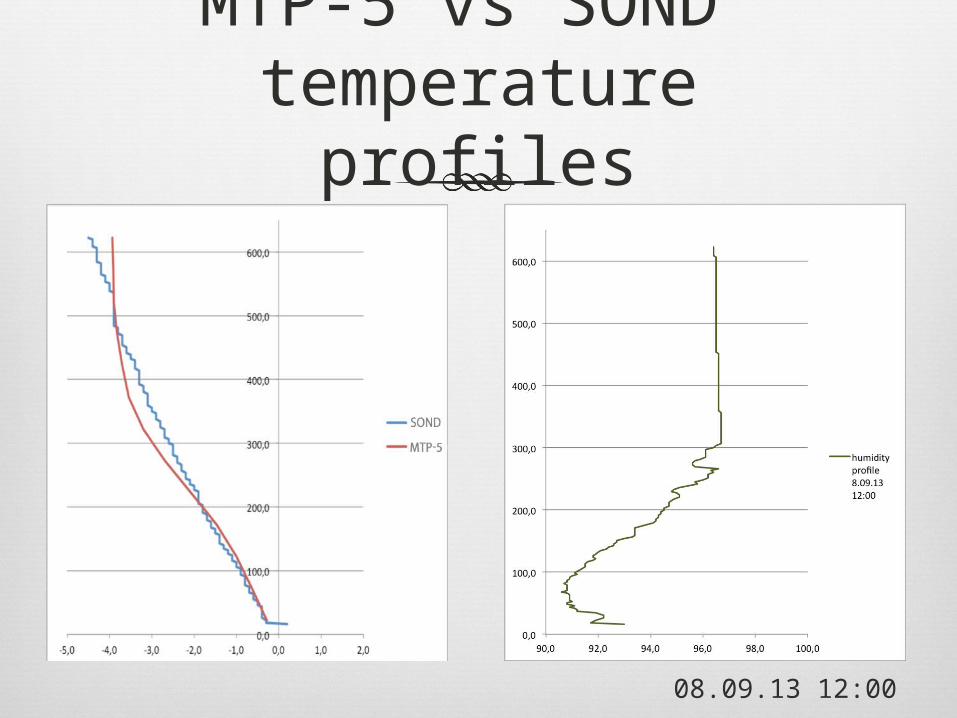
MTP-5 vs SOND temperature profiles
08.09.13 12:00
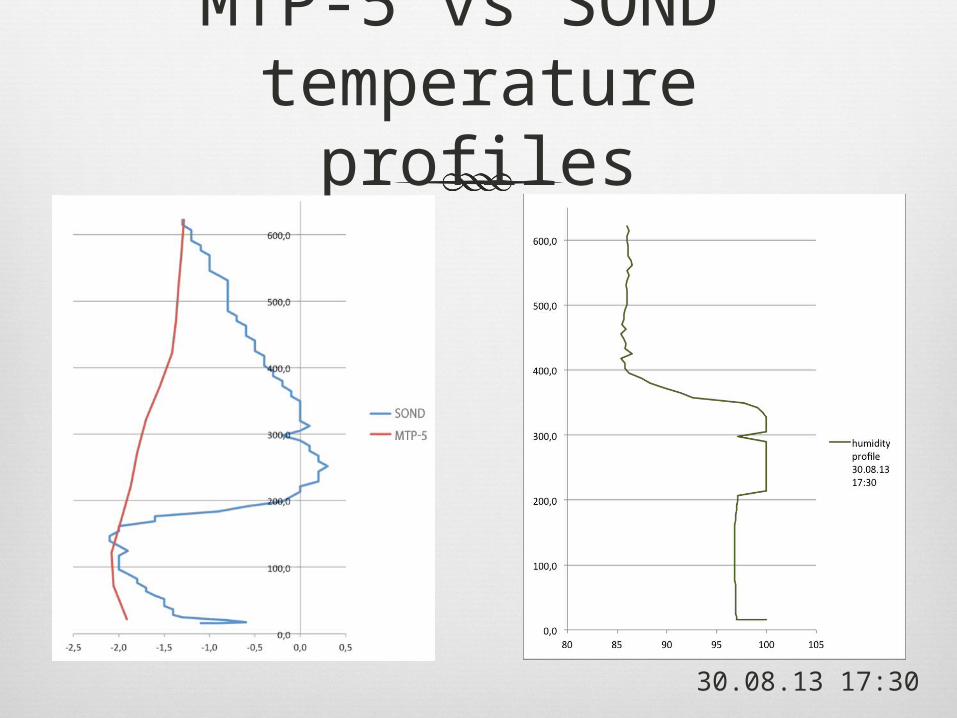
30.08.13 17:30
MTP-5 vs SOND temperature profiles
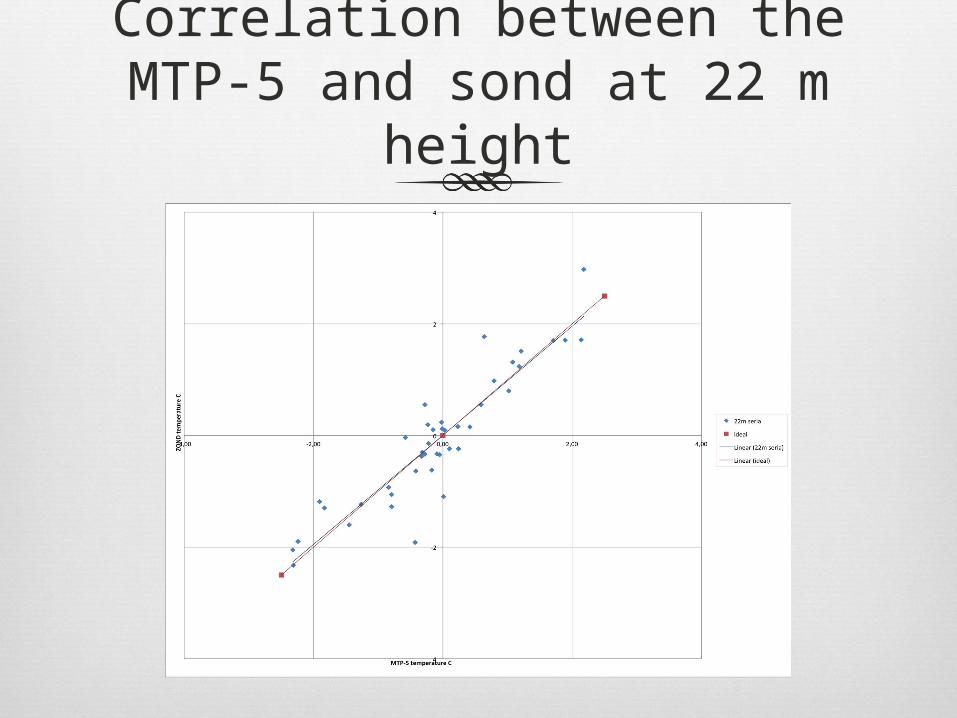
Correlation between the MTP-5 and sond at 22 m height
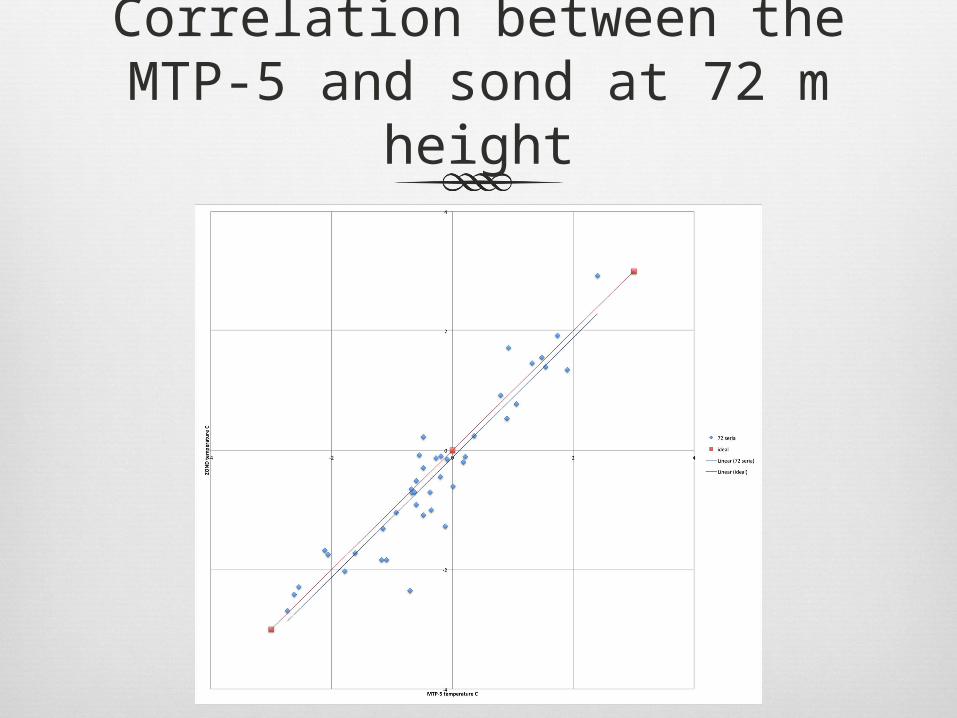
Correlation between the MTP-5 and sond at 72 m height
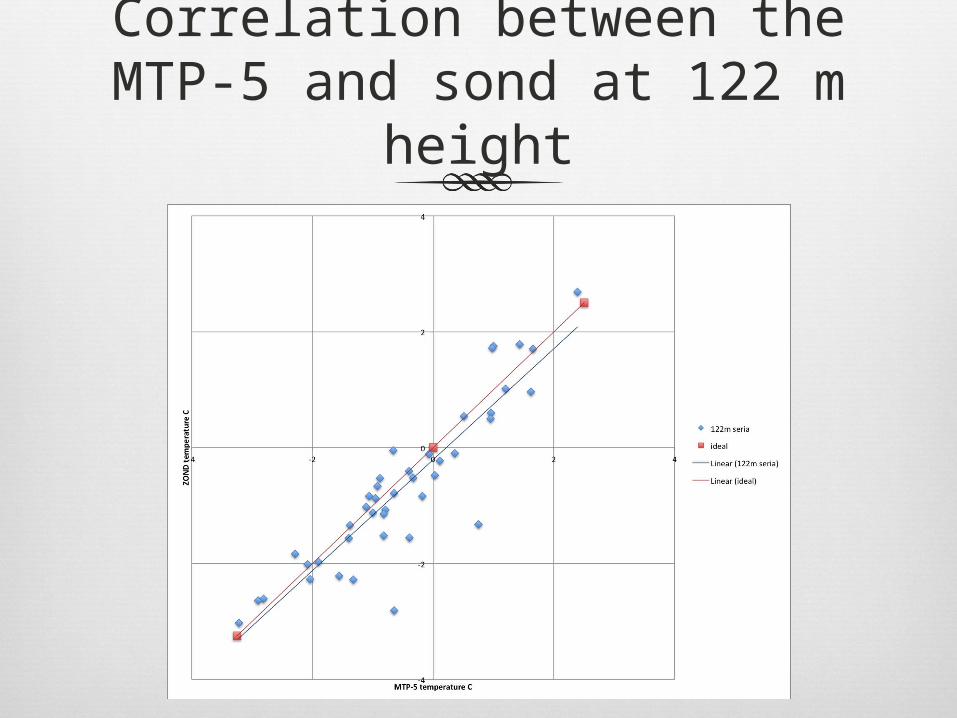
Correlation between the MTP-5 and sond at 122 m height
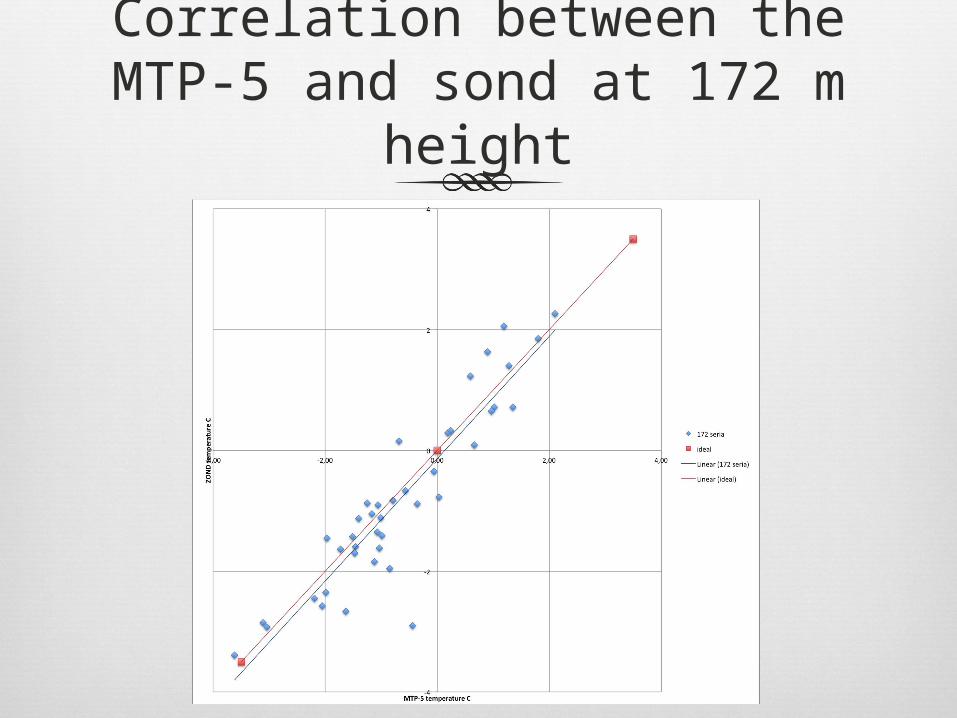
Correlation between the MTP-5 and sond at 172 m height
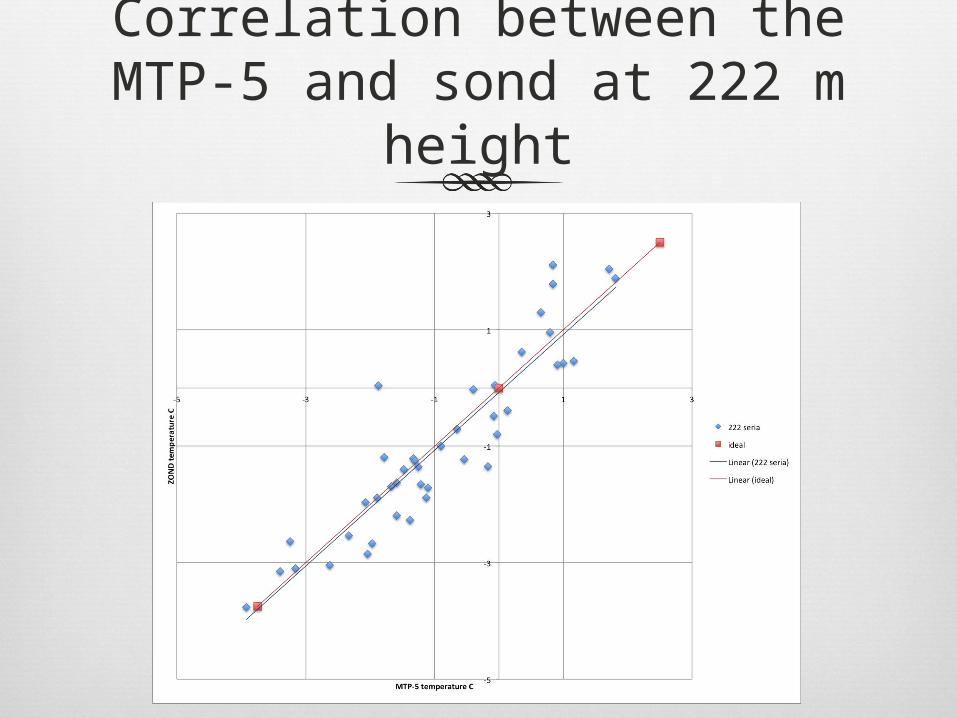
Correlation between the MTP-5 and sond at 222 m height
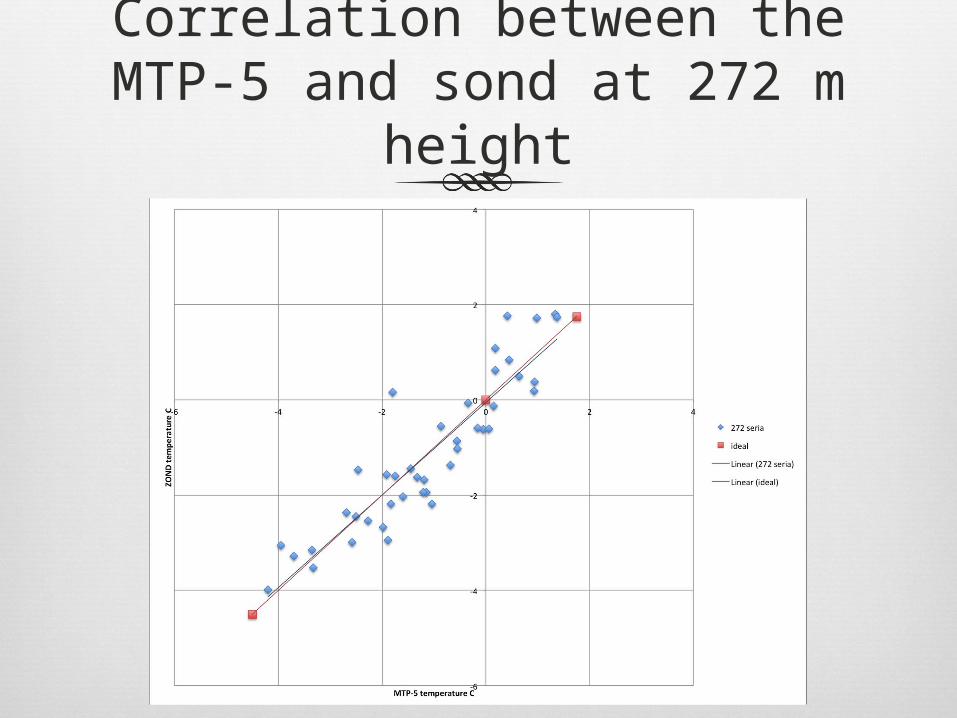
Correlation between the MTP-5 and sond at 272 m height
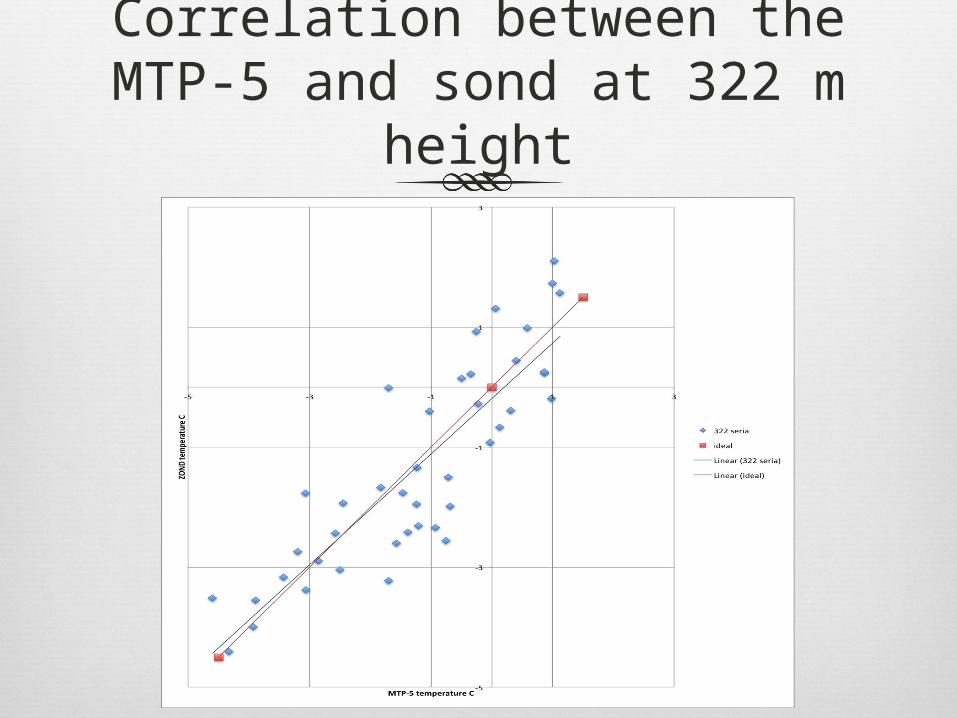
Correlation between the MTP-5 and sond at 322 m height
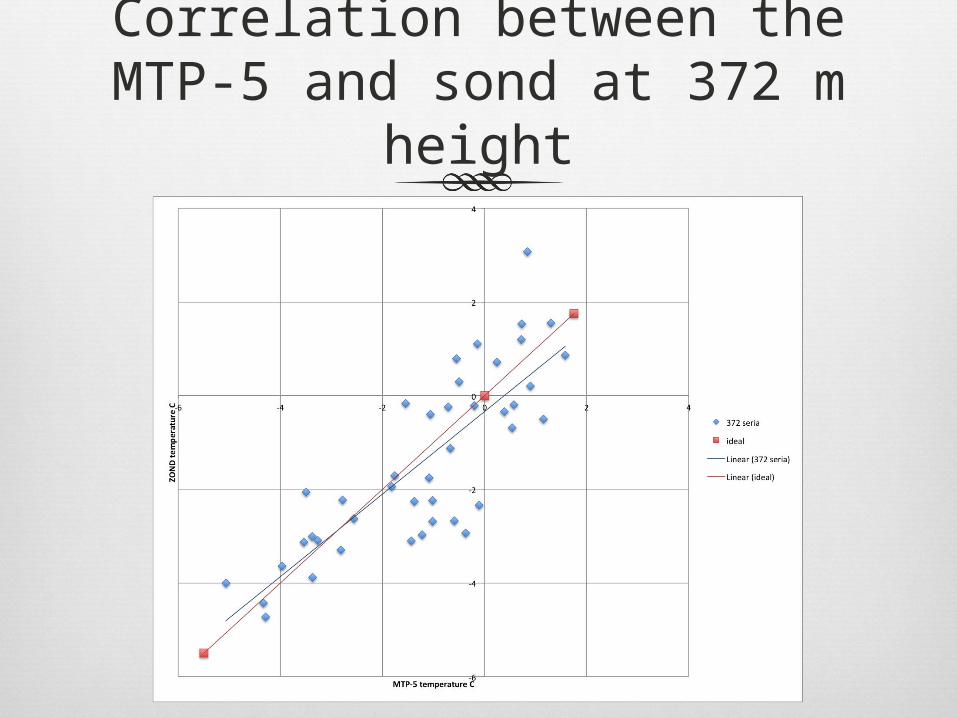
Correlation between the MTP-5 and sond at 372 m height
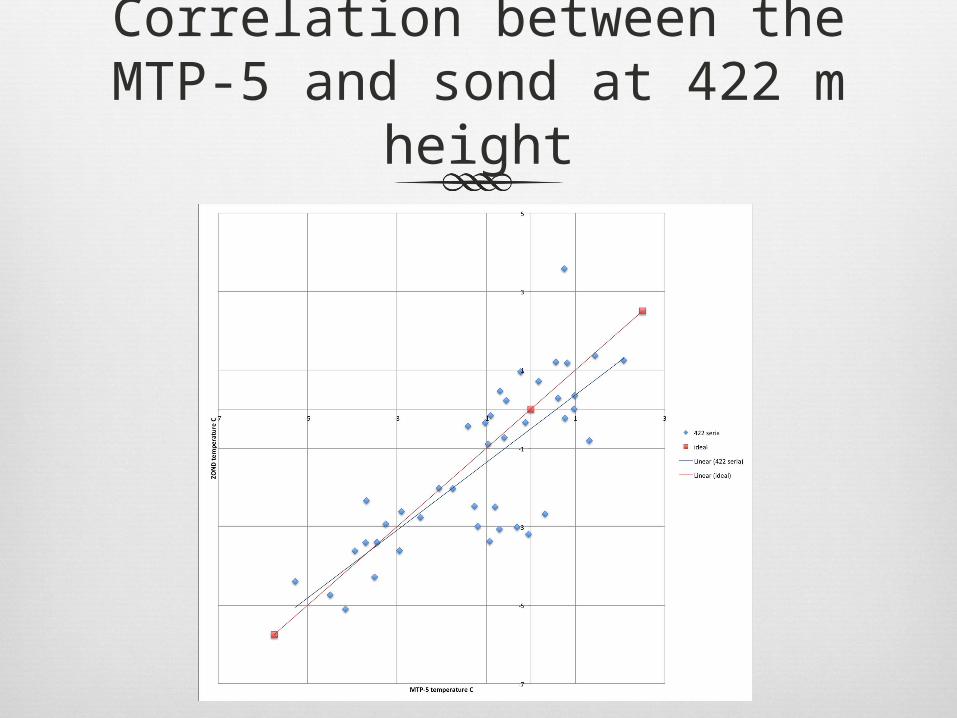
Correlation between the MTP-5 and sond at 422 m height
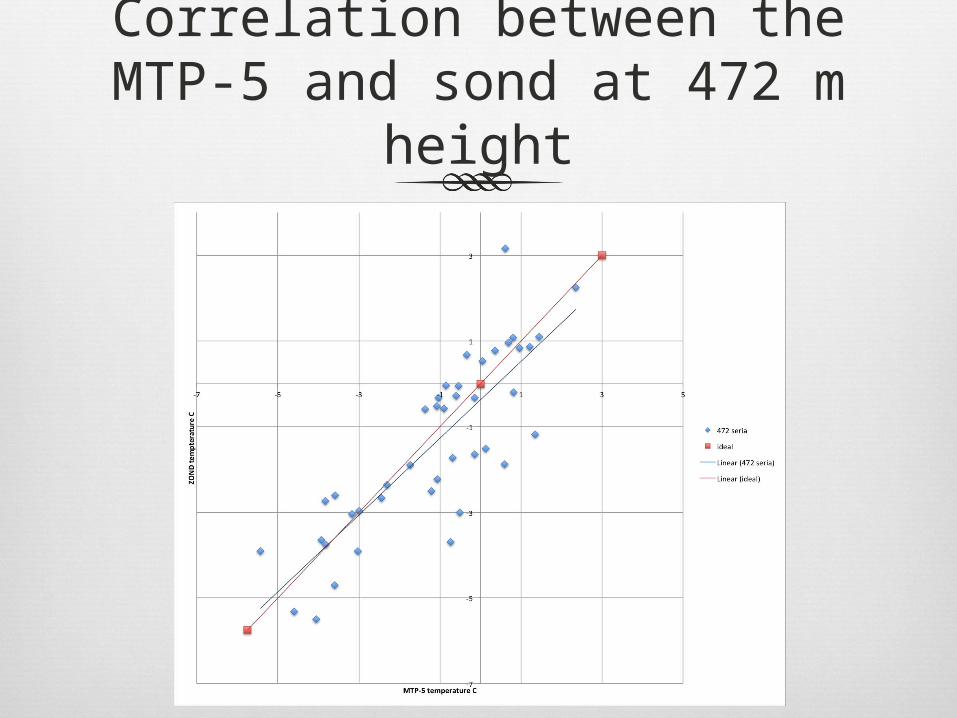
Correlation between the MTP-5 and sond at 472 m height
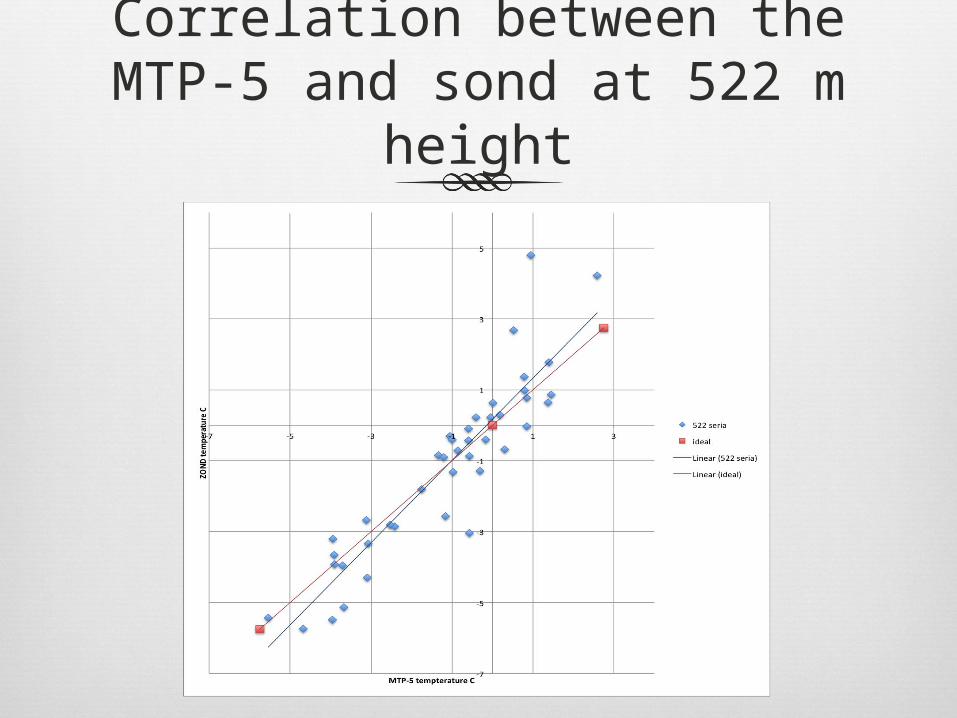
Correlation between the MTP-5 and sond at 522 m height
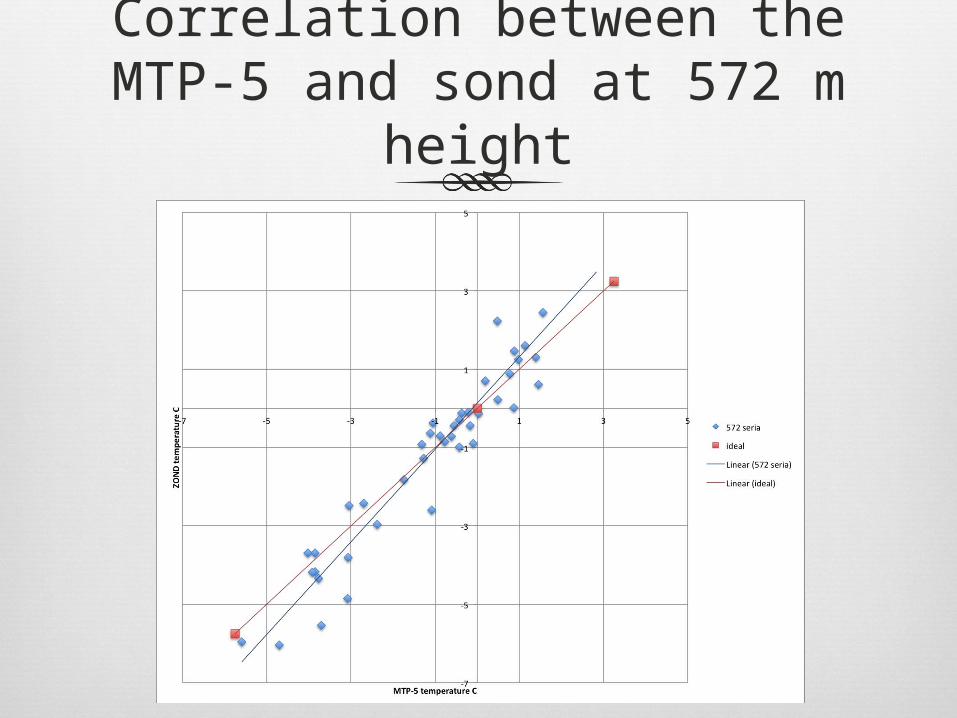
Correlation between the MTP-5 and sond at 572 m height
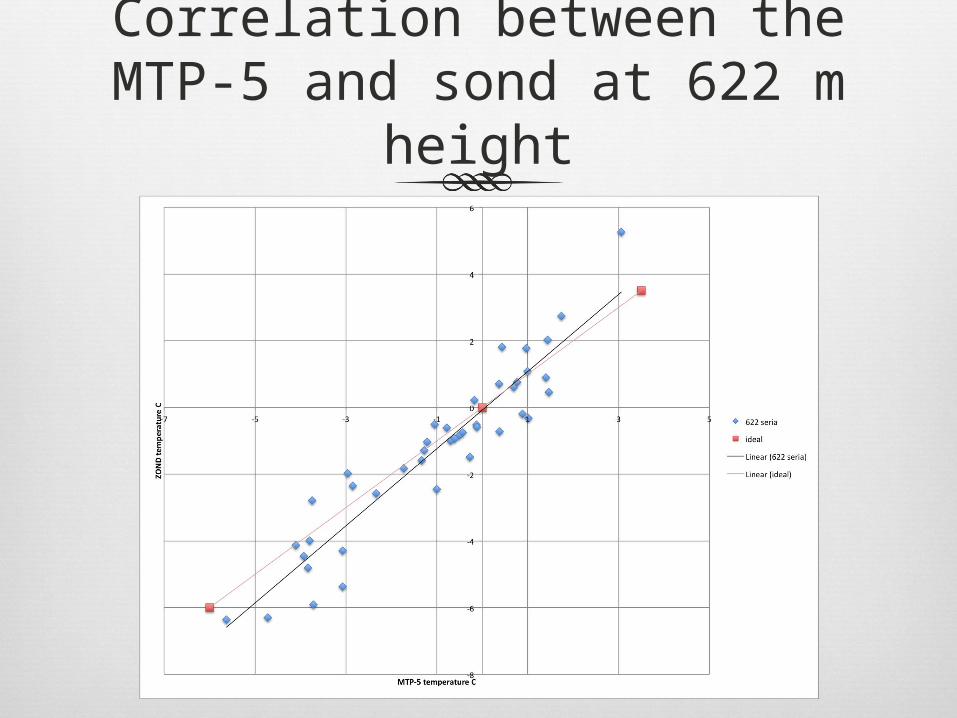
Correlation between the MTP-5 and sond at 622 m height
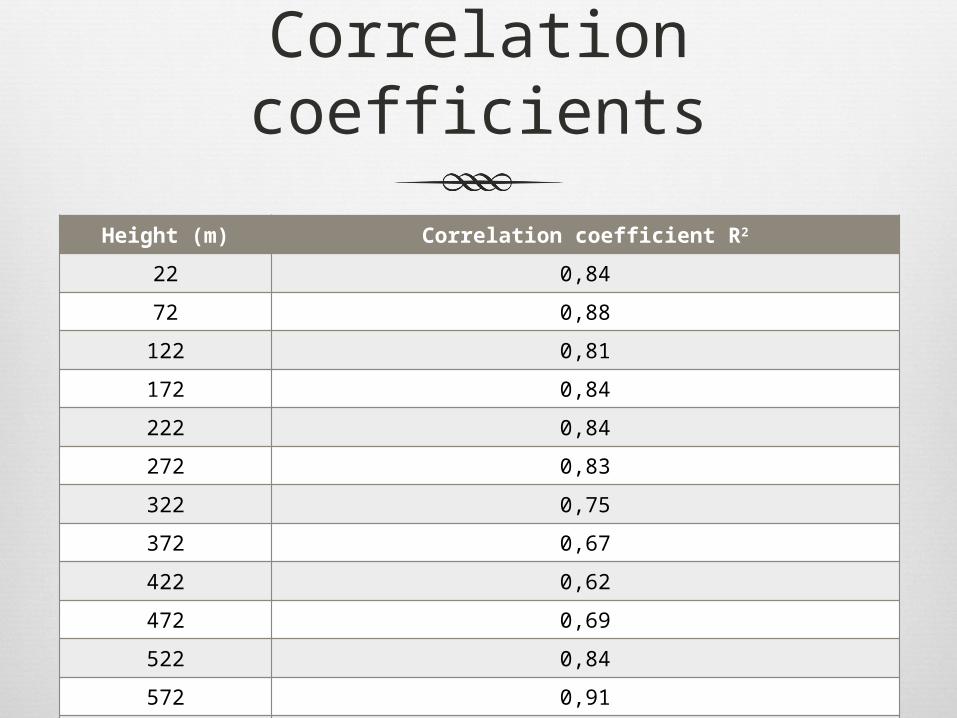
Correlation coefficients
Height (m) Correlation coefficient R2
22 0,84
72 0,88
122 0,81
172 0,84
222 0,84
272 0,83
322 0,75
372 0,67
422 0,62
472 0,69
522 0,84
572 0,91
622 0,88
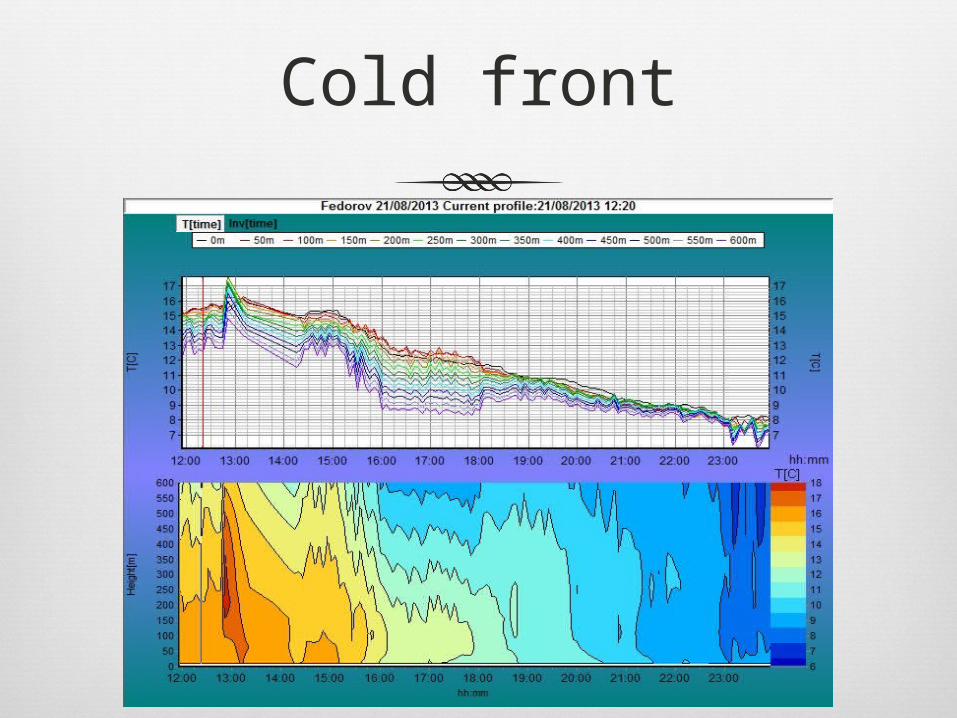
Cold front
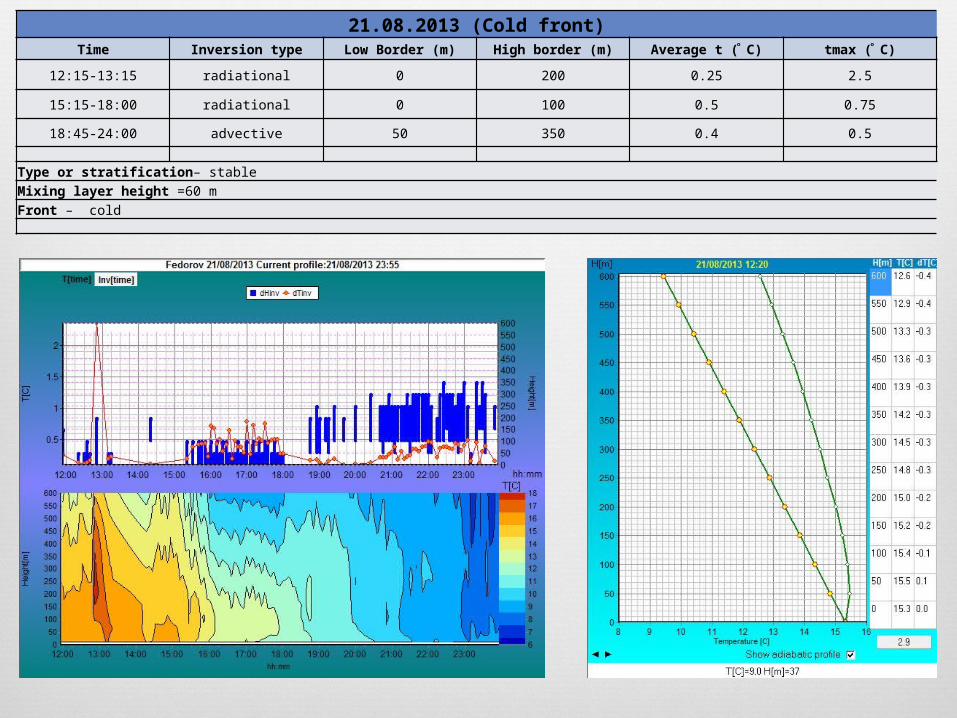
21.08.2013 (Cold front)Time Inversion type Low Border (m) High border (m) Average t (ͦ C) tmax C)(ͦ
12:15-13:15 radiational 0 200 0.25 2.5
15:15-18:00 radiational 0 100 0.5 0.75
18:45-24:00 advective 50 350 0.4 0.5
Type or stratification– stableMixing layer height =60 mFront – cold
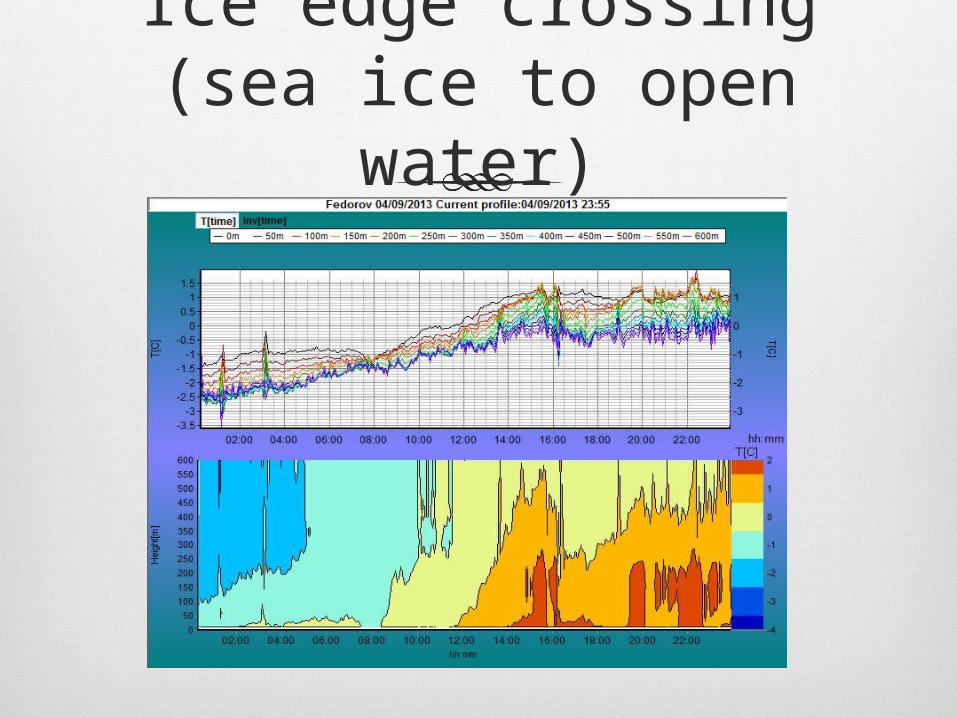
Ice edge crossing (sea ice to open water)
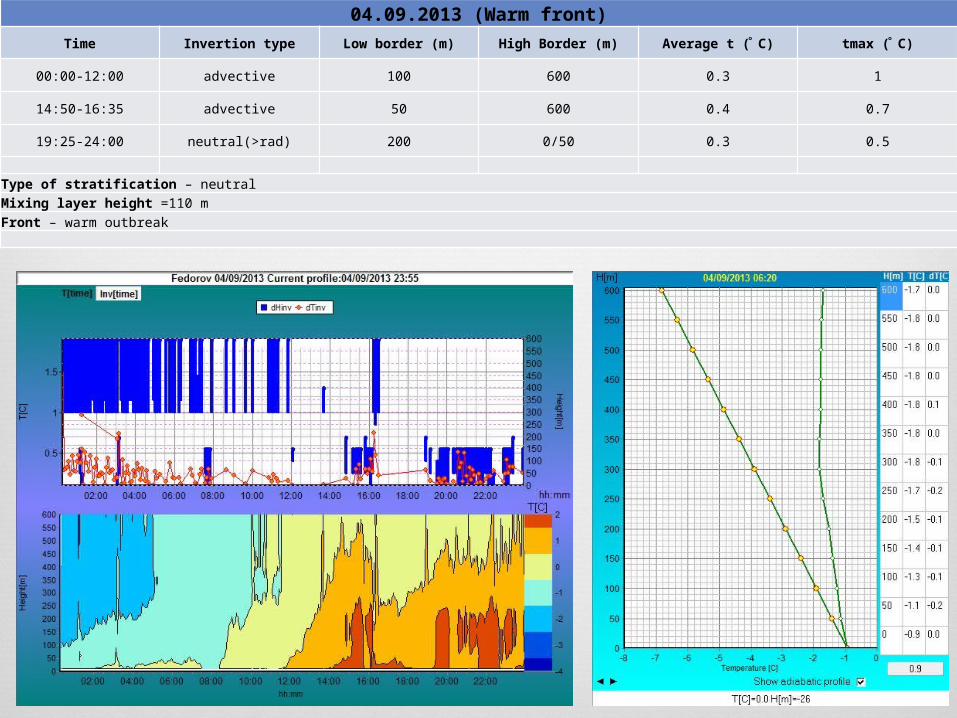
04.09.2013 (Warm front)Time Invertion type Low border (m) High Border (m) Average t (ͦ C) tmax C)(ͦ
00:00-12:00 advective 100 600 0.3 1
14:50-16:35 advective 50 600 0.4 0.7
19:25-24:00 neutral(>rad) 200 0/50 0.3 0.5
Type of stratification – neutralMixing layer height =110 mFront – warm outbreak
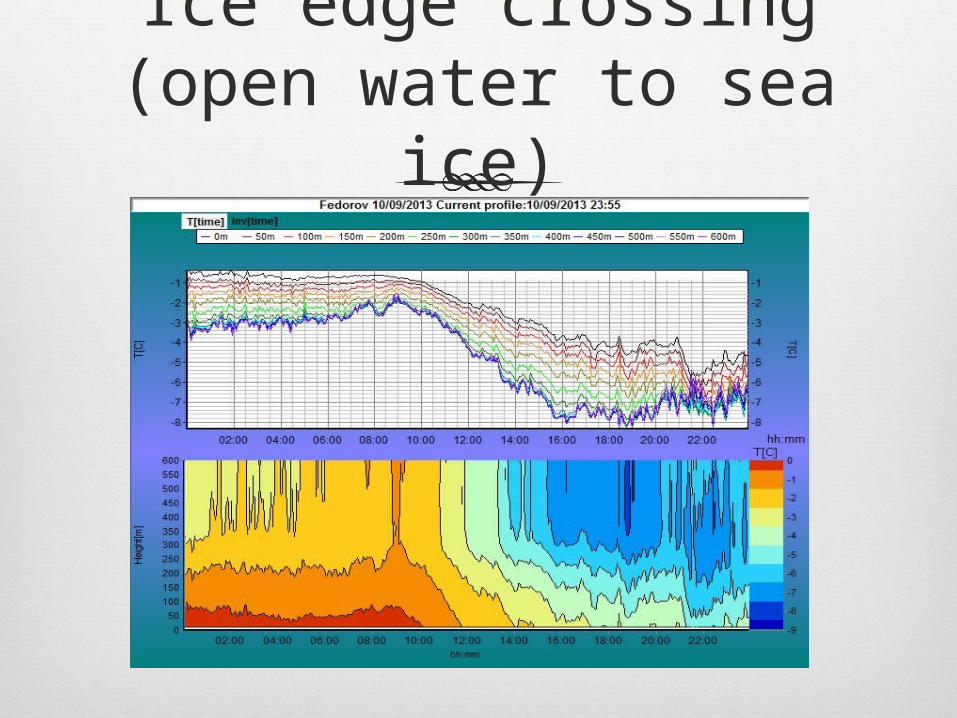
Ice edge crossing (open water to sea ice)
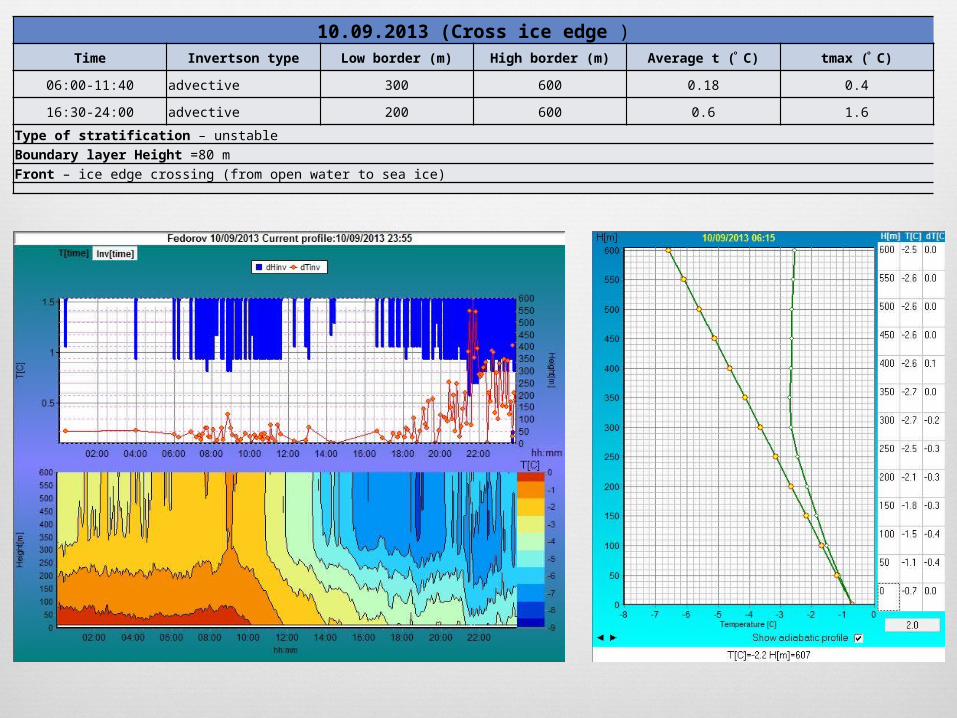
10.09.2013 (Cross ice edge )Time Invertson type Low border (m) High border (m) Average t (ͦ C) tmax C)(ͦ
06:00-11:40 advective 300 600 0.18 0.4
16:30-24:00 advective 200 600 0.6 1.6
Type of stratification – unstableBoundary layer Height =80 mFront – ice edge crossing (from open water to sea ice)
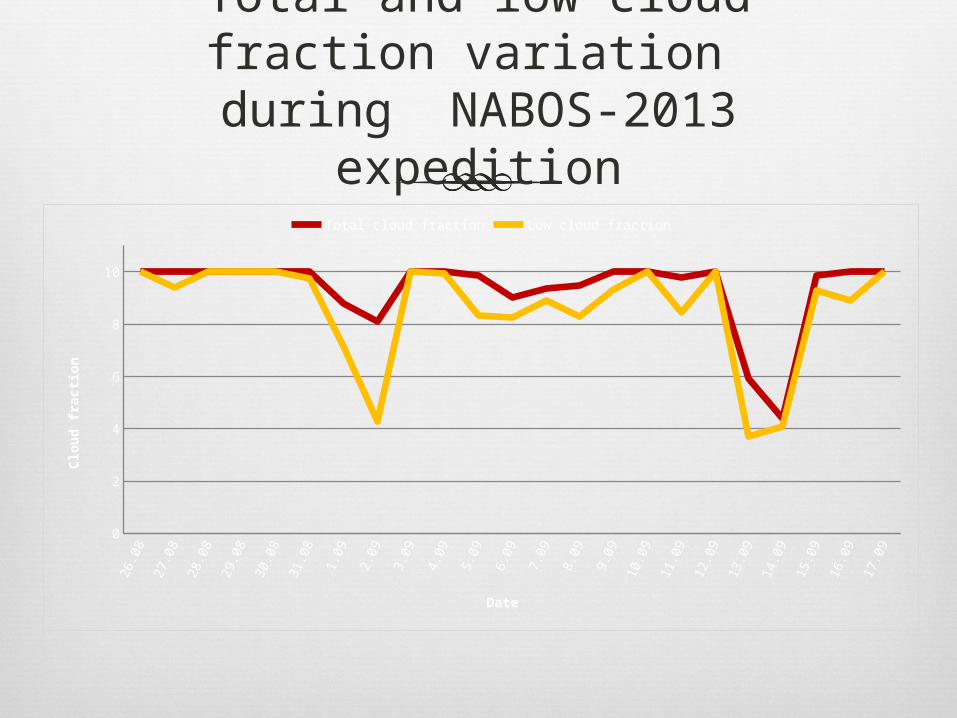
Total and low cloud fraction variation
during NABOS-2013 expedition26
.08
27.0
8
28.0
8
29.0
8
30.0
8
31.0
8
1.09
2.09
3.09
4.09
5.09
6.09
7.09
8.09
9.09
10.0
9
11.0
9
12.0
9
13.0
9
14.0
9
15.0
9
16.0
9
17.0
9
0
2
4
6
8
10
Total cloud fraction Low cloud fraction
Date
Clo
ud f
racti
on
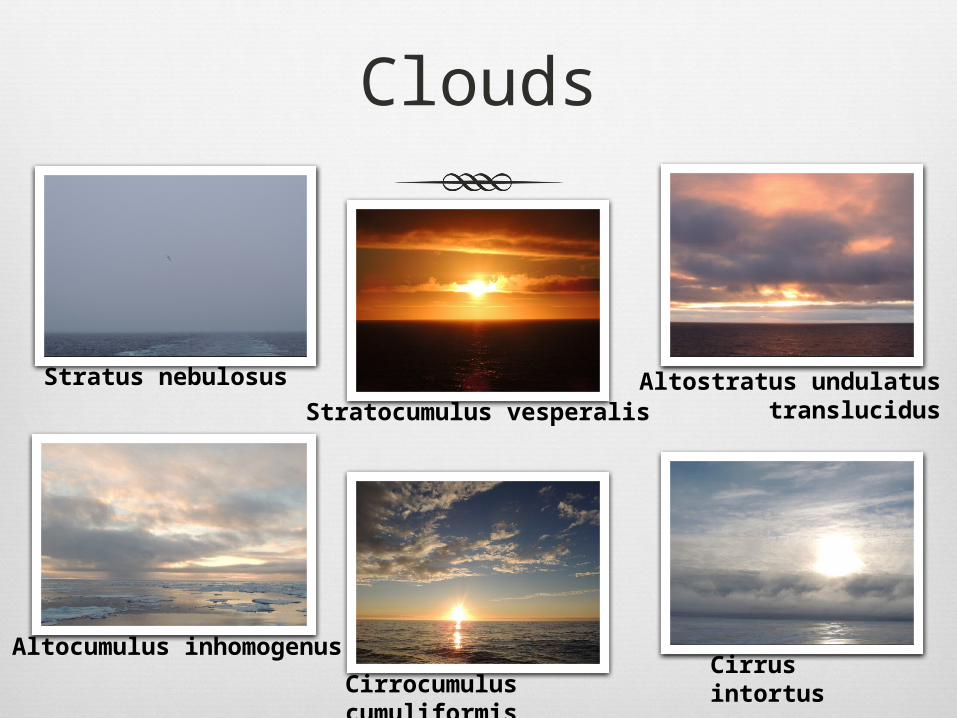
Clouds
Stratus nebulosus
Stratocumulus vesperalisAltostratus undulatus translucidus
Cirrocumulus cumuliformis
Cirrus intortus
Altocumulus inhomogenus
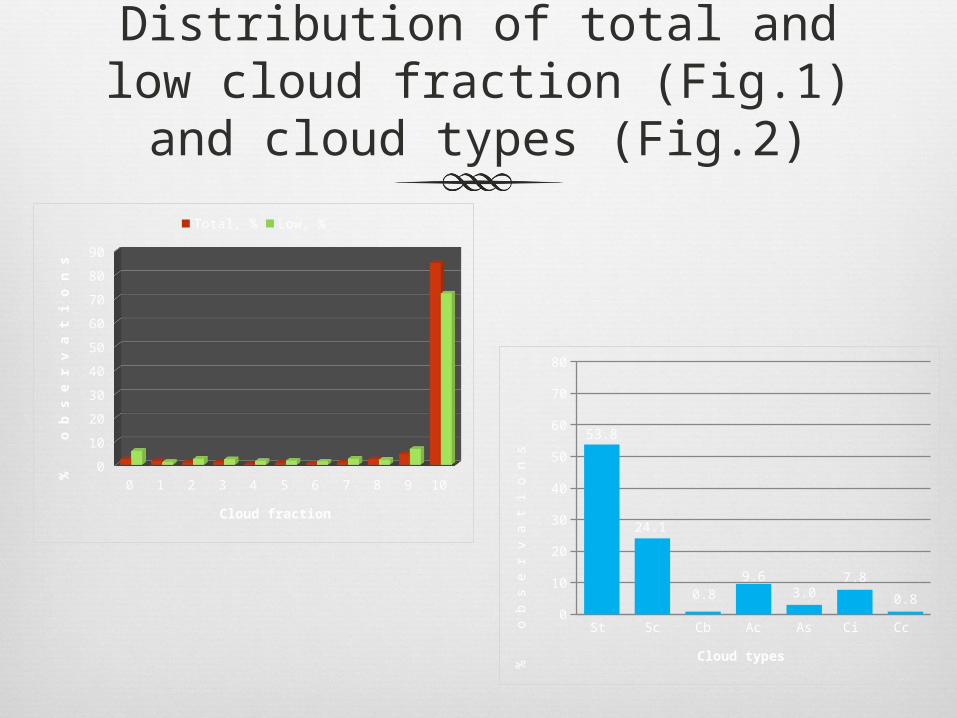
Distribution of total and low cloud fraction (Fig.1) and cloud
types (Fig.2)
St Sc Cb Ac As Ci Сс 0
10
20
30
40
50
60
70
80
53.8
24.1
0.89.6
3.07.8
0.8
Cloud types
% o b
s e
r v
a t
i o
n s
0 1 2 3 4 5 6 7 8 9 100
10
20
30
40
50
60
70
80
90
Total, % Low, %
Cloud fraction
%
o b
s e
r v
a t
i o
n s
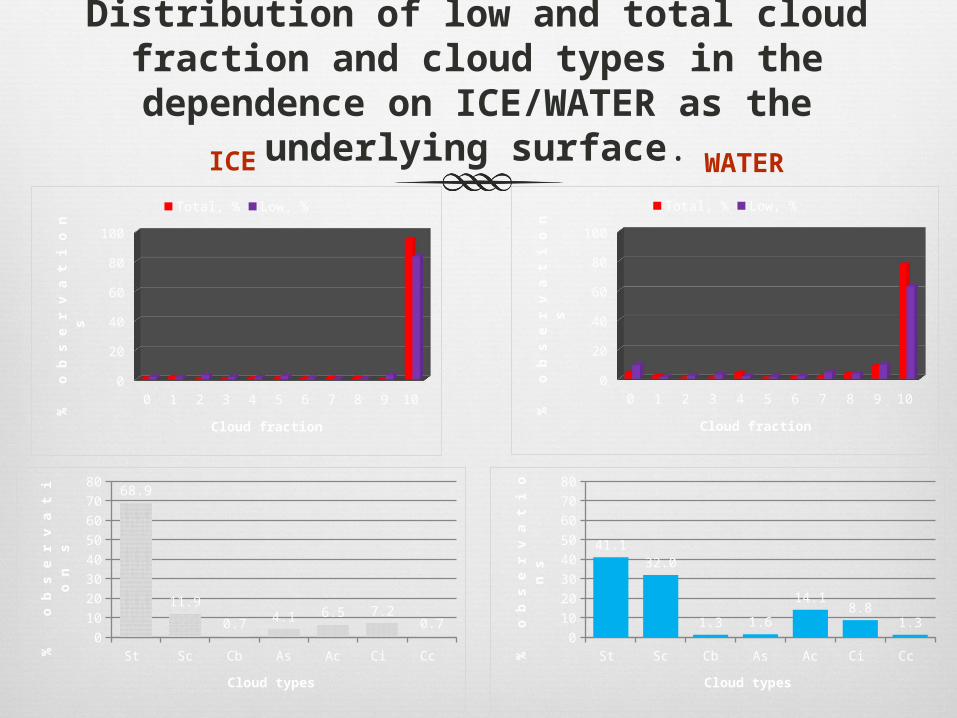
Distribution of low and total cloud fraction and cloud types in the
dependence on ICE/WATER as the underlying surface.
0 1 2 3 4 5 6 7 8 9 100
102030405060708090
100
Total, % Low, %
Cloud fraction
%
o b
s e
r v
a t
i o
n s
0 1 2 3 4 5 6 7 8 9 100
102030405060708090
100
Total, % Low, %
Cloud fraction
%
o b
s e
r v
a t
i o
n s
St Sc Cb As Ac Ci Сс 0
10
20
30
40
50
60
70
8068.9
11.9
0.7 4.1 6.5 7.20.7
Cloud types
%
o b
s e
r v
a t
i o
n
s
St Sc Cb As Ac Ci Сс 0
10
20
30
40
50
60
70
80
41.132.0
1.3 1.6
14.18.8
1.3
Cloud types
%
o b
s e
r v
a t
i o
n s
ICE WATER
Conclusions
MTP-5 accuracy is not good for the stratus cloudy areas now (e.g. Arctic Ocean) as the algorithm of raw data processing doesn’t consider humidity conditions.
In spite of this MTP-5 data is quite good for inversion detection and general atmospheric monitoring.
During our expedition the southeast wind was prevailing for a long time that caused the advection of warm air. Due to cold underlying surface we also had strong inversions that determined the presence of very low clouds covering the whole sky.

Thank you!
We hope it was interesting for you.^^