Embed Size (px)
Citation preview

What is Reanalysis for?
Huug van den Dool
5/4/2015
Reanalysis workshop @ NCEP
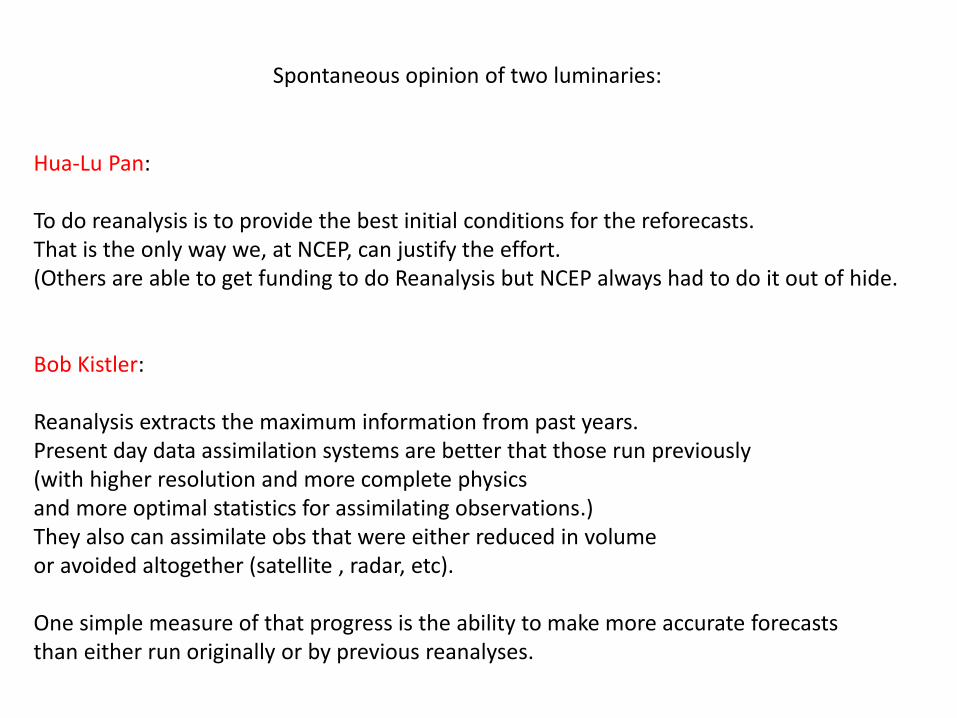
Hua-Lu Pan: To do reanalysis is to provide the best initial conditions for the reforecasts. That is the only way we, at NCEP, can justify the effort. (Others are able to get funding to do Reanalysis but NCEP always had to do it out of hide. Bob Kistler: Reanalysis extracts the maximum information from past years. Present day data assimilation systems are better that those run previously (with higher resolution and more complete physics and more optimal statistics for assimilating observations.) They also can assimilate obs that were either reduced in volume or avoided altogether (satellite , radar, etc). One simple measure of that progress is the ability to make more accurate forecasts than either run originally or by previous reanalyses.
Spontaneous opinion of two luminaries:
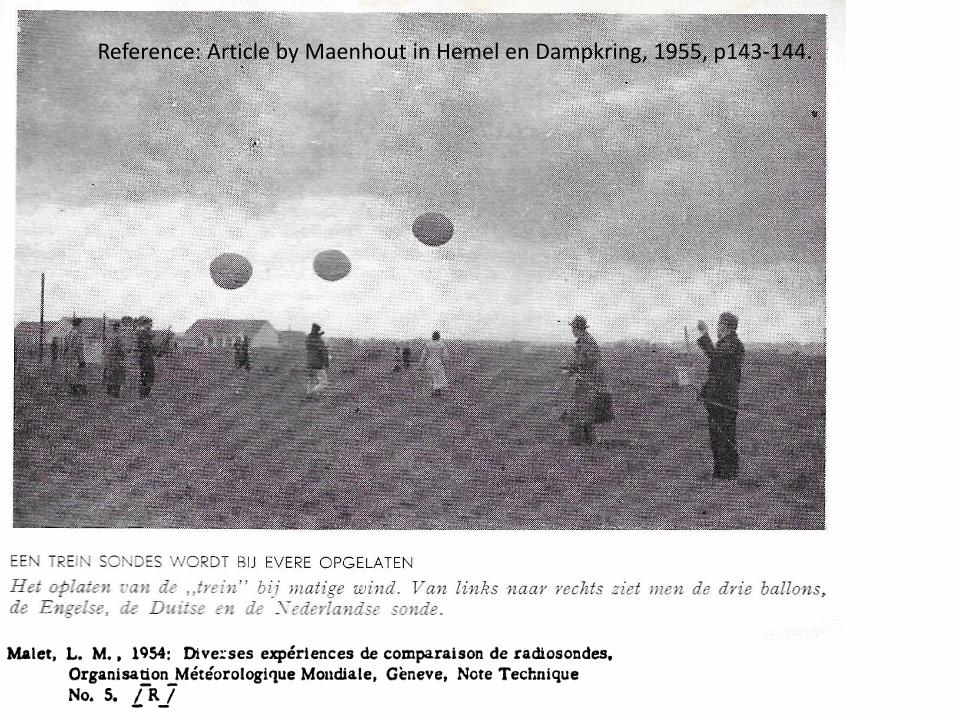
Reference: Article by Maenhout in Hemel en Dampkring, 1955, p143-144.
My own personal slow warming to re-analysis as concept.
Remember the MIT school of V.P. Starr
about General Circulation Statistics ?
Working with station data!!!!!!!!!!
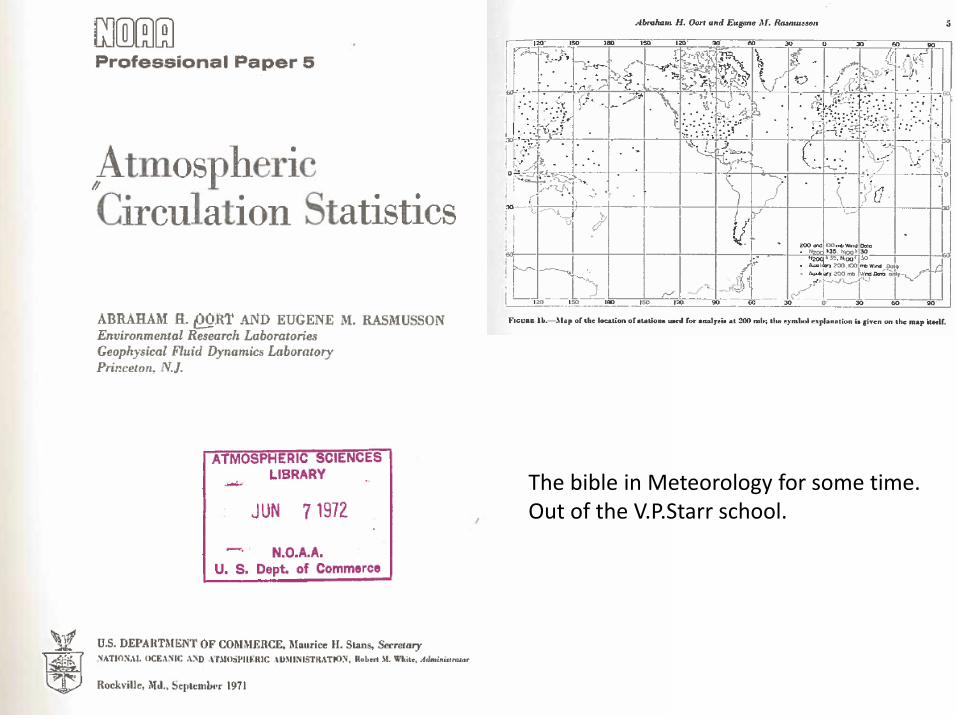
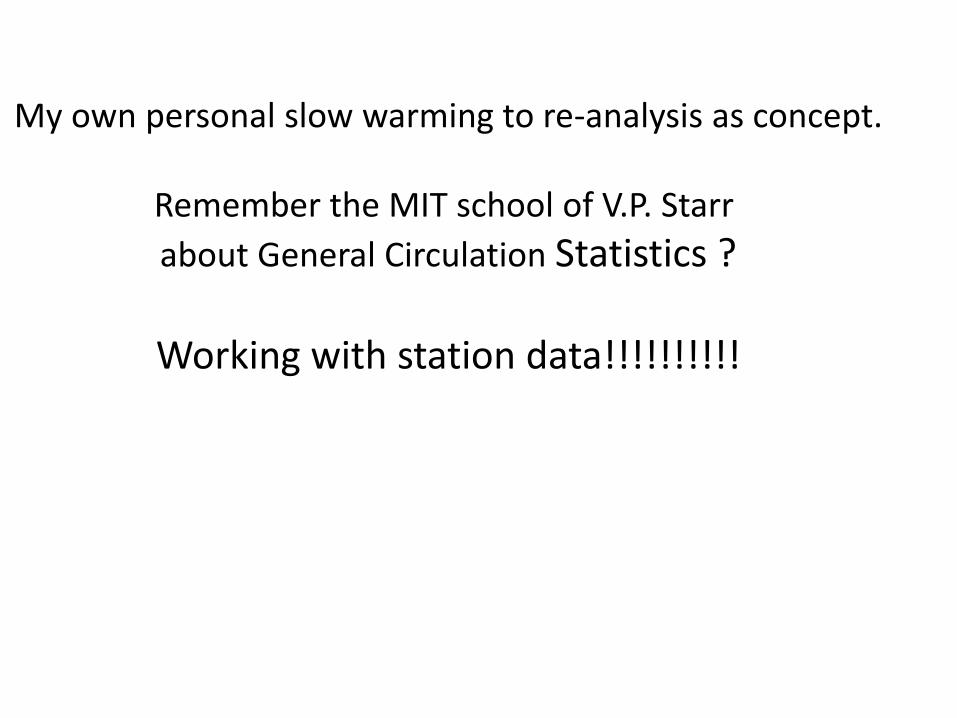
The bible in Meteorology for some time. Out of the V.P.Starr school.
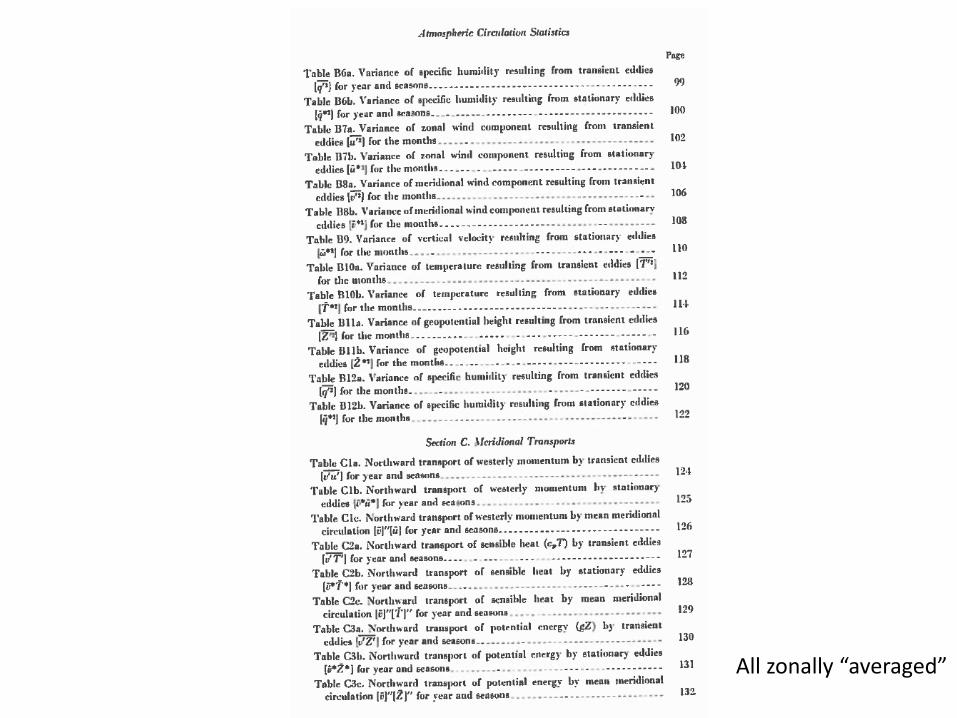
All zonally “averaged”
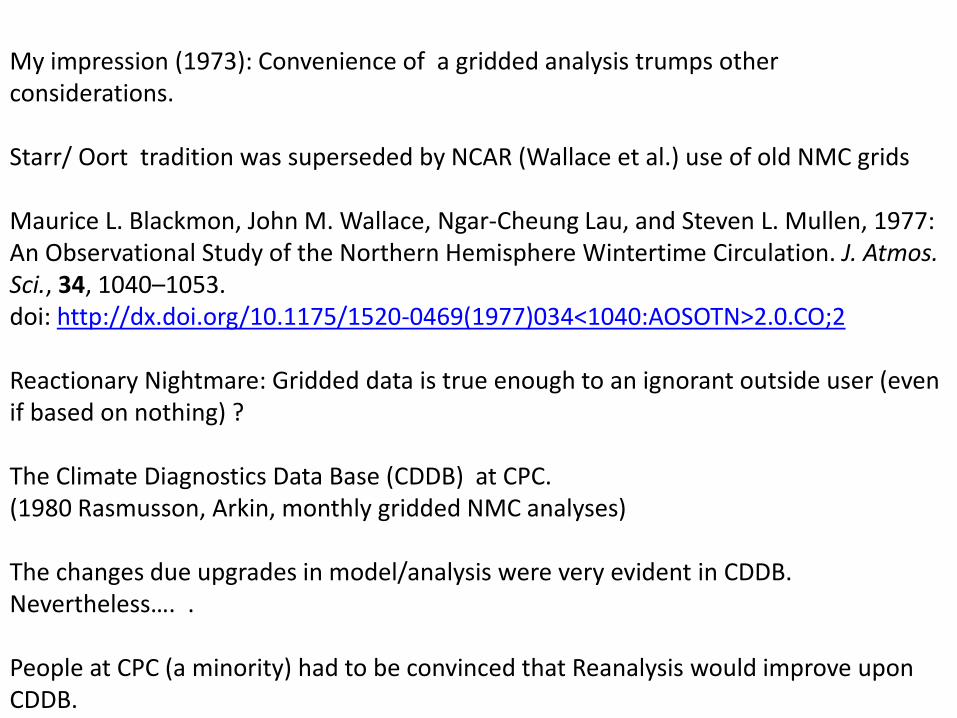
My impression (1973): Convenience of a gridded analysis trumps other considerations. Starr/ Oort tradition was superseded by NCAR (Wallace et al.) use of old NMC grids Maurice L. Blackmon, John M. Wallace, Ngar-Cheung Lau, and Steven L. Mullen, 1977: An Observational Study of the Northern Hemisphere Wintertime Circulation. J. Atmos. Sci., 34, 1040–1053. doi: http://dx.doi.org/10.1175/1520-0469(1977)034<1040:AOSOTN>2.0.CO;2 Reactionary Nightmare: Gridded data is true enough to an ignorant outside user (even if based on nothing) ? The Climate Diagnostics Data Base (CDDB) at CPC. (1980 Rasmusson, Arkin, monthly gridded NMC analyses) The changes due upgrades in model/analysis were very evident in CDDB. Nevertheless…. . People at CPC (a minority) had to be convinced that Reanalysis would improve upon CDDB.
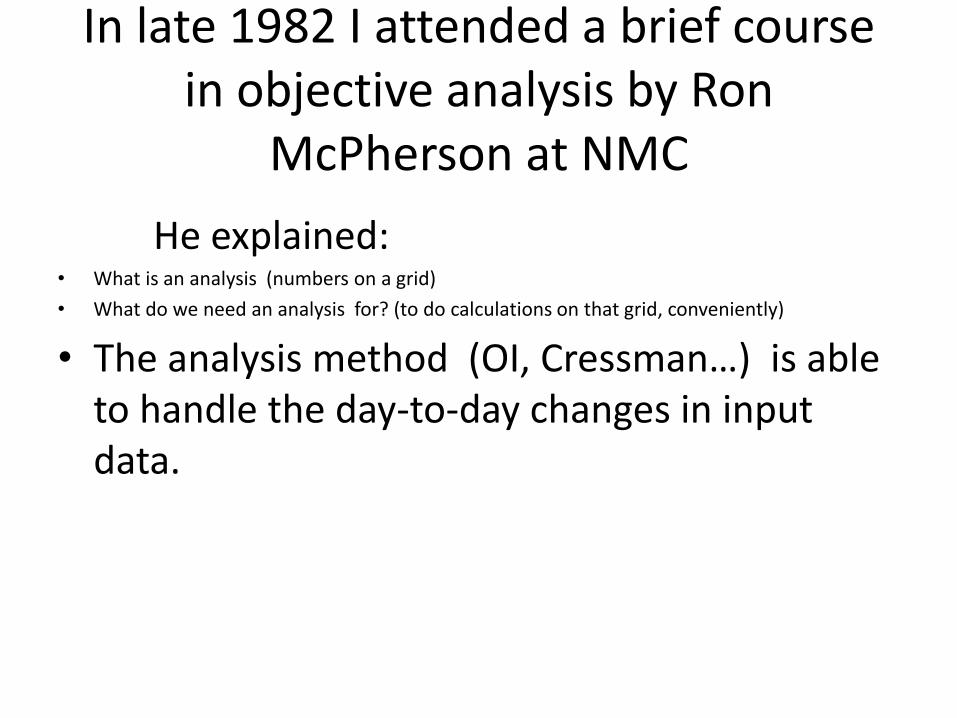
In late 1982 I attended a brief course in objective analysis by Ron
McPherson at NMC
He explained: • What is an analysis (numbers on a grid)
• What do we need an analysis for? (to do calculations on that grid, conveniently)
• The analysis method (OI, Cressman…) is able to handle the day-to-day changes in input data.
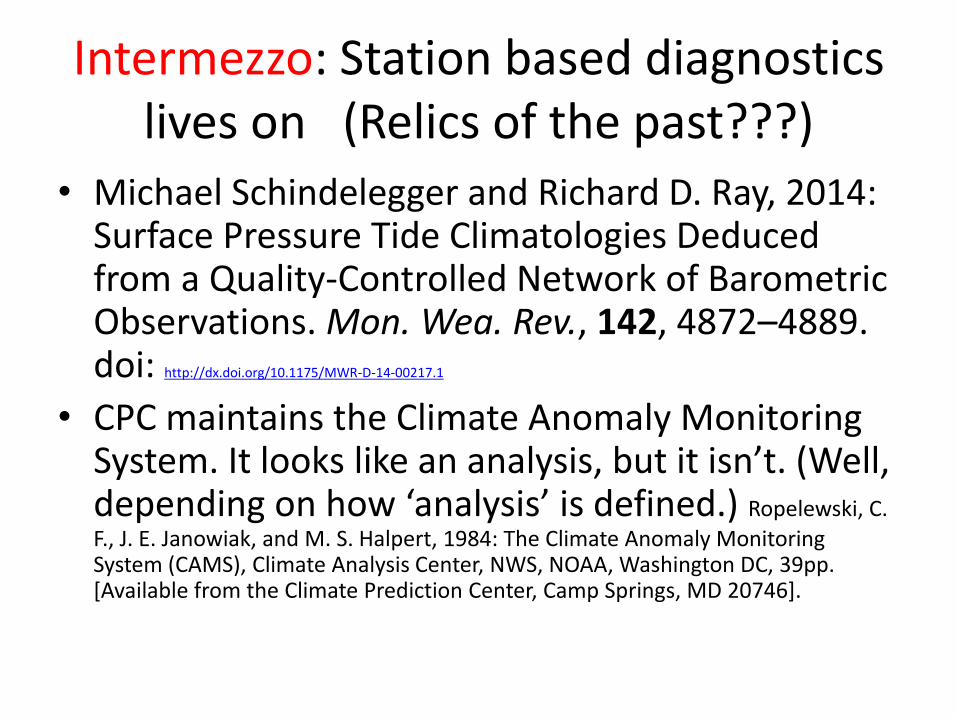
Intermezzo: Station based diagnostics lives on (Relics of the past???)
• Michael Schindelegger and Richard D. Ray, 2014: Surface Pressure Tide Climatologies Deduced from a Quality-Controlled Network of Barometric Observations. Mon. Wea. Rev., 142, 4872–4889. doi: http://dx.doi.org/10.1175/MWR-D-14-00217.1
• CPC maintains the Climate Anomaly Monitoring System. It looks like an analysis, but it isn’t. (Well, depending on how ‘analysis’ is defined.) Ropelewski, C.
F., J. E. Janowiak, and M. S. Halpert, 1984: The Climate Anomaly Monitoring System (CAMS), Climate Analysis Center, NWS, NOAA, Washington DC, 39pp. [Available from the Climate Prediction Center, Camp Springs, MD 20746].
Reanalysis is a huge success
• Success has many fathers (should I mention mothers in this case)
• Lots of credit has been given (order ~10,000 citations)
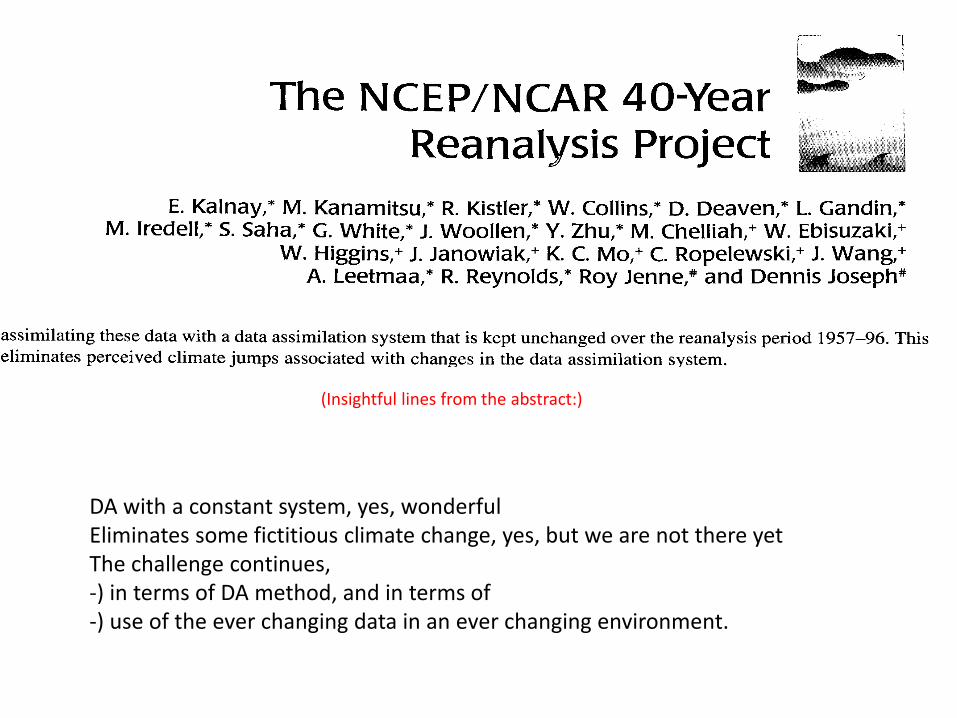
DA with a constant system, yes, wonderful Eliminates some fictitious climate change, yes, but we are not there yet The challenge continues, -) in terms of DA method, and in terms of -) use of the ever changing data in an ever changing environment.
(Insightful lines from the abstract:)
What is Reanalysis for?
• To produce a: the best General Circulation Statistics, b: the best short-term climate diagnostics and monitoring, and c: the best long-term climate diagnostics and monitoring
• To create the best initial states for Retrospective Forecasts (thus allowing enough hindcasts)
• To make better use of all observations ever taken • To use observations never used before (impetus
for mining) • To study and interpret historically important
events, usually extremes.
Oh, don’t forget mission creep, moving goal posts etc
To study and interpret historically important events, usually extremes,
• 1953 flood (R1, forecast included)
• 1894/1897 floods (20th century Reanl, no forecasts)
• 1871 fires in the mid-west (20th century Reanl, no forecasts)
• -----------------
• The all time record high temperature (38.6oC, 1944) in the backyard of Dr Thate at Warnsveld in The Netherlands. Mesoscale model (50 m resolution) with 20CR boundary conditions plus incredibly detailed lower boundary conditions (re land use, energy production)
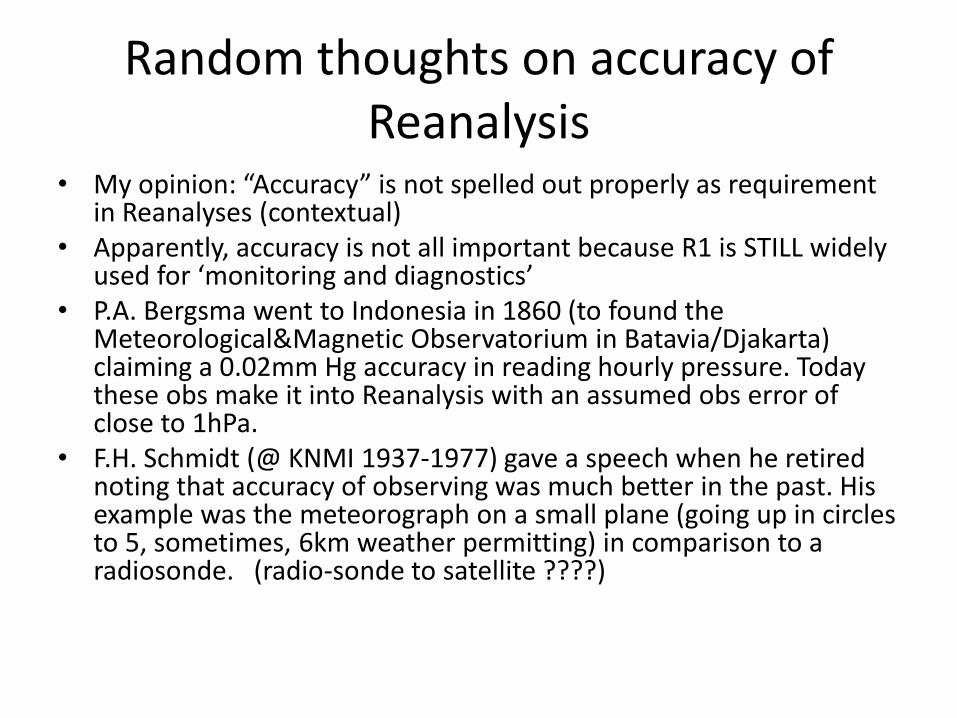
Random thoughts on accuracy of Reanalysis
• My opinion: “Accuracy” is not spelled out properly as requirement in Reanalyses (contextual)
• Apparently, accuracy is not all important because R1 is STILL widely used for ‘monitoring and diagnostics’
• P.A. Bergsma went to Indonesia in 1860 (to found the Meteorological&Magnetic Observatorium in Batavia/Djakarta) claiming a 0.02mm Hg accuracy in reading hourly pressure. Today these obs make it into Reanalysis with an assumed obs error of close to 1hPa.
• F.H. Schmidt (@ KNMI 1937-1977) gave a speech when he retired noting that accuracy of observing was much better in the past. His example was the meteorograph on a small plane (going up in circles to 5, sometimes, 6km weather permitting) in comparison to a radiosonde. (radio-sonde to satellite ????)
In the end…
• Reanalysis is about analysis.
• Blessing and curse: NWP like technology for Reanalysis
• Is there any room for a Climate Reanalysis. How would this differ?
• How dead is ‘analysis’ of <…you name it..> based on station data only
Homogeneous Analyses desirable yes, but possible???
• Opinions in CPC about R1. A huge success but……
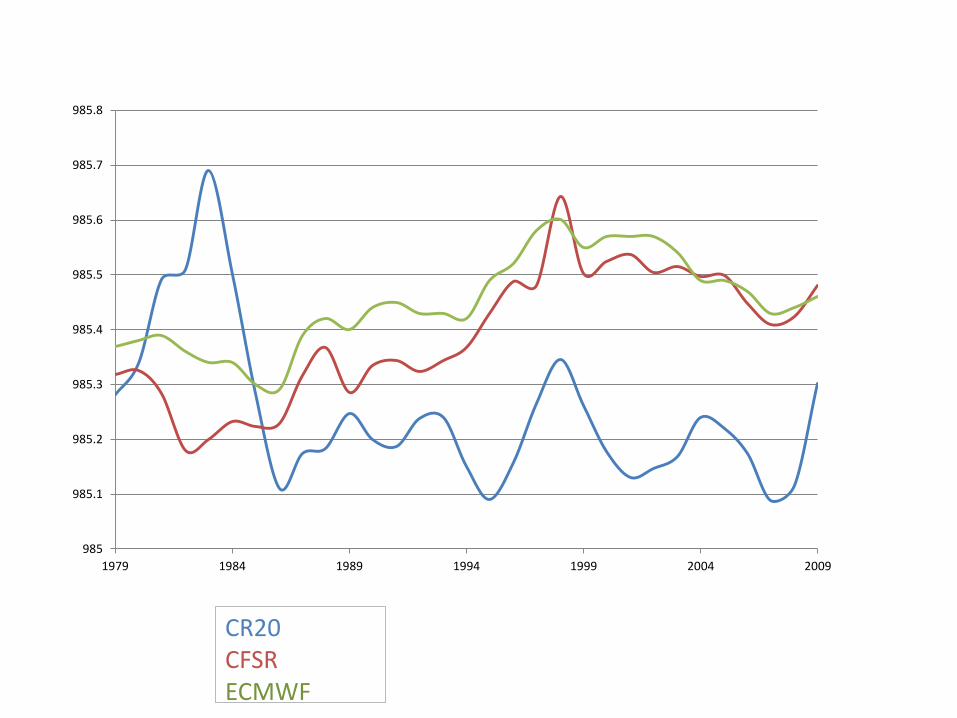
• Reanalysis of 20th century is an attempt to create a homogeneous Reanalysis (accuracy is 2ndary) by thinning out the data to …. <….> . How successful???
• C.R. Ferguson and G. Villarini, 2014: An evaluation of the statistical homogeneity of the 20CR. Climate Dynamics, 42, 2841-2866. (One might be ALARMED reading this). Increasing number of surface pressure obs over US was a source of inhomogeneity.
• My sense: Hindcasts and their use for calibration in real time have added a new and different urgency to the need for homogeneous Re-analysis. How do we balance accuracy and homogeneity.? Perhaps we don’t.

Thank You
985
985.1
985.2
985.3
985.4
985.5
985.6
985.7
985.8
1979 1984 1989 1994 1999 2004 2009
CR20 CFSR ECMWF