Embed Size (px)
Citation preview
NBER WORKING PAPER SERIES
WHAT IS THE IMPACT OF SUCCESSFUL CYBERATTACKS ON TARGET FIRMS?
Shinichi KamiyaJun-Koo KangJungmin Kim
Andreas MilidonisRené M. Stulz
Working Paper 24409http://www.nber.org/papers/w24409
NATIONAL BUREAU OF ECONOMIC RESEARCH1050 Massachusetts Avenue
Cambridge, MA 02138March 2018, Revised July 2018
We thank Claudia Biancotti, Andrei Gonçalves, Jan Jindra, Christos Makridis, and seminar participants at Hong Kong Polytechnic University, Kent State University, Korea University, and the SEC for their useful comments. All errors are our own. The views expressed herein are those of the authors and do not necessarily reflect the views of the National Bureau of Economic Research.
At least one co-author has disclosed a financial relationship of potential relevance for this research. Further information is available online at http://www.nber.org/papers/w24409.ack
NBER working papers are circulated for discussion and comment purposes. They have not been peer-reviewed or been subject to the review by the NBER Board of Directors that accompanies official NBER publications.
© 2018 by Shinichi Kamiya, Jun-Koo Kang, Jungmin Kim, Andreas Milidonis, and René M. Stulz. All rights reserved. Short sections of text, not to exceed two paragraphs, may be quoted without explicit permission provided that full credit, including © notice, is given to the source.

What is the Impact of Successful Cyberattacks on Target Firms?Shinichi Kamiya, Jun-Koo Kang, Jungmin Kim, Andreas Milidonis, and René M. Stulz NBER Working Paper No. 24409March 2018, Revised July 2018JEL No. G14,G32,G34,G35
ABSTRACT
We examine which firms are targets of cyberattacks and how they are affected. We find that cyberattacks cause firms to reassess the risks that they are exposed to and their consequences, so that they have real effects on firm policies even when targets are not financially constrained. Cyberattacks are more likely to occur at more visible firms, firms with more intangible assets, and firms with less board attention to risk management. Attacks where personal financial information is appropriated are associated with a negative stock-market reaction, a decrease in sales growth for large firms and retail firms, an increase in leverage, a deterioration in financial health, and a decrease in investment in the short run. Firms further respond to cyberattacks by reducing CEO bonuses and risk-taking incentives and by strengthening their risk management.
Shinichi KamiyaNanyang Technological University Nanyang Business School50 Nanyang [email protected]
Jun-Koo KangNanyang Technological University Nanyang Business School50 Nanyang [email protected]
Jungmin KimHong Kong Polytechnic UniversitySchool of Accounting and Finance Hong [email protected]
Andreas MilidonisUniversity of CyprusSchool of Economics and ManagementDepartment of Accounting and FinanceP.O. Box 20537, NicosiaCY-1678 [email protected]
René M. StulzThe Ohio State UniversityFisher College of Business806A Fisher HallColumbus, OH 43210-1144and [email protected]
1
I. Introduction
Cyber risk has become an important source of risk for corporations.1 For example, in 2017, risk
practitioners estimated that the most important operational risk is cyber risk and data security.2 A survey of
CEOs across the world by PWC found that more than half of the CEOs expect cybersecurity and data
breaches to threaten stakeholder trust in their industries over the next five years.3 Despite the widespread
recognition of emerging threats posed by cyber risk and its importance as a new type of risk, there is little
evidence on how successful cyberattacks affect corporations. In particular, we know little about which types
of firms are more likely to experience successful cyberattacks, and how such attacks affect target firm
shareholder wealth, growth, and financial strength. We also know little about how firms change managerial
risk-taking incentives and their risk management after attacks. In this study, we investigate these important
but unexplored issues by analyzing a comprehensive sample of disclosed cyberattacks involving data
breaches on public corporations from 2005 to 2017.
Although there is no systematic evidence on the impact of cyberattacks on firms, the case of Target
Corporation, the Minnesota-based second largest discount store retailer, provides a useful illustration of
what the impact of such an attack can be. From November 27 to December 15, 2013, Target experienced a
massive cyberattack that resulted in the loss of almost 70 million customers’ personal information such as
phone numbers and credit card information.4 On December 19, 2013, Target publicly acknowledged the
breach and unveiled measures that cost $100 million for upgrading its IT system and adapting new
technology to increase the security of credit card transactions. Despite its strong public commitment to take
1 Although there is no consensus about an exact definition of cyber risk, the U.S. Department of Homeland Security describes it as “capabilities to disrupt, destroy, or threaten the delivery of essential services, or exploit vulnerabilities to steal information and money by sophisticated cyber actors and nation-states” (“Cybersecurity Overview,” Homeland Security, https://www.dhs.gov/cybersecurity-overview).” The Institute of Risk Management views cyber risk as “any risk of financial loss, disruption or damage to the reputation of an organization from some sort of failure of its information technology systems (“Cyber Risk,” The Institute of Risk Management, https://www.theirm.org/knowledge-and-resources/thought-leadership/cyber-risk/”). 2 “Top 10 Operational Risks for 2017,” Risk.net (January 23, 2017). 3 See “Risk in Review 2017 Study,” PWC (April 2017), p. 20. 4 “Timeline of Target's Cyberattack and Aftermath: How Cyber Theft Snowballed for the Giant Retailer,” International Business Times (May 5, 2014), http://www.ibtimes.com/timeline-targets-data-breach-aftermath-how-cybertheft-snowballed-giant-retailer-1580056.
2
measures to reduce the risk of being attacked, the stock price of Target dropped by almost 2.2% on the
announcement day, which represents an estimated market value loss of $890 million. Target’s EBIT
decreased by $1.59 billion (-28.6%) from $5.52 billion during the four quarters prior to the breach to $3.94
billion during the four quarters after the breach. In addition, Target reported data breach-related expenses
of $292 million including the settlement of class action lawsuits and investigations by state prosecutors in
its 2016 10-K. This example shows that a cyberattack can have a large negative impact on the target firm.
This example is by no means extreme. For instance, two months after the announcement of the 2017
cyberattack on Equifax, a consumer credit reporting agency, its stock price was lower by almost a quarter
than before the attack.
We provide a simple model to examine the economic implications of successful cyberattacks. We
define a successful cyberattack as one that breaches the firm’s defenses. In the following, we use
cyberattack to denote a successful cyberattack for simplicity.5 We distinguish between cyberattacks that
change the assessment of the loss distribution of cyberattacks versus those that have no such impact. With
the loss distribution unchanged, we show that a firm’s loss from a cyberattack should not affect its future
actions if it is not financially constrained except for actions that restore it to its financial position before the
attack. If the loss distribution or more generally the firm’s assessment of its risk exposures changes, the
firm will adjust its policies to its new understanding of the loss distribution. The change in the assessment
of the loss distribution may be rational – the result of the firm having more information – or can be due to
behavioral reactions to adverse outcomes that were believed to have an extremely low probability. As the
loss distribution becomes less favorable, the firm increases its expenditures to decrease the probability of
an attack, invests more in risk management, and decreases its willingness to take other risks. We test these
predictions by examining the costs of cyberattacks (i.e., adverse effects on firm value) and post-attack
changes in firm policies.
To provide systematic evidence on how successful cyberattacks affect firm value, financial strength,
5 Throughout the paper, we use the words “cyberattacks” and “attacks” interchangeably.
3
growth, and policies, we use data breach events caused by cyberattacks reported to the Privacy Rights
Clearinghouse (PRC) over the period 2005 to 2017. Studying security breaches that result in the loss of
personal information obtained from the PRC has an important advantage compared to using other types of
data breaches because firms must disclose such breaches to affected persons in a timely manner under the
State Security Breach Notification Laws. Although it is possible that an attacked firm in our sample
withheld the information about the discovery of the incident and delayed its announcement to the public,
the disclosure requirements mandated by the data breach notification laws help alleviate potential sample
underreporting biases that may occur in other studies using data breaches without such reporting
requirements.6
Moreover, there are two additional advantages in our sample. First, our sample includes a homogenous
sample of attacks as it only includes attacks initiated by outside parties. Specifically, throughout our
analyses, we include as cyberattack events only successful malicious external actions, such as hacking and
malware (hereafter “cyberattacks”) and exclude other incidents associated with internal errors or failure to
follow information handling policies (e.g., internal fraud, unintended disclosure, the loss of portable device,
the loss of stationary device, and physical loss) as these events are not the result of attacks on computers
and computer networks by outsiders. Second, while previous studies use only data breaches that occurred
at the parent firm level, we include cyberattacks on subsidiaries (e.g., attack on Kmart that is a subsidiary
of Sears) as well as those on parent firms. This comprehensive attack sample allows us to examine the
consequences of adverse cyber security events in a systematic manner.
We first examine which firms are more likely to be affected by cyberattacks. A priori, it is unclear
which types of firms are more likely to become the targets of cyberattacks. To the extent that hackers target
firms in which the benefits of hacking exceed its costs, they are more likely to breach firms’ security in
which they can take advantage of valuable information such as visible firms (e.g., large firms and firms
6 For example, using the data breaches covered in the AuditAnalytics cyber-attacks and VCDB VERIS databases, Amir, Levi, and Livne (2018) examine the extent to which firms withhold information on cyberattacks. Their sample includes data breaches that do not involve the loss of personal information (and thus are not subject to the Security Breach Notification Law) as well as “Confidentiality” events that potentially involve the loss of personal information.
4
included in the Fortune 500 list) and firms in which customers’ personal information is important in doing
business (e.g., financial and retail firms). However, it is also possible that hackers target the firms whose
defenses are easier to breach, such as small firms or risky firms, because visible firms and firms for which
customers’ personal information is important may have more effective risk management and IT security
systems. Our likelihood analysis shows that firms are more likely to experience cyberattacks when they are
larger, are included in the list of Fortune 500 companies, are financially less constrained, are more highly
valued, and have more intangible assets. We also find that cyberattacks are more likely to occur in firms
operating in industries that are less competitive (i.e., industries with higher Herfindahl index and those in
which firms sell more unique products, measured as the ratio of selling expense to sales). Firm-level
corporate governance characteristics, such as CEO-chair duality, the proportion of outside directors on the
board, and board size, do not predict the likelihood of cyberattacks. Lastly, firms that pay more attention to
risk management at the top, which we measure using the information reported in BoardEx about the
existence of a risk management committee on the board, are less likely to be attacked.
Second, we analyze market reactions to the announcement of cyberattacks. A cyberattack is expected
to be costly for a firm as it is likely to distract management and lead to expenses on systems, to litigation
costs, and possibly to fines. Consequently, we expect a negative abnormal return for firms that announce a
cyberattack. Consistent with this expectation, we find a significant mean cumulative abnormal return (CAR)
of −0.84% during the three-day window around cyber-attack announcements. With a mean market value of
about $58.93 billion for our sample of attacked firms, this translates into an average value loss of $495
million per attack. When we divide the sample into the attacks that result in financial information loss (i.e.,
loss of social security numbers and/or loss of bank account and credit card information) and those that result
in no financial information loss (loss of other personally identifiable non-financial information such as
information on driver license, medical records, and e-mails), the abnormal returns are only significantly
negative for the former sample. For firms experiencing cyberattacks that result in loss of personal financial
information, their mean CAR (-1, 1) is −1.09%. We also find weak evidence that cyberattacks have a much
worse impact when the incident is a recurring event within one year. The impact is especially negative when

5
attacked firms are older and when they do not have evidence of board attention to risk management
(measured by whether the board or a board committee explicitly has the role of monitoring firm risks and
risk management) as the abnormal return is lower by 4 percentage points for such firms. However, we find
no consistent evidence that the stock-price reaction is worse for financially constrained firms.
Third, we investigate whether attacked firms experience a decrease in sales growth by conducting a
difference-in-differences analysis using a propensity-score-matched sample. Given the fact that only attacks
with loss of financial information have a significant adverse impact on target firms, we highlight results
that use only the attacks with loss of financial information. From our simple model, sales growth would fall
if customers learn about the risk. Consistent with this prediction, we find that sales growth significantly
declines for the three years after the attack. We further find that the impact of cyberattacks on sales growth
exhibits substantial cross-sectional variation: large firms experience a significant decrease in sales growth
while small firms do not. We also find a significant large negative impact of cyberattacks on sales growth
for firms operating in the retail industry. Though we do not find an adverse impact of cyberattacks on
operating performance (ROA and cash flow / total assets) in general, they do have an adverse impact for
large firms and firms operating in durable goods industries.
We next examine whether attacked firms’ financial strength falls using a difference-in-differences
analysis. We find that, after the attack, attacked firms experience a decrease in credit ratings, an increase in
the probability of bankruptcy, an increase in cash flow volatility, and a decrease in shareholder net worth.
Fourth, we examine how firms adjust their investment and financial policies in response to cyberattacks.
If a cyberattack changes the perception of the board and management about the likelihood and cost of
cyberattacks, or more generally changes their perception of the firm’s risk exposures and its ability to
manage risk, we would expect post-attack changes in investment and financial policies. There is weak
evidence that compared to non-attacked control firms, attacked firms reduce capital expenditures and
experience a greater financing deficit after the attack. Since attacks involve out-of-pocket costs and result
in a greater financing deficit, attacked firms have to respond by securing funds to pay for these costs. We
find that attacked firms use debt rather than equity to address their funding requirements, and that they use
6
long-term debt rather than short-term debt, so that the maturity of their debt lengthens. A potential
explanation for the increase in debt maturity is that firms that are potentially vulnerable to attacks in the
short-term want to avoid frequent debt rollovers, as rolling over debt shortly after an attack might be
difficult. We find no evidence that firms’ responses depend on whether they are financially constrained
before the attack. This result is perhaps not surprising in light of the fact that almost no attacked firm is
financially constrained.
Fifth, we assess how a firm’s risk management changes as a result of an attack. We find that victims
of a cyberattack are more likely to increase board oversight of firm risk. This result is again consistent with
the hypothesis that the board and management reassess the risks the firm is exposed to after an attack and
the costs of these risks. For example, management could conclude that exposures to risks have become
more costly if customers have become more concerned about the risks the firm is exposed to, including the
risk of cyberattacks. In this case, management might want to decrease the firm’s risk exposures to affect
customers’ willingness to do businesses with it.
Sixth, if a cyberattack changes the board’s assessment of firm risk, we would expect the CEO’s risk-
taking incentives to be adjusted. An increase in assessed firm-level risk caused by cyberattacks can have
two opposing impacts that boards would be expected to take into account when they adjust CEOs’ pre-
attack compensation structure. On the one hand, when a cyberattack significantly increases firm-specific
risk, to minimize its effect on her undiversified (with respect to firm risk) wealth, a risk-averse CEO may
forgo risky, positive NPV projects that shareholders prefer to invest in. Thus, to provide the CEO with
strong risk-taking incentives, a board may attempt to adjust the CEO’s compensation structure, for example,
by increasing compensation convexity (e.g., using more stock options in CEO compensation). On the other
hand, a cyberattack may lead a board to reconsider the risk-taking incentives of the CEO and decrease these
incentives because the attack may have led to a reduction in the board’s risk appetite, either because it was
surprised by the consequences of the cyberattack or simply due to behavioral reasons. This will prompt
boards to lower compensation convexity by reducing the use of stock options or replacing stock options
with restricted stocks, a form of equity-based compensation that does not share the convexity of stock
7
options. We should also see the bonus component of compensation being reduced if the board believes that
management performed poorly either by not taking steps to prevent an attack or in responding to the attack.
We find that attacked firms do not reduce the overall level of CEO equity incentives (i.e., the ratio of
equity-based compensation to CEO total pay) after a cyberattack. However, attacked firms significantly
increase restricted stock grants and reduce option awards, suggesting that they replace stock options with
restricted stock and hence reduce the risk-taking incentives of CEOs. Attacked firms also respond to
cyberattacks by significantly reducing the proportion of CEO bonus to total pay.
Our study contributes to the literature at least in three important ways. First, we provide systematic
evidence on potential losses in shareholder value and changes in corporate policies caused by cyberattacks.
Although previous studies also examine the valuation effect of cyberattack announcements, most of these
studies use breach events including both cyberattacks and incidents associated with internal errors or failure
to follow information handling policies,7 and do not examine the post-attack changes in corporate policies
that we focus on.8 By utilizing the most recent and comprehensive cyber risk incidents reported in the PRC
database and focusing only on successful cyberattacks, we are able to reevaluate the overall effects of cyber
risk on firm value and assess the impact of attacks on various corporate policies. Further, we show that only
7 Most studies in the information security literature that examine the impact of cyberattacks on the market value of U.S. firms focus on the events that occur in the late 1990s and the early 2000s, and their empirical evidence is inconclusive (Campbell et al. (2003), Garg, Curtis, and Halper (2003a, 2003b), Hovav and D’arcy (2003), Cavusoglu, Mishra, and Raghunathan (2004), Hovav and D’arcy (2004), Ko and Dorantes (2006)). There are only a limited number of finance studies that examine the valuation impact of cyberattacks including Cummins, Lewis, and Wei (2006), Gatzlaff and McCullough (2010), Hilary, Segal, and Zhang (2016), Johnson, Kang, and Lawson (2017), Amir, Levi, and Livne (2018), Bianchi and Tosun (2018), Lending, Minnick, and Schorno (2018), and Akey, Lewellen, and Liskovich (2018). Unlike our analyses that focus only on malicious external actions such as hacking and malware, their main analyses include data breaches caused by insiders’ mishandling of sensitive information and by theft of laptops and physical devices. 8 Several previous papers examine post-breach changes in firm outcomes that are different from those in our study. For example, using all types of breaches including insiders’ mishandling of sensitive information, Hilary, Segal, and Zhang (2016) find that attacked firms do not experience any significant changes in operational performance, executive departure likelihood, shareholder clientele, and the amount of disclosure after the breaches. Makridis and Dean (2018) find some evidence on the negative association between breaches and firm productivity using data from the PRC and Department of Health and Human Services from 2005 to 2016. Akey, Lewellen, and Liskovich (2018) and Lending, Minnick, and Schorno (2018) further find that firms significantly increase their investment in corporate social responsibility (CSR) in the years following a breach, and Nordlund (2017) documents that directors in a breached firm experience an increase in the likelihood of turnover.
8
the attacks that involve theft of financial information decrease shareholder wealth and that as a result of the
attacks, firms become more financially fragile.
Second, though cyber risk has become one of the most important operational risks of firms, the risk
management literature has not paid much attention to this risk thus far. We find that firms’ attention to risk
management, as evidenced by the existence of a risk committee on the board, is associated with a lower
incidence of cyberattacks. We also find that firms whose boards pay attention to risk management prior to
cyberattacks experience a less negative valuation impact when cyberattacks do happen. Our evidence also
suggests that one important effect of cyberattacks on target firms is that they result in a reassessment of
target firms’ risk exposures. We would expect firms realizing that their risk exposures are greater than
previously known to pay more attention to risk management, as operational risk management can decrease
the probability of operational risk events and reduce their severity, and we find that this is the case.
Third, our study contributes to the compensation literature by showing that boards adjust the mix of
the CEO’s equity-based pay in responding to uncertainty-increasing exogenous events that occur at the
firm-level. Although many studies have examined the relation between equity incentives and risk-taking
incentives (e.g., Guay (1999), Coles, Daniel, and Naveen (2006)), there is little evidence showing how
firms dynamically adjust CEOs’ optimal compensation package to manage their risk-taking incentives in
response to changes in a firm’s risk environment. The only exception is Gormley, Matsa, and Milbourn
(2013) who examine how an increase in a firm’s left-tail risk (i.e., a jump in risk that is created when a
chemical to which a firm’s workers have already been exposed is newly identified as a carcinogen) affects
the board’s compensation policy and how the changes in compensation policy affect the CEO’s risk-taking
behavior. Our study is different from theirs in that we focus on cyber risk as an unexpected shock to a firm’s
assessed risk exposures. Our analysis indicates that firms respond to cyberattacks by replacing stock options
with restricted stocks, and hence they decrease management’s incentives to take risks. These actions are
consistent with firms learning from such attacks that they have greater risk exposures than they expected.
The rest of this paper is organized as follows. In Section II, we examine the theoretical predictions of
the impact of cyberattacks on firms. In Section III, we describe our sample construction and present the
9
distribution of sample events and firm characteristics. In Section IV, we examine the likelihood of firms
being attacked using various firm and industry characteristics. In Section V, we analyze the shareholder
wealth impact of cyberattacks and, in Section VI, we examine the impacts of cyberattacks on operating
performance, financial health, and financial, investment, and risk management policies. We also investigate
how boards adjust CEO compensation structure in responding to cyber risk incidents. We conclude in
Section VII.
II. Risk management and cyberattacks
Cyber risk is one form of operational risk. Firms try to assess operational risk using loss distributions
(e.g., Crouhy, Galai, and Marks (2014)). These distributions are the result of the convolution of a frequency
distribution and a loss severity distribution. Firms can affect their exposure to an operational risk by taking
risk mitigating actions (e.g., upgrading IT security systems and hiring Chief Information Officers who are
responsible for cyber risk management), but these mitigating actions have a cost. As a result, we expect
firms to invest more in risk mitigating actions if adverse outcomes (e.g., loss of sales, recovery costs of IT
systems, and litigation costs)) are costlier to them. Our model is designed to capture these effects.
We consider the problem of a single firm deciding how much to invest in risk management (i.e., the
risk mitigating action). The firm has valuable databases that could be hacked and it can invest in risk
management to decrease the probability of being hacked, 𝑝𝑝 ∈ [0,1]. If hacked, the firm loses 𝐶𝐶𝐶𝐶 > 0,
which, for simplicity, is a fixed and known amount. Consequently, the expected cost of being hacked is
equal to 𝑝𝑝 × 𝐶𝐶𝐶𝐶.
The cost of maintaining a risk management program to keep the probability of being hacked at 𝑝𝑝 is
equal to 𝑄𝑄(𝑝𝑝), which is a decreasing (𝑄𝑄′ < 0) and convex (𝑄𝑄" > 0) function of 𝑝𝑝 with lim𝑝𝑝→0
𝑄𝑄(𝑝𝑝) = ∞.
Intuitively, it is costlier to maintain a lower probability of being hacked and the marginal cost of improving
risk management becomes prohibitively expensive as the probability of being hacked gets closer to zero,
so that it is effectively impossible to fully eliminate the risk of being hacked.
10
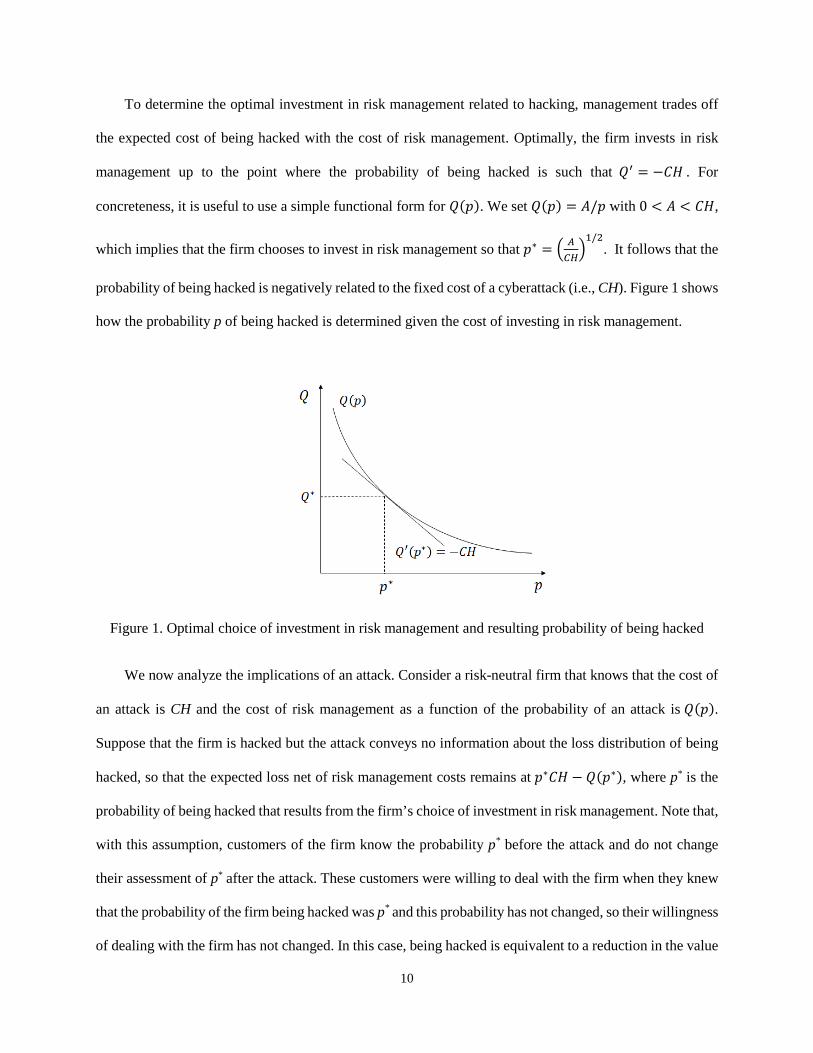
To determine the optimal investment in risk management related to hacking, management trades off
the expected cost of being hacked with the cost of risk management. Optimally, the firm invests in risk
management up to the point where the probability of being hacked is such that 𝑄𝑄′ = −𝐶𝐶𝐶𝐶 . For
concreteness, it is useful to use a simple functional form for 𝑄𝑄(𝑝𝑝). We set 𝑄𝑄(𝑝𝑝) = 𝐴𝐴/𝑝𝑝 with 0 < 𝐴𝐴 < 𝐶𝐶𝐶𝐶,
which implies that the firm chooses to invest in risk management so that 𝑝𝑝∗ = � 𝐴𝐴𝐶𝐶𝐶𝐶�1/2
. It follows that the
probability of being hacked is negatively related to the fixed cost of a cyberattack (i.e., CH). Figure 1 shows
how the probability p of being hacked is determined given the cost of investing in risk management.
Figure 1. Optimal choice of investment in risk management and resulting probability of being hacked
We now analyze the implications of an attack. Consider a risk-neutral firm that knows that the cost of
an attack is CH and the cost of risk management as a function of the probability of an attack is 𝑄𝑄(𝑝𝑝).
Suppose that the firm is hacked but the attack conveys no information about the loss distribution of being
hacked, so that the expected loss net of risk management costs remains at 𝑝𝑝∗𝐶𝐶𝐶𝐶 − 𝑄𝑄(𝑝𝑝∗), where p* is the
probability of being hacked that results from the firm’s choice of investment in risk management. Note that,
with this assumption, customers of the firm know the probability p* before the attack and do not change
their assessment of p* after the attack. These customers were willing to deal with the firm when they knew
that the probability of the firm being hacked was p* and this probability has not changed, so their willingness
of dealing with the firm has not changed. In this case, being hacked is equivalent to a reduction in the value

11
of the firm as it will have out-of-pocket costs as a result of the cyberattack. As long as these costs do not
make the firm financially constrained, the cyberattack has no implications beyond the sunk cost resulting
from the attack. If the firm had good growth opportunities before the attack, it still has these opportunities
and thus should take advantage of them. If the attack worsens financial constraints or makes the firm
financially constrained, it will not be able to put itself back in the situation it was in before the attack. As a
result, it will have to change its policies to reflect its financially constrained state. Such a firm might, for
instance, have to cut investment to make cash available to deal with the consequences of the attack.
Alternatively, firms or their customers learn from the cyberattack. First, customers could infer that the
probability of an attack was higher than they thought. This could be because they thought risk management
would be more effective. In this case, customers’ demand for the firm’s products will fall. Customers could
also infer that the firm is generally willing to take risks that could be costly for them or is managing its risks
more poorly than anticipated. This could reduce demand further. Second, management could infer that the
probability of an attack is higher than they thought or that the costs of an attack are higher than they thought.
Such an outcome could arise, for instance, because the attack reveals defensive weaknesses that the firm is
not aware of or that the firm is too optimistic in its assessment that defensive weaknesses would not be
discovered by outsiders. In this case, the attack would lead the firm to make further investments to decrease
the risk of an attack, to invest more in risk management, and to become less willing to take risks generally.
The firm would have a similar response if the attack leads it to develop a worse assessment of its risk
exposures and its ability to manage risk in general. Financially constrained firms might not be able to make
some investments and might have to cut back on capital expenditures, for instance, to release resources to
cope with the aftermath of the attack.
The analysis so far assumes that customers and managers are fully and equally informed and rational.
It is well-known in the behavioral literature that individuals can ignore or underestimate risks (Kahneman
and Tversky (1972)). Recent work in finance further shows the possibility for some low risk events to be
neglected (e.g., Gennaioli, Shleifer, and Vishny (2015)). When such risks manifest themselves, a
reassessment of the distribution of risks takes place. As a result, when an attack occurs, it leads customers
12
and/or managers to reassess the importance of these risks. It is then possible for customers and/or managers
to overreact to an attack in the sense that they might conclude that the probability of an attack is much
higher than it actually is due to the availability heuristic (Tversky and Kahneman (1973)).
Consider a firm with value that is a concave function of future profits, so that greater volatility in
profits keeping the mean constant decreases the value of the firm. For such a firm, there is value to risk
management that decreases the volatility of profits and there exists an optimal level of volatility of profits
given the cost of risk management (see, for instance, Smith and Stulz (1985) and Froot, Scharfstein, and
Stein (1993)). If a particular risk is discovered to be higher than anticipated, this firm will choose to reduce
risk generally to bring its level of risk back to the optimal level. Hence, a firm that discovers that the risk
of hacking is higher than expected is likely to make risk management investments to reduce risk along other
dimensions.
These theoretical arguments lead to the following hypotheses:
Hypothesis 1 (no learning case). In this case, the attack has no impact on future activities of the firm
if the firm is not financially constrained except for activities that raise funds to offset the loss resulting
directly from the attack. The attack itself results in a loss of value of the firm’s securities. The impact of the
attack is higher if the firm is financially constrained as, in that case, the attack also changes the firm’s
investment and financial policies and has a larger impact on the firm’s securities.
Hypothesis 2 (learning case). In this case, if customers learn that the probability of an attack is higher
than they expected, sales growth falls, but in response managers will increase investment in risk
management, which will reduce the decrease in sales growth. If managers learn that the cost of an attack is
higher than anticipated or that the probability of an attack is higher than anticipated for a given investment
in risk management, the firm will invest more to reduce the risk of an attack, reduce its risk-taking, and
invest more in risk management.
13
III. Sample
To construct our sample of cyberattacks, we first start with all data breach incidents (6,328 incidents)
covered in the PRC database over the period of 2005 to 2017.9 We use the PRC database since firms are
required to disclose data breaches to affected persons in a timely manner under the State Security Breach
Notification Laws. In Appendix A, we discuss these State Security Breach Notification Laws and other
regulations that govern firms’ disclosure requirements for data breaches, such as the Securities and
Exchange Commission (SEC) Cybersecurity Disclosure Guidance that requires publicly traded firms to
disclose “materially important” cyber incidents in a Form 8-K filing and the Privacy Rule of the Health
Insurance Portability and Accountability Act of 1996 (HIPAA) that requires firms to notify breaches of
unsecured protected health information to the Secretary of the U.S. Department of Health and Human
Services. We delete incidents on governments, educational institutions, and non-profit organizations,
resulting in a sample of 4,769 incidents on privately held and publicly listed firms. We then include only
incidents in which a firm lost personal information by hacking or malware-electronic entry by an outside
party (1,580 incidents). Next, we manually match organization names reported in the PRC database with
firm names listed in Compustat and the Center for Research in Securities Prices (CRSP). When attacked
firms are unlisted subsidiaries of listed firms, we consider cyberattacks as having occurred in their listed
parent firms. If we cannot match organization names recorded in the PRC database with firm names in
Compustat and CRSP, we search Capital IQ corporate profiles and other sources including company
9 We obtain the data from the PRC’s website, http://www.privacyrights.org/data-breach, which are downloaded on July 10, 2015 for the 2005-2014 sample period and on April 14, 2018 for the later sample period. Established to protect individuals’ privacy, PRC, a nonprofit consumer and advocacy organization, located in San Diego, California, collects information about breach events from government agencies and verifiable news sources, and publishes the chronology of reported breach events involving loss of personally identifiable information that can be used to identify an individual in context (e.g., social security numbers, bank account information, emails, driver license numbers, and medical information) in the U.S. starting from 2005. The PRC classifies the attacks with the loss of personally identifiable information into breaches that result in financial information loss (e.g., loss of social security numbers and financial information such as credit card information) and others that result in no financial information loss (i.e., loss of driver license numbers and medical information). However, the PRC does not provide such a classification in recent years. Thus, we obtain the information after 2014 by manually searching event descriptions in the PRC database and news articles from Factiva. Although the PRC database also includes certain cyberattack incidents that do not involve the loss of personal information, we exclude these incidents from our sample to minimize the self-selection bias because they are not subject to cyberattack notification laws and firms may not have an obligation to disclose them. See also https://www.privacyrights.org/data-breach-FAQ for a detailed description of the data provided by PRC.
14
websites and Factiva to ensure the accuracy of their names for proper matching. We restrict the sample to
attacked firms with financial and stock return data available in Compustat and CRSP, respectively. We
require the sample firms to be listed on the New York Stock Exchange, the American Stock Exchange, or
Nasdaq. These procedures yield a final sample of 307 cyberattacks for 224 unique firms, of which 163 are
attacks on parents firms and 144 are attacks on subsidiaries.10 Of 224 attacked firms, 51 firms (22.8%)
experience multiple cyberattacks during our sample period. In our sample, 73.9% of the reported
cyberattacks involve financial information loss and the remaining 26.1% involve no financial information
loss.
Table I presents a chronological distribution of the 307 cyberattacks by industry (SIC two-digit codes)
and year. We find a generally increasing trend in the number of cyberattacks occurring over time: only four
attacks occurred in 2005, in contrast to 46 in 2017. We also find that industries in which cyberattacks occur
most frequently are service industries (31.27%), followed by finance (23.45%), manufacturing (17.59%)
and wholesale trade and retail trade industries (15.96%), which suggests that firms that deal with a large
number of customers are more likely to experience a cyberattack.
IV. Likelihood of Experiencing Cyberattacks
To examine firm and industry characteristics that drive cyberattack incidents, we first compare the
characteristics of firms that were successfully attacked, which we call targets, with those of firms that were
10 As discussed in Appendix A, the PRC database does not cover all cyberattack incidents of publicly listed firms in the U.S. due to the following two reasons. First, although most states have legislated state cyberattack notification laws by 2009, which require firms operating in the state to notify affected residents about cyberattack incidents, three states (i.e., Alabama, New Mexico, and South Dakota) had no such laws for the whole sample period. Second, even for incidents that are subject to state cyberattack notification laws, many states do not have legislations that require the state government to collect data on cyberattack incidents and disclose the relevant information. Thus, it is possible that our sample underestimates the true extent of cyberattacks that affect publicly listed firms in the U.S. To check the representativeness of our sample, we independently search Factiva to locate news articles reporting cyberattack incidents in 2012 alone and compare the incidents reported by news media with those collected by the PRC database in 2012. We use the following keywords to locate the articles on cyberattack events in Factiva: “hacking,” “hacked,” “malware,” “spyware,” “cyber attack,” and cyberattack.” We restrict news sources to major wires including Dow Jones Newswires, Major News and Business Sources, Press Release Wires, Reuters Newswires, and The Wall Street Journal-All sources. We find that 18 incidents are covered in news media, of which 17 are included in the PRC database. The remaining one does not involve any loss of personal information and thus is not covered in the PRC database. Thus, it appears that the PRC database covers most of major cyberattack incidents.
15
not attacked successfully, which we call non-targets. Note that a non-target can have been attacked, but the
attack was not successful. No data is available on unsuccessful attacks. As we focus only on cyberattack
incidents that involve the loss of personal information subject to cyberattack notification laws, the sample
used in this analysis represents the population of successful attacks where targets follow existing disclosure
requirements. When a firm experiences multiple cyberattacks in a given fiscal year, we treat all these
multiple attacks as a single attack in that year, so the sample size reduces to 259 from 307. Table II presents
summary statistics for 259 firm-year observations with cyberattack incidents and 54,717 firm-year
observations without cyberattack incidents covered in Compustat. It follows that the unconditional
probability of a cyberattack in a given year for a firm in our sample is extremely low, as it is 0.47%. We
winsorize all continuous variables at the 1st and 99th percentiles to mitigate the impact of outliers on our
analysis.
Focusing on firm-level characteristics, we find that compared to firms experiencing no cyberattack,
those experiencing cyberattacks are larger and older, and have a larger presence among Fortune 500
companies. These findings indicate that targets in our sample are more visible firms than non-target firms.
Targets are also more profitable (higher ROA) and less risky (lower stock return volatility), have higher
future growth opportunities (higher Tobin’s q), higher leverage, and higher asset intangibility, and invest
less in capital expenditures and R&D activities. Importantly, few targets are financially constrained. We
report results using the index of Whited and Wu (2006), but results are similar with other indices. Using
BoardEx board committee-level data, we also find that the proportion of firms having a risk committee on
the board is higher for targets than for non-targets.11 We consider a board having a risk committee if the
name of its committee includes “risk” (e.g., Enterprise Risk Management Committee, Risk Management
Committee, Audit and Risk Committee, and Governance, Nominating, and Risk Oversight Committee).
Turning to industry-specific characteristics, we find that cyberattacks are more prevalent among firms
11 When we exclude firms in finance industries (SIC 6000-6999) from the sample, we find the difference in the proportion of firms having a risk committee on the board between targets and non-targets (0.024 compared to 0.022) is insignificant. Thus, the difference in the existence of a risk committee between these two groups of firms reported in Table II is largely driven by firms in finance industries.
16
operating in industries in which product market competition is less intense (measured by Herfindahl index
and product uniqueness).
We turn next to a more direct examination of the likelihood of firms being targets. We use the data
panel from Table II as the sample. Table III reports results of estimates of probit regressions in which the
dependent variable is an indicator that takes value equal to one if a firm experiences a cyberattack in a given
year, and zero otherwise.12 We include several firm- and industry-level characteristics reported in Table II
as the explanatory variables that are measured one year before the attack. The only exception is Tobin’s q
that is measured two years before the attack since we find that it is highly correlated with past stock
performance. Using the lagged value of Tobin’s q helps address the correlation issue since Tobin’s q is
directly affected by returns. In Regression (1), we include only firm-level characteristics as determinants.
We also control for year and industry fixed effects (measured by two-digit SIC codes). We find that firms
with higher visibility (measured by firm size, Fortune 500 membership, and institutional block ownership),
higher valuations as measured by Tobin’s q, higher ROA, higher asset tangibility, and fewer financial
constraints are more likely to be targets of a cyberattack. In Regression (2), we add to Regression (1) an
indicator for whether the firm has a risk committee (Risk committee), measured using the board committee
information on BoardEx as discussed above. We control for the number of board committees in the
regression. We see that firms with a risk committee are less likely to be targets. The sample is smaller as
we require firms to have data available through BoardEx. With this smaller sample, we also find that
younger and less leveraged firms are more likely to be targets. Though we do not report the results, we also
estimate the regressions by adding corporate governance characteristics such as CEO-chair duality, the
proportion of outside directors on the board, and board size to examine whether the quality of corporate
governance can predict the likelihood of cyberattack incidents. We find that none of these variables is
12 We do not use hazard models in estimating the regressions in Table III due to the possibility of doubly censored data (i.e., the existence of multiple events for the same firm) in the analysis. Our sample may also not satisfy the assumption of non-informative censoring, the assumption that the mechanisms giving rise to censoring of the sample should not be related to the probability of an event occurring (Lagakos (1979)). For example, in our study, firms that are censored are unlikely to have the same probability of experiencing a subsequent event as firms that experience no cyberattacks.
17
significant. This result is in contrast to that of Chernobai, Jorion, and Yu (2011) who show that good
corporate governance plays an important role in reducing operational risk at U.S. financial institutions,
suggesting that either their results are specific to the financial industry or are specific to operational risks
in general but not to cyber risks.
In Regression (3), we add industry variables that capture industry competition (Industry Herfindahl
index and an indicator for unique industry) and future growth opportunities (industry Tobin’s q). We find
that cyberattacks are more likely in industries that face less intense product market competition (i.e.,
industries with a higher Herfindahl index and more unique products) and industries with higher growth
opportunities.
In Regression (4), we replace industry characteristics in Regression (3) with five industry indicators
defined using the first two-digit SIC codes and omit the manufacturing industry as a reference group to
examine whether cyberattacks are more likely in certain industries controlling for firm characteristics.13
We find that among the major industries, cyberattacks are more likely in service industries, wholesale trade
and retail trade industries, and transportation and communications industries. The coefficient on finance
industries, however, is not significant. Hence, controlling for firm characteristics, it is not just the fact that
a firm deals with large numbers of customers that makes an attack more likely.
Overall, the results in this section suggest that cyberattacks are more likely to occur in firms that are
more visible, with greater valuations, more intangible assets, without a board risk committee, and in less
competitive industries. Firms that are successfully targeted seem to rely more on customer personal
information in doing business.
13 In this regression, we exclude firms operating in three industries (agriculture, forestry, and fisheries industries, mineral and construction industries, and electric, gas, and sanitary services industries) in which the frequency of cyberattacks is too low (only one or three) during our sample period.
18
V. Impact of Cyberattacks on Shareholder Wealth
In this section, we investigate the shareholder wealth impact of cyberattacks using an event study. To
identify cyberattack announcement dates, we search news articles reported in Factiva for the 188 attacks
we identify. We also search Factiva for major confounding corporate events (e.g., announcements of
mergers and acquisitions, earnings, and security issuance) within one trading day before and after the
announcement and exclude observations associated with such news. Of 188 incidents, we are able to find
165 uncontaminated events in which news articles report cyberattacks and data on stock returns are not
missing in CRSP. We use the date when a news article reporting the cyberattack appears in Factiva for the
first time as the initial public announcement date. The abnormal stock returns are calculated using the
market model, the Fama-French (1993) three-factor model, and the Fama-French-Carhart (Carhart (1997))
four-factor model, respectively. The market model parameters are estimated using 220 trading days of
return data beginning 280 days before and ending 61 days before the breach announcement, using either
the value-weighted or the equally weighted CRSP index return as a proxy for the market return. The three
factors used in the Fama-French (1993) three-factor model are the CRSP value-weighted index, SMB (daily
return difference between the returns on small and large size portfolios), and HML (daily return difference
between the returns on high and low book-to-market-ratio portfolios). The four factors used in the Fama-
French-Carhart (Carhart (1997)) four-factor model are the CRSP value-weighted index, SMB, HML, and
UMD (daily return difference between the returns on high and low prior return portfolios). Daily abnormal
stock returns are cumulated to obtain the cumulative abnormal return (CAR) from day t1 before the breach
announcement date to day t2 after the breach announcement date.
Panel A of Table IV reports the mean and median CARs for various event windows. The mean CAR
(−1, 1), CAR (−2, 2), and CAR (−5, 5) computed using the market model and the CRSP value-weighted
index return are −0.84%, −1.10%, and −1.10%, respectively, all of which are significant. The corresponding
median CARs are −0.52%, −0.81%, and −1.36%, all of which are also significant. The results using the
CRSP equally weighted index return and those using the Fama-French (1993) three-factor model and the
Fama-French-Carhart (Carhart (1997)) four-factor model are similar.
19
In Panel B of Table IV, we examine whether the stock-price reaction differs when personal financial
information is stolen. We see that there is a highly significant difference in the stock-price reaction between
cyberattacks involving financial information loss and the other cyberattacks. The average CAR (−1, 1) is
−1.09% when there is financial information loss and an insignificant −0.23% when there is none. Similarly,
the corresponding average CARs (−2, 2) for cyberattacks with and without financial information loss are
−1.46% and −0.20%, respectively. The difference is significant at the 10% level. Tests for the significance
of median CARs using a non-parametric Wilcoxon signed-rank test show a similar pattern.
In untabulated tests, to examine whether the market reaction to cyberattacks worsens over time, we
also divide our sample into two sub-periods, the early sub-period from 2005 to June 2011 and the late sub-
period from July 2011 to 2017, and examine whether abnormal returns differ between these two sub-
periods. We find that the mean (median) CAR (-1, +1) for the early sub-period is -1.365 (-0.808) and the
corresponding CAR (-1, +1) for the late sub-period is -0.649 (-0.458), both of which are significant. The
difference in mean (median) CARs (-1, +1) between the two sub-periods is insignificant.
In Panel C, we investigate the determinants of the shareholder wealth impact of cyberattacks using
ordinary least squares (OLS) regressions in which the dependent variable is CAR (−1, 1). All regressions
use year and industry fixed effects (two-digit SIC codes) except for Regressions (3) and (4). We use as
explanatory variables firm size, log (firm age), ROA, leverage, sales growth, Tobin’s q, and institutional
block ownership. We also include an indicator that takes value equal to one if a firm’s Whited and Wu’s
(2006) index (WW index) is above the top tercile in a given year, and zero otherwise, an indicator that takes
the value one if a cyberattack involves financial information loss, and zero otherwise (Financial information
loss), and an indicator that takes value equal to one if a firm experiences another cyberattack incident within
one year of the previous cyberattack, and zero otherwise (Repeated cyberattacks within one year).
In Regression (1), we include only Financial information loss in addition to year and industry fixed
effects.14 We find that the coefficient on Financial information loss is negative and significant at the 1%
14 Although the PRC provides the information about the number of records breached, we do not use such information in our analyses. First, about a half of our sample observations used in our event study analysis have missing values on
20
level. The coefficient of −0.018 suggests that cyberattacks that involve the loss of financial information
lead to a 1.8 percentage points lower CAR (−1, 1) than those without such information loss. With a mean
market value of about $58.93 billion for our sample firms, the coefficient estimate of −0.018 suggests that,
all else equal, cyberattacks that result in financial information loss result in an average value loss of more
than $1.06 billion for the attacked firms than those that do not result in financial information loss.
In Regression (2), we add Repeated cyberattacks within one year and firm characteristics as additional
explanatory variables. The coefficient on Repeated cyberattacks within one year is −0.025 and significant
at the 10% level. The coefficient on Financial information loss is unchanged. It follows that repeated attacks
within one year involving financial information loss yield a stock-price reaction worse by 4.3 percentage
points than a first-time attack involving no information loss. Thus, firms experiencing repeated cyberattacks
have a more significant negative valuation effect than those experiencing a single cyberattack. We also find
that the market reaction is more negative when target firms are older and have higher leverage. The
coefficient on the indicator variable for financially constrained firms is insignificant.
In Regression (3), we add industry characteristics and find that the stock price reaction is not affected
by the degree of competition in an industry or by the uniqueness of industry products. However, firms in
industries with better growth opportunities are more adversely affected by a cyberattack.
In Regression (4), as in Regression (4) of Table III, we replace industry characteristics used in
Regression (3) with five industry indicators identified according to the first two-digit SIC codes and omit
the manufacturing industries. We do not find that the impact of attacks is worse for any particular industry.
In Regression (5), we examine whether board oversight of firm risk affects the impact of cyberattacks
on announcement returns. To capture board oversight of firm risk, we search a firm’s 10-K and Def14A
SEC filings.15 Specifically, we define Board attention to risk management as an indicator that takes value
the number of records breached. Second, the units of the number of records breached are not standardized and vary by incidents. 15 In Table III, we use BoardEx to define Risk committee for a large sample of firm-year observations covered in Compustat. Since BoardEx provides only the names of board committees, we identify the existence of a risk committee on the board by checking whether the name of a board committee includes “risk.” However, we find that some board committees whose names do not include “risk” still play an important role in firms’ risk oversight. For example, eBay
21
equal to one if a specific board committee (e.g., Enterprise-Wide Risk Management Committee, Risk
Committee, Audit and Risk committee, and Audit Committee that is responsible for risk oversight) or the
board as a whole explicitly monitors firm-wide risks and risk management, and zero otherwise. We find
that firms without board oversight of risk management experience a worse stock-price reaction by four
percentage points than those with board oversight of risk management.
In Regression (6), we examine whether the market reaction to a cyberattack announcement is affected
by the existence of a data breach notification law, which would affect managers’ incentives to disclose the
incidents. For example, managers of targets that are not subject to the state-level mandatory disclosure
requirements are likely to have greater incentives to withhold the bad news, which may cause more negative
announcement returns than those for incidents without information withholdings. To test this conjecture,
we add State law, an indicator that takes value equal to one if a firm is headquartered in a state in which a
data breach notification law is effective in a given year, and zero otherwise, and find that its coefficient is
negative and insignificant. However, it should be noted that, as discussed in Appendix A, a firm is required
to disclose a breach based upon the residency of the affected person, not based upon the location of the
breach. Given that a firm’s affected persons (for instance, customers) do not necessarily reside in its
headquarters state, this result should be interpreted with caution.
Next, we directly examine whether a firm’s delay of discovery and reporting about its cyberattack
affects its announcement return. To address this issue, we manually collect the information about the breach
date and the date in which the data breach was discovered by the target or a third party by searching Factiva,
breach reports disclosed by the state Attorney General’s Offices, and cyber security expert blogs such as
Krebs on Security.16 Using these dates, together with the announcement date obtained from Factiva, we
states in its 2016 proxy statement that “While the board is ultimately responsible for risk oversight at eBay, the board has delegated to the Audit Committee the primary responsibility for the oversight of risks facing our businesses.” Thus, using BoardEx data and focusing on board committee names alone does not allow us to accurately capture firms’ risk oversight at the board level in the case of firms such as eBay. To overcome this limitation of using BoardEx in identifying board oversight of firm risk, we manually collect the data on firm’s risk oversight by carefully reading 10-K and Def14A SEC filings for the relatively small sample used in Table IV. 16 https://krebsonsecurity.com
22
then construct two variables: 1) Delay of discovery, which is measured by the number of days from the
occurrence of the breach to the discovery of the breach by the firm and 2) Delay of reporting, which is
measured as the number of days from a firm’s discovery of the breach to the first media reporting. We use
Delay of discovery to capture the extent to which the firm finds it difficult to discover a security breach
caused by a cyberattack and Delay of reporting to capture the firm’s reporting delay of its incident.
Appendix B presents summary statistics for these two variables. Because of limited information available
in public sources and the difficulty to judge the exact timing of each event, the sample used in Appendix B
is very small. We find that the average (median) number of days from the occurrence to discovery is 47.2
(14.5) for a sample of 40 firms with the information available. We also find that the average number of
days from the discovery to the first media reporting is 16.2 for a sample of 67 firms with the information
available. The Appendix also reports that the average number of days from a firm’s discovery of the breach
to its reporting to the state regulator (a firm’s SEC 8-K filing) is 27.9 (19.3) days for a sample of 35 (12)
firms with the information available.
We estimate regressions where we use information about the delay in discovery and the delay in
reporting as key independent variables of interest. These regressions have to be treated with caution as the
sample size falls drastically. In Regression (7), we examine how a firm’s difficulty to discover the breach
affects its announcement return by adding the natural logarithm of Delay of discovery. Given that the sample
size used in the regression is very small, we replace two-digit SIC codes used to control for industry fixed
effects with Fama-French five industry codes. We find the market reaction is more negative for cyberattacks
in which target firms spent more time to uncover the breaches, suggesting that the firms’ difficulty in
detecting the attacks sends a bad signal to the market about the weakness of their internal controls and cyber
defenses. Excluding year fixed effects from the regression does not change the result. In Regression (8), we
examine how a firm’s delay in reporting an attack affects its abnormal return by including the natural
23
logarithm of Delay of reporting. We find that the coefficient on this variable is negative. However, it is not
significant, possibly due to the small sample size used in the regression.17
VI. Impact of Cyberattacks on Firm Performance, Risk, and Corporate Policies
A. Difference-in-differences Tests
To examine how cyberattacks affect firm performance, risk, and corporate policies, we perform
difference-in-differences tests using firm-year observations three years before and three years after the
attack. Since our difference-in-differences tests require three years of financial and stock return data after
the attacks, we do not include cyberattack events that occurred after 2014 in these analyses. We consider
only cyberattacks that result in financial information loss as our treatment sample since the analysis in
Section V shows that the negative impact of cyberattacks on firm value is concentrated in such events. For
firms that experience multiple cyberattacks during our sample period, we include only the first attack event.
For each treatment firm, we then identify a control firm that does not experience cyberattacks using
propensity-score matching. The propensity score is calculated using the logit regression of Cyberattack (an
indicator that takes value equal to one if a firm experiences a cyberattack in a given year, and zero
otherwise) on firm size, stock performance, stock return volatility, leverage, and the existence of an
institutional blockholder (indicator). We require both treated and matched firms to be in the same industry
(measured by two-digit SIC codes) as cyberattacks are concentrated among certain industries as shown in
the previous section. We also require treated and matched firms to be in the same fiscal year, so the control
firm has an “artificial” cyberattack year even if it does not experience a cyberattack (Chan, Chen, and Chen
(2013)). This approach allows us to perform difference-in-differences tests for the changes in performance,
risk, and corporate policies surrounding the cyberattack. We then match, without replacement, a target with
17 For a subsample of 67 firms for which discovery dates are available, in untabulated tests, we compute the average market-adjusted buy-and-hold stock return (HPR) from the discovery date to one day before the media reporting date and find that it (0.002) is not significant, suggesting no information leakage prior to the attack announcements.
24
a non-target control firm that has the closest propensity score with a caliper of 0.1 and a common support
range of 0.1 to 0.9 (Caliendo and Kopeinig (2008)).
Panel A of Table V presents descriptive statistics for a sample of 226 propensity-score matched
sample firms (113 firms with a cyberattack that results in financial information loss and their 113 matching
firms).18 We find no significant difference between targets and their matching non-targets, suggesting our
matching approach identifies matching firms that are very similar to treatment firms.
We use the following difference-in-differences regression specification:
OPit = α + βPostit × Cyberattackit + γt + ωi + εit, (1)
where OPit is operating performance for firm i at time t. We measure firm operating performance using four
variables: ROA, ROE, cash flow/assets, and sales growth. In subsequent analyses, we replace OP with the
variables that measure firm risk and corporate policies. Postit is an indicator that takes value equal to one
for firm-years in the post-attack period (year t, year t+1, and year t+2), and zero for the pre-attack period
(year t-1, year t-2, year t-3), where year t is the fiscal year in which a cyberattack occurs. Cyberattackit is
an indicator that takes value equal to one if firm i at time t experiences a cyberattack, and zero if firm i at
time t is a non-target control firm. Our key independent variable of interest is the interaction term between
Post and Cyberattack. We include industry (Fama-French 48 industries)-year-cohort fixed effects (γt) since
the effects of cyberattacks that occur in a specific industry in recent years may be different from those that
occur in the industry in earlier years due to the changing nature of cyberattacks over time. We include firm
fixed effects (ωi) to account for unobserved heterogeneity across firms and to allow the heterogeneity to
vary across paired groups. Note that we do not control for time-varying firm-specific variables in the
regression since these firm characteristics can be affected by cyberattacks and thus including them in the
regression biases estimates of the interaction term between Post and Cyberattack.
18 We find that nine (two) out of 113 (113) control (treatment) firms are delisted as a result of mergers or voluntary delisting within three years of cyberattacks. Delisting of two control firms are triggered by performance-related reasons (delisting codes 500, 505 to 588) (Shumway and Warther (1999)). Thus, survivorship bias is unlikely to be a concern for our matching sample.
25
In a separate regression, we also break down the interaction term between Post and Cyberattack into
interaction terms for three subperiods in the post-attack period: Yeart, Yeart+1, and Yeart+2. In this
regression, we include firm-specific variables as additional controls. The reason for including controls is
that firm characteristics in years after the attack could affect operating performance in these years. Hence,
the interpretation of the coefficient on the interaction term involving Post for year t+1, for instance, would
be the impact of the attack at t+1 given how firm characteristics have evolved up to that year.19 The number
of firm-year observations differs across the regressions depending on the availability of variables computed
using Compustat, CRSP, and ExecuComp data.
B. Impact on Operating Performance
Panel B of Table V reports regression estimates using a firm’s operating performance as the dependent
variable. We find no significant impact of cyberattacks on ROA, ROE, and cash flow/assets but a significant
negative impact on sales growth. The lack of significance of ROA, ROE, and cash flow/assets for the full
sample may be due to the fact that the impact of cyberattacks on operating performance varies across firms
and industries. We show in Panels C, D, and E of Table V that this heterogeneity across firm types and
industries indeed matters to explain the impact of cyberattacks on operating performance. In Panel C, we
divide the sample into two subgroups according to median firm size (total assets). We find that large firms
experience a significant decrease in ROA, cash flow, and sales growth after the attacks. The decrease in
sales growth is of 3.4 percentage points (Regression (7)), which is large compared to the average sales
growth of 8 percent the year before the attack for the sample of targets. We see in Panel D that ROA and
cash flow deteriorate significantly for firms in durable goods industries, which produce more unique
products and impose higher liquidation costs on customers than other industries (Titman (1984)) following
19 In untabulated tests, we also divide the sample according to the sample median values of the Kaplan and Zingales’ (1997) index, the Whited and Wu’s (2006) index, and the S&P credit rating score, and whether the firm is a dividend payer in a given year and reestimate all the regressions in Tables V through X. We find no systematic evidence that firms’ performance, financial health, or corporate policies in the post-attack periods are affected by extent to which they are financially constrained.

26
attacks. In Panel E, we find that sales growth falls by 5.4 percentage points following attacks for firms in
retail industries. Hence, for subsamples of large firms, firms in durable goods manufacturing industries,
and firms in retail industries, the negative impact of cyberattack on operating performance is more severe.
C. Impact on Financial Health
We next examine how cyberattacks affect a firm’s financial health. We use four measures of financial
health: Standard & Poor (S&P) credit rating, bankruptcy score, cash flow volatility, and net worth to total
assets. Table VI reports estimates of OLS regressions in which the dependent variables are these four
measures of financial health, respectively. Regressions (1) and (2) use S&P credit ratings as a measure of
financial health. We convert alphabetical symbols of S&P domestic long-term issuer credit ratings from
AAA+ to D into rating scale numbers (highest = 23, lowest =1) with higher numbers indicating better
ratings. There are 503 firm-year observations (39.0%) with no credit rating available. We exclude these
firms in estimating Regressions (1) and (2).20 We find that the coefficient on the interaction term between
Post and Cyberattack is negative and significant at the 10% level in Regression (1), suggesting that targets
experience deteriorating credit ratings in the post-attack period. The average three-year impact is -0.325
which corresponds to one third of a rating notch. Focusing on each post-attack year separately (i.e., years
t, t+1, and t+2) in Regression (2), we find that the decrease in credit rating is persistent for each of three
years after the attack.
In Regressions (3) and (4), we use the bankruptcy score (Shumway (2001)) as a measure of financial
health. We find that the coefficient on the interaction term between Post and Cyberattack is positive and
significant at the 10% level in Regression (3) for the three-year average. The coefficient is also positive and
significant for year t+1 in Regression (4), providing some evidence of an increase in bankruptcy probability.
20 In untabulated tests, we assign a rating scale number of zero for firms with no credit rating available, include an indicator that takes the value one for these firms in Regressions (1) and (2), and then reestimate the regressions. We find that our results do not change.
27
Greater cash flow volatility increases the risk that the firm will be short of cash. Regressions (5) and
(6) assess the impact of cyberattacks on cash flow volatility. Cash flow volatility is measured as the standard
deviation of quarterly cash flows from operations that are available from the statement of cash flows
(quarterly basic earnings per share before extraordinary items adjusted for stock splits) in a given fiscal
year. We find that the coefficients on the interaction term between Post and Cyberattack are positive and
significant in Regressions (5) and (6) except for Yeart+1, suggesting that targets experience a significant
increase in cash flow volatility.
Finally, in Regressions (7) and (8), we assess the impact of cyberattacks on the ratio of net worth
(stockholder equity) to total assets. A lower ratio of net worth to total assets means that the firm has less of
a cushion to cope with adversity. We see a significant reduction in this ratio for targets after the attack.
D. Impact on Investment and Financial Policies
In this subsection, we investigate how cyberattacks affect firms’ investment and financial policies. In
Panel A of Table VII, we break down a firm’s investment into three major components: capital
expenditures, research and development (R&D) expenditures, and expenses related to acquisitions. We find
no impact of cyberattacks on R&D expenditures and on expenses related to acquisitions. For capital
expenditures, we find an insignificant impact in Regression (1). However, when we investigate the impact
by year, we find a significant decrease in year t and in year t+2.
We next examine how firms’ external financing activities are affected by cyberattacks in Panel B of
Table VII. In Regressions (1) and (2), we first estimate the impact of a cyberattack on the firm’s financing
deficit. We find that the coefficient on the interaction term between Post and Cyberattack for the three-year
average is insignificant in Regression (1) but positive and significant for year t+1 in Regression (2),
providing weak evidence that a cyberattack increases a firm’s financing deficit. Regressions (3) and (4)
estimate the impact of a cyberattack on equity issuance. We see that firms do not attempt to reduce their
financing deficit by issuing equity. However, the next two regressions, Regressions (5) and (6), show that
a cyberattack leads targets to issue more debt than non-targets to make up their financing deficit.
28
In Panel C of Table VII, we examine how the cyberattack affects a firm’s leverage and the composition
of its debt. Regressions (1) and (2) use the total debt ratio as the dependent variable. Consistent with the
results in the previous panel, we find that the coefficient on the interaction term between Post and
Cyberattack for the three-year average after the attack is positive and significant at the 5% level in
Regression (1). The coefficient estimate of 0.024 for the interaction term suggests that after the cyberattack,
targets experience a significant increase in their leverage ratio of 2.4 percentage points. Given that the mean
leverage ratio for the full sample is 22.3%, this increase corresponds roughly to a 10% increase in leverage.
Regressions (3) and (4) show the impact of the cyberattack on the long-term debt ratio. In Regression (3),
we find that the coefficient on the interaction term between Post and Cyberattack is a significant 0.028,
suggesting that the increase in target firms’ debt level mostly comes from an increase in long-term debt.
When we divide the post-attack period into year t, year t+1, and year t+2 in Regression (4), we find an
increase in long-term debt in all these three subperiods. In contrast, in Regressions (5) and (6), we find no
impact of cyberattacks on the short-term debt ratio. Reflecting this increase in the long-term debt ratio in
the post-attack period, Regressions (7) and (8) show that target firms’ debt maturity (long-term debt / (debt
in current liabilities + long-term debt)) increases significantly in the post-attack period. By lengthening the
maturity of their debt, target firms reduce their exposure to rollover risk.
E. Risk Management Policies
Next, we examine how target firms change their risk management policies in the post-attack period.
While attacked firms often announce an investment in updating their IT security systems and replacement
of responsible executives such as the Chief Information Officer,21 little is known about whether and how a
cyberattack affects a firm’s overall risk management policies. We measure a firm’s commitment to risk
management at the board level using the same variable as that used in Table IV, Board attention to risk
management. We also decompose this indicator into two different indicators to further examine the extent
21 For instance, Equifax announced the replacements of Chief Information Officer and Chief Security Officer eight days after its initial public announcement of cybersecurity incident on September 7, 2017.
29
to which a firm is committed to overhauling its risk management policy: Risk oversight with committee,
which is an indicator that takes value equal to one if a board committee’s explicit duty involves ERM /
firm-wide risk management oversight, and zero otherwise; and Risk oversight without committee, which is
an indicator that takes value equal to one if a firm does not have any specific board risk committee but the
board as a whole oversees ERM/firm-wide risk management, and zero otherwise.
Table VIII reports results of OLS regressions. In Regressions (1) and (2), we use Board attention to
risk management as the dependent variable and find that targets’ boards are more likely to increase their
attention to firm-wide risk management after the attack than non-targets by a significant 19 percentage point
following attacks. In Regressions (3) and (4) and Regressions (5) and (6), we use Risk oversight with
committee and Risk oversight without committee, respectively, to measure a different level of a firm’s
commitment to risk management policies in the post-attack period. We find that our results in Regressions
(1) and (2) mainly come from Risk oversight with committee.22
In columns (7) and (8), we use a more restrictive definition of board attention to risk: Existence of
committee with risk name, which is an indicator that takes value equal to one if the name of a firm’s board
committee includes “risk” and its explicit duty involves oversight of firm-wide risk and risk management,
and zero otherwise. We find that the results are similar to those in Regressions (3) and (4) that use Risk
oversight with committee as the measure of board attention to risk.
F. Compensation Policies
A cyberattack could result in a drop in CEO compensation if the board believes that the CEO handled
the risk management of an attack poorly or did a poor job in responding to the attack. If the attack leads to
a reassessment of the firm’s risk exposures and risk appetite, we would also expect the board to change the
CEO’s risk-taking incentives. Specifically, if the board finds the firm to be riskier than it thought or
concludes that the firm’s risk appetite was too high, it would want to reduce the CEO’s risk-taking
22 We repeat our analysis in Table VIII after excluding firms in financial industries (SIC 6000-6999). We find that excluding financial firms does not change our results.
30
incentives by adjusting equity-based compensation such as by reducing option grants. A decrease in option
grants reduces the sensitivity of CEO wealth to stock volatility (i.e., CEO vega) but it also reduces the
sensitivity of CEO pay-performance sensitivity (i.e., CEO delta). Consequently, we would expect non-
option share compensation to increase if the CEO receives fewer option grants to preserve the CEO’s
incentives to increase firm value. To test these predictions, we obtain information on CEO compensation
for targets from ExecuComp. There are 88 firm-year observations in which CEO compensation data are
available. We then use the same propensity score matching approach used earlier to create 88 matching
non-target firm-year observations covered in ExecuComp.
The results for the effect of cyberattacks on CEO pay components are reported in Table IX. In addition
to controlling for firm characteristics used in the previous regressions, we also control for various CEO
characteristics such as CEO-chair duality, CEO age, and CEO tenure. In Regressions (1) and (2), we use
log (1+CEO total pay) as the dependent variable. We find that CEO total pay does not significantly change
in the post-attack period.23 We then decompose CEO total pay into fixed salary, bonus, and equity-based
compensation (options plus restricted stocks) and use the ratio of each of these component payments to
CEO total pay as the dependent variables in the next six regressions. We find that the coefficients on the
interaction term between Post and Cyberattack, Yeart, Yeart+1, and Yeart+2 are insignificant when we use
the ratio of salary payments to CEO total pay as the dependent variable (Regressions (3) and (4)), while
they are all negative and significant at the 1% level when we use the ratio of bonus payments to total pay
as the dependent variable (Regressions (5) and (6)). The coefficient estimate of −0.050 for the interaction
term between Post and Cyberattack in Regression (5) suggests that for the three years after the cyberattack,
CEOs of targets receive significantly smaller amounts of bonus payments relative to their total pay by 5
percentage points. When we use the ratio of equity-based compensation to total pay as the dependent
variable, the coefficients on the interaction term between Post and Cyberattack, Yeart, Yeart+1, and Yeart+2
23 Consistent with our results, Larcker, Reiss, and Tayan (2017) report that executive pay of breached firms is almost never reduced.
31
are insignificant, suggesting that boards do not change the proportion of CEOs’ equity-based compensation
after a cyberattack (Regressions (7) and (8)).
As a further test of the effect of cyberattacks on equity-based compensation, we estimate Regressions
(7) and (8) separately for restricted stock grants (Regressions (9) and (10)) and option awards (Regressions
(11) and (12)). Prior studies show that stock options and restricted stocks do not share common features in
influencing managers’ risk-taking incentives. For example, Guay (1999), Datta et al. (2001), and Coles,
Daniel, and Naveen (2006) show that stock options are used to encourage managers to take value-increasing
risky projects and are effective at countering managerial risk aversion.24 On the other hand, although
restricted stocks, another form of equity-based pay, can provide managers with incentives to increase stock
prices, they lack the convexity of options and hence their value does not increase with the firm’s volatility
in the same way as options (Smith and Stulz (1985), Bryan, Hwang, and Lilien (2000), Ryan and Wiggins
(2002), Hayes, Lemmon, and Qiu (2012), Bakke et al., (2016)). Since restricted stocks expose risk-averse
managers to the downside risk of the stocks, they are likely to make these managers more cautious.
We find that the proportion of restricted stock grants to CEO total pay increases significantly in the
post-attack period, while the proportion of option awards to CEO total pay decreases significantly during
the same period. For example, during the three years after the cyberattack, the proportion of restricted stock
grants for targets on average increases by a significant 10.4 percentage point, while that of option grants
declines by a significant 6.6 percentage point. Given that the level of post-attack CEO total pay is similar
for targets and non-targets, these results suggest that target firms’ boards adjust the components of equity-
based compensation in the years after cyberattacks by replacing stock options with restricted stocks. The
increased usage of restricted stock in place of stock options would decrease the CEO’s incentives to take
high risk projects. Table X shows that these changes in the post-attack compensation policy indeed lead to
a significant decrease in CEO vega for target firms after the attacks.
24 However, Milidonis and Stathopoulos (2014) show that stock options do not necessarily increase managers’ risk-taking incentives when firms face high default risk due to their career concerns.
32
In untabulated tests, we examine the likelihood of post-attack CEO changes.25 We identify CEO
changes each year from ExecuComp. We find that the coefficients on the interaction term between Post
and Cyberattack, Yeart, Yeart+1, and Yeart+2 are insignificant, suggesting that the likelihood of CEO turnover
is not significantly higher in targets than in non-targets after the attack.
Overall, Tables IX and X show that, after the attack, the board decreases the CEO’s risk-taking
incentives, which is consistent with the hypothesis that cyberattacks lead the board to reassess the firm’s
risk exposures and risk appetite.
VII. Summary and Conclusion
In this paper, we investigate which firms are more likely to suffer from a cyberattack and how firms
are affected by cyberattacks. We find that more visible firms such as larger firms and firms included in the
Fortune 500 list, more highly valued firms, firms with more intangible assets, and firms with less board
attention to risk management are more likely to be attacked. All else being equal, attacked firms in which
customers’ personal financial information is lost suffer a substantial loss in equity value that is larger by
$1.06 billion than the value loss of firms in which customers’ personal financial information is not lost.
Larger firms and firms in retail industries experience a drop in sales growth and firms in durable goods
industries suffer a decline in ROA and cash flow in the post-attack period. We also find some evidence that
firms reduce investment after an attack. Firms cope with the losses from the attack by raising long-term
debt, so that their leverage increases and the maturity of their debt lengthens. In addition, we find that
attacked firms are more likely to increase board oversight of firm risk. Finally, firms reduce the risk-taking
incentives of their CEOs by decreasing compensation in stock options and increasing compensation in
restricted stocks. We also find that firms cut CEO bonuses.
A cyberattack would not lead to a change in investment and compensation policies if it does not lead
to a reassessment of the risk of the target firm and if the target firm is not financially constrained. It is rare
25 Larcker, Reiss, and Tayan (2017) also find few cases where the CEO is replaced due to cybersecurity incidents.
33
for an attacked firm to be financially constrained. Yet, we document important changes in the structure of
CEOs compensation and the importance of risk management. Such changes make sense for corporations if
a cyberattack leads to a reassessment of firm risk and of the costs of adverse outcomes. Our evidence is
consistent with the hypothesis that a cyberattack leads to a reassessment by the board of the firm’s risk
exposures and risk appetite.
34
References
Akey, Pat, Stefan Lewellen, and Inessa Liskovich, 2018, Hacking Corporate Reputations, Working paper, University of Toronto.
Amir, Eli, Shai Levi, and Tsafrir Livne, 2018, Do firms undereport information on cyber-attacks? Evidence from capital markets, forthcoming, Review of Accounting Studies.
Bakke, Tor-Erik, Hamed Mahmudi, Chitru S. Fernando, and Jesus M. Salas, 2016, The causal effect of option pay on corporate risk management, Journal of Financial Economics 120, 623-643.
Bianchi, Daniele, and Onur Tosun, 2018, Cyber attacks and stock market activity, Working paper, University of Warwick.
Bryan, Stephen, LeeSeok Hwang, and Steven Lilien, 2000, CEO stock-based compensation: An empirical analysis of incentive intensity, relative mix, and economic determinants, Journal of Business 73, 661-693.
Caliendo, Marco, and Sabine Kopeinig, 2008, Some practical guidance for the implementation of propensity score matching, Journal of Economic Surveys 22, 31-72.
Campbell, Katherine, Lawrence A. Gordon, Martin P. Loeb, and Lei Zhou, 2003, The economic cost of publicly announced information security breaches: empirical evidence from the stock market, Journal of Computer Security 11, 431-448.
Carhart, Mark M., 1997, On persistence in mutual fund performance, Journal of Finance 52, 57-82.
Cavusoglu, Huseyin, Birendra Mishra, and Srinivasan Raghunathan, 2004, The effect of internet security breach announcements on market value: Capital market reactions for breached firms and internet security developers, International Journal of Electronic Commerce 9, 70-104.
Chan, Lilian H., Kevin C. W. Chen, and Tai-Yuan Chen, 2013, The effects of firm-initiated clawback provisions on bank loan contracting, Journal of Financial Economics 110, 659-679.
Chernobai, Anna, Philippe Jorion, and Fan Yu, 2011, The determinants of operational risk in US financial institutions, Journal of Financial and Quantitative Analysis 46, 1683-1725.
Coles, Jeffrey L., Naveen D. Daniel, and Lalitha Naveen, 2006, Managerial incentives and risk-taking, Journal of Financial Economics 79, 431-468.
Crouhy, Michel, Dan Galai, and Robert Mark, 2014, The Essentials of Risk Management (McGraw-Hill Education).
Cummins, J. David, Christopher M. Lewis, and Ran Wei, 2006, The market value impact of operational loss events for US banks and insurers, Journal of Banking and Finance 30, 2605-2634.
Datta, Sudip, Mai Iskandar Datta, and Kartik Raman, 2001, Executive compensation and corporate acquisition decisions, Journal of Finance 56, 2299-2336.
Fama, Eugene F., and Kenneth R. French, 1993, Common risk factors in the returns on stocks and bonds, Journal of Financial Economics 33, 3-56.
Frank, Murray Z., and Vidhan K. Goyal, 2003, Testing the pecking order theory of capital structure, Journal of Financial Economics 67, 217-248.
Froot, Kenneth A., David S. Scharfstein, and Jeremy C. Stein, 1993, Risk management: Coordinating corporate investment and financing policies, Journal of Finance 48, 1629-1658.
35
Garg, Ashish, Jeffrey Curtis, and Hilary Halper, 2003a, The financial impact of IT security breaches: what do investors think? Information Systems Security 12, 22-33.
Garg, Ashish, Jeffrey Curtis, and Hilary Halper, 2003b, Quantifying the financial impact of IT security breaches, Information Management and Computer Security 11, 74-83.
Gatzlaff, Kevin M., and Kathleen A. McCullough, 2010, The effect of data breaches on shareholder wealth, Risk Management and Insurance Review 13, 61-83.
Gennaioli, Nicola, Andrei Shleifer, and Robert Vishny, 2015, Neglected risks: The psychology of financial crises, American Economic Review 105, 310-314.
Gormley, Todd A., David A. Matsa, and Todd Milbourn, 2013, CEO compensation and corporate risk: Evidence from a natural experiment, Journal of Accounting and Economics 56, 79-101.
Guay, Wayne R., 1999, The sensitivity of CEO wealth to equity risk: an analysis of the magnitude and determinants, Journal of Financial Economics 53, 43-71.
Hayes, Rachel M., Michael Lemmon, and Mingming Qiu, 2012, Stock options and managerial incentives for risk taking: Evidence from FAS 123R, Journal of Financial Economics 105, 174-190.
Hilary, Gilles, Benjamin Segal, and May H. Zhang, 2016, Cyber-risk disclosure: Who cares?, Working Paper, Georgetown University.
Hovav, Anat, and John D'Arcy, 2003, The impact of denial of service attack announcements on the market value of firms, Risk Management and Insurance Review 6, 97-121.
Hovav, Anat, and John D'Arcy, 2004, The impact of virus attack announcements on the market value of firms, Information Systems Security 13, 32-40.
Johnson, Mark, Min Jung Kang, and Tolani, Lawson, 2017, Stock price reaction to data breaches, Journal of Finance Issues 16, 1-13.
Kahneman, Daniel, and Amos Tversky, 1972, Subjective probability: A judgment of representativeness, Cognitive psychology 3, 430-454.
Kaplan, Steven N, and Luigi Zingales, 1997, Do investment-cash flow sensitivities provide useful measures of financing constraints?, Quarterly Journal of Economics 112, 169-215.
Ko, Myung, and Carlos Dorantes, 2006, The impact of information security breaches on financial performance of the breached firms: an empirical investigation, Journal of Information Technology Management 17, 13-22.
Lagakos, Stephen W., 1979, General right censoring and its impact on the analysis of survival data. Biometrics, 35, 139-156.
Larcker, David F., Peter C. Reiss, and Brian Tayan, 2017, Critical update needed: Cybersecruity expertise in the boardroom, Working paper, Stanford University.
Lending, Claire, Kristina Minnick, and Patrick J. Schorno, 2018, Corporate governance, social responsibility and data breaches, Financial Review 53, 413-455.
Makridis, Christos, and Benjamin Dean, 2018, Measuring the economic effects of data breaches on firm outcomes: Challenges and opportunities, Working paper, MIT.
Milidonis, Andreas, and Konstantinos Stathopoulos, 2014, Managerial incentives, risk aversion, and debt, Journal of Financial and Quantitative Analysis 49, 453-481.
36
Nordlund, James, 2017, Director experience and cybersecurity events, Working paper, Louisiana State University.
Ryan Jr, Harley E., and Roy A. Wiggins III, 2002, The interactions between R&D investment decisions and compensation policy, Financial Management 5-29.
Shumway, Tyler, 2001, Forecasting bankruptcy more accurately: A simple hazard model, Journal of Business 74, 101-124.
Shumway, Tyler, and Vincent A. Warther, 1999, The delisting bias in CRSP's Nasdaq data and its implications for the size effect, Journal of Finance, 54, 2361-2379.
Smith, Clifford W., and René M. Stulz, 1985, The determinants of firms’ hedging policies, Journal of Financial and Quantitative Analysis 20, 391-405.
Titman, Sheridan, 1984, The effect of capital structure on a firm’s liquidation decision, Journal of Financial Economics 13, 137–151.
Titman, Sheridan, and Roberto Wessels, 1988, The determinants of capital structure choice, Journal of Finance 43, 1-19.
Tversky, Amos, and Daniel Kahneman, 1973, Availability: A heuristic for judging frequency and probability, Cognitive Psychology 5, 207–232.
Whited, Toni M, and Guojun Wu, 2006, Financial constraints risk, Review of Financial Studies 19, 531-559.
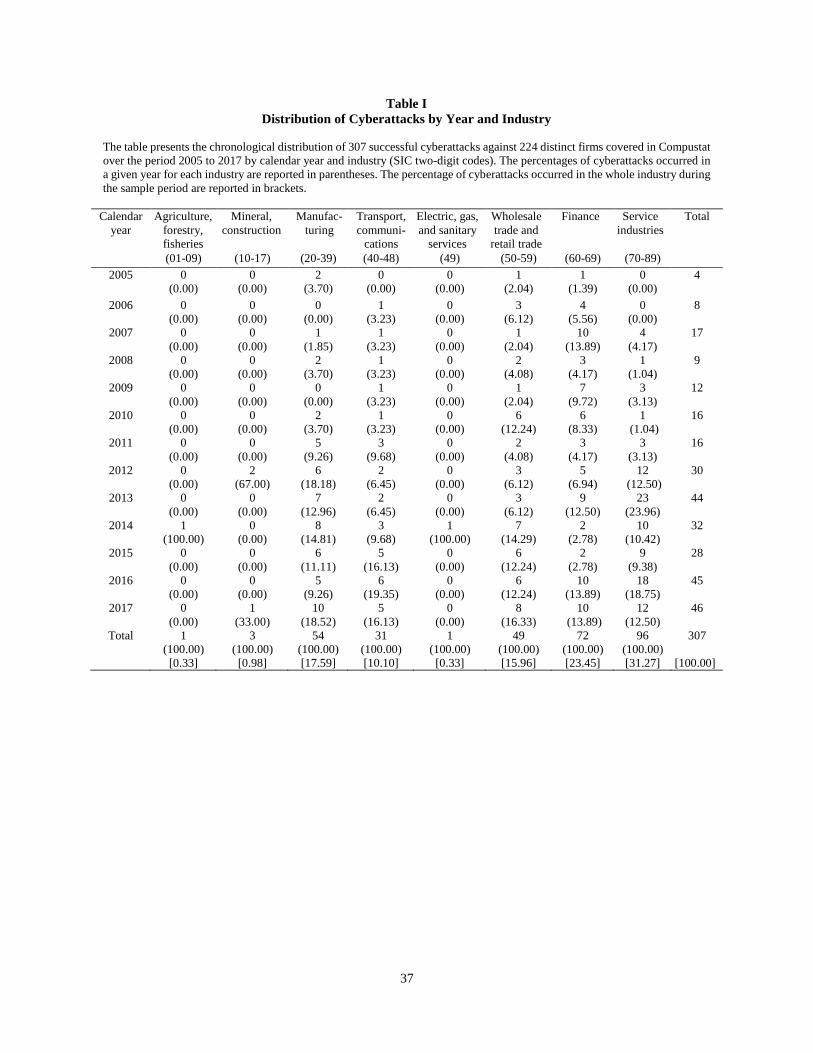
37
Table I Distribution of Cyberattacks by Year and Industry
The table presents the chronological distribution of 307 successful cyberattacks against 224 distinct firms covered in Compustat over the period 2005 to 2017 by calendar year and industry (SIC two-digit codes). The percentages of cyberattacks occurred in a given year for each industry are reported in parentheses. The percentage of cyberattacks occurred in the whole industry during the sample period are reported in brackets.
Calendar year
Agriculture, forestry, fisheries
Mineral, construction
Manufac-turing
Transport, communi-
cations
Electric, gas, and sanitary
services
Wholesale trade and
retail trade
Finance
Service industries
Total
(01-09) (10-17) (20-39) (40-48) (49) (50-59) (60-69) (70-89) 2005 0
(0.00) 0
(0.00) 2
(3.70) 0
(0.00) 0
(0.00) 1
(2.04) 1
(1.39) 0
(0.00) 4
2006 0 (0.00)
0 (0.00)
0 (0.00)
1 (3.23)
0 (0.00)
3 (6.12)
4 (5.56)
0 (0.00)
8
2007 0 (0.00)
0 (0.00)
1 (1.85)
1 (3.23)
0 (0.00)
1 (2.04)
10 (13.89)
4 (4.17)
17
2008 0 (0.00)
0 (0.00)
2 (3.70)
1 (3.23)
0 (0.00)
2 (4.08)
3 (4.17)
1 (1.04)
9
2009 0 (0.00)
0 (0.00)
0 (0.00)
1 (3.23)
0 (0.00)
1 (2.04)
7 (9.72)
3 (3.13)
12
2010 0 (0.00)
0 (0.00)
2 (3.70)
1 (3.23)
0 (0.00)
6 (12.24)
6 (8.33)
1 (1.04)
16
2011 0 (0.00)
0 (0.00)
5 (9.26)
3 (9.68)
0 (0.00)
2 (4.08)
3 (4.17)
3 (3.13)
16
2012 0 (0.00)
2 (67.00)
6 (18.18)
2 (6.45)
0 (0.00)
3 (6.12)
5 (6.94)
12 (12.50)
30
2013 0 (0.00)
0 (0.00)
7 (12.96)
2 (6.45)
0 (0.00)
3 (6.12)
9 (12.50)
23 (23.96)
44
2014 1 (100.00)
0 (0.00)
8 (14.81)
3 (9.68)
1 (100.00)
7 (14.29)
2 (2.78)
10 (10.42)
32
2015 0 (0.00)
0 (0.00)
6 (11.11)
5 (16.13)
0 (0.00)
6 (12.24)
2 (2.78)
9 (9.38)
28
2016 0 (0.00)
0 (0.00)
5 (9.26)
6 (19.35)
0 (0.00)
6 (12.24)
10 (13.89)
18 (18.75)
45
2017 0 (0.00)
1 (33.00)
10 (18.52)
5 (16.13)
0 (0.00)
8 (16.33)
10 (13.89)
12 (12.50)
46
Total 1 (100.00) [0.33]
3 (100.00) [0.98]
54 (100.00) [17.59]
31 (100.00) [10.10]
1 (100.00) [0.33]
49 (100.00) [15.96]
72 (100.00) [23.45]
96 (100.00) [31.27]
307
[100.00]
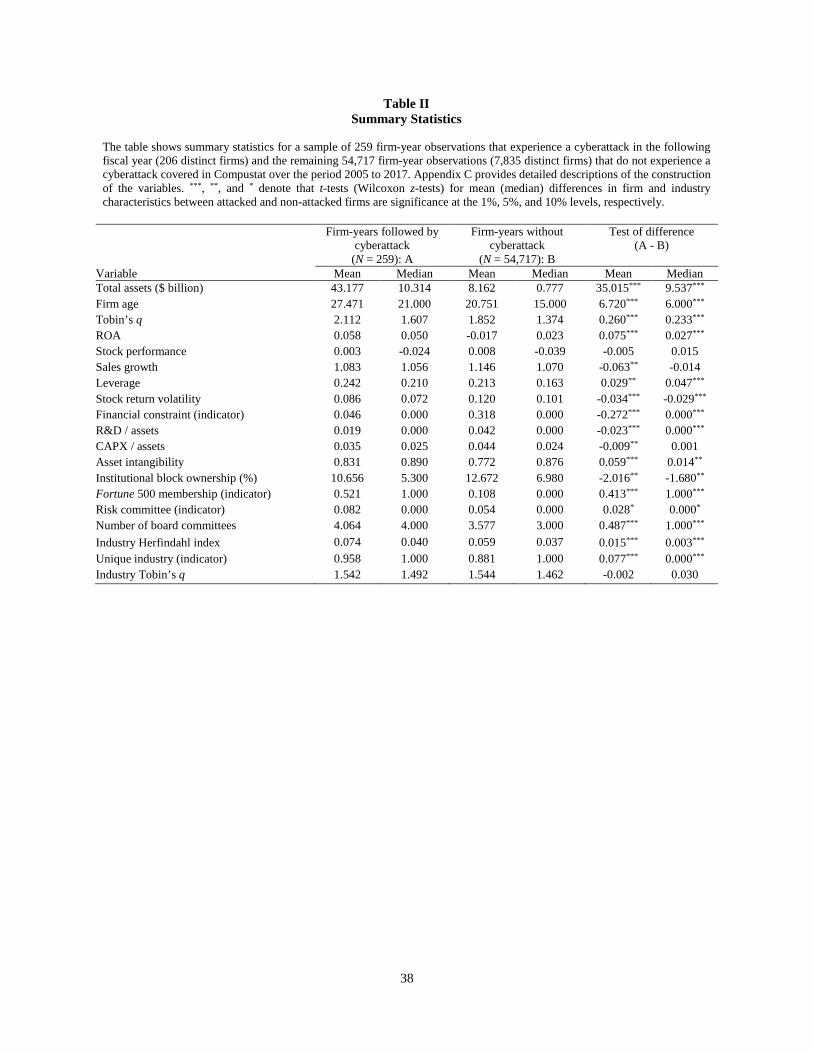
38
Table II Summary Statistics
The table shows summary statistics for a sample of 259 firm-year observations that experience a cyberattack in the following fiscal year (206 distinct firms) and the remaining 54,717 firm-year observations (7,835 distinct firms) that do not experience a cyberattack covered in Compustat over the period 2005 to 2017. Appendix C provides detailed descriptions of the construction of the variables. ***, **, and * denote that t-tests (Wilcoxon z-tests) for mean (median) differences in firm and industry characteristics between attacked and non-attacked firms are significance at the 1%, 5%, and 10% levels, respectively.
Firm-years followed by cyberattack
(N = 259): A
Firm-years without cyberattack
(N = 54,717): B
Test of difference (A - B)
Variable Mean Median Mean Median Mean Median Total assets ($ billion) 43.177 10.314 8.162 0.777 35.015*** 9.537***
Firm age 27.471 21.000 20.751 15.000 6.720*** 6.000***
Tobin’s q 2.112 1.607 1.852 1.374 0.260*** 0.233***
ROA 0.058 0.050 -0.017 0.023 0.075*** 0.027***
Stock performance 0.003 -0.024 0.008 -0.039 -0.005 0.015 Sales growth 1.083 1.056 1.146 1.070 -0.063** -0.014
Leverage 0.242 0.210 0.213 0.163 0.029** 0.047***
Stock return volatility 0.086 0.072 0.120 0.101 -0.034*** -0.029***
Financial constraint (indicator) 0.046 0.000 0.318 0.000 -0.272*** 0.000***
R&D / assets 0.019 0.000 0.042 0.000 -0.023*** 0.000***
CAPX / assets 0.035 0.025 0.044 0.024 -0.009** 0.001
Asset intangibility 0.831 0.890 0.772 0.876 0.059*** 0.014**
Institutional block ownership (%) 10.656 5.300 12.672 6.980 -2.016** -1.680**
Fortune 500 membership (indicator) 0.521 1.000 0.108 0.000 0.413*** 1.000***
Risk committee (indicator) 0.082 0.000 0.054 0.000 0.028* 0.000*
Number of board committees 4.064 4.000 3.577 3.000 0.487*** 1.000***
Industry Herfindahl index 0.074 0.040 0.059 0.037 0.015*** 0.003***
Unique industry (indicator) 0.958 1.000 0.881 1.000 0.077*** 0.000***
Industry Tobin’s q 1.542 1.492 1.544 1.462 -0.002 0.030
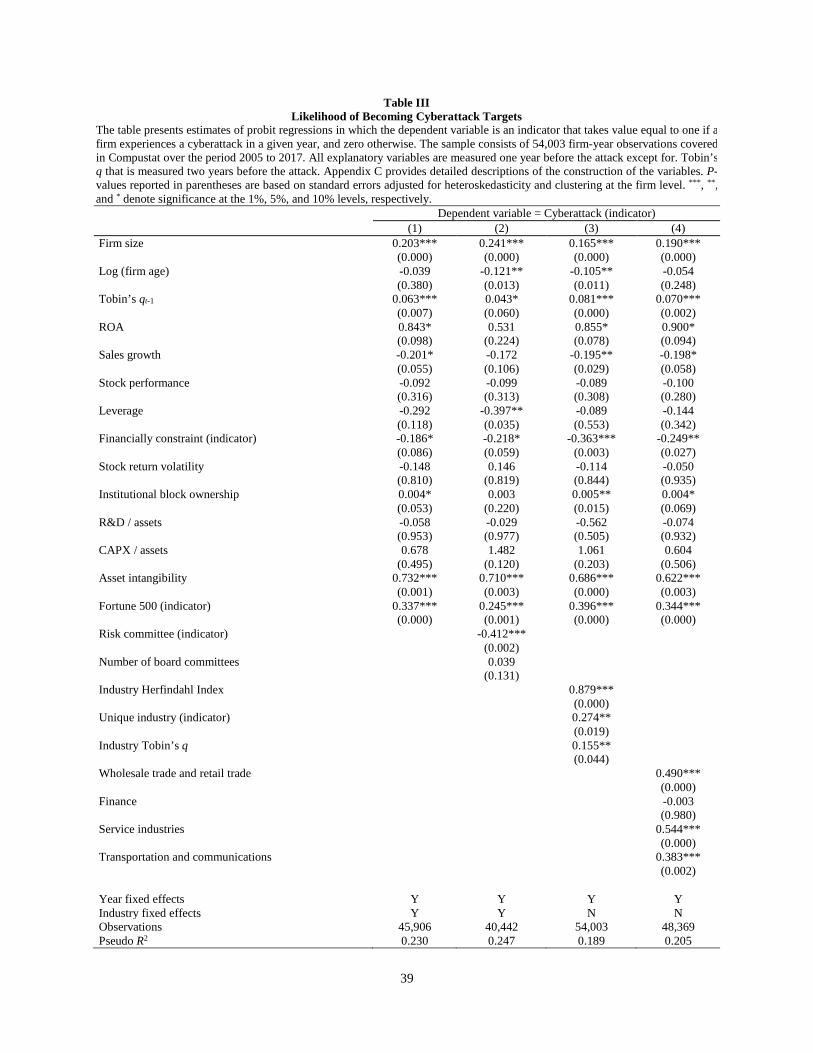
39
Table III Likelihood of Becoming Cyberattack Targets
The table presents estimates of probit regressions in which the dependent variable is an indicator that takes value equal to one if a firm experiences a cyberattack in a given year, and zero otherwise. The sample consists of 54,003 firm-year observations covered in Compustat over the period 2005 to 2017. All explanatory variables are measured one year before the attack except for. Tobin’s q that is measured two years before the attack. Appendix C provides detailed descriptions of the construction of the variables. P-values reported in parentheses are based on standard errors adjusted for heteroskedasticity and clustering at the firm level. ***, **, and * denote significance at the 1%, 5%, and 10% levels, respectively.
Dependent variable = Cyberattack (indicator) (1) (2) (3) (4)
Firm size 0.203*** 0.241*** 0.165*** 0.190*** (0.000) (0.000) (0.000) (0.000) Log (firm age) -0.039 -0.121** -0.105** -0.054 (0.380) (0.013) (0.011) (0.248) Tobin’s qt-1 0.063*** 0.043* 0.081*** 0.070*** (0.007) (0.060) (0.000) (0.002) ROA 0.843* 0.531 0.855* 0.900* (0.098) (0.224) (0.078) (0.094) Sales growth -0.201* -0.172 -0.195** -0.198* (0.055) (0.106) (0.029) (0.058) Stock performance -0.092 -0.099 -0.089 -0.100 (0.316) (0.313) (0.308) (0.280) Leverage -0.292 -0.397** -0.089 -0.144 (0.118) (0.035) (0.553) (0.342) Financially constraint (indicator) -0.186* -0.218* -0.363*** -0.249** (0.086) (0.059) (0.003) (0.027) Stock return volatility -0.148 0.146 -0.114 -0.050 (0.810) (0.819) (0.844) (0.935) Institutional block ownership 0.004* 0.003 0.005** 0.004* (0.053) (0.220) (0.015) (0.069) R&D / assets -0.058 -0.029 -0.562 -0.074 (0.953) (0.977) (0.505) (0.932) CAPX / assets 0.678 1.482 1.061 0.604 (0.495) (0.120) (0.203) (0.506) Asset intangibility 0.732*** 0.710*** 0.686*** 0.622*** (0.001) (0.003) (0.000) (0.003) Fortune 500 (indicator) 0.337*** 0.245*** 0.396*** 0.344*** (0.000) (0.001) (0.000) (0.000) Risk committee (indicator) -0.412*** (0.002) Number of board committees 0.039 (0.131) Industry Herfindahl Index 0.879*** (0.000) Unique industry (indicator) 0.274** (0.019) Industry Tobin’s q 0.155** (0.044) Wholesale trade and retail trade 0.490*** (0.000) Finance -0.003 (0.980) Service industries 0.544*** (0.000) Transportation and communications 0.383*** (0.002) Year fixed effects Y Y Y Y Industry fixed effects Y Y N N Observations 45,906 40,442 54,003 48,369 Pseudo R2 0.230 0.247 0.189 0.205
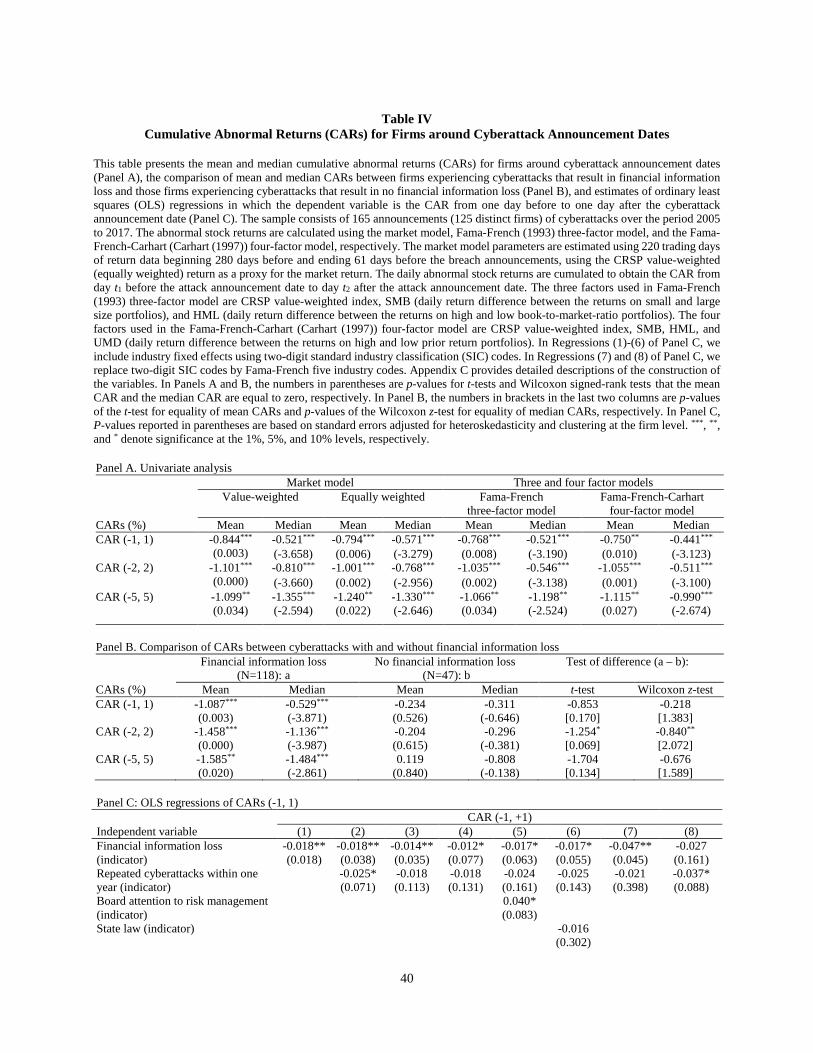
40
Table IV
Cumulative Abnormal Returns (CARs) for Firms around Cyberattack Announcement Dates
This table presents the mean and median cumulative abnormal returns (CARs) for firms around cyberattack announcement dates (Panel A), the comparison of mean and median CARs between firms experiencing cyberattacks that result in financial information loss and those firms experiencing cyberattacks that result in no financial information loss (Panel B), and estimates of ordinary least squares (OLS) regressions in which the dependent variable is the CAR from one day before to one day after the cyberattack announcement date (Panel C). The sample consists of 165 announcements (125 distinct firms) of cyberattacks over the period 2005 to 2017. The abnormal stock returns are calculated using the market model, Fama-French (1993) three-factor model, and the Fama-French-Carhart (Carhart (1997)) four-factor model, respectively. The market model parameters are estimated using 220 trading days of return data beginning 280 days before and ending 61 days before the breach announcements, using the CRSP value-weighted (equally weighted) return as a proxy for the market return. The daily abnormal stock returns are cumulated to obtain the CAR from day t1 before the attack announcement date to day t2 after the attack announcement date. The three factors used in Fama-French (1993) three-factor model are CRSP value-weighted index, SMB (daily return difference between the returns on small and large size portfolios), and HML (daily return difference between the returns on high and low book-to-market-ratio portfolios). The four factors used in the Fama-French-Carhart (Carhart (1997)) four-factor model are CRSP value-weighted index, SMB, HML, and UMD (daily return difference between the returns on high and low prior return portfolios). In Regressions (1)-(6) of Panel C, we include industry fixed effects using two-digit standard industry classification (SIC) codes. In Regressions (7) and (8) of Panel C, we replace two-digit SIC codes by Fama-French five industry codes. Appendix C provides detailed descriptions of the construction of the variables. In Panels A and B, the numbers in parentheses are p-values for t-tests and Wilcoxon signed-rank tests that the mean CAR and the median CAR are equal to zero, respectively. In Panel B, the numbers in brackets in the last two columns are p-values of the t-test for equality of mean CARs and p-values of the Wilcoxon z-test for equality of median CARs, respectively. In Panel C, P-values reported in parentheses are based on standard errors adjusted for heteroskedasticity and clustering at the firm level. ***, **, and * denote significance at the 1%, 5%, and 10% levels, respectively.
Panel A. Univariate analysis Market model Three and four factor models Value-weighted Equally weighted Fama-French
three-factor model Fama-French-Carhart
four-factor model CARs (%) Mean Median Mean Median Mean Median Mean Median CAR (-1, 1) -0.844***
(0.003) -0.521*** -0.794*** -0.571*** -0.768*** -0.521*** -0.750** -0.441***
(-3.658) (0.006) (-3.279) (0.008) (-3.190) (0.010) (-3.123) CAR (-2, 2) -1.101***
(0.000) -0.810*** -1.001*** -0.768*** -1.035*** -0.546*** -1.055*** -0.511***
(-3.660) (0.002) (-2.956) (0.002) (-3.138) (0.001) (-3.100) CAR (-5, 5) -1.099**
(0.034) -1.355*** (-2.594)
-1.240** (0.022)
-1.330*** (-2.646)
-1.066** (0.034)
-1.198** (-2.524)
-1.115** (0.027)
-0.990***
(-2.674)
Panel B. Comparison of CARs between cyberattacks with and without financial information loss Financial information loss
(N=118): a No financial information loss
(N=47): b Test of difference (a – b):
CARs (%) Mean Median Mean Median t-test Wilcoxon z-test CAR (-1, 1) -1.087*** -0.529*** -0.234 -0.311 -0.853 -0.218 (0.003) (-3.871) (0.526) (-0.646) [0.170] [1.383] CAR (-2, 2) -1.458*** -1.136*** -0.204 -0.296 -1.254* -0.840** (0.000) (-3.987) (0.615) (-0.381) [0.069] [2.072] CAR (-5, 5) -1.585** -1.484*** 0.119 -0.808 -1.704 -0.676 (0.020) (-2.861) (0.840) (-0.138) [0.134] [1.589]
Panel C: OLS regressions of CARs (-1, 1) CAR (-1, +1) Independent variable (1) (2) (3) (4) (5) (6) (7) (8) Financial information loss (indicator)
-0.018** -0.018** -0.014** -0.012* -0.017* -0.017* -0.047** -0.027 (0.018) (0.038) (0.035) (0.077) (0.063) (0.055) (0.045) (0.161)
Repeated cyberattacks within one year (indicator)
-0.025* -0.018 -0.018 -0.024 -0.025 -0.021 -0.037* (0.071) (0.113) (0.131) (0.161) (0.143) (0.398) (0.088)
Board attention to risk management (indicator)
0.040* (0.083)
State law (indicator) -0.016 (0.302)
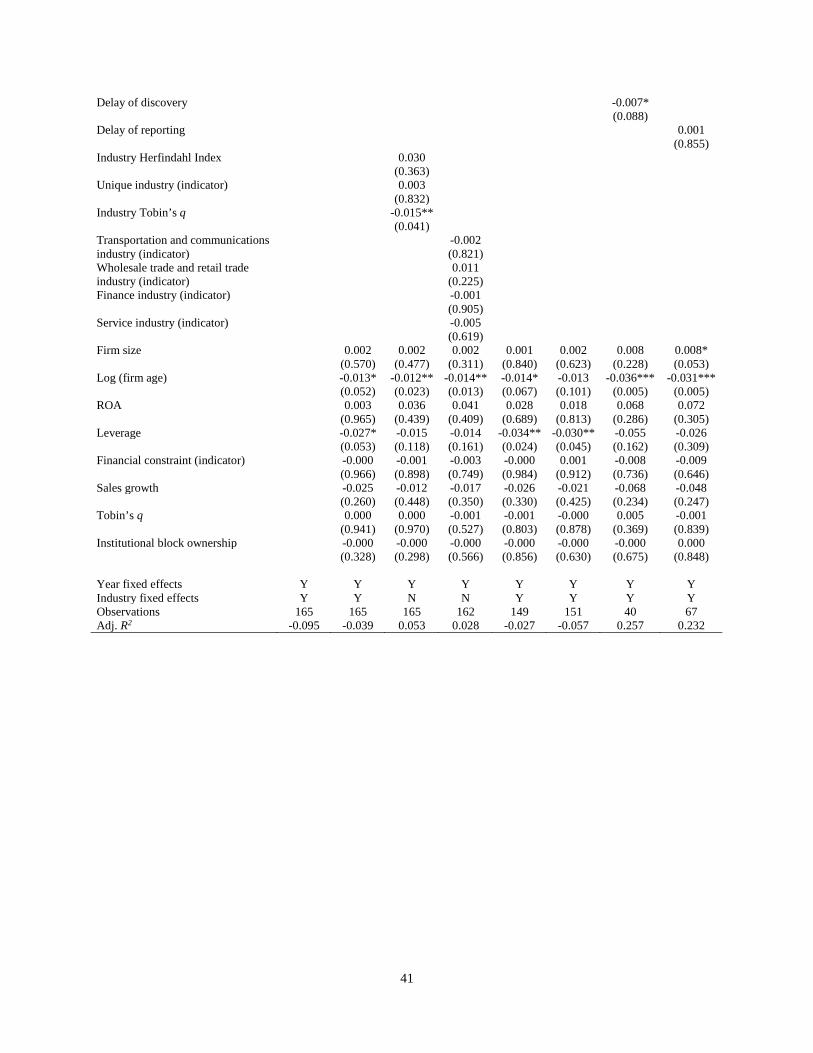
41
Delay of discovery -0.007* (0.088)
Delay of reporting 0.001 (0.855)
Industry Herfindahl Index 0.030 (0.363) Unique industry (indicator) 0.003 (0.832) Industry Tobin’s q -0.015** (0.041) Transportation and communications industry (indicator)
-0.002 (0.821)
Wholesale trade and retail trade industry (indicator)
0.011 (0.225)
Finance industry (indicator) -0.001 (0.905) Service industry (indicator) -0.005 (0.619) Firm size 0.002 0.002 0.002 0.001 0.002 0.008 0.008* (0.570) (0.477) (0.311) (0.840) (0.623) (0.228) (0.053) Log (firm age) -0.013* -0.012** -0.014** -0.014* -0.013 -0.036*** -0.031*** (0.052) (0.023) (0.013) (0.067) (0.101) (0.005) (0.005) ROA 0.003 0.036 0.041 0.028 0.018 0.068 0.072 (0.965) (0.439) (0.409) (0.689) (0.813) (0.286) (0.305) Leverage -0.027* -0.015 -0.014 -0.034** -0.030** -0.055 -0.026 (0.053) (0.118) (0.161) (0.024) (0.045) (0.162) (0.309) Financial constraint (indicator) -0.000 -0.001 -0.003 -0.000 0.001 -0.008 -0.009 (0.966) (0.898) (0.749) (0.984) (0.912) (0.736) (0.646) Sales growth -0.025 -0.012 -0.017 -0.026 -0.021 -0.068 -0.048 (0.260) (0.448) (0.350) (0.330) (0.425) (0.234) (0.247) Tobin’s q 0.000 0.000 -0.001 -0.001 -0.000 0.005 -0.001 (0.941) (0.970) (0.527) (0.803) (0.878) (0.369) (0.839) Institutional block ownership -0.000 -0.000 -0.000 -0.000 -0.000 -0.000 0.000 (0.328) (0.298) (0.566) (0.856) (0.630) (0.675) (0.848) Year fixed effects Y Y Y Y Y Y Y Y Industry fixed effects Y Y N N Y Y Y Y Observations 165 165 165 162 149 151 40 67 Adj. R2 -0.095 -0.039 0.053 0.028 -0.027 -0.057 0.257 0.232
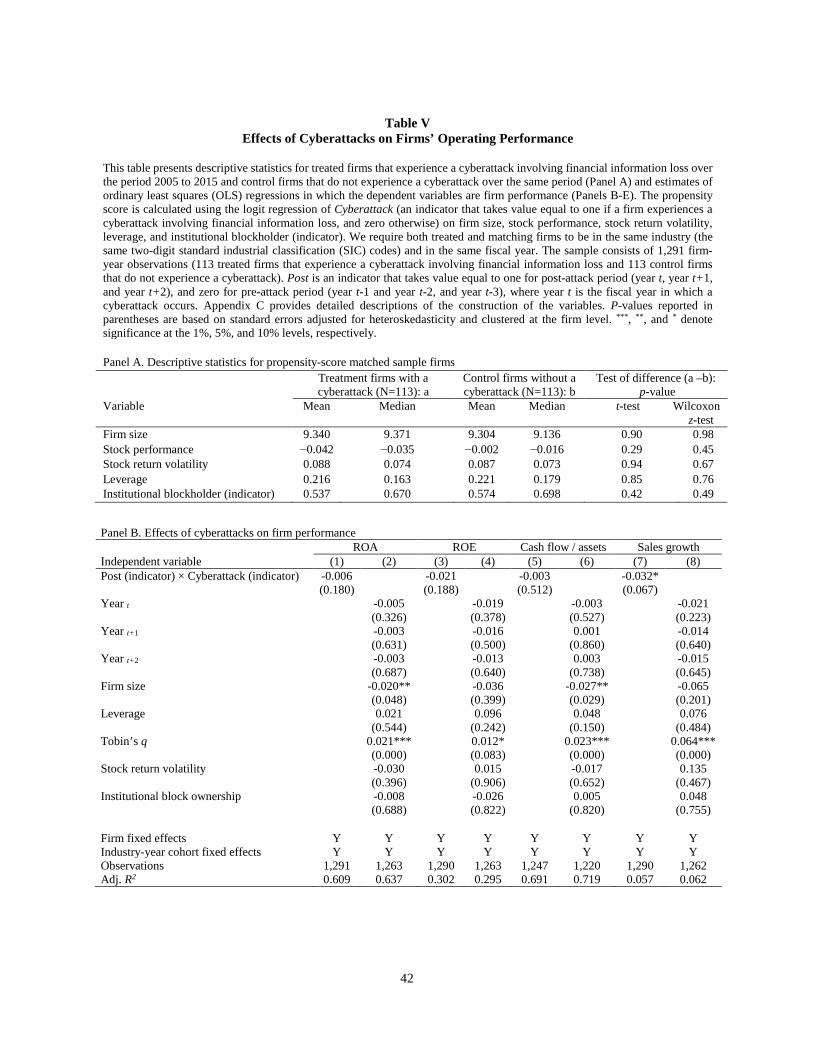
42
Table V
Effects of Cyberattacks on Firms’ Operating Performance
This table presents descriptive statistics for treated firms that experience a cyberattack involving financial information loss over the period 2005 to 2015 and control firms that do not experience a cyberattack over the same period (Panel A) and estimates of ordinary least squares (OLS) regressions in which the dependent variables are firm performance (Panels B-E). The propensity score is calculated using the logit regression of Cyberattack (an indicator that takes value equal to one if a firm experiences a cyberattack involving financial information loss, and zero otherwise) on firm size, stock performance, stock return volatility, leverage, and institutional blockholder (indicator). We require both treated and matching firms to be in the same industry (the same two-digit standard industrial classification (SIC) codes) and in the same fiscal year. The sample consists of 1,291 firm-year observations (113 treated firms that experience a cyberattack involving financial information loss and 113 control firms that do not experience a cyberattack). Post is an indicator that takes value equal to one for post-attack period (year t, year t+1, and year t+2), and zero for pre-attack period (year t-1 and year t-2, and year t-3), where year t is the fiscal year in which a cyberattack occurs. Appendix C provides detailed descriptions of the construction of the variables. P-values reported in parentheses are based on standard errors adjusted for heteroskedasticity and clustered at the firm level. ***, **, and * denote significance at the 1%, 5%, and 10% levels, respectively.
Panel A. Descriptive statistics for propensity-score matched sample firms Treatment firms with a
cyberattack (N=113): a Control firms without a cyberattack (N=113): b
Test of difference (a –b): p-value
Variable Mean Median Mean Median t-test Wilcoxon z-test
Firm size 9.340 9.371 9.304 9.136 0.90 0.98 Stock performance −0.042 −0.035 −0.002 −0.016 0.29 0.45 Stock return volatility 0.088 0.074 0.087 0.073 0.94 0.67 Leverage 0.216 0.163 0.221 0.179 0.85 0.76 Institutional blockholder (indicator) 0.537 0.670 0.574 0.698 0.42 0.49
Panel B. Effects of cyberattacks on firm performance ROA ROE Cash flow / assets Sales growth Independent variable (1) (2) (3) (4) (5) (6) (7) (8) Post (indicator) × Cyberattack (indicator) -0.006 -0.021 -0.003 -0.032*
(0.180) (0.188) (0.512) (0.067) Year t -0.005 -0.019 -0.003 -0.021 (0.326) (0.378) (0.527) (0.223) Year t+1 -0.003 -0.016 0.001 -0.014 (0.631) (0.500) (0.860) (0.640) Year t+2 -0.003 -0.013 0.003 -0.015 (0.687) (0.640) (0.738) (0.645) Firm size -0.020** -0.036 -0.027** -0.065 (0.048) (0.399) (0.029) (0.201) Leverage 0.021 0.096 0.048 0.076 (0.544) (0.242) (0.150) (0.484) Tobin’s q 0.021*** 0.012* 0.023*** 0.064*** (0.000) (0.083) (0.000) (0.000) Stock return volatility -0.030 0.015 -0.017 0.135 (0.396) (0.906) (0.652) (0.467) Institutional block ownership -0.008 -0.026 0.005 0.048
(0.688) (0.822) (0.820) (0.755) Firm fixed effects Y Y Y Y Y Y Y Y Industry-year cohort fixed effects Y Y Y Y Y Y Y Y Observations 1,291 1,263 1,290 1,263 1,247 1,220 1,290 1,262 Adj. R2 0.609 0.637 0.302 0.295 0.691 0.719 0.057 0.062
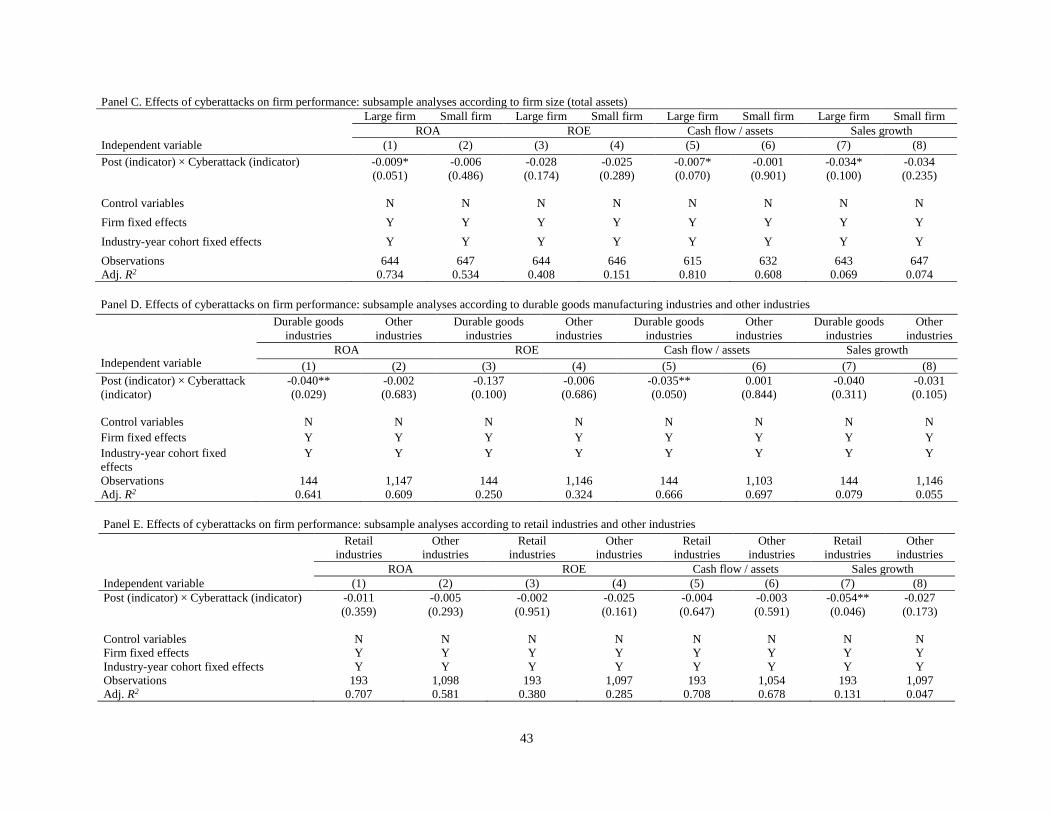
43
Panel C. Effects of cyberattacks on firm performance: subsample analyses according to firm size (total assets) Large firm Small firm Large firm Small firm Large firm Small firm Large firm Small firm ROA ROE Cash flow / assets Sales growth Independent variable (1) (2) (3) (4) (5) (6) (7) (8) Post (indicator) × Cyberattack (indicator) -0.009* -0.006 -0.028 -0.025 -0.007* -0.001 -0.034* -0.034
(0.051) (0.486) (0.174) (0.289) (0.070) (0.901) (0.100) (0.235) Control variables N N N N N N N N Firm fixed effects Y Y Y Y Y Y Y Y Industry-year cohort fixed effects Y Y Y Y Y Y Y Y Observations 644 647 644 646 615 632 643 647 Adj. R2 0.734 0.534 0.408 0.151 0.810 0.608 0.069 0.074
Panel D. Effects of cyberattacks on firm performance: subsample analyses according to durable goods manufacturing industries and other industries Independent variable
Durable goods industries
Other industries
Durable goods industries
Other industries
Durable goods industries
Other industries
Durable goods industries
Other industries
ROA ROE Cash flow / assets Sales growth (1) (2) (3) (4) (5) (6) (7) (8)
Post (indicator) × Cyberattack (indicator)
-0.040** -0.002 -0.137 -0.006 -0.035** 0.001 -0.040 -0.031 (0.029) (0.683) (0.100) (0.686) (0.050) (0.844) (0.311) (0.105)
Control variables N N N N N N N N Firm fixed effects Y Y Y Y Y Y Y Y Industry-year cohort fixed effects
Y Y Y Y Y Y Y Y
Observations 144 1,147 144 1,146 144 1,103 144 1,146 Adj. R2 0.641 0.609 0.250 0.324 0.666 0.697 0.079 0.055
Panel E. Effects of cyberattacks on firm performance: subsample analyses according to retail industries and other industries Retail
industries Other
industries Retail
industries Other
industries Retail
industries Other
industries Retail
industries Other
industries ROA ROE Cash flow / assets Sales growth Independent variable (1) (2) (3) (4) (5) (6) (7) (8) Post (indicator) × Cyberattack (indicator) -0.011 -0.005 -0.002 -0.025 -0.004 -0.003 -0.054** -0.027
(0.359) (0.293) (0.951) (0.161) (0.647) (0.591) (0.046) (0.173) Control variables N N N N N N N N Firm fixed effects Y Y Y Y Y Y Y Y Industry-year cohort fixed effects Y Y Y Y Y Y Y Y Observations 193 1,098 193 1,097 193 1,054 193 1,097 Adj. R2 0.707 0.581 0.380 0.285 0.708 0.678 0.131 0.047
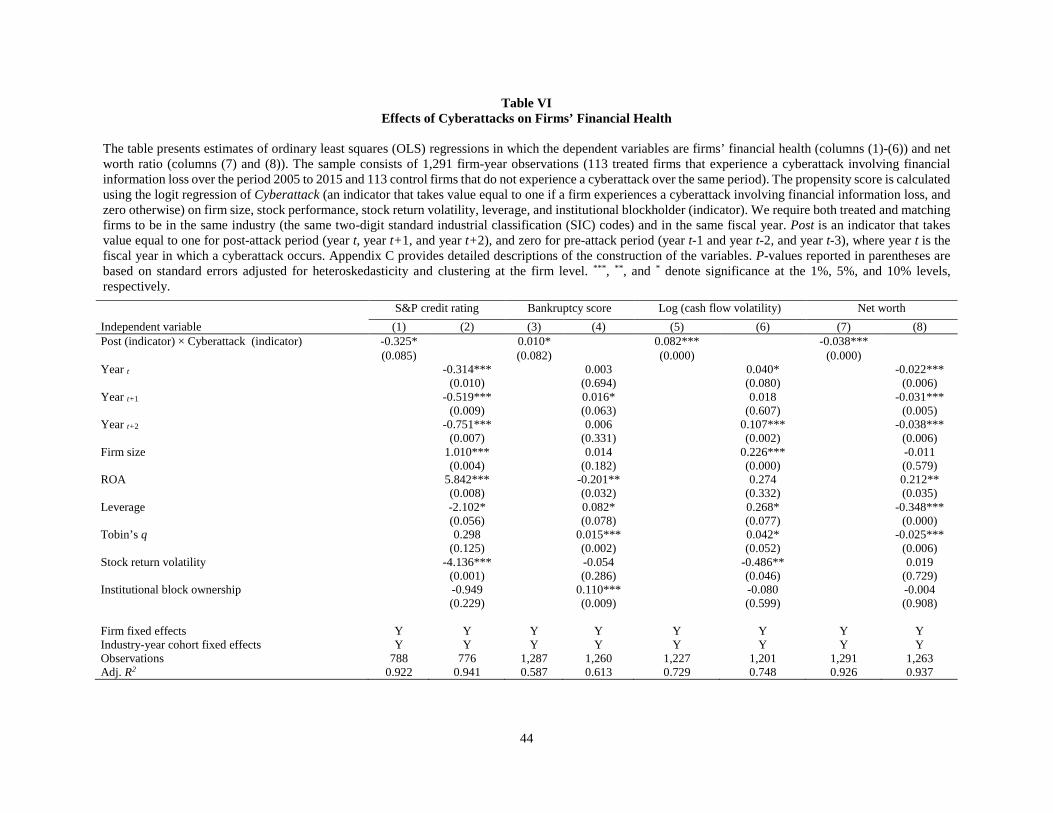
44
Table VI Effects of Cyberattacks on Firms’ Financial Health
The table presents estimates of ordinary least squares (OLS) regressions in which the dependent variables are firms’ financial health (columns (1)-(6)) and net worth ratio (columns (7) and (8)). The sample consists of 1,291 firm-year observations (113 treated firms that experience a cyberattack involving financial information loss over the period 2005 to 2015 and 113 control firms that do not experience a cyberattack over the same period). The propensity score is calculated using the logit regression of Cyberattack (an indicator that takes value equal to one if a firm experiences a cyberattack involving financial information loss, and zero otherwise) on firm size, stock performance, stock return volatility, leverage, and institutional blockholder (indicator). We require both treated and matching firms to be in the same industry (the same two-digit standard industrial classification (SIC) codes) and in the same fiscal year. Post is an indicator that takes value equal to one for post-attack period (year t, year t+1, and year t+2), and zero for pre-attack period (year t-1 and year t-2, and year t-3), where year t is the fiscal year in which a cyberattack occurs. Appendix C provides detailed descriptions of the construction of the variables. P-values reported in parentheses are based on standard errors adjusted for heteroskedasticity and clustering at the firm level. ***, **, and * denote significance at the 1%, 5%, and 10% levels, respectively. S&P credit rating Bankruptcy score Log (cash flow volatility) Net worth Independent variable (1) (2) (3) (4) (5) (6) (7) (8) Post (indicator) × Cyberattack (indicator) -0.325* 0.010* 0.082*** -0.038***
(0.085) (0.082) (0.000) (0.000) Year t -0.314*** 0.003 0.040* -0.022*** (0.010) (0.694) (0.080) (0.006) Year t+1 -0.519*** 0.016* 0.018 -0.031*** (0.009) (0.063) (0.607) (0.005) Year t+2 -0.751*** 0.006 0.107*** -0.038*** (0.007) (0.331) (0.002) (0.006) Firm size 1.010*** 0.014 0.226*** -0.011 (0.004) (0.182) (0.000) (0.579) ROA 5.842*** -0.201** 0.274 0.212** (0.008) (0.032) (0.332) (0.035) Leverage -2.102* 0.082* 0.268* -0.348*** (0.056) (0.078) (0.077) (0.000) Tobin’s q 0.298 0.015*** 0.042* -0.025*** (0.125) (0.002) (0.052) (0.006) Stock return volatility -4.136*** -0.054 -0.486** 0.019 (0.001) (0.286) (0.046) (0.729) Institutional block ownership -0.949 0.110*** -0.080 -0.004
(0.229) (0.009) (0.599) (0.908) Firm fixed effects Y Y Y Y Y Y Y Y Industry-year cohort fixed effects Y Y Y Y Y Y Y Y Observations 788 776 1,287 1,260 1,227 1,201 1,291 1,263 Adj. R2 0.922 0.941 0.587 0.613 0.729 0.748 0.926 0.937
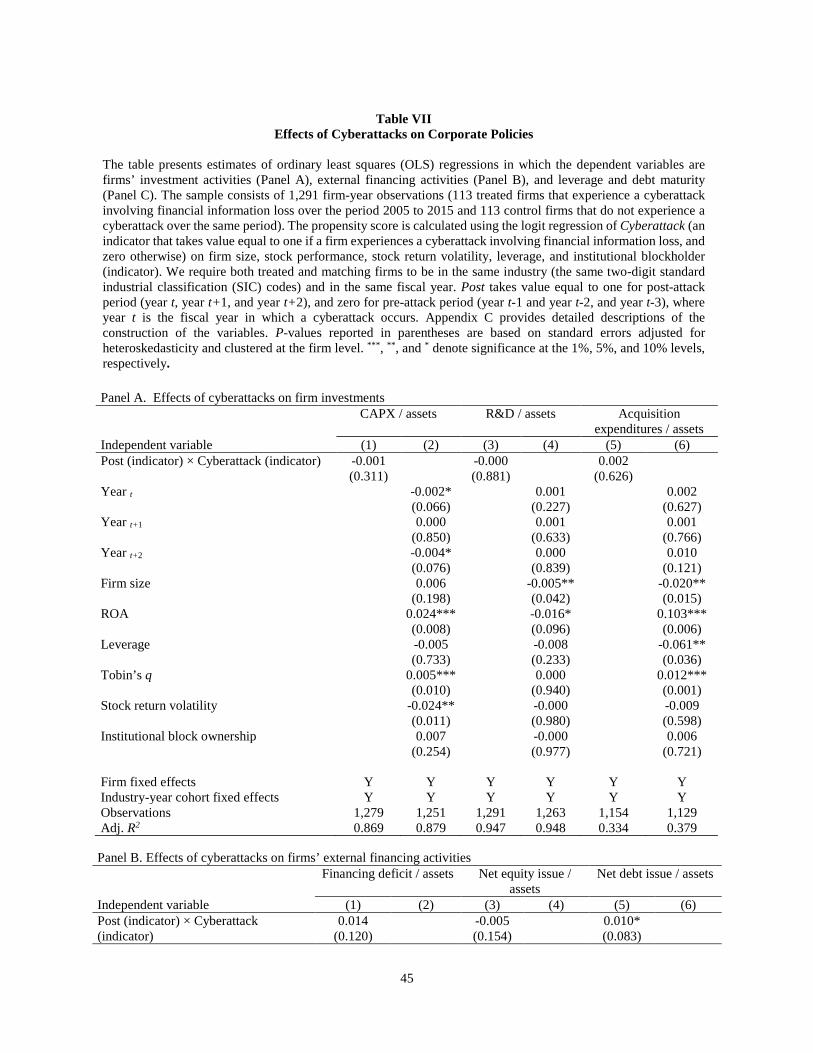
45
Table VII Effects of Cyberattacks on Corporate Policies
The table presents estimates of ordinary least squares (OLS) regressions in which the dependent variables are firms’ investment activities (Panel A), external financing activities (Panel B), and leverage and debt maturity (Panel C). The sample consists of 1,291 firm-year observations (113 treated firms that experience a cyberattack involving financial information loss over the period 2005 to 2015 and 113 control firms that do not experience a cyberattack over the same period). The propensity score is calculated using the logit regression of Cyberattack (an indicator that takes value equal to one if a firm experiences a cyberattack involving financial information loss, and zero otherwise) on firm size, stock performance, stock return volatility, leverage, and institutional blockholder (indicator). We require both treated and matching firms to be in the same industry (the same two-digit standard industrial classification (SIC) codes) and in the same fiscal year. Post takes value equal to one for post-attack period (year t, year t+1, and year t+2), and zero for pre-attack period (year t-1 and year t-2, and year t-3), where year t is the fiscal year in which a cyberattack occurs. Appendix C provides detailed descriptions of the construction of the variables. P-values reported in parentheses are based on standard errors adjusted for heteroskedasticity and clustered at the firm level. ***, **, and * denote significance at the 1%, 5%, and 10% levels, respectively.
Panel B. Effects of cyberattacks on firms’ external financing activities Financing deficit / assets Net equity issue /
assets Net debt issue / assets
Independent variable (1) (2) (3) (4) (5) (6) Post (indicator) × Cyberattack (indicator)
0.014 -0.005 0.010* (0.120) (0.154) (0.083)
Panel A. Effects of cyberattacks on firm investments CAPX / assets R&D / assets Acquisition
expenditures / assets Independent variable (1) (2) (3) (4) (5) (6) Post (indicator) × Cyberattack (indicator) -0.001 -0.000 0.002
(0.311) (0.881) (0.626) Year t -0.002* 0.001 0.002 (0.066) (0.227) (0.627) Year t+1 0.000 0.001 0.001 (0.850) (0.633) (0.766) Year t+2 -0.004* 0.000 0.010 (0.076) (0.839) (0.121) Firm size 0.006 -0.005** -0.020** (0.198) (0.042) (0.015) ROA 0.024*** -0.016* 0.103*** (0.008) (0.096) (0.006) Leverage -0.005 -0.008 -0.061** (0.733) (0.233) (0.036) Tobin’s q 0.005*** 0.000 0.012*** (0.010) (0.940) (0.001) Stock return volatility -0.024** -0.000 -0.009 (0.011) (0.980) (0.598) Institutional block ownership 0.007 -0.000 0.006 (0.254) (0.977) (0.721) Firm fixed effects Y Y Y Y Y Y Industry-year cohort fixed effects Y Y Y Y Y Y Observations 1,279 1,251 1,291 1,263 1,154 1,129 Adj. R2 0.869 0.879 0.947 0.948 0.334 0.379
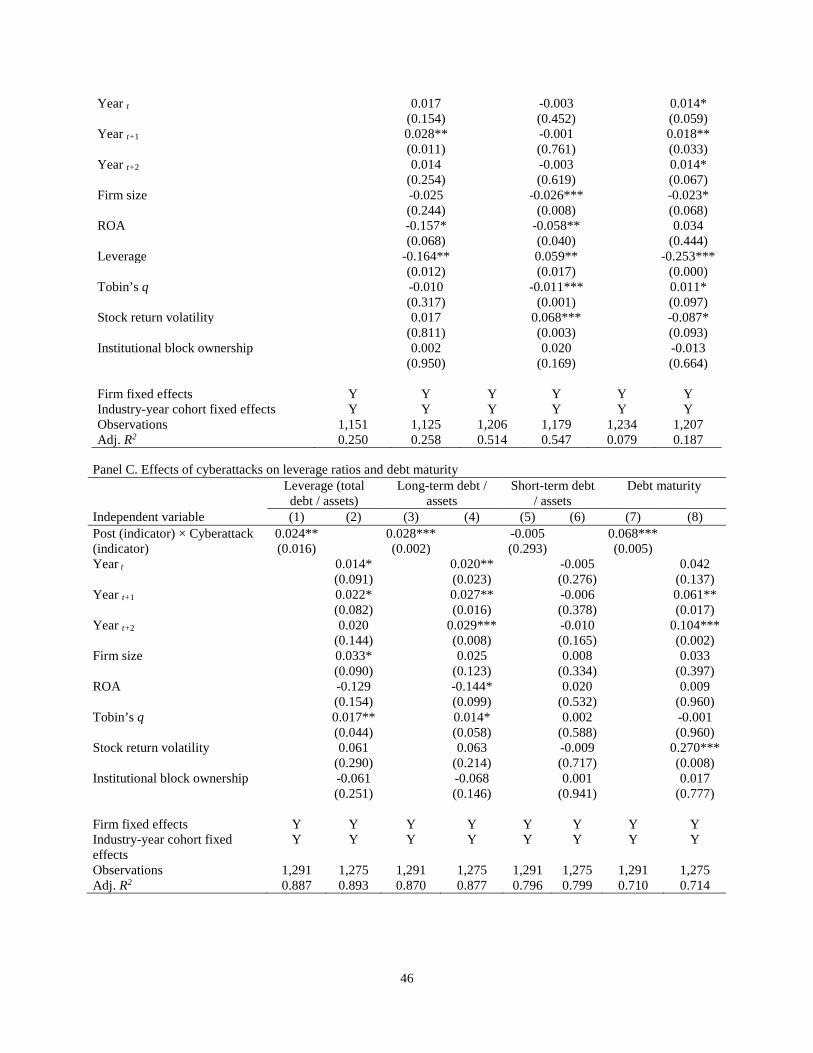
46
Year t 0.017 -0.003 0.014* (0.154) (0.452) (0.059) Year t+1 0.028** -0.001 0.018** (0.011) (0.761) (0.033) Year t+2 0.014 -0.003 0.014* (0.254) (0.619) (0.067) Firm size -0.025 -0.026*** -0.023* (0.244) (0.008) (0.068) ROA -0.157* -0.058** 0.034 (0.068) (0.040) (0.444) Leverage -0.164** 0.059** -0.253*** (0.012) (0.017) (0.000) Tobin’s q -0.010 -0.011*** 0.011* (0.317) (0.001) (0.097) Stock return volatility 0.017 0.068*** -0.087* (0.811) (0.003) (0.093) Institutional block ownership 0.002 0.020 -0.013 (0.950) (0.169) (0.664) Firm fixed effects Y Y Y Y Y Y Industry-year cohort fixed effects Y Y Y Y Y Y Observations 1,151 1,125 1,206 1,179 1,234 1,207 Adj. R2 0.250 0.258 0.514 0.547 0.079 0.187
Panel C. Effects of cyberattacks on leverage ratios and debt maturity Leverage (total
debt / assets) Long-term debt /
assets Short-term debt
/ assets Debt maturity
Independent variable (1) (2) (3) (4) (5) (6) (7) (8) Post (indicator) × Cyberattack (indicator)
0.024** 0.028*** -0.005 0.068*** (0.016) (0.002) (0.293) (0.005)
Year t 0.014* 0.020** -0.005 0.042 (0.091) (0.023) (0.276) (0.137) Year t+1 0.022* 0.027** -0.006 0.061** (0.082) (0.016) (0.378) (0.017) Year t+2 0.020 0.029*** -0.010 0.104*** (0.144) (0.008) (0.165) (0.002) Firm size 0.033* 0.025 0.008 0.033 (0.090) (0.123) (0.334) (0.397) ROA -0.129 -0.144* 0.020 0.009 (0.154) (0.099) (0.532) (0.960) Tobin’s q 0.017** 0.014* 0.002 -0.001 (0.044) (0.058) (0.588) (0.960) Stock return volatility 0.061 0.063 -0.009 0.270***
(0.290) (0.214) (0.717) (0.008) Institutional block ownership -0.061 -0.068 0.001 0.017
(0.251) (0.146) (0.941) (0.777) Firm fixed effects Y Y Y Y Y Y Y Y Industry-year cohort fixed effects
Y Y Y Y Y Y Y Y
Observations 1,291 1,275 1,291 1,275 1,291 1,275 1,291 1,275 Adj. R2 0.887 0.893 0.870 0.877 0.796 0.799 0.710 0.714
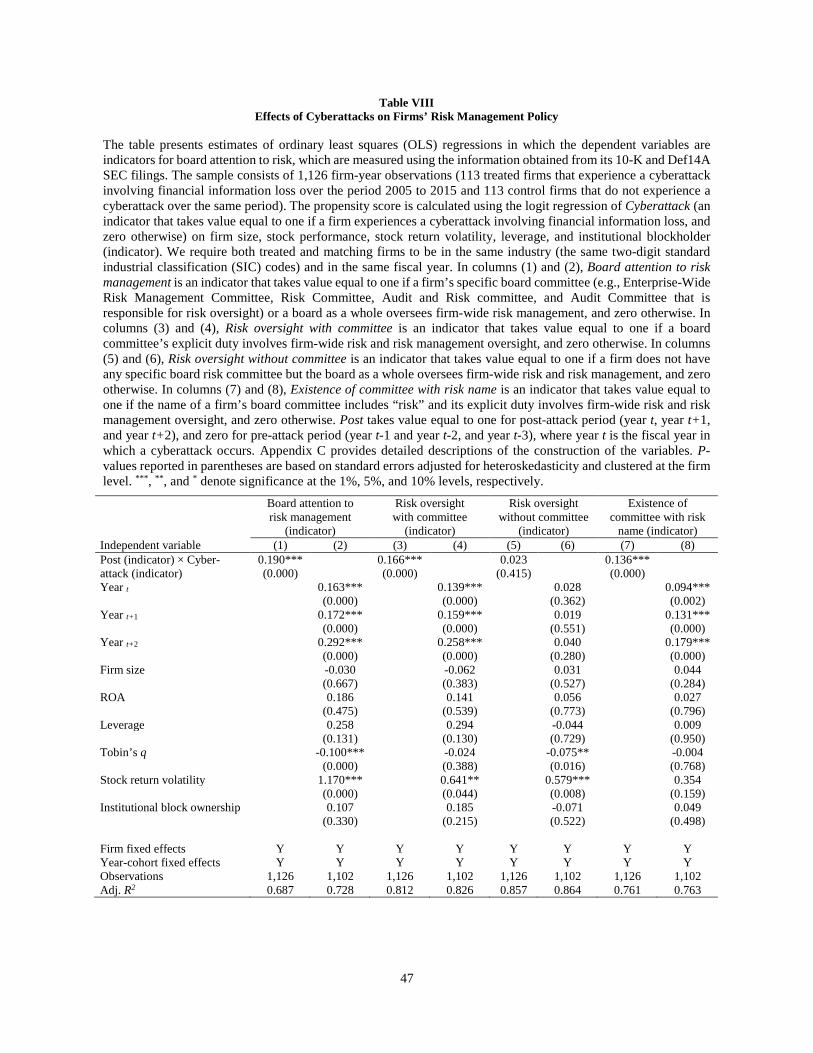
47
Table VIII Effects of Cyberattacks on Firms’ Risk Management Policy
The table presents estimates of ordinary least squares (OLS) regressions in which the dependent variables are indicators for board attention to risk, which are measured using the information obtained from its 10-K and Def14A SEC filings. The sample consists of 1,126 firm-year observations (113 treated firms that experience a cyberattack involving financial information loss over the period 2005 to 2015 and 113 control firms that do not experience a cyberattack over the same period). The propensity score is calculated using the logit regression of Cyberattack (an indicator that takes value equal to one if a firm experiences a cyberattack involving financial information loss, and zero otherwise) on firm size, stock performance, stock return volatility, leverage, and institutional blockholder (indicator). We require both treated and matching firms to be in the same industry (the same two-digit standard industrial classification (SIC) codes) and in the same fiscal year. In columns (1) and (2), Board attention to risk management is an indicator that takes value equal to one if a firm’s specific board committee (e.g., Enterprise-Wide Risk Management Committee, Risk Committee, Audit and Risk committee, and Audit Committee that is responsible for risk oversight) or a board as a whole oversees firm-wide risk management, and zero otherwise. In columns (3) and (4), Risk oversight with committee is an indicator that takes value equal to one if a board committee’s explicit duty involves firm-wide risk and risk management oversight, and zero otherwise. In columns (5) and (6), Risk oversight without committee is an indicator that takes value equal to one if a firm does not have any specific board risk committee but the board as a whole oversees firm-wide risk and risk management, and zero otherwise. In columns (7) and (8), Existence of committee with risk name is an indicator that takes value equal to one if the name of a firm’s board committee includes “risk” and its explicit duty involves firm-wide risk and risk management oversight, and zero otherwise. Post takes value equal to one for post-attack period (year t, year t+1, and year t+2), and zero for pre-attack period (year t-1 and year t-2, and year t-3), where year t is the fiscal year in which a cyberattack occurs. Appendix C provides detailed descriptions of the construction of the variables. P-values reported in parentheses are based on standard errors adjusted for heteroskedasticity and clustered at the firm level. ***, **, and * denote significance at the 1%, 5%, and 10% levels, respectively. Board attention to
risk management (indicator)
Risk oversight with committee
(indicator)
Risk oversight without committee
(indicator)
Existence of committee with risk
name (indicator) Independent variable (1) (2) (3) (4) (5) (6) (7) (8) Post (indicator) × Cyber-attack (indicator)
0.190*** 0.166*** 0.023 0.136*** (0.000) (0.000) (0.415) (0.000)
Year t 0.163*** 0.139*** 0.028 0.094*** (0.000) (0.000) (0.362) (0.002) Year t+1 0.172*** 0.159*** 0.019 0.131*** (0.000) (0.000) (0.551) (0.000) Year t+2 0.292*** 0.258*** 0.040 0.179*** (0.000) (0.000) (0.280) (0.000) Firm size -0.030 -0.062 0.031 0.044 (0.667) (0.383) (0.527) (0.284) ROA 0.186 0.141 0.056 0.027 (0.475) (0.539) (0.773) (0.796) Leverage 0.258 0.294 -0.044 0.009 (0.131) (0.130) (0.729) (0.950) Tobin’s q -0.100*** -0.024 -0.075** -0.004 (0.000) (0.388) (0.016) (0.768) Stock return volatility 1.170*** 0.641** 0.579*** 0.354 (0.000) (0.044) (0.008) (0.159) Institutional block ownership 0.107 0.185 -0.071 0.049 (0.330) (0.215) (0.522) (0.498) Firm fixed effects Y Y Y Y Y Y Y Y Year-cohort fixed effects Y Y Y Y Y Y Y Y Observations 1,126 1,102 1,126 1,102 1,126 1,102 1,126 1,102 Adj. R2 0.687 0.728 0.812 0.826 0.857 0.864 0.761 0.763
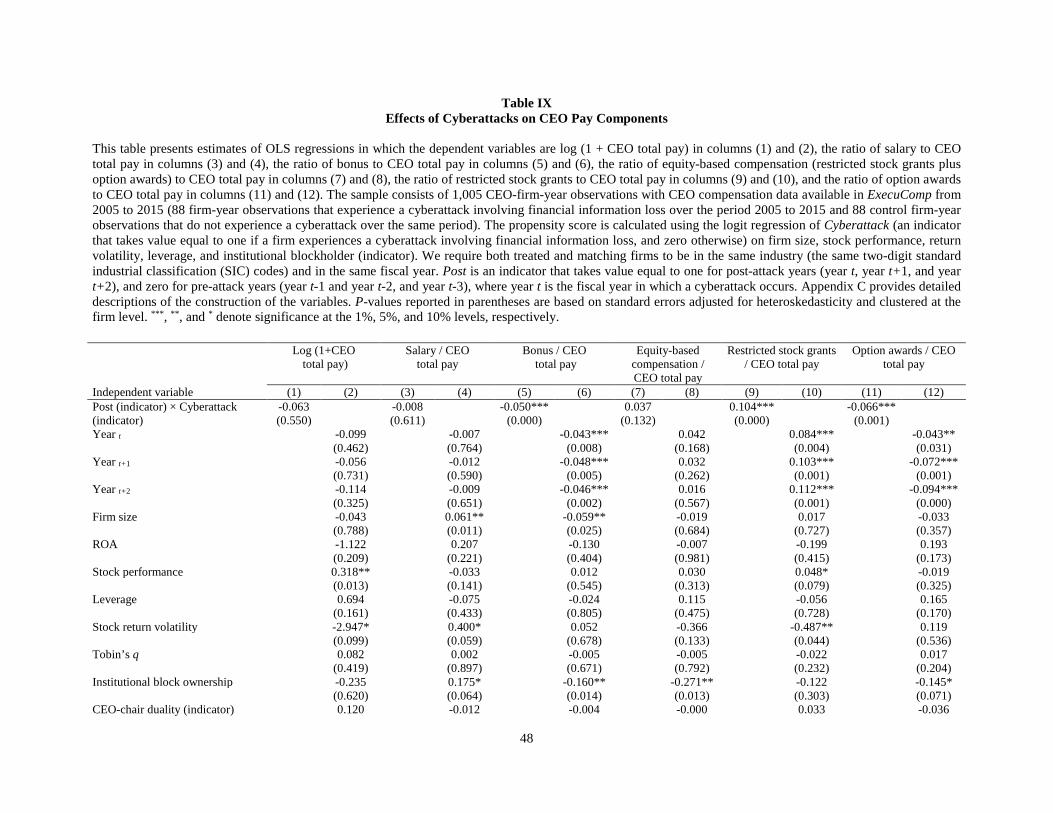
48
Table IX Effects of Cyberattacks on CEO Pay Components
This table presents estimates of OLS regressions in which the dependent variables are log (1 + CEO total pay) in columns (1) and (2), the ratio of salary to CEO total pay in columns (3) and (4), the ratio of bonus to CEO total pay in columns (5) and (6), the ratio of equity-based compensation (restricted stock grants plus option awards) to CEO total pay in columns (7) and (8), the ratio of restricted stock grants to CEO total pay in columns (9) and (10), and the ratio of option awards to CEO total pay in columns (11) and (12). The sample consists of 1,005 CEO-firm-year observations with CEO compensation data available in ExecuComp from 2005 to 2015 (88 firm-year observations that experience a cyberattack involving financial information loss over the period 2005 to 2015 and 88 control firm-year observations that do not experience a cyberattack over the same period). The propensity score is calculated using the logit regression of Cyberattack (an indicator that takes value equal to one if a firm experiences a cyberattack involving financial information loss, and zero otherwise) on firm size, stock performance, return volatility, leverage, and institutional blockholder (indicator). We require both treated and matching firms to be in the same industry (the same two-digit standard industrial classification (SIC) codes) and in the same fiscal year. Post is an indicator that takes value equal to one for post-attack years (year t, year t+1, and year t+2), and zero for pre-attack years (year t-1 and year t-2, and year t-3), where year t is the fiscal year in which a cyberattack occurs. Appendix C provides detailed descriptions of the construction of the variables. P-values reported in parentheses are based on standard errors adjusted for heteroskedasticity and clustered at the firm level. ***, **, and * denote significance at the 1%, 5%, and 10% levels, respectively.
Log (1+CEO total pay)
Salary / CEO total pay
Bonus / CEO total pay
Equity-based compensation / CEO total pay
Restricted stock grants / CEO total pay
Option awards / CEO total pay
Independent variable (1) (2) (3) (4) (5) (6) (7) (8) (9) (10) (11) (12) Post (indicator) × Cyberattack (indicator)
-0.063 -0.008 -0.050*** 0.037 0.104*** -0.066*** (0.550) (0.611) (0.000) (0.132) (0.000) (0.001)
Year t -0.099 -0.007 -0.043*** 0.042 0.084*** -0.043** (0.462) (0.764) (0.008) (0.168) (0.004) (0.031) Year t+1 -0.056 -0.012 -0.048*** 0.032 0.103*** -0.072*** (0.731) (0.590) (0.005) (0.262) (0.001) (0.001) Year t+2 -0.114 -0.009 -0.046*** 0.016 0.112*** -0.094*** (0.325) (0.651) (0.002) (0.567) (0.001) (0.000) Firm size -0.043 0.061** -0.059** -0.019 0.017 -0.033 (0.788) (0.011) (0.025) (0.684) (0.727) (0.357) ROA -1.122 0.207 -0.130 -0.007 -0.199 0.193 (0.209) (0.221) (0.404) (0.981) (0.415) (0.173) Stock performance 0.318** -0.033 0.012 0.030 0.048* -0.019 (0.013) (0.141) (0.545) (0.313) (0.079) (0.325) Leverage 0.694 -0.075 -0.024 0.115 -0.056 0.165 (0.161) (0.433) (0.805) (0.475) (0.728) (0.170) Stock return volatility -2.947* 0.400* 0.052 -0.366 -0.487** 0.119 (0.099) (0.059) (0.678) (0.133) (0.044) (0.536) Tobin’s q 0.082 0.002 -0.005 -0.005 -0.022 0.017 (0.419) (0.897) (0.671) (0.792) (0.232) (0.204) Institutional block ownership -0.235 0.175* -0.160** -0.271** -0.122 -0.145* (0.620) (0.064) (0.014) (0.013) (0.303) (0.071) CEO-chair duality (indicator) 0.120 -0.012 -0.004 -0.000 0.033 -0.036
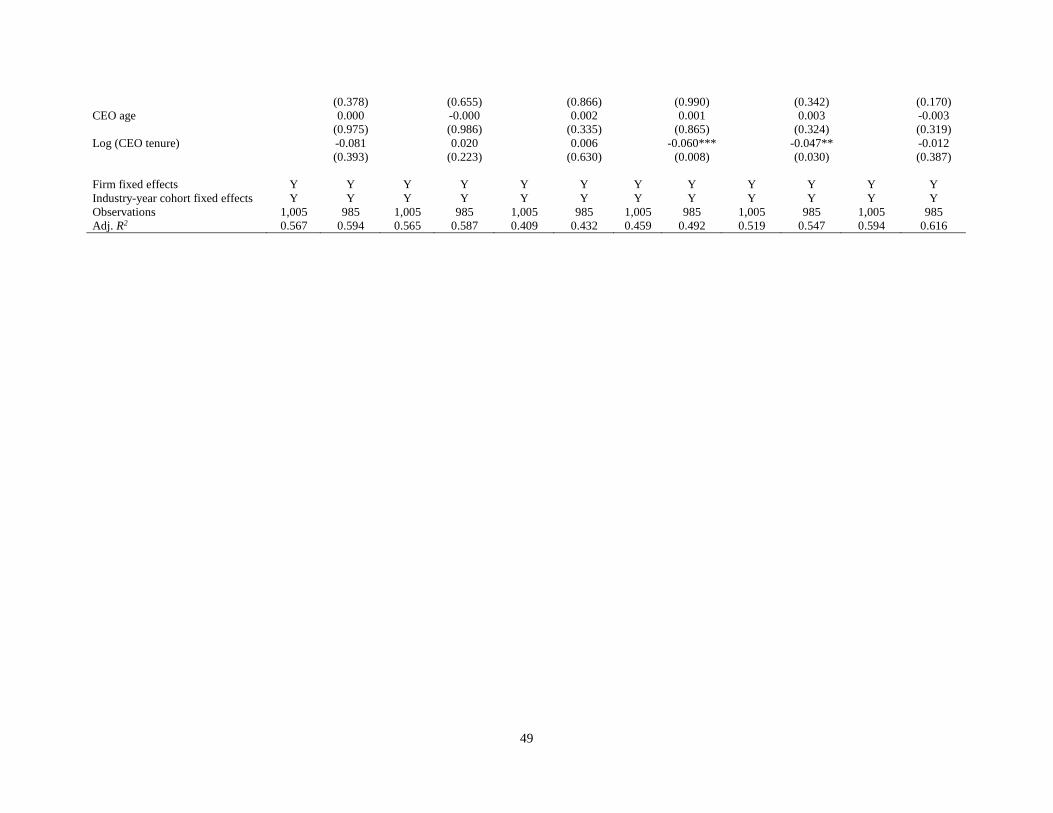
49
(0.378) (0.655) (0.866) (0.990) (0.342) (0.170) CEO age 0.000 -0.000 0.002 0.001 0.003 -0.003 (0.975) (0.986) (0.335) (0.865) (0.324) (0.319) Log (CEO tenure) -0.081 0.020 0.006 -0.060*** -0.047** -0.012 (0.393) (0.223) (0.630) (0.008) (0.030) (0.387) Firm fixed effects Y Y Y Y Y Y Y Y Y Y Y Y Industry-year cohort fixed effects Y Y Y Y Y Y Y Y Y Y Y Y Observations 1,005 985 1,005 985 1,005 985 1,005 985 1,005 985 1,005 985 Adj. R2 0.567 0.594 0.565 0.587 0.409 0.432 0.459 0.492 0.519 0.547 0.594 0.616
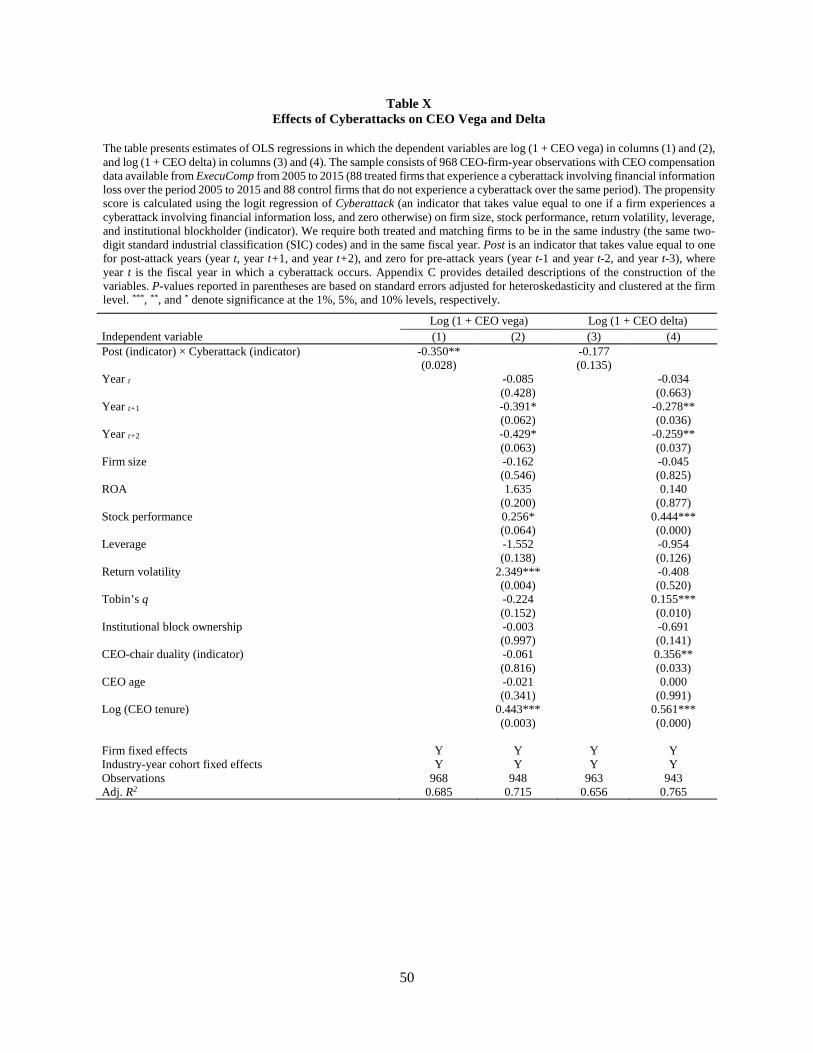
50
Table X Effects of Cyberattacks on CEO Vega and Delta
The table presents estimates of OLS regressions in which the dependent variables are log (1 + CEO vega) in columns (1) and (2), and log (1 + CEO delta) in columns (3) and (4). The sample consists of 968 CEO-firm-year observations with CEO compensation data available from ExecuComp from 2005 to 2015 (88 treated firms that experience a cyberattack involving financial information loss over the period 2005 to 2015 and 88 control firms that do not experience a cyberattack over the same period). The propensity score is calculated using the logit regression of Cyberattack (an indicator that takes value equal to one if a firm experiences a cyberattack involving financial information loss, and zero otherwise) on firm size, stock performance, return volatility, leverage, and institutional blockholder (indicator). We require both treated and matching firms to be in the same industry (the same two-digit standard industrial classification (SIC) codes) and in the same fiscal year. Post is an indicator that takes value equal to one for post-attack years (year t, year t+1, and year t+2), and zero for pre-attack years (year t-1 and year t-2, and year t-3), where year t is the fiscal year in which a cyberattack occurs. Appendix C provides detailed descriptions of the construction of the variables. P-values reported in parentheses are based on standard errors adjusted for heteroskedasticity and clustered at the firm level. ***, **, and * denote significance at the 1%, 5%, and 10% levels, respectively.
Log (1 + CEO vega) Log (1 + CEO delta) Independent variable (1) (2) (3) (4) Post (indicator) × Cyberattack (indicator) -0.350** -0.177 (0.028) (0.135) Year t -0.085 -0.034 (0.428) (0.663) Year t+1 -0.391* -0.278** (0.062) (0.036) Year t+2 -0.429* -0.259** (0.063) (0.037) Firm size -0.162 -0.045 (0.546) (0.825) ROA 1.635 0.140 (0.200) (0.877) Stock performance 0.256* 0.444*** (0.064) (0.000) Leverage -1.552 -0.954 (0.138) (0.126) Return volatility 2.349*** -0.408 (0.004) (0.520) Tobin’s q -0.224 0.155*** (0.152) (0.010) Institutional block ownership -0.003 -0.691 (0.997) (0.141) CEO-chair duality (indicator) -0.061 0.356** (0.816) (0.033) CEO age -0.021 0.000 (0.341) (0.991) Log (CEO tenure) 0.443*** 0.561*** (0.003) (0.000) Firm fixed effects Y Y Y Y Industry-year cohort fixed effects Y Y Y Y Observations 968 948 963 943 Adj. R2 0.685 0.715 0.656 0.765
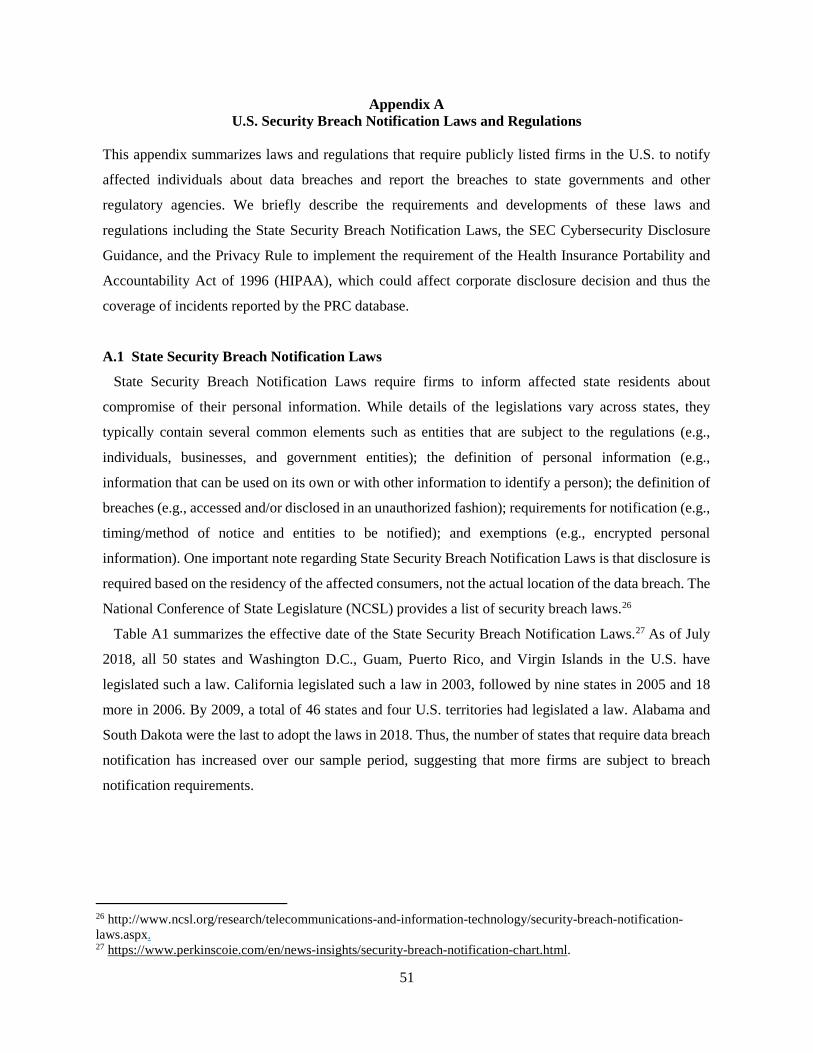
51
Appendix A U.S. Security Breach Notification Laws and Regulations
This appendix summarizes laws and regulations that require publicly listed firms in the U.S. to notify
affected individuals about data breaches and report the breaches to state governments and other
regulatory agencies. We briefly describe the requirements and developments of these laws and
regulations including the State Security Breach Notification Laws, the SEC Cybersecurity Disclosure
Guidance, and the Privacy Rule to implement the requirement of the Health Insurance Portability and
Accountability Act of 1996 (HIPAA), which could affect corporate disclosure decision and thus the
coverage of incidents reported by the PRC database.
A.1 State Security Breach Notification Laws
State Security Breach Notification Laws require firms to inform affected state residents about
compromise of their personal information. While details of the legislations vary across states, they
typically contain several common elements such as entities that are subject to the regulations (e.g.,
individuals, businesses, and government entities); the definition of personal information (e.g.,
information that can be used on its own or with other information to identify a person); the definition of
breaches (e.g., accessed and/or disclosed in an unauthorized fashion); requirements for notification (e.g.,
timing/method of notice and entities to be notified); and exemptions (e.g., encrypted personal
information). One important note regarding State Security Breach Notification Laws is that disclosure is
required based on the residency of the affected consumers, not the actual location of the data breach. The
National Conference of State Legislature (NCSL) provides a list of security breach laws.26
Table A1 summarizes the effective date of the State Security Breach Notification Laws.27 As of July
2018, all 50 states and Washington D.C., Guam, Puerto Rico, and Virgin Islands in the U.S. have
legislated such a law. California legislated such a law in 2003, followed by nine states in 2005 and 18
more in 2006. By 2009, a total of 46 states and four U.S. territories had legislated a law. Alabama and
South Dakota were the last to adopt the laws in 2018. Thus, the number of states that require data breach
notification has increased over our sample period, suggesting that more firms are subject to breach
notification requirements.
26 http://www.ncsl.org/research/telecommunications-and-information-technology/security-breach-notification-laws.aspx. 27 https://www.perkinscoie.com/en/news-insights/security-breach-notification-chart.html.
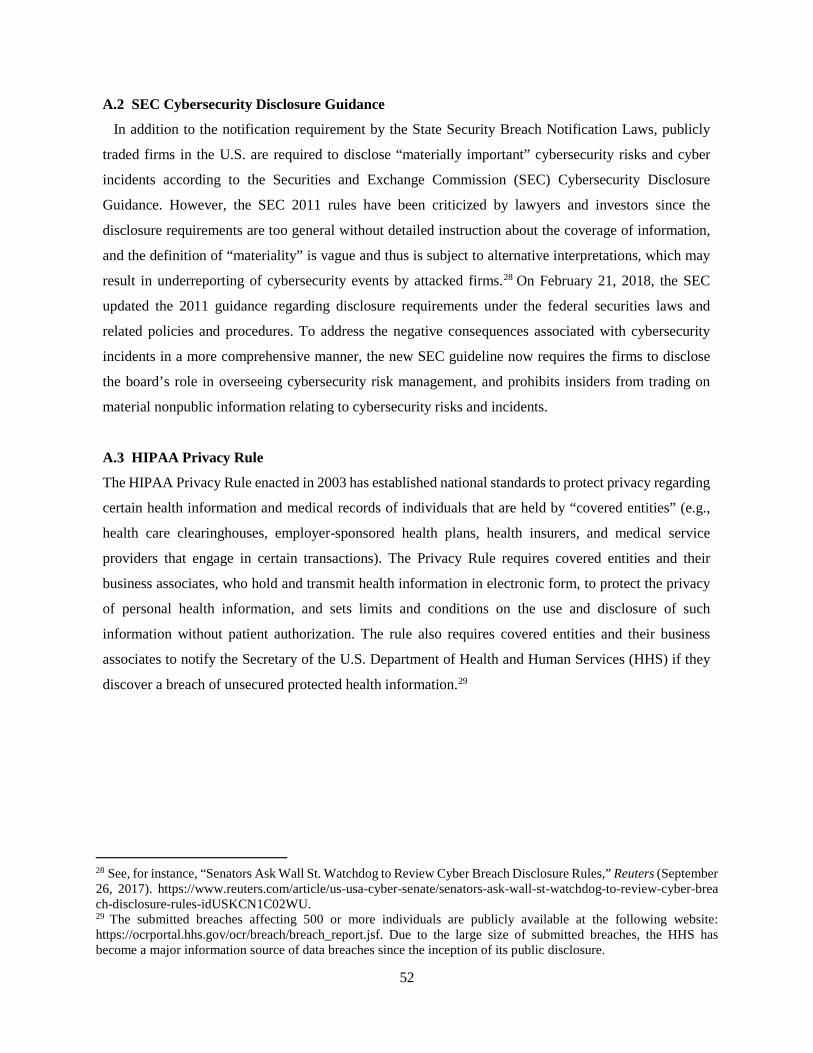
52
A.2 SEC Cybersecurity Disclosure Guidance
In addition to the notification requirement by the State Security Breach Notification Laws, publicly
traded firms in the U.S. are required to disclose “materially important” cybersecurity risks and cyber
incidents according to the Securities and Exchange Commission (SEC) Cybersecurity Disclosure
Guidance. However, the SEC 2011 rules have been criticized by lawyers and investors since the
disclosure requirements are too general without detailed instruction about the coverage of information,
and the definition of “materiality” is vague and thus is subject to alternative interpretations, which may
result in underreporting of cybersecurity events by attacked firms.28 On February 21, 2018, the SEC
updated the 2011 guidance regarding disclosure requirements under the federal securities laws and
related policies and procedures. To address the negative consequences associated with cybersecurity
incidents in a more comprehensive manner, the new SEC guideline now requires the firms to disclose
the board’s role in overseeing cybersecurity risk management, and prohibits insiders from trading on
material nonpublic information relating to cybersecurity risks and incidents.
A.3 HIPAA Privacy Rule
The HIPAA Privacy Rule enacted in 2003 has established national standards to protect privacy regarding
certain health information and medical records of individuals that are held by “covered entities” (e.g.,
health care clearinghouses, employer-sponsored health plans, health insurers, and medical service
providers that engage in certain transactions). The Privacy Rule requires covered entities and their
business associates, who hold and transmit health information in electronic form, to protect the privacy
of personal health information, and sets limits and conditions on the use and disclosure of such
information without patient authorization. The rule also requires covered entities and their business
associates to notify the Secretary of the U.S. Department of Health and Human Services (HHS) if they
discover a breach of unsecured protected health information.29
28 See, for instance, “Senators Ask Wall St. Watchdog to Review Cyber Breach Disclosure Rules,” Reuters (September 26, 2017). https://www.reuters.com/article/us-usa-cyber-senate/senators-ask-wall-st-watchdog-to-review-cyber-brea ch-disclosure-rules-idUSKCN1C02WU. 29 The submitted breaches affecting 500 or more individuals are publicly available at the following website: https://ocrportal.hhs.gov/ocr/breach/breach_report.jsf. Due to the large size of submitted breaches, the HHS has become a major information source of data breaches since the inception of its public disclosure.
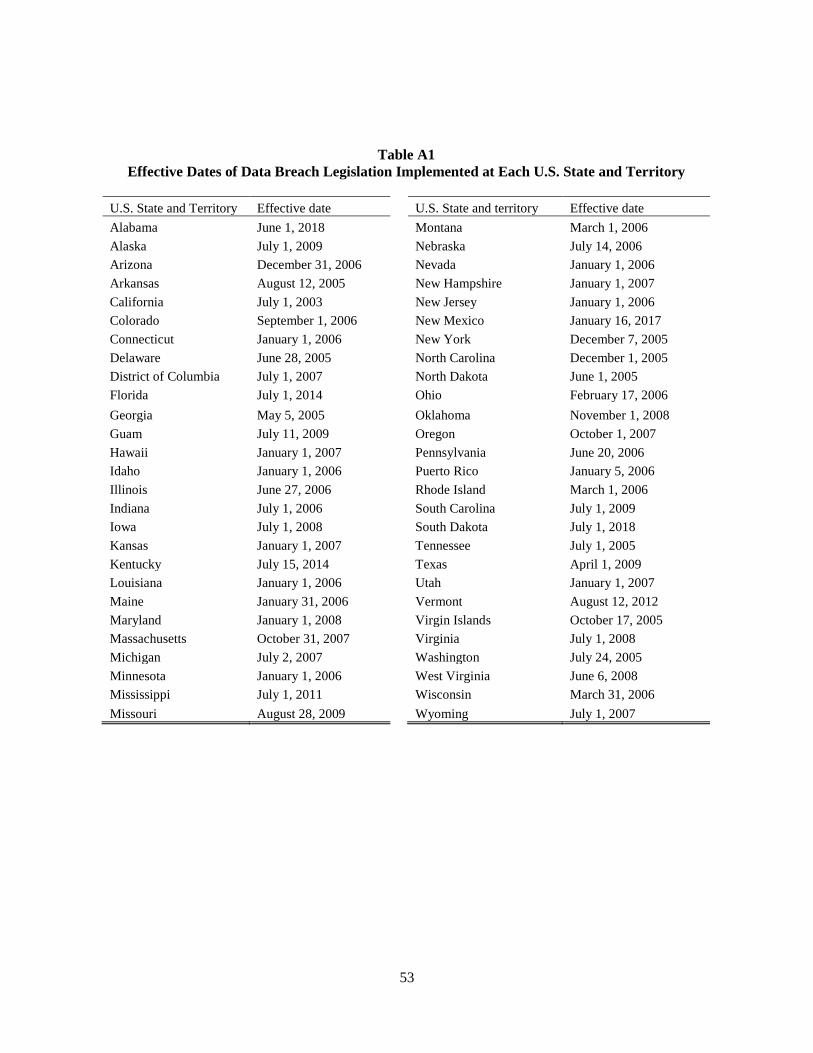
53
Table A1 Effective Dates of Data Breach Legislation Implemented at Each U.S. State and Territory
U.S. State and Territory Effective date U.S. State and territory Effective date Alabama June 1, 2018 Montana March 1, 2006 Alaska July 1, 2009 Nebraska July 14, 2006 Arizona December 31, 2006 Nevada January 1, 2006 Arkansas August 12, 2005 New Hampshire January 1, 2007 California July 1, 2003 New Jersey January 1, 2006 Colorado September 1, 2006 New Mexico January 16, 2017 Connecticut January 1, 2006 New York December 7, 2005 Delaware June 28, 2005 North Carolina December 1, 2005 District of Columbia July 1, 2007 North Dakota June 1, 2005 Florida July 1, 2014 Ohio February 17, 2006 Georgia May 5, 2005 Oklahoma November 1, 2008 Guam July 11, 2009 Oregon October 1, 2007 Hawaii January 1, 2007 Pennsylvania June 20, 2006 Idaho January 1, 2006 Puerto Rico January 5, 2006 Illinois June 27, 2006 Rhode Island March 1, 2006 Indiana July 1, 2006 South Carolina July 1, 2009 Iowa July 1, 2008 South Dakota July 1, 2018 Kansas January 1, 2007 Tennessee July 1, 2005 Kentucky July 15, 2014 Texas April 1, 2009 Louisiana January 1, 2006 Utah January 1, 2007 Maine January 31, 2006 Vermont August 12, 2012 Maryland January 1, 2008 Virgin Islands October 17, 2005 Massachusetts October 31, 2007 Virginia July 1, 2008 Michigan July 2, 2007 Washington July 24, 2005 Minnesota January 1, 2006 West Virginia June 6, 2008 Mississippi July 1, 2011 Wisconsin March 31, 2006 Missouri August 28, 2009 Wyoming July 1, 2007
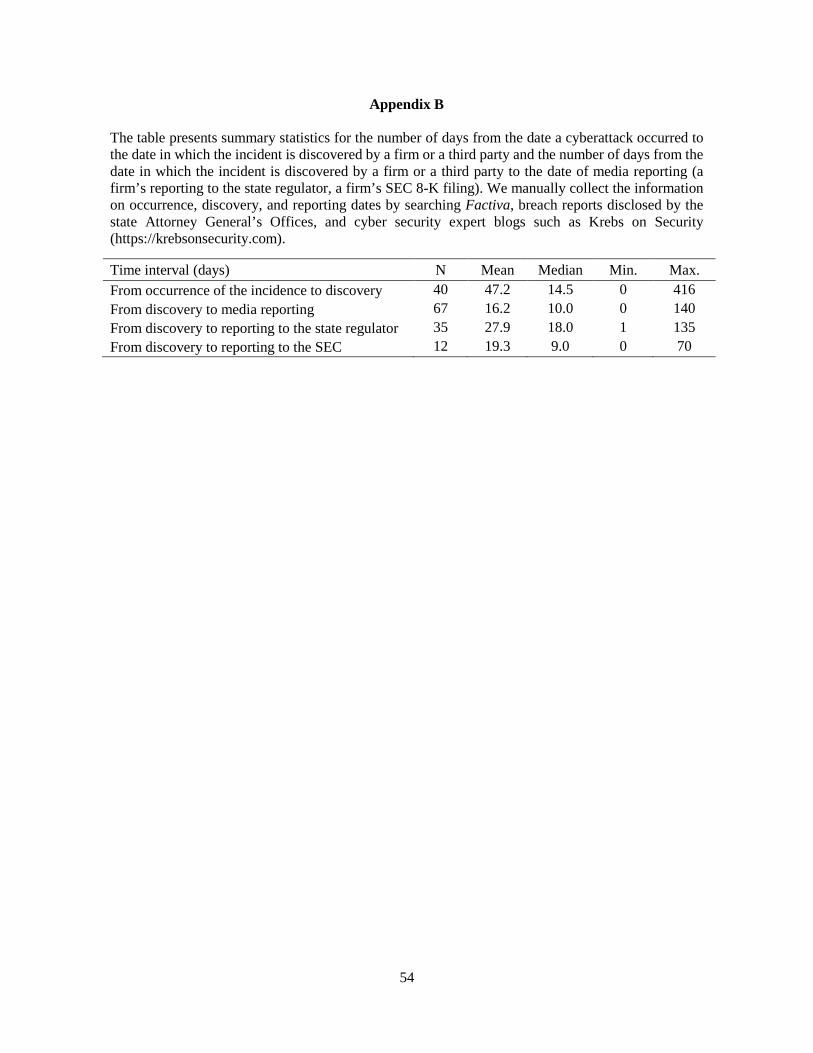
54
Appendix B The table presents summary statistics for the number of days from the date a cyberattack occurred to the date in which the incident is discovered by a firm or a third party and the number of days from the date in which the incident is discovered by a firm or a third party to the date of media reporting (a firm’s reporting to the state regulator, a firm’s SEC 8-K filing). We manually collect the information on occurrence, discovery, and reporting dates by searching Factiva, breach reports disclosed by the state Attorney General’s Offices, and cyber security expert blogs such as Krebs on Security (https://krebsonsecurity.com).
Time interval (days) N Mean Median Min. Max. From occurrence of the incidence to discovery 40 47.2 14.5 0 416 From discovery to media reporting 67 16.2 10.0 0 140 From discovery to reporting to the state regulator 35 27.9 18.0 1 135 From discovery to reporting to the SEC 12 19.3 9.0 0 70
55
Appendix C
This appendix provides detailed descriptions of all the variables used in the tables.
Variable Description Source Acquisition expenditures / assets Data item (aqc) / total assets (at) Compustat
Asset intangibility 1– total property, plant and equipment (ppent) / total assets (at)
Compustat
Bankruptcy score eX / (1+ eX) where X = −13.303 − 1.982 × net income (ni) / assets (at) + 3.593 × liabilities (lt) / assets (at) − 0.467 × log (price close (prcc_f) × common shares outstanding (csho) / market value of securities used (usdval) − 1.809 × abnormal returns + 5.791 × standard deviation of returns (Shumway (2001))
Compustat, CRSP
Board attention to risk management (indicator)
One if a firm’s specific board committee or a board as a whole oversees firm-wide risk and risk management, and zero otherwise
10-K and Def 14a SEC filings
Bonus / CEO total pay Ratio of bonus awarded to CEO total compensation (tdc1) ExecuComp CAPX / assets Capital expenditures (capx) / total assets (at) Compustat Cash flow / assets [Income before extraordinary items (ib) + depreciation
and amortization (dp)] / total assets (at) Compustat
CEO-chair duality (indicator) One if the CEO is also the chair of the board, and zero otherwise
BoardEx
Cyberattack (indicator) One if a firm experiences hacking or malware-electronic entry by an outside party, malware, and spyware, and zero otherwise
PRC
Debt maturity Long-term debt (dltt) / [debt in current liabilities (dlc) + long-term debt (dltt)]
Compustat
Delay of discovery The number of days from the occurrence of the breach to the discovery of the breach by the firm
Factiva and other sources
Delay of reporting The number of days from a firm’s discovery of the breach to the first media reporting
Factiva and other sources
Durable goods industries (indicator)
One for industries with SIC codes of 3400 and above but less than 4000, and zero otherwise (Titman and Wessels (1988))
Compustat
Equity-based compensation / CEO total pay
Ratio of the total dollar amount of options and restricted stocks awarded to the CEO during a fiscal year divided by CEO total pay (tdc1) in the same fiscal year
ExecuComp
Existence of committee with risk name (indicator)
One if the name of a firm’s board committee includes “risk” and its explicit duty involves firm-wide risk and risk management oversight, and zero otherwise
10-K and Def 14a SEC filings
Financial constraint (indicator) One if a firm’s WW index (Whited and Wu (2006)) is in the top tercile of the sample in a given year, and zero otherwise. WW index = −0.091× [(income before extraordinary items (ib) + depreciation and amortization (dp) / total assets (at)] – 0.062 × [indicator that takes value equal to one if dividend for common shares (dvc) + dividend for preferred shares (dvp) is positive, and zero otherwise] + 0.021× [long-term debt (dltt) / total assets (at)] – 0.044 × [log (assets)] + 0.102 × [average industry sales growth (salest / salest-1) for each two-digit SIC industry and each year] – 0.035 × sales growth (salest / salest-1)
Compustat
56
Financial industry (indicator) One for industries with SIC codes of 6000 and above and less than 7000, and zero otherwise
Compustat
Financial information loss (indicator)
One if a firm experiences a cyberattack involving the loss of social security numbers or credit card/bank account information in a given fiscal year, and zero otherwise
PRC
Financing deficit / assets [Cash dividends + investments + ∆ working capital – internal cash flow] / total assets (at) (Frank and Goyal (2003))
Compustat
Firm size Logarithm of total assets (at) Compustat Fortune 500 membership (indicator)
One if a firm is included in the list of Fortune 500 companies in a given year, and zero otherwise
Compustat
Industry Herfindahl Index Index computed as the sum of squared market shares of firms’ sales at the two-digit SIC industry level
Compustat
Industry Tobin’s q Median Tobin’s q of all firms in the same two-digit SIC code industries in a given year
Compustat
Institutional block ownership Number of shares held by institutional shareholders that own more than 5% of a firm’s equity scaled by the total number of shares outstanding
Thompson13F
Leverage (total debt / assets) [Long-term debt (dltt) + short-term debt (dlc)] / total assets (at)
Compustat
Log (1 + CEO total pay) Log (1 + CEO total compensation (tdc1)) ExecuComp Log (cash flow volatility) Standard deviation of cash flows from operations from the
statement of cash flows (quarterly data item oancfy) scaled by shares outstanding adjusted for stock splits in a given fiscal year
Compustat quaterly
Log (firm age) Logarithm of max (years in CRSP, years in Compustat) Compustat, CRSP
Long-term debt Data item (dltt) Compustat Net debt issue / assets Net debt issues (dltis – dltr) scaled by total assets (at) Compustat Net equity issue / assets Net equity issues (sstk – prstkc) scaled by total assets (at) Compustat Net worth Stockholder equity (seq) / total assets (at) Compustat Number of board committees Number of board committees in a given fiscal year BoardEx Option awards / CEO total pay Total dollar amount of stock options awarded to the CEO
during a fiscal year divided by CEO total pay (tdc1) in the same fiscal year
ExecuComp
Post (indicator) One for post-attack years (year t, year t+1, and year t+2), and zero for pre-attack years (year t-1 and year t-2, and year t-3), where year t is the fiscal year when a cyberattack occurs
R&D / assets Max (0, R&D expenditures (xrd)) / total assets (at) Compustat Repeated cyberattacks within one year (indicator)
One if a firm experiences another cyberattack within one year of the previous cyberattack, and zero otherwise
PRC
Restricted stock grants / CEO total pay
Total dollar amount of restricted stocks awarded to the CEO during a fiscal year divided by CEO total pay (tdc1) in the same fiscal year
ExecuComp
Retail industry (indicator) One for industries with SIC codes of 5,200 and above but less than 6,000, and zero otherwise
Compustat
Risk committee (indicator) One if the name of a firm’s board committee includes “risk,” and zero otherwise
BoardEx
Risk oversight with committee (indicator)
One if a board committee’s explicit duty involves firm-wide risk and risk management oversight, and zero otherwise
10-K and Def 14a SEC filings
Risk oversight without committee (indicator)
One if a firm does not have any specific board risk committee but the board as a whole oversees firm-wide risk and risk management, and zero otherwise
10-K and Def 14a SEC filings
57
ROA Net income (ni) / total assets (at) Compustat S&P credit rating Scale numbers of alphabetical symbols of S&P domestic
long term issuer credit ratings (splticrm) ranging from AAA+ to D (highest=23, lowest=1)
Compustat
Salary / CEO total pay Total dollar amount of salary paid to the CEO during a fiscal year divided by to CEO total compensation (tdc1) in the same fiscal year
ExecuComp
Sales growth Salest / salest-1 Compustat Short-term debt Debt in current liabilities (dlc) Compustat State law (indicator) One if a firm is headquartered in a state in which a data
breach notification law is put in place in a given year, and zero otherwise
Perkins Coie law firm website
Stock performance Buy-and-hold return for the year net of the CRSP value-weighted index return
CRSP
Stock return volatility Standard deviation of a firm’s daily stock returns during a fiscal year
CRSP
Tobin’s q [Total assets (at) – common/ordinary equity (ceq) + market value of equity (prcc_f × csho)] / total assets (at)
Compustat
Unique industry (indicator) One if a firm’s industry is in the top quartile of all the two-digit SIC industries annually sorted by industry-median product uniqueness, and zero otherwise. Product uniqueness is defined as selling expense scaled by sales
Compustat
Yeart (indicator) One for the fiscal year in which a firm experiences hacking or malware-electronic entry by an outside party, malware, and spyware, and zero otherwise
Yeart+1 (indicator) One for one year after a firm experiences hacking or malware-electronic entry by an outside party, malware, and spyware, and zero otherwise
Yeart+2 (indicator) One for two years after a firm experiences hacking or malware-electronic entry by an outside party, malware, and spyware, and zero otherwise
![[PPT]Mitigating Rapid Cyberattacks (Petya, WannaCrypt, … · Web viewMitigating Rapid Cyberattacks(Petya, WannaCrypt, and similar) Mark Simos Lead Cybersecurity Architect, Microsoft](https://img.pdfslide.net/doc/110x75/5aeef9377f8b9aa9168bee8a/pptmitigating-rapid-cyberattacks-petya-wannacrypt-viewmitigating-rapid.jpg)