Embed Size (px)
Citation preview

What is the Price of Hubris? Using Takeover Battles to Infer Overpayments and Synergies
Pekka Hietala, Steven N. Kaplan, and David T. Robinson∗
March 2003
ABSTRACT
We present a framework for determining the information that can be extracted from stock prices around takeover contests. In only two types of cases is it theoretically possible to use stock price movements to infer bidder overpayment and relative synergies. Even in these two cases, we argue that it is practically difficult to extract this information. We are able, however, to illustrate one of these generic cases using the takeover contest for Paramount in 1994. We estimate that Viacom, the “winning” bidder, overpaid for Paramount by more than $2 billion. This occurred despite the fact that Viacom’s CEO owned roughly 3/4 of Viacom. These results are consistent with managerial overconfidence and/or large private benefits, but not with the traditional agency-based incentive problem.
∗ Insead, University of Chicago Graduate School of Business and NBER, and Columbia University respectively. We would like to thank Rob Gertner for suggesting that this acquisition would have theoretical interest. Oliver Hart, Erik Stafford, Jeremy Stein, and an anonymous referee provided helpful comments. Address correspondence to Steven Kaplan, Graduate School of Business, The University of Chicago, 1101 East 58th Street, Chicago, IL 60637 or e-mail at [email protected].
1
When a merger is announced, three different pieces of information affect the stock prices of the
target and bidder. The announcement reveals information about the potential synergies arising from the
combination, the stand-alone value of the firms involved in the merger, and, how the value will be split
between the target and the bidder(s). In general, it is not possible to distinguish among these three effects
in a particular takeover contest. For example, if the announcement reveals favorable (unfavorable)
information about the target and bidder, the combined change in bidder and target stock values will
exceed (not exceed) the synergies arising from the merger.1 Similarly, if the bid reveals favorable
(unfavorable) news about the stand-alone value of the bidder, the change in bidder stock value will
overstate (understate) the benefit of the transaction to the bidder.2
This paper develops and applies a classification scheme that identifies those situations in which it
is potentially possible to disentangle the sources of price changes. In the first part of the paper, we
identify two generic cases in which synergy, overpayment, and information effects can be disentangled to
solve for the estimated overpayment by the bidder. One occurs when the acquisition is not consummated;
the other occurs when the acquisition is a takeover contest that includes exactly two bidders. We also
discuss the additional (information) conditions that must be satisfied in practice to be able to disentangle
the different effects. Even for the two generic cases we identify, we point out that most such takeovers
will not satisfy the necessary information conditions.
In the second part of this paper, we analyze the takeover contest for Paramount that began in the
fall of 1993 and ended in the winter of 1994. This contest (1) is representative of one of the generic cases
and (2) comes close to satisfying the required information conditions. The Paramount contest involved
exactly two bidders: QVC, led by Barry Diller; and Viacom, led by Sumner Redstone. The unusual
structure of the contest allows us to estimate bidder overpayments, relative synergies, and information
effects.
1 See, for example, Bradley, Desai and Kim (1988), Jensen and Ruback (1983), and Roll (1986). 2 For example, offers financed by the bidder's stock may signal that the stock is over-valued (Franks, Harris, and Titman (1991)).
2
We use our framework to calculate that the market estimated that Viacom, the eventual “winner"
of the takeover battle, overpaid by more than $2 billion when it agreed to purchase Paramount in a $9.2
billion acquisition in February 1994. The market estimates appear to be reliable in that market prices did
not revert in the three years following the acquisition. This overpayment occurred despite the fact that
Sumner Redstone, the CEO of Viacom, owned more than 75% of the Viacom’s cash flow and voting
rights.
These results have two possible (and not mutually exclusive) interpretations. The first is that
Redstone’s beliefs were very different from those of the market. The unwillingness to revise those beliefs
in light of the market reaction is strongly consistent with the argument in Roll (1986) that “bidding firms
infected by hubris simply pay too much for their targets,” as well as papers that stress managerial
overconfidence such as Heaton (2002) and Malmendier and Tate (2002). The second interpretation is that
Redstone received large private (and non-pecuniary) benefits from the acquisition. Perhaps he wanted to
be the “king of all media.” This is strongly consistent with theories in which private benefits drive
managerial decision making over and above pecuniary incentives.
The important implication of our results is that neither interpretation is consistent with the
traditional agency or incentive problem because Redstone controlled such a large fraction of Viacom’s
cash flow rights. Our analysis indicates that the combination of overconfidence and private benefits
exceeded $1.5 billion.
This paper contributes to a large literature in corporate finance that studies the information and
value effects of mergers. That literature is too large to survey here.3 The papers closest to ours are
Bhagat, Hirshleifer and Noah (2001), Fuller, Netter and Stegemoller (2002), and Schurman (1999).
Bhagat et al. (2001) estimate overpayments and synergies using movements in the bidder’s and target's
stock prices around an intervening offer from another firm. They identify their empirical analysis by
using ex post data (the sample average) to estimate the ex ante probabilities of success for initial and
subsequent bidders and the expected price that a winning bidder will have to pay. With these
3
assumptions, they find that acquisitions are expected to be value increasing overall, but that bidders do
not gain on average. Fuller et al. (2002) estimate bidder returns for frequent or serial acquirers. They
argue that this reduces the amount of information about the bidder that is revealed in any particular
acquisition. Schurman (1999) uses a related intervention technique to estimate proposed overpayments in
acquisitions that were rejected by anti-trust authorities. Consistent with our results, he finds that bidders
who suffer losses at takeover announcements do so primarily due to overpayment. Our empirical analysis
differs from those in those papers in that we obtain direct estimates of overpayment and relative synergies
for one particular transaction.
Our paper also illustrates the issues raised by Bebchuk and Hart (2001) who present a model to
study the relationship between pre-voting market prices and shareholder tender and voting decisions in
control contests.
The paper proceeds as follows. Section I introduces the symbols and definitions used throughout
the paper, and sets up the basic problem that we study. Section II derives those generic takeover
situations in which it is potentially possible to estimate how much the bidder overpays for the target. We
also discuss the additional conditions necessary to generate these estimates. Section III presents the
clinical analysis of the paper. We detail the sequence of events that led to the Paramount auction, and
analyze the market reactions to developments as they occurred. Section IV applies the methodology from
sections I and II to the Paramount takeover contest, and solves for the market’s estimates of the two
bidders' information effects, overpayments and relative synergies with Paramount. Section V concludes.
I.. The Analytical Framework
In this section, we analyze generic acquisition contests between N potential acquirers and one
target. Let the acquirers be denoted by A, B, C,..., the target, T. To simplify the analysis, we describe a
takeover contest with four distinct points in time:
3 For a recent survey, see Andrade, Mitchell and Stafford (2001).
4
• Time 0 denotes a time before the takeover contest has started. The market prices of the potential acquirers and
the target reflect the market's estimates of the companies stand alone values without any information about the
coming takeover contest.
• Time 1 denotes the time when the takeover contest begins by at least one of the potential acquirers submitting
an initial bid. The market prices of the potential acquirers and the target reflect the new information in a manner
consistent with the market's consensus. In our analysis we do not use these prices.
• Time 2 denotes the time when all the potential acquirers have submitted their final offers (or, more importantly
what the market believes are the final offers). We assume that the market prices at this point reflect (a) the
market's valuations of different possible combinations, (b) the market's updated stand-alone valuations of
individual companies (updated for the information possibly revealed by the various bids) and (c) the market's
assessments of the winning probabilities for each bid (denoted θIt for firm I). W will consider the case in which
the sum of the winning probabilities is one as well as the case in which the sum is less than one.
• Time 3 denotes when the board of directors (or the shareholders) announces the outcome of the contest. As
mentioned above, we will consider the case in which the outcome has to be an acquisition by one of the
acquirers as well as the case in which it is possible that the board announces that the takeover contest is over
and the target will continue to operate independently.
Market values at time 3 reflect the final outcome and are denoted as follows. Let IJ represent the
value of firm I if firm J wins control of the target, T. For instance, AA, BB, CC, …, denote the value of the
particular acquirer if it is the winner of the takeover contest. These values reflect the market's estimates of
the synergies, readjusted stand-alone values, as well as the winner's final offer. Likewise, AB represents
the value of firm A if firm B wins control of the target.
Next, let AN, BN, CN, ..., and TN, represent the market values of firms A, B, C, ..., T, if no
acquisition takes place. These values reflect the market's updated stand-alone values of the firms. Finally,
the target's market value in the case of a successful acquisition by firm I is denoted OI(II). For example,
OA(AA) refers to the value of acquirer A's final offer, which can be a function of the acquirer's share price
if the offer includes securities of the acquirer.
5
A. Defining the Sources of Value Change
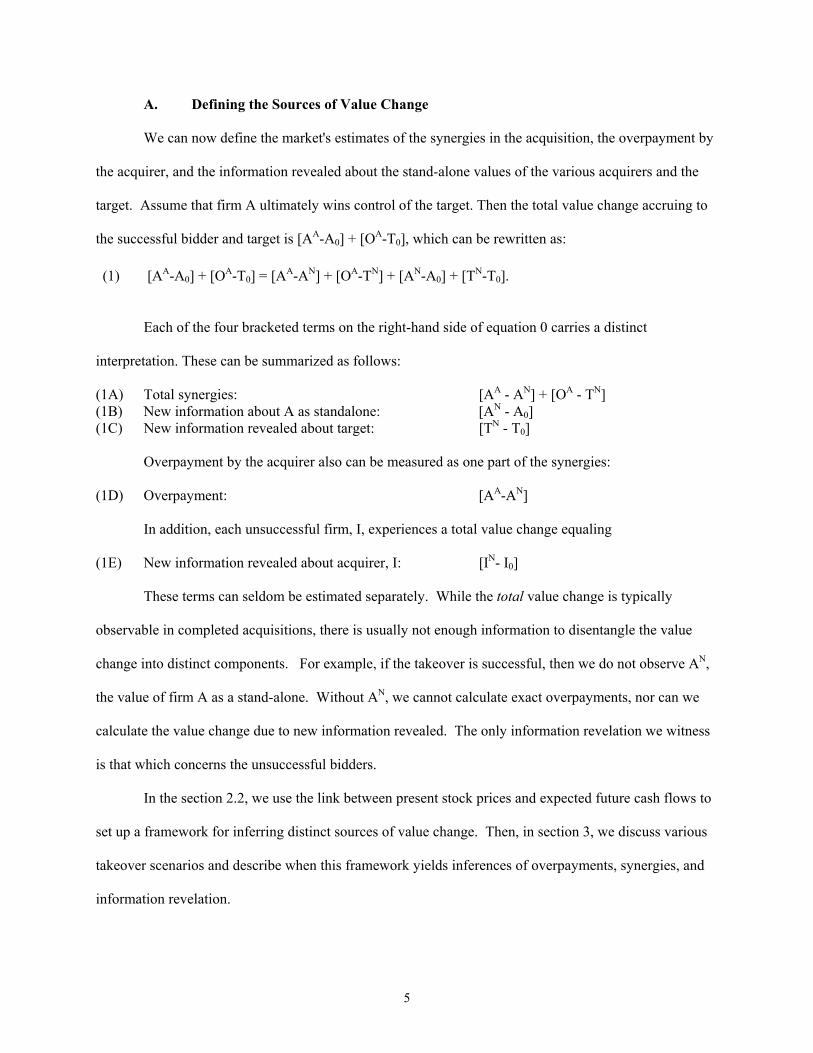
We can now define the market's estimates of the synergies in the acquisition, the overpayment by
the acquirer, and the information revealed about the stand-alone values of the various acquirers and the
target. Assume that firm A ultimately wins control of the target. Then the total value change accruing to
the successful bidder and target is [AA-A0] + [OA-T0], which can be rewritten as:
(1) [AA-A0] + [OA-T0] = [AA-AN] + [OA-TN] + [AN-A0] + [TN-T0].
Each of the four bracketed terms on the right-hand side of equation 0 carries a distinct
interpretation. These can be summarized as follows:
(1A) Total synergies: [AA - AN] + [OA - TN] (1B) New information about A as standalone: [AN - A0] (1C) New information revealed about target: [TN - T0] Overpayment by the acquirer also can be measured as one part of the synergies: (1D) Overpayment: [AA-AN]
In addition, each unsuccessful firm, I, experiences a total value change equaling
(1E) New information revealed about acquirer, I: [IN- I0]
These terms can seldom be estimated separately. While the total value change is typically
observable in completed acquisitions, there is usually not enough information to disentangle the value
change into distinct components. For example, if the takeover is successful, then we do not observe AN,
the value of firm A as a stand-alone. Without AN, we cannot calculate exact overpayments, nor can we
calculate the value change due to new information revealed. The only information revelation we witness
is that which concerns the unsuccessful bidders.
In the section 2.2, we use the link between present stock prices and expected future cash flows to
set up a framework for inferring distinct sources of value change. Then, in section 3, we discuss various
takeover scenarios and describe when this framework yields inferences of overpayments, synergies, and
information revelation.
6
B. Identifying the Sources of Value Change
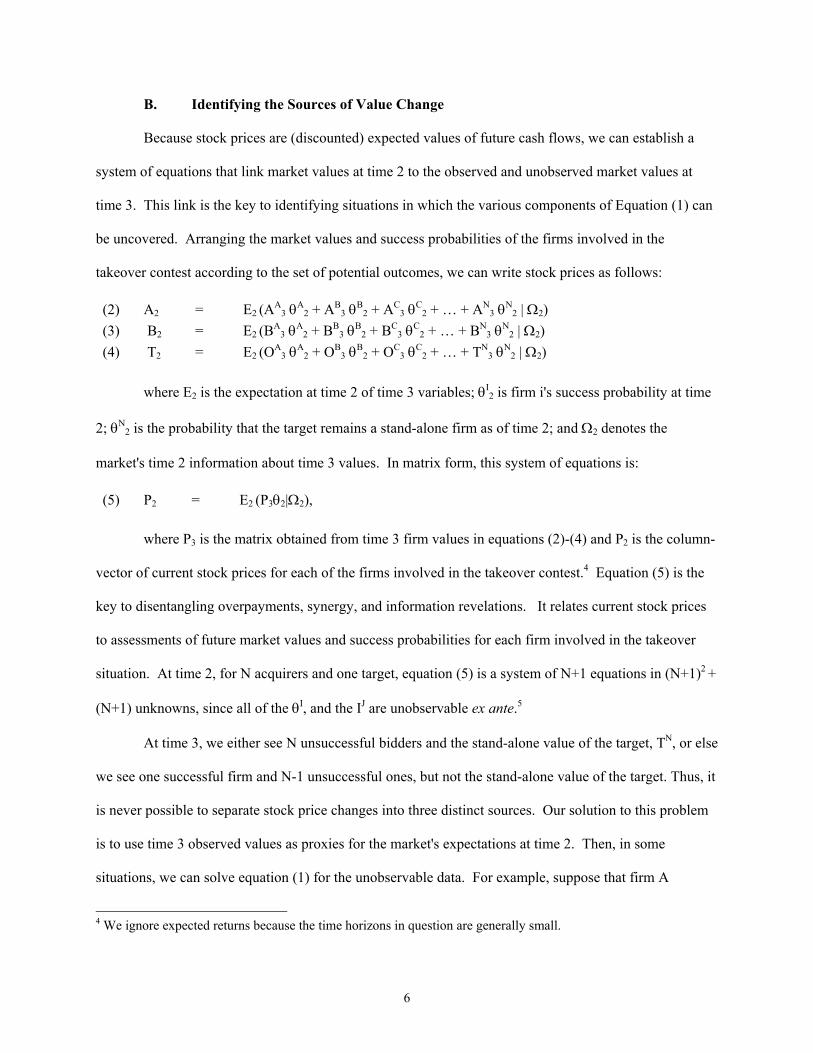
Because stock prices are (discounted) expected values of future cash flows, we can establish a
system of equations that link market values at time 2 to the observed and unobserved market values at
time 3. This link is the key to identifying situations in which the various components of Equation (1) can
be uncovered. Arranging the market values and success probabilities of the firms involved in the
takeover contest according to the set of potential outcomes, we can write stock prices as follows:
(2) A2 = E2 (AA3 θA
2 + AB3 θB
2 + AC3 θC
2 + … + AN3 θN
2 | Ω2) (3) B2 = E2 (BA
3 θA2 + BB
3 θB2 + BC
3 θC2 + … + BN
3 θN2 | Ω2)
(4) T2 = E2 (OA3 θA
2 + OB3 θB
2 + OC3 θC
2 + … + TN3 θN
2 | Ω2)
where E2 is the expectation at time 2 of time 3 variables; θI2 is firm i's success probability at time
2; θN2 is the probability that the target remains a stand-alone firm as of time 2; and Ω2 denotes the
market's time 2 information about time 3 values. In matrix form, this system of equations is:
(5) P2 = E2 (P3θ2|Ω2),
where P3 is the matrix obtained from time 3 firm values in equations (2)-(4) and P2 is the column-
vector of current stock prices for each of the firms involved in the takeover contest.4 Equation (5) is the
key to disentangling overpayments, synergy, and information revelations. It relates current stock prices
to assessments of future market values and success probabilities for each firm involved in the takeover
situation. At time 2, for N acquirers and one target, equation (5) is a system of N+1 equations in (N+1)2 +
(N+1) unknowns, since all of the θI, and the IJ are unobservable ex ante.5
At time 3, we either see N unsuccessful bidders and the stand-alone value of the target, TN, or else
we see one successful firm and N-1 unsuccessful ones, but not the stand-alone value of the target. Thus, it
is never possible to separate stock price changes into three distinct sources. Our solution to this problem
is to use time 3 observed values as proxies for the market's expectations at time 2. Then, in some
situations, we can solve equation (1) for the unobservable data. For example, suppose that firm A
4 We ignore expected returns because the time horizons in question are generally small.
7
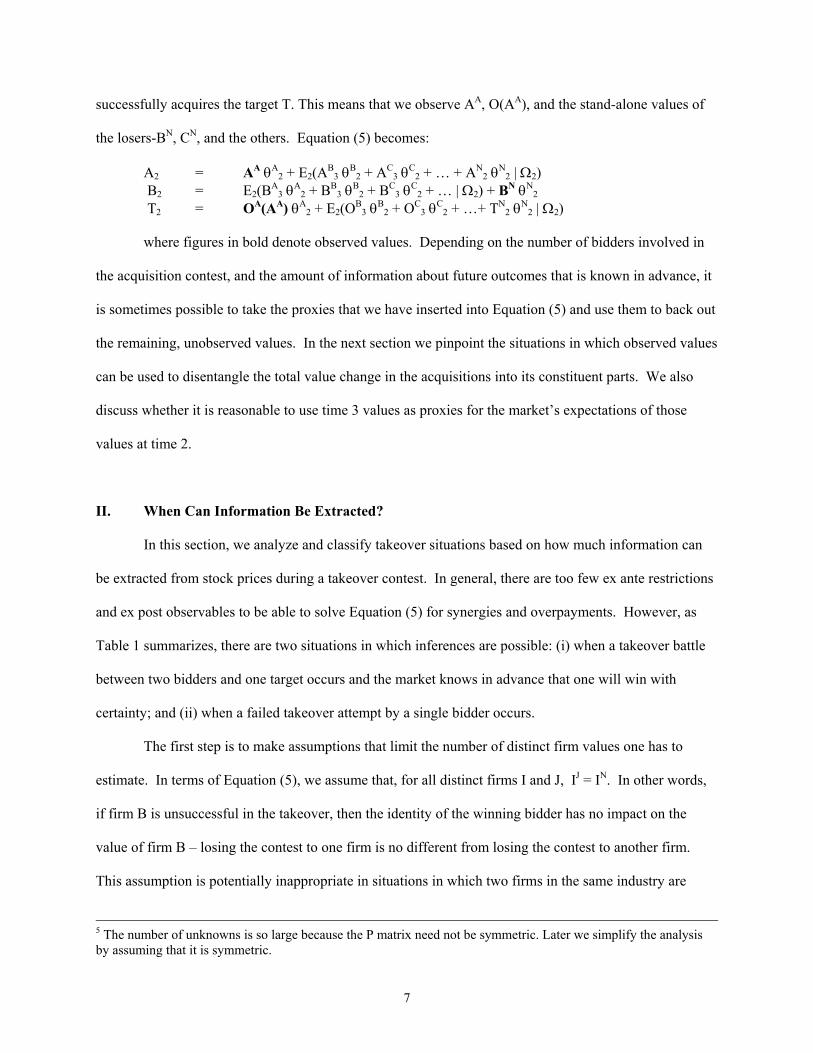
successfully acquires the target T. This means that we observe AA, O(AA), and the stand-alone values of
the losers-BN, CN, and the others. Equation (5) becomes:
A2 = AA θA2 + E2(AB
3 θB2 + AC
3 θC2 + … + AN
2 θN2 | Ω2)
B2 = E2(BA3 θA
2 + BB3 θB
2 + BC3 θC
2 + … | Ω2) + BN θN2
T2 = OA(AA) θA2 + E2(OB
3 θB2 + OC
3 θC2 + …+ TN
2 θN2 | Ω2)
where figures in bold denote observed values. Depending on the number of bidders involved in
the acquisition contest, and the amount of information about future outcomes that is known in advance, it
is sometimes possible to take the proxies that we have inserted into Equation (5) and use them to back out
the remaining, unobserved values. In the next section we pinpoint the situations in which observed values
can be used to disentangle the total value change in the acquisitions into its constituent parts. We also
discuss whether it is reasonable to use time 3 values as proxies for the market’s expectations of those
values at time 2.
II. When Can Information Be Extracted?
In this section, we analyze and classify takeover situations based on how much information can
be extracted from stock prices during a takeover contest. In general, there are too few ex ante restrictions
and ex post observables to be able to solve Equation (5) for synergies and overpayments. However, as
Table 1 summarizes, there are two situations in which inferences are possible: (i) when a takeover battle
between two bidders and one target occurs and the market knows in advance that one will win with
certainty; and (ii) when a failed takeover attempt by a single bidder occurs.
The first step is to make assumptions that limit the number of distinct firm values one has to
estimate. In terms of Equation (5), we assume that, for all distinct firms I and J, IJ = IN. In other words,
if firm B is unsuccessful in the takeover, then the identity of the winning bidder has no impact on the
value of firm B – losing the contest to one firm is no different from losing the contest to another firm.
This assumption is potentially inappropriate in situations in which two firms in the same industry are
5 The number of unknowns is so large because the P matrix need not be symmetric. Later we simplify the analysis by assuming that it is symmetric.

8
bidding for a target that, if acquired, would give one firm a market advantage over the other.6 There are
two reasons why we still make this assumption. Most importantly, it simplifies our analysis, but does not
affect our results – the assumption is irrelevant for the two circumstances in which inferences are
possible. In addition, the evidence in Eckbo ((1985) and (1992)) suggests that the assumption is
reasonable. He studies the stock price reactions to rival firms when a merger is announced and finds that
rival firms earn essentially zero abnormal returns. Although he does not focus explicitly on losing parties
in a merger transaction, his evidence suggests that this assumption seems reasonable for our purposes,
since it suggests that the market value of neighboring firms to a merger is unaffected by the merger
outcome.
This assumption reduces the number of bidder stock prices in Equation (5) from (n+1)2 to 2n+2.7
Ex ante, none of these are visible, but at time 3, n+1 stock prices are revealed, leaving n+1 stock prices
and n+1 probabilities to be calculated.
We divide the takeover situations into two categories based on market beliefs at time 2, (that is, at
the point in time when the final bids have been made but the final outcome is not yet known). The
categories are:
• Category I: Takeover situations in which the market knows at time 2 that one of the bidders will take over the target. That is, the winning probabilities sum to one, and this information is known at time 2.
• Category II: Takeover situations in which the market believes at time 2 that there is a positive probability that the target will not accept any of the bids but will continue as an independent stand-alone company. That is, the sum of the winning probabilities is strictly less than one.
In Category I, the ex ante information about takeover probabilities works to eliminate one
element of the θ vector in equation (5), because θN = 0. Also, setting θN = 0 zeros out N additional
elements of the P3 matrix. Empirically, we can assign a takeover situation into category I when the target
has put itself “on play" or organizes an auction among the potential acquirers. A more typical takeover
situation would be assigned to category II.
6 For example, see Esty (1998). 7 The 2n+2 unknowns comes from the fact that there are two unknowns per firm, and there are are n+1 firms.
9
Ex post (at time 3), we can further divide category II takeover situations into two subcategories
based on the final outcome:
• Category II-A: Takeover situations in category II in which the final outcome is that the target is taken over by one of the bidders.
• Category II-B: Takeover situations in category II in which the final outcome is that the target stays independent.
Ex post information further shapes the P3 matrix from equation (5). Depending on the number of
firms involved in the takeover, we can sometimes obtain solutions for all the variables in question,
thereby enabling us to determine stand-alone values, synergies, and overpayments. In the following three
subsections, we analyze the categories separately to determine the takeover situations where we can
disentangle either the total value change in the acquisition or the total value change in the acquirer's
market valuation.
A. Information Extraction in Category I
In this category, we know in advance (at time 2) that one of the bidders will take over the target at
time 3. We can further divide the takeovers in this category by the number of bidders.
A.1 N=1
This is a trivial case where we have a sole bidder that will acquire the target with
complete certainty. In this case we cannot isolate any of the total value changes as T2 = OA(AA) and A2 =
AA.8 Thus, we cannot solve for information effects, overpayment, or synergies since we cannot observe
(or solve for) AN and TN.
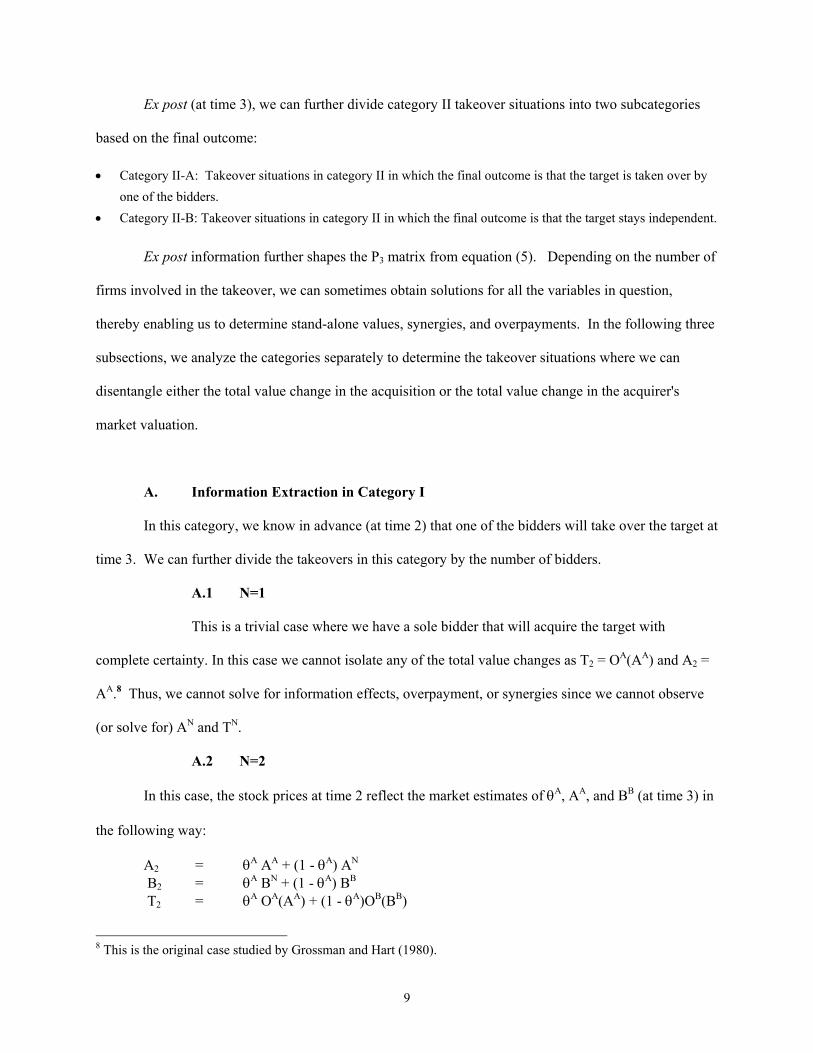
A.2 N=2
In this case, the stock prices at time 2 reflect the market estimates of θA, AA, and BB (at time 3) in
the following way:
A2 = θA AA + (1 - θA) AN B2 = θA BN + (1 - θA) BB T2 = θA OA(AA) + (1 - θA)OB(BB)
8 This is the original case studied by Grossman and Hart (1980).
10
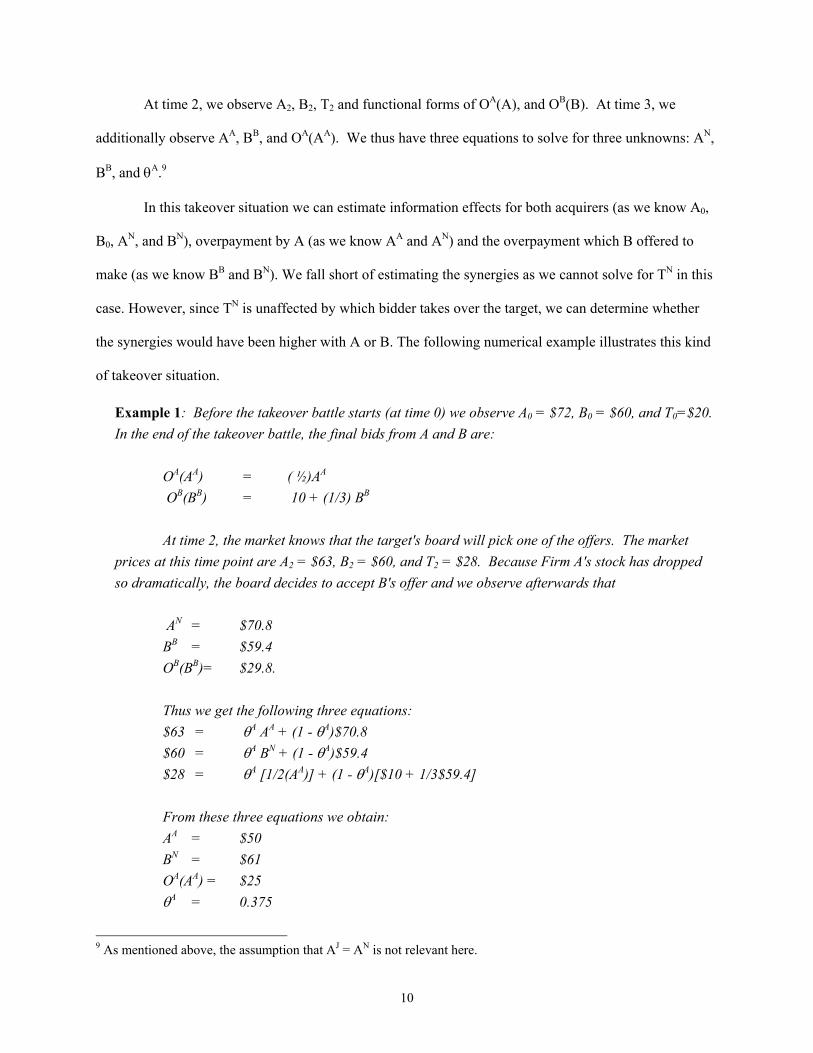
At time 2, we observe A2, B2, T2 and functional forms of OA(A), and OB(B). At time 3, we
additionally observe AA, BB, and OA(AA). We thus have three equations to solve for three unknowns: AN,
BB, and θA.9
In this takeover situation we can estimate information effects for both acquirers (as we know A0,
B0, AN, and BN), overpayment by A (as we know AA and AN) and the overpayment which B offered to
make (as we know BB and BN). We fall short of estimating the synergies as we cannot solve for TN in this
case. However, since TN is unaffected by which bidder takes over the target, we can determine whether
the synergies would have been higher with A or B. The following numerical example illustrates this kind
of takeover situation.
Example 1: Before the takeover battle starts (at time 0) we observe A0 = $72, B0 = $60, and T0=$20. In the end of the takeover battle, the final bids from A and B are:
OA(AA) = ( ½)AA OB(BB) = 10 + (1/3) BB
At time 2, the market knows that the target's board will pick one of the offers. The market
prices at this time point are A2 = $63, B2 = $60, and T2 = $28. Because Firm A's stock has dropped so dramatically, the board decides to accept B's offer and we observe afterwards that
AN = $70.8 BB = $59.4 OB(BB)= $29.8. Thus we get the following three equations: $63 = θA AA + (1 - θA)$70.8 $60 = θA BN + (1 - θA)$59.4 $28 = θA [1/2(AA)] + (1 - θA)[$10 + 1/3$59.4] From these three equations we obtain: AA = $50 BN = $61 OA(AA) = $25 θA = 0.375
9 As mentioned above, the assumption that AJ = AN is not relevant here.
11
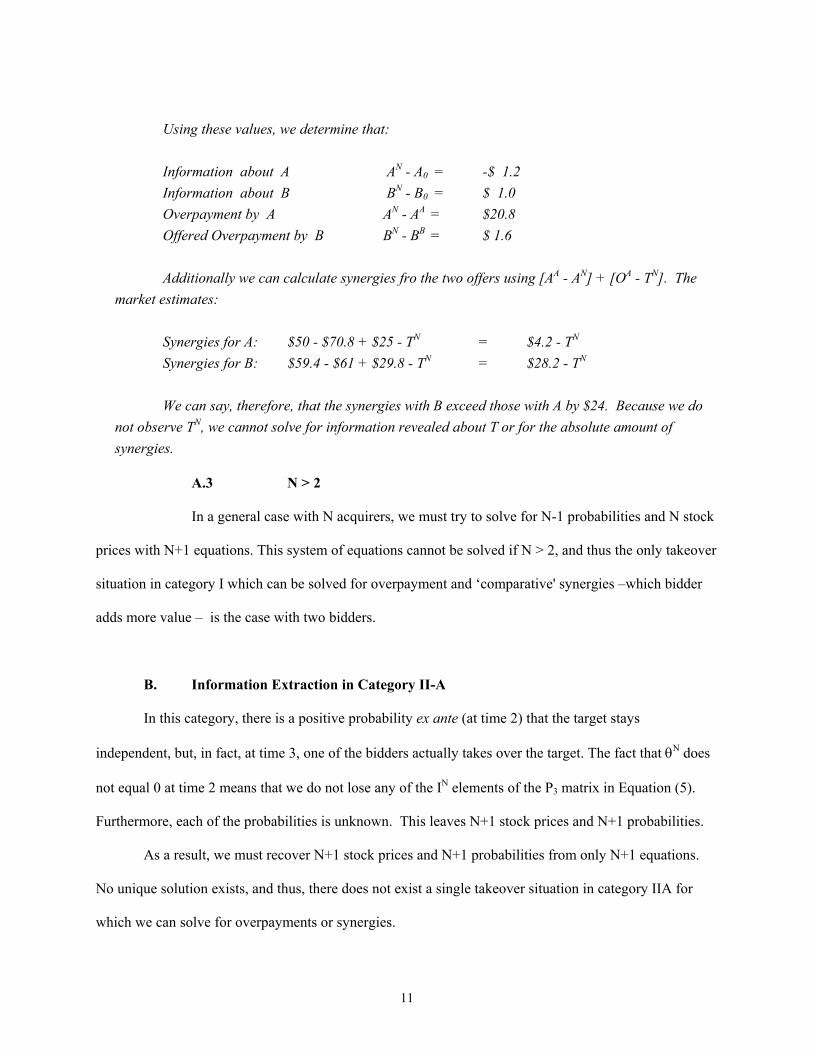
Using these values, we determine that:
Information about A AN - A0 = -$ 1.2 Information about B BN - B0 = $ 1.0 Overpayment by A AN - AA = $20.8 Offered Overpayment by B BN - BB = $ 1.6 Additionally we can calculate synergies fro the two offers using [AA - AN] + [OA - TN]. The
market estimates: Synergies for A: $50 - $70.8 + $25 - TN = $4.2 - TN Synergies for B: $59.4 - $61 + $29.8 - TN = $28.2 - TN We can say, therefore, that the synergies with B exceed those with A by $24. Because we do
not observe TN, we cannot solve for information revealed about T or for the absolute amount of synergies.
A.3 N > 2
In a general case with N acquirers, we must try to solve for N-1 probabilities and N stock
prices with N+1 equations. This system of equations cannot be solved if N > 2, and thus the only takeover
situation in category I which can be solved for overpayment and ‘comparative' synergies –which bidder
adds more value – is the case with two bidders.
B. Information Extraction in Category II-A
In this category, there is a positive probability ex ante (at time 2) that the target stays
independent, but, in fact, at time 3, one of the bidders actually takes over the target. The fact that θN does
not equal 0 at time 2 means that we do not lose any of the IN elements of the P3 matrix in Equation (5).
Furthermore, each of the probabilities is unknown. This leaves N+1 stock prices and N+1 probabilities.
As a result, we must recover N+1 stock prices and N+1 probabilities from only N+1 equations.
No unique solution exists, and thus, there does not exist a single takeover situation in category IIA for
which we can solve for overpayments or synergies.

12
C. Information Extraction in Category II-B
In this category, there exists a positive probability at time 2 that the target stays independent; at
time 3, we learn that the takeover attempt fails. It is useful again to divide takeover situations in this
category based on the number of bidders.
C.1 N = 1
At time 2, with only one bidder we have two equations. Because only one bidder is involved, a
single probability is sufficient to describe the set of outcomes that can arise at time 3. Thus, stock prices
satisfy:
A2 = θA AA + (1 - θA)AN T2 = θA OA(AA) + (1 - θA)TN
At time 2, we observe A2, T2, and the functional form of OA. At time 3, we additionally observe
AN and TN. Thus, we have two equations and two unknowns: AA and θA. Assuming that AA ≠AN, we can
use the first equation to obtain θA. With this, we can use the second equation to solve for AA. It is worth
stressing that this analysis requires the assumption that the expectation of AN at time 2 is equal to AN at
time 3. We discuss the validity of this assumption in section II.D.
In this takeover situation, we can estimate information effects for both the bidder and the target,
the proposed overpayment by A, and the synergies that would have happened had the merger occurred.
The following numerical example illustrates this type of takeover situation.
Example 2: Before the takeover battle starts (at time 0), we observe A0 = 50, and T0 = $19. Firm A makes a final bid: OA(AA) = $10 + 1/3(AA). At time 2, the market knows that either the bid will be accepted by the board or the bid will be rejected and the takeover contest will be over. The market prices are A2 = $48 and T2 = $24. The bid fails (because of a takeover defense or anti-trust challenge) and the contest is over. The new prices in the market are AN = $49 and TN = $21.
We solve for AA = $47.4 and thus OA(AA) = $25.8. The following information is revealed: Information about A AN - A0 = -$1 Information about T TN - T0 = $2 Offered Overpayment by A AN - AA = $1.6 Proposed Synergies [AA - AN] + [OA(AA) - TN] = $3.2
13
C.2 N > 1
The case of more than one firm in category IIB is similar to that of category IIA with more than
two firms. In general, with N acquirers we must find N stock prices and N probabilities with only N+1
equations. This system is under-identified, and thus the only takeover situation in category IIB that can be
solved for synergies and overpayments is the case of a single bidder.
D. Information assumptions
In this section, we discuss the extent to which it is likely that the information assumptions in our
analysis are met in practice. The analysis has (at least) two important and nontrivial information
requirements. First, the analysis assumes that time 3 is a discrete time or event. In other words, there is a
clear date at which (1) the market knows the takeover will be consummated for Category I acquisitions;
and (2) the market knows the takeover will not occur for Category II-B acquisitions. Second, the analysis
assumes that the market does not gain new information about the underlying values of the bidders,
targets, and synergies from time 2 to time 3. This means that we assume that the actual time 3 realized
values of the bidders and targets are the values that the market expected at time 2.10
The first assumption that time 3 is a discrete date is unlikely to be appropriate for most Category
II-B acquisitions. Even if a target announces that an acquisition is out of the question or if a bidder
announces that it is no longer pursuing the target, the market may still put a non-zero probability on the
likelihood that the target will be taken over. The market may believe there is some chance the bidder will
reconsider and make another offer, or the market may believe that there is some chance another bidder
will appear. Strongly consistent with this, Bradley, Desai and Kim (1983) show that targets of
unsuccessful bids decline in value for some period after the bid is withdrawn.
The first assumption of a discrete date for time 3 is more appropriate for Category I acquisitions,
particularly in those instances where the target has put itself up for sale.
10 The analysis also implicitly assumes that the stock prices reflect investors’ expectations rather than mechanical or behavioural rules of arbitrageurs or other market participants.
14
The second assumption also may be violated for both Category I and Category II-B acquisitions.
For example, the withdrawal or defeat of a takeover bid may convey information about the bidder and the
target, changing the values of AN and TN. As a result, the expectation of AN (or TN) at time 2 may not
equal the realization of AN (or TN) at time 3.
Our analysis in the previous sections showed that there are only two types of takeover situations
in which it is theoretically possible to extract information on synergies and overpayments from stock
prices for a particular takeover contest. The discussion in this section suggests that the problem is more
difficult than this. Even in situations in which it is theoretically possible, it may not be practically
possible to extract the information because the necessary assumptions do not hold. In fact, we think there
are very few Category II-B acquisitions, if any, which satisfy the assumptions that the withdrawal or
defeat of the takeover (time 3) is a discrete date and that such a withdrawal does not release any new
information about the acquirer or target.
While there are likely to be few Category I contests with exactly two bidders, a discrete
consummation date, and no new information about the participants, we believe that such contests do
occur from time to time. In the next two sections, we describe the Paramount - Viacom - QVC takeover
contest.11 We argue that this contest corresponds as closely as possible to our theoretical category I
contest with 2 bidders. This contest is particularly appropriate because it ended with a court-mandated
auction that involved two bidders – Viacom and QVC. The auction process had a well-defined end point
at which final bids were due, corresponding to time 2. At time 2, it also was virtually certain that
Paramount would be sold to one of the two bidders. Consistent with our first assumption, the process also
had a well-defined end point at which the winner would be declared, corresponding to time 3.
It is still uncertain whether the second assumption is satisfied. Consistent with the second
assumption, it is plausible that the market did not gain any new information about the underlying values
of the bidders, targets, and synergies from time 2 to time 3. The contest had been going on for almost
five months at the time final bids were due (time 2). Thus, while there are aspects of the contest that are

15
not ideal, particularly the complexity of the Viacom offer, it is close to ideal in corresponding closely to a
Category I contest with 2 bidders.
If these assumptions hold, there is still one potential concern. If no information changed from
time 2 to time 3, and the acquisition was certain to occur, why wasn’t the winner already determined at
time 2? In other words, why didn’t arbitrage activity drive stock prices at time 2 to equal the prices at
time 3? There are at least three possible responses to this.
One explanation relies on differences in information among shareholders. If some shareholders
are more informed than others, the less informed shareholders will need to use share prices to infer the
information held by the more informed. Bebchuk and Hart (2001) analyze precisely this situation in the
context of a control contest. Frictions or fixed costs in becoming informed or in inferring the information
could result in share prices not adjusting instantaneously. (See Mitchell, Pulvino and Stafford (2001)).
A second explanation is that both bids were valued at roughly the same value making it very
difficult to determine the winner at time 2.
A third explanation is that shareholders believed it was possible that one of the bidders would
withdraw leaving the other bidder the winner, but that it was almost a zero probability event that both
bidders would withdraw at the same time.
III. The Paramount - Viacom - QVC Takeover Contest
We apply the analytical apparatus developed above to the Paramount acquisition contest that
began in summer of 1993 and culminated in a takeover auction in February, 1994.12 This contest
corresponds closely to category I of section 2 for which it is possible to estimate overpayments and
relative synergies.
Paramount, Viacom, and QVC are familiar names in the motion picture and cable television
businesses. At the time of the contest, Paramount produced and distributed entertainment products,
11 The Conrail contest between Norfolk Southern and CSX would be another possible example.
16
including motion picture films, home movies, and television programming. The “Star Trek” television
and movie series was one of Paramount’s most valuable properties. Martin Davis was Paramount’s CEO
at the time of the contest. Viacom operated a number of entertainment and communications businesses
including several cable television networks: MTV, VH-1, Nickelodeon, The Movie Channel, Comedy
Central, Lifetime, FLIX, and the All News Channel. Viacom was majority owned and controlled by its
chairman and CEO, Sumner Redstone. QVC, the smallest of the three companies at the time of the
contest, operated the nation's largest home-shopping television network. QVC’s CEO was Barry Diller
who had formerly been a senior executive at Paramount and at Fox where he launched the Fox television
network. Diller had a strong reputation in the television and movie industries.
Viacom made a friendly takeover offer for Paramount on September 12, 1993. Paramount’s
board accepted the offer and agreed to a substantial lock-up option and termination fee. Paramount’s
board also agreed to lift Paramount’s poison pill for the transaction. QVC followed one week after
Viacom’s offer with a hostile tender offer. The tender offer did not have the support of Paramount’s
board and, therefore, was conditional on the removal of Paramount’s poison pill. A lengthy battle ensued
during which both firms increased their bids for Paramount.
Because Paramount’s board refused to consider QVC’s offer (and remove the poison pill), QVC
sued Paramount and Viacom countersued to protect its transaction. Ultimately, the Delaware Chancery
Court ruled in favor of QVC. The court required Paramount’s board to consider all offers. Paramount's
board responded by conducting an auction for control of the company. In the end, Viacom won the
auction.
Our analysis shows that Viacom dramatically overpaid for Paramount. In fact, based on the
downward spiral of QVC's and Viacom's stock prices, the market consensus was that both firms were
overpaying. Any would-be synergies between Viacom or QVC and Paramount were dwarfed by this
downward revision in Viacom and QVC. In spite of the fact that both firms overbid, Viacom so overpaid
12 This section is based on Kaplan (1994a), Kaplan (1994b), Paramount Communications 13E3 (May 25, 1994), and the opinion of the Delaware Court of Chancery (1993).
17
for Paramount – by roughly $1.5 billion - that its offer prevailed. In the rest of this section we describe
these events in greater detail and study the stock price movements surrounding the merger
announcements and subsequent developments.
A. Viacom and Paramount Agree to a Combination
On September 12, 1993, the board of directors of Paramount Communications approved the
following transaction. For each Paramount share, Viacom would pay (i) $9.10 in cash, (ii) 0.1 shares of
Viacom Class A voting common stock, and (iii) 0.9 shares of Viacom Class B non-voting common stock.
This consideration was valued at $69.14 per share based on closing stock prices on September 10.
According to the terms of the agreement, Paramount’s CEO, Martin Davis, would manage the combined
entity as CEO, but Viacom’s CEO, Sumner Redstone, would maintain control of roughly 70% of the
voting shares.
At the beginning of the week before the announcement, (on September 7), Paramount stock
traded at $55.875 per share. From that point, Paramount stock began to rise, reaching $61.125 on
September 10 (the Friday before the announcement) and $64.50 on September 13 (the Monday after the
announcement). The market reacted unfavorably to Viacom. From September 7 to 13, Viacom Class A
stock fell from $66.125 per share to $64.125. Viacom Class B stock, to which no voting rights were
attached, declined from $59.25 to $56.75 over the same period. On Tuesday, September 14, the Class A
and B shares declined again, to $61.50 and $55.375 per share, respectively. Paramount declined to
$63.125. The S&P 500 was essentially unchanged over the same week.
The share price movements imply an increase in Paramount’s value of roughly $1 billion (120
million shares outstanding) and a decline in Viacom’s value of $0.5 billion (also 120 million A and B
shares outstanding). The drop in Viacom's market value implies that the market had an overall negative
evaluation of (1) the price Viacom was paying and (2) the new information about Viacom from the bid.
The overall gain from the transaction announcement of $0.5 billion net gain reflects the sum of synergies,
overpayments, and new information about stand-alone values.
18
As part of the offer, Paramount granted Viacom an option to purchase 23.7 million Paramount
shares at $69.14 per share and agreed to pay a $100 million termination fee if any of three contingencies
arose: (a) Paramount terminated the agreement because of a competing bid; (b) Paramount's shareholders
did not approve the transaction; or (c) Paramount's Board recommended a competing bid. Furthermore, if
the option were exercised, its strike price could be paid with a combination of cash (for the par value of
the stock, or $1 per share) and senior subordinated notes (for the remainder).13
B. QVC Enters
On September 20, QVC launched a hostile bid for Paramount. In a letter to Paramount, QVC
proposed a business combination of Paramount and QVC under which each outstanding share of
Paramount would receive 0.893 of a share of QVC and $30 in cash. Before the offer, QVC closed at
$59.50 per share implying a value of $83.13 for the offer. QVC's bid had the support of Tele-
Communications Inc. (TCI), the country's largest cable television company. Davis and Paramount
responded that Viacom was a better fit, but that Paramount would potentially consider a QVC offer.
The market's reaction to this announcement was negative; QVC’s stock price dropped $3.50 from
$59.50 on Friday, September 17, to $56 on Monday, September 20. Going back to September 13 (or
September 7), the stock price drop was more severe: QVC traded at $62.75 ($63) one week earlier (and
one week before the announcement of the Viacom-Paramount agreement). At $56 per share, the offer
from QVC was valued at $80 per share ($30 cash + .893($56)). This substantially exceeded the value of
the Viacom offer ($63 at Viacom share prices on September 20).
C. The Takeover Battle
On September 23, Viacom filed an anti-trust suit against QVC and TCI. Four days later, Davis
told his board that acceptance of the QVC offer would trigger Viacom's termination fee and lock-up
13 A $100 million termination fee amounts to $0.83 per share. The option had the effect of requiring a rival bidder to pay Viacom $0.20 per share for every $1 it paid above $69.14 per share.
19
option. Nevertheless, the board decided to consider the QVC offer, but only if QVC could provide
evidence of financing.14
By October 21, Paramount still had failed to enter into negotiations with QVC. Partly in response
to Paramount's inaction, QVC, along with Paramount shareholders, filed a class action suit in the
Delaware Court of Chancery on October 21, seeking to prevent the proposed merger between Paramount
and Viacom and, in particular, to invalidate Viacom's option to purchase 23.7 million Paramount shares.
The plea also asked the court to prohibit Paramount from using its stockholder rights plan (poison pill) to
oppose QVC's bid.
On the same day, QVC publicly announced that it would begin a tender offer for 51% of
Paramount’s shares at $80 per share and, if successful, would propose a second-step merger in which the
remaining shares would be converted into QVC common stock. This offer was contingent on the
invalidation of both the poison pill and the lock-up option. Viacom responded by increasing its offer to
the same $80 per share of Paramount. Viacom also began a tender offer for 51% of the Paramount shares
outstanding at a price of $80 in cash per share following which, in a second-step merger, holders of the
remaining 49% of Paramount shares would receive a portfolio of Viacom securities, including common
stock, preferred stock, and warrants.
Table 2 catalogs the actions taken by Viacom and QVC as each tried to outdo one another's
takeover proposals. This process continued throughout the autumn of 1993, until the Delaware Chancery
Court ruled in favor of QVC on November 24. The court's decision refined the standards for injunctive
relief that were relevant in merger transactions. Before this ruling, several potentially conflicting
precedents offered alternative views as to whether Paramount faced enhanced fiduciary duty in this
situation. The court ultimately ruled that the events surrounding the Viacom merger triggered a
heightened standard of duty, one that Paramount had not met. As a result, the agreed-upon acquisition by
Viacom was blocked. The court ruling also barred Paramount from using its poison pill defense against
14 This chronology is based on accounts in the Paramount Communications Proxy Statement, dated June 6, 1994, and the March 1994 Corporate Control Alert (published by American Lawyer Media, LLP.)

20
QVC and struck down Paramount's stock option lockup. The ruling did uphold the $100 million
termination fee payable to Viacom if the merger were to fail.
The courts' ruling increased the probability that QVC would be the winning bidder. QVC's stock
price fell from $48.875 to $47.750. At the same time, Viacom's A (B) shares rose from $47.750 to
$50.625 ($41.75 to $44.50). Paramount's stock price also increased from $76.25 to $80.125. These
reactions suggest that the market expected both QVC and Viacom to overpay if they ultimately prevailed.
On December 9, 1993, the Delaware Supreme Court upheld the Chancery Court ruling,
effectively mandating that Paramount's board seriously consider all offers. As a result, on December 14,
Paramount's board dropped the merger agreement with Viacom and agreed to hold an auction for control
of Paramount.15
Under the terms of the auction, Paramount asked each bidder to submit its best offer by 4:00 pm,
December 20. Both bidders would begin simultaneous tender offers. Although Paramount would
endorse one of the two bids, the shareholders' tender decisions ultimately would decide the winner. The
bidders would be allowed to revise their offers any time within ten business days. The auction would end
when one bidder obtained tenders of more than 51% of Paramount's shares. Paramount also required that
the winning offer remain open for 10 days after being declared the winner in the initial tender round, so
that shares tendered to the losing bidder could be withdrawn and tendered to the winner.16 Paramount set
February 1 as the absolute final deadline for bids and counterbids -- after this date, the bidders would be
allowed no further changes to their bids.
On December 20, Viacom and QVC each submitted acquisition proposals to the Paramount
Board. These are described in Table 2. A day later, Paramount's Board received the written opinion of
Lazard Freres, stating that QVC's current plan was fair to Paramount stockholders and was superior to
15 The Chancery Court opinion did not force Paramount to undertake an auction. It merely held Paramount’s board to a higher standard of scrutiny when considering a merger offer. They would not be in breach of their duties as long as they made a merger decision based on evidence that allowed them to judge all offers on equal footing. 16 Wall Street Journal, December 15, 1993.
21
Viacom's current offer. Based on this opinion, Paramount signed a merger agreement with QVC.
Nevertheless, the bidding continued.
On January 7, 1994, Viacom announced a $9.4 billion merger with Blockbuster Entertainment,
and consequently, a new bid for Paramount. The market's reaction to these events clearly reflected the
consensus that both firms were overpaying for Paramount. The probability of Viacom winning control
increased; Viacom A shares fell from $47 per share to $46 1/8 while B shares fell from $41 to $38.25.
Meanwhile the probability of QVC winning declined; QVC shares increased by $1 1/8 to $40.625. At the
same time, Paramount stock price rose $.75 per share.
D. The Final Bids
On January 12, Lazard Freres issued an opinion that QVC's offer was both fair to Paramount
stockholders and superior to Viacom's offer. On January 18, Viacom again increased the cash portion of
its bid, and amended the terms of the second-step merger to provide for the exchange of (i) 0.93065
shares of Viacom Class B Common Stock, (ii) 0.30408 shares of Viacom Merger Preferred Stock, (iii)
0.93065 Contingent Valuation Rights (CVRs) 17, and (iv) 0.5 Viacom Three-Year Warrants for each
Paramount share remaining after consummation of the offer. On January 21, Lazard Freres opined that
both the QVC and Viacom offers were fair, but that the Viacom offer was marginally superior to the QVC
offer.
Finally, on February 1, both Viacom and QVC submitted their final proposals for Paramount.
Table 3 outlines these proposals. Viacom offered $107 per share in cash for 50.1% of Paramount's
shares, and increased the offer for each remaining Paramount share in a second-step merger to (i) 0.93065
shares of Viacom Class B Common Stock, (ii) 0.93065 CVRs, (iii) 0.5 Viacom Three-Year Warrants, (iv)
0.3 Viacom Five-Year Warrants and (v) $17.50 in principal amount of Viacom Merger Debentures with
an 8% coupon and 12 year maturity if the Blockbuster-Viacom merger was approved. If the merger was
17 The Contingent Valuation Rights (CVRs) are described in greater detail in Appendix A.
22
not approved, the debentures would be replaced with $17.50 face value of Viacom preferred stock with a
5% dividend yield.
Meanwhile, QVC increased its offer to $104 per share in cash for 50.1% of Paramount's shares
and (i) 1.2361 shares of QVC Common Stock, (ii) 0.2386 shares of New QVC Merger Preferred Stock,
and (iii) 0.32 ten-year warrants for each remaining Paramount share in a second-step merger.18
On February 15, Viacom was declared the winner when over 50% of Paramount’s shares were
tendered to Viacom’s offer. By that time, Viacom B (A) shares had declined to $28.00 ($34.125) per
share; QVC had risen to $50.25 per share; and Paramount traded at $77.00 per share.
IV. Determining Overpayment and Relative Synergy in the Paramount Contest19
The structure of Paramount’s auction corresponds closely to our Category I takeover with two
bidders. The dates from February 2 to February 14 represent potential time 2’s in our analysis. February
1 was the last date that the bidders could revise their bids. The deadline was after the market close.
Therefore, beginning on February 2: final bids were set; investors were arguably virtually certain that one
of the two bidders would acquire Paramount; but investors were uncertain which bidder would prevail.
All of the other dates between February 2 and February 15 also are consistent with time 2 in our analysis.
In this section, we attempt to estimate the degree to which Viacom overpaid, and determine whether
Viacom or QVC had greater synergies with Paramount.
Using the methodology of section 3, the stock prices for the target and the two bidders as of
February 2 (or the dates from February 2 to February 14) yield a system of three equations in five
unknowns. The five unknowns are: (1) the probability of Viacom's success, θA; (2) the value of Viacom if
it wins, AA; (3) if it loses, AN; (4) the value of QVC if it wins, BB; and (5) the value of QVC if it loses,
BN. The value of Viacom if it wins, and QVC if it loses are revealed by the outcome of the auction (as
18 In each case, individual securities within the package could be sold separately. 19 In the analyses in this section, we do not include adjustments for market movements because the S&P 500 was relatively stable over the first two weeks of February 1994 as well as from September 7, 1993 to February 15, 1994. Including such adjustments would not affect any of our results.

23
$28.00 and $50.25). We use these actual market prices as proxies of the market's expectation before the
close of the auction to reduce the system to three equations and three unknowns: θA, AN, BB.
We begin by reproducing the equations from section 3.1.2:
A2 = θA AA + (1 - θA) AN B2 = θA BN + (1 - θA) BB T2 = θA OA(AA) + (1 - θA)OB(BB)
A. Valuing the Viacom and QVC offers
The analysis is complicated by the fact that the offers Viacom and QVC gave to Paramount are
non-linear functions of the Viacom and QVC stock prices conditional on their winning the contest. We
necessarily begin, therefore, by valuing those offers, OA(AA) and OB(BB).
Viacom's final offer contained a mix of three-year warrants, five-year warrants, debt or preferred,
cash, equity, and CVRs. Based on the closing price of Viacom’s B shares on February 3, Lazard Freres’
valued the offer at $83.31 – $53.61 in cash, $8.41 in debt, $15.79 in common stock, and $5.49 in warrant
and CVR value.20 This compares to the initial offer in September of $69.14 of which only $9.10 was in
cash. The analyses are presented in table 4.
QVC's consisted of a package of cash, preferred stock, QVC common stock and warrants. Based
on the closing price of QVC’s shares on February 3, Lazard Freres’ valued the offer at $86.72 – $52.10 in
cash, $3.76 in preferred stock, $28.30 in common stock, and $2.55 in warrant value.21 This compares to
the initial offer in September of $80.01 of which $30.00 was in cash. The analyses also are presented in
table 4.
The Lazard analyses are inaccurate in two ways. First, they rely on the Viacom and QVC stock
prices that prevailed on February 3 (and in September for the initial offer), rather than their respective
stock prices conditional on winning. As Lazard Freres’ noted, the use of the prevailing stock prices was
inappropriate, because those prices partially reflected the possibility that either bidder would not win the
20 The warrant and CVR values are based on volatilities of 35% and 45%, respectively. This analysis also assumes the Blockbuster merger is approved. Lazard estimated a value of $81.49 if the Blockbuster merger was not approved. 21 The warrant value is based on a volatility of 25%.

24
contest. According to Lazard Freres, “the more relevant comparison is of the value of the winner’s bid
versus the value at which the loser’s bid would theoretically have traded had it prevailed … More
importantly, with the bidding process that has been established, Paramount’s shareholders (who are
largely sophisticated institutions, including arbitragers) continue to have the ability to choose between the
two proposals based on their views of value.”22
Second, Lazard Freres valued both the first and second stages of the offers as if they were going
to occur immediately. In fact, the cash portion of the winning offer would not be paid until the tender
offer expired. This was to occur two weeks after a winner was declared. The non-common stock-based,
non-cash portion of the winning offer would not be paid until shareholders approved the offer. This
would be expected to occur three to four months after a winner was declared.23
In our calculations, we adjust for the two inaccuracies. First, we treat the offer values for each
company as a function of the value of the bidder’s stock conditional on winning, AA and BB. Second, we
discount the cash portion by 1% and the non-common stock-based, non-cash portion by 4% to reflect the
fact that the shareholders would not receive the proceeds of the winning offer immediately. This assumes
a discount rate of 1% per month. Our results are not sensitive to this assumption.
B. Inferring Unobserved Stock Prices
We can now solve explicitly for overpayment and relative synergies. As noted earlier, we assume
that the actual values of Viacom and QVC on February 15 (time 3) when Viacom was declared the
winner, AA ($28) and BN ($50.25), are the values the market expected from February 2 until February 14
(all potential time 2’s). Similarly, we assume that the value of Viacom’s offer conditional on Viacom
winning, OA(AA), equals Paramount’s value of $77.00 on February 15.
For February 2, we solve the following systems of equations for θA, AN, and BB : 24
22 Paramount Communications 13E3, May 25, 1994. 23 In fact, the cash portion was paid on March 1, 1994, and the non-cash portion was paid on July 6, 1994. 24 In this analysis, we use the volatilities used by Lazard Freres to value the warrants in the QVC and Viacom offers. We have repeated the analysis across a wide range of volatility assumptions. The results are qualitatively similar.
25
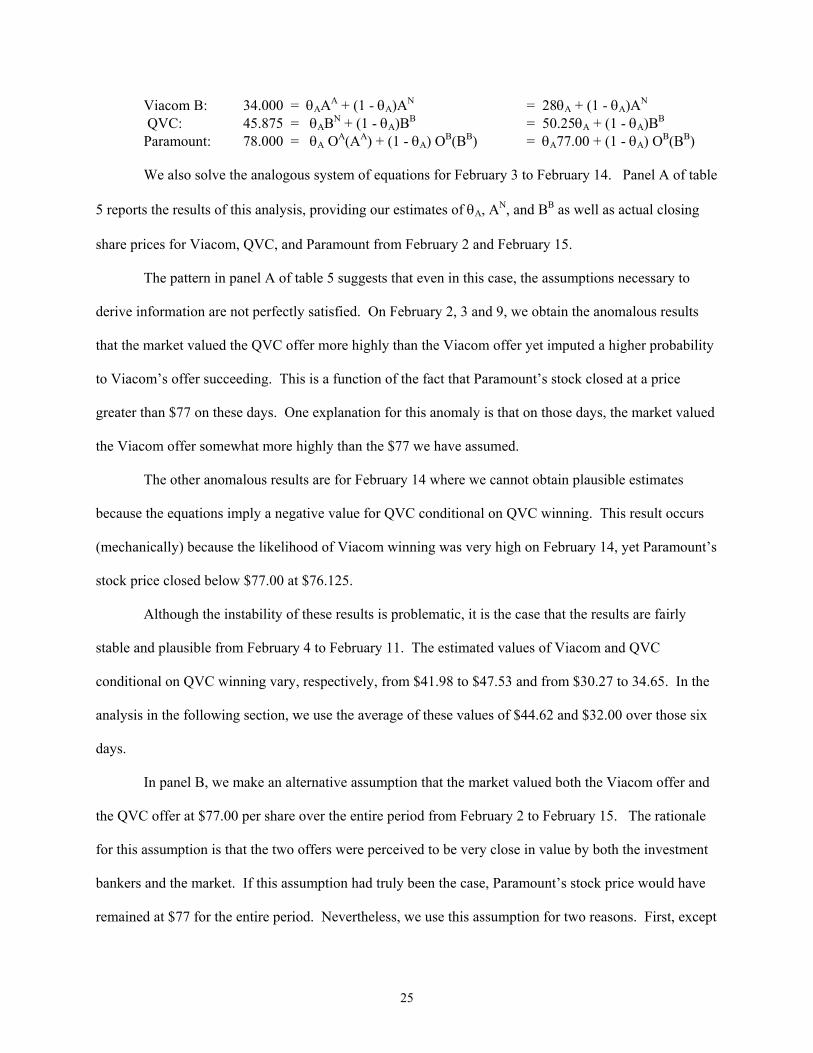
Viacom B: 34.000 = θAAA + (1 - θA)AN = 28θA + (1 - θA)AN QVC: 45.875 = θABN + (1 - θA)BB = 50.25θA + (1 - θA)BB Paramount: 78.000 = θA OA(AA) + (1 - θA) OB(BB) = θA77.00 + (1 - θA) OB(BB) We also solve the analogous system of equations for February 3 to February 14. Panel A of table
5 reports the results of this analysis, providing our estimates of θA, AN, and BB as well as actual closing
share prices for Viacom, QVC, and Paramount from February 2 and February 15.
The pattern in panel A of table 5 suggests that even in this case, the assumptions necessary to
derive information are not perfectly satisfied. On February 2, 3 and 9, we obtain the anomalous results
that the market valued the QVC offer more highly than the Viacom offer yet imputed a higher probability
to Viacom’s offer succeeding. This is a function of the fact that Paramount’s stock closed at a price
greater than $77 on these days. One explanation for this anomaly is that on those days, the market valued
the Viacom offer somewhat more highly than the $77 we have assumed.
The other anomalous results are for February 14 where we cannot obtain plausible estimates
because the equations imply a negative value for QVC conditional on QVC winning. This result occurs
(mechanically) because the likelihood of Viacom winning was very high on February 14, yet Paramount’s
stock price closed below $77.00 at $76.125.
Although the instability of these results is problematic, it is the case that the results are fairly
stable and plausible from February 4 to February 11. The estimated values of Viacom and QVC
conditional on QVC winning vary, respectively, from $41.98 to $47.53 and from $30.27 to 34.65. In the
analysis in the following section, we use the average of these values of $44.62 and $32.00 over those six
days.
In panel B, we make an alternative assumption that the market valued both the Viacom offer and
the QVC offer at $77.00 per share over the entire period from February 2 to February 15. The rationale
for this assumption is that the two offers were perceived to be very close in value by both the investment
bankers and the market. If this assumption had truly been the case, Paramount’s stock price would have
remained at $77 for the entire period. Nevertheless, we use this assumption for two reasons. First, except

26
for February 2, 3, and 14, Paramount’s actual closing price is within $0.50 of $77.00. Second, the
resulting probabilities and estimated prices are smoother and non-anomalous from February 4 onward.
Under the second set of assumptions, panel B estimates the value of QVC conditional on QVC
winning as $33.07. The estimated probability that Viacom would win increases monotonically from
February 4 onward. The estimated value of Viacom conditional on QVC winning starts above $50 on
February 2 and 3, declines to the low $40 range from February 4 to February 8, and then stays in the mid-
$40 range from February 9 to February 14. In the analysis that follows, we use the average Viacom value
from February 4 to February 14 of $44.13.
In sum, the results in table 5 are mixed. The patterns are not consistent with the assumptions
needed to make a definitive inference of overpayment and relative synergies. On the other hand, the
estimates of the values of Viacom and QVC conditional on QVC winning are qualitatively similar over
many days and under different assumptions. In the following section, we utilize these estimates to infer
overpayment and relative synergies, acknowledging that they are potentially imperfect.
C. Solving for Overpayment and Relative Synergies
We can now use equations 1A – 1E to estimate the values of overpayment, relative synergy, and
new information. Table 6 reports our results. Because they are qualitatively identical for each of the two
sets of assumptions, we will discuss the results in panel A. Based on the results and assumptions in panel
A of table 5, and the average values from February 4 to February 11, we assume: AN, the value of Viacom
B if QVC wins, equal to $44.62; AA, the value of Viacom B if Viacom wins, equals $28; BN, the value of
QVC if Viacom wins, equals $50.25; and BB, the value of QVC if QVC wins, equals $32.
The analysis also requires an assumption concerning the value of Viacom A. Viacom A traded at
$34.25 on February 15, corresponding to the value of Viacom A if Viacom wins. This is 1.22 times the

27
value of Viacom B. To calculate the value of Viacom A if QVC wins, we multiply the estimate of
Viacom B if QVC wins of $44.62 to obtain $54.58.25
These estimates imply that both Viacom and QVC were willing to overpay by large amounts.
Viacom overpaid by more than $2.0 billion. Similarly, the estimates imply that QVC would also have
overpaid by a smaller, but still substantial $688 million.
Table 6 also shows that the market believed that the synergies of a QVC-Paramount combination
substantially exceeded those of the Viacom-Paramount combination that occurred. While it is not
possible to infer actual synergies, because we do not observe the stand-alone value of Paramount, TN, it is
possible to infer relative synergies. Table 6 reports that the expected QVC-Paramount synergies
exceeded those expected in the Viacom-Paramount merger by over $1.4 billion. Viacom won the
takeover contest because it was willing to overpay (relative to market expectations) by much more than
QVC was.
We can compare actual synergies only if we are willing to assume a standalone value for
Paramount. One possibility is to assume that the standalone value of Paramount did not change over the
course of the contest, remaining at the $55.875 per share Paramount traded at on September 7, 1993. This
seems plausible given that the shares of the four other most prominent companies in the industry – News
Corp., Time Warner, Turner Broadcasting, and Walt Disney – were relatively stable over this period,
increasing by an average of 2.4% from September 7 to February 15. If we include (the new information
revealed about) Viacom and QVC in the industry, the average return is –5.3% for the six companies from
September 7 to February 15. Under the assumption of no change in standalone value, the estimates imply
synergies of $0.34 billion with Viacom and $1.76 billion with QVC. It appears, therefore, that the market
assumed there were minor synergies to the Viacom combination and more substantial synergies to the
QVC combination.
25 This implied premium for the A shares of 22% exceeds the premium for the A shares before the takeover contest began and during most of the contest. Our results are qualitatively identical assuming the average premium during the contest of 11%.

28
Finally, table 6 reports the new information revealed about both firms through the course of the
takeover battle. Based on the stock prices on September 7, 1993, before the first takeover announcement,
the stand-alone value of QVC has fallen by $481 million. In comparison, Viacom’s stand-alone value
experienced a decline of more than $1.7 billion.26
D. Postscript
In the three years following the acquisition, Viacom’s stock price continued to perform poorly.
From February 15, 1994 to February 28, 1997, Viacom B increased in value by 24%. Over the same
period, the S&P increased by 71% and Viacom’s three primary competitors (Disney, News Corp. and
Time Warner) increased by 25%. These results do not indicate that the market reacted inaccurately and
do not support Redstone’s view that Viacom and Paramount had great synergies.
When we extend the analysis to five years after the acquisition (to February 28, 1999), Viacom
and Redstone do somewhat better. From February 15, 1994 to February 28, 1999, Viacom B increased in
value by 211%. Over that same period, the S&P increased by 160% and Viacom’s three primary
competitors increased by 141%. While these results are consistent with the market overestimating
Viacom’s overpayment and underestimating synergies, the industry returns still imply that Viacom
overpaid by almost $1 billion.27
E. Implications
We find evidence of a stunning overpayment of more than $2.0 billion for Viacom as well as
almost $0.7 billion for QVC. Sumner Redstone’s willingness to overpay is striking given his ownership
position in Viacom. Redstone owned 45.5 million of Viacom A shares and 46.6 million of Viacom B
shares. Before the Blockbuster transaction, these holdings represented, 85% and 69%, respectively, of the
26 If Paramount’s stand-alone value, like those of Viacom and QVC, fell over this period, then the actual synergies would be greater than those calculated in the previous paragraph. 27 This discounts Viacom’s stock price in February 1999 by the industry return of 141% to get a Viacom B value of $36.67 rather than $28.00. This is almost $8 less than the estimate of Viacom B without overpayment of $44.62.
29
two classes of stock. Overall, therefore, Redstone controlled 76% of Viacom’s cash flow rights and 85%
of Viacom’s voting rights (the B shares did not have any voting rights) when the takeover contest began.
In this section, we consider different explanations or theories to explain these results.
We believe our results have two possible (and not mutually exclusive) interpretations. The first
interpretation is that Redstone’s beliefs were very different from those of the market. This particular
contest and results are consistent with some of the arguments in Roll (1986). According to Roll (1986),
acquirers overpay because they “mistakenly convince themselves that the market does not reflect the full
economic value of the combined firm.” Heaton (2002) and Malmendier and Tate (2002) make similar
arguments in financing and investment contexts. Redstone’s actions as well as Diller’s are consistent
with this explanation. In Redstone’s case, overconfidence / hubris also might logically have followed
from the great success Viacom and he had enjoyed to that point. With a net worth of over $5 billion,
Redstone was one of the wealthiest men in the world. Redstone’s earlier acquisition of Viacom in a
leveraged buyout was the source of much of that wealth.
Roll’s (1986) hubris hypothesis assumes that managers are acting in what they believe are the
best interests of shareholders. It also is possible that managers obtain private, non-pecuniary benefits
from control and acquisitions that do not benefit shareholders. The second interpretation, therefore, is
that Redstone received large private (and non-pecuniary) benefits from the acquisition. Such managers
may knowingly overpay if the private benefits of doing so outweigh the pecuniary costs. Theoretically,
private benefit consumption decreases as managers own a larger share of a firm’s cash flows (or equity).
At some point, however, as management obtains effective voting control, managers may be able to
increase private benefit consumption.28 Morck, Shleifer, Vishny (1988) describe this tradeoff and find
evidence for it.
In the case of Paramount, Redstone’s behavior is at least consistent with the arguments in Fama
and Jensen (1983) and Morck et al. (1988). Redstone controlled a majority of the voting rights of Viacom
28 E.g., see Fama and Jensen (1983).
30
and, therefore, could choose to overpay if the private benefits were sufficient. Perhaps he wanted to be
the “king of all media.” It is worth emphasizing, however, that for private benefits to be the only
explanation, Redstone must have obtained over $1.5 billion in private or non-pecuniary benefits to justify
his bid (given that he controlled 76% of Viacom’s cash flow rights).
A third, but in this case, less convincing explanation is that given in Shleifer and Vishny (2001).
In their model, companies with overvalued stock make acquisitions with that stock. Because the market
does not completely recognize the overvaluation at the time of the acquisition, such bidders succeed in
making acquisitions with overvalued stock. In the medium and long run, the bidder stock price declines
as the market discovers the overvaluation.
Viacom’s and Redstone’s initial offer for Paramount is potentially consistent with the Shleifer
and Vishny (2001) theory. The Viacom stock in Viacom’s initial offer made up roughly 87% of the
initial $69.14 value for each Paramount share. At the time, Viacom enjoyed the highest market
capitalization to operating cash flow ratio of any of its competitors. (See Kaplan (1994a)). Complicating
this interpretation, however, is the fact that Viacom engaged in open market repurchases of B shares
throughout the summer of 1993 – the period before the initial offer.
As we have seen, the initial offer was not successful. Instead, the stock and warrants in Viacom’s
final and successful offer comprised less than 14% of the total $77 value for each Paramount share.
Furthermore, Viacom’s stock does not appear to have been particularly overvalued relative to Viacom’s
primary competitors over the ensuing three years nor relative to the entire market over the ensuing five
years. In other words, it does not appear that Viacom and Redstone succeeded in issuing overvalued
equity to pay for Paramount.
Finally, it is worth stressing that the results are not consistent with a classical agency or incentive
problem.29 Given Redstone’s large ownership stake in Viacom, it seems implausible that even greater
equity incentives would have caused him to change his behavior.
29 See Jensen and Meckling (1976).
31
Overall, then, the most compelling explanations involve some combination of overconfidence and
private benefits. Because the two are not mutually exclusive, it is not possible to distinguish between
them. It is possible to conclude, however, that our analysis indicates that the combination of
overconfidence and private benefits exceeded $1.5 billion.
V. Summary and Implications
This paper analyzes the amount of information that can be extracted from stock prices around
takeover contests. We think there are four important takeaways from the paper.
First, we provide a clear analytical framework to understand the information revealed around a
takeover announcement.
Second, we show that it is not possible in general to use target and bidder stock price movements
to infer the market's estimates of synergies, bidder overpayment, and changes in bidder and target values.
In two generic cases, however, we show that it is theoretically possible to use bidder and target stock
prices to obtain market estimates of overpayments and synergies. One occurs when a sole bidder mounts
an unsuccessful takeover attempt; the other occurs when the acquisition contest includes exactly two
bidders.
Even in those two generic cases where it is theoretically possible to use stock prices to extract
such information, it is practically very difficult to do so. In the case of a sole bidder who mounts an
unsuccessful takeover attempt, it is unlikely that there is a discrete date in which the probability of
takeover goes to zero; and if it can be identified, it is likely that new information is released on that date.
The case of a contest that includes exactly two bidders is more promising, but much less common. Given
the scarcity of appropriate acquisitions, therefore, large sample studies of stock price movements around
mergers will invariably be difficult to interpret.30
30 For some transactions, the use of exchange-traded stock options may be able to provide additional equations and information.

32
Third, we are able to analyze the Paramount contest involving exactly two bidders in which we
believe the assumptions necessary to extract information are reasonable. Our calculations suggest that the
market estimated that Viacom, the “winner" of the takeover battle, overpaid by more than $2 billion when
it agreed to purchase Paramount. This overpayment occurred despite the fact that Sumner Redstone, the
CEO of Viacom, owned roughly two-thirds of Viacom.
We view the results for Paramount and Viacom to provide strong direct evidence for
overconfidence or massive private benefits. The combination of overconfidence and private benefits
exceeded $1.5 billion. Equity ownership incentives do not solve the problem. This is a general and
important point. In finding such strong evidence of overconfidence / private benefits, we believe the
paper does suggest that studying such behavioral explanations is a fruitful avenue for future research.
Fourth, the empirical portion of our paper illuminates the theoretical work of Bebchuk and Hart
(2001) who analyze the benefits and shortcomings of various mechanisms for replacing incumbent
managers. As they point out, one of the benefits of tender offers is that they encourage the bidder to pass
along some of its private benefits to existing shareholders in order to tempt them to accept their offer.
Paramount's takeover auction did exactly this: it encouraged both bidders to increase the cash portions of
their offers, signaling to existing shareholders that theirs was the deal with greater synergies. In the two
weeks between the close of bidding and the declaration of the auction's winner, the market continually
reset prices of the two bidders as market participants sought to simultaneously determine the probability
of each firm winning, and consequently, other market participants' revised valuations of the bidders'
offers. Thus, our case illustrates a situation in which market participants face difficulty in determining
the value of an offer precisely because they do not know which firm will win the auction.
33
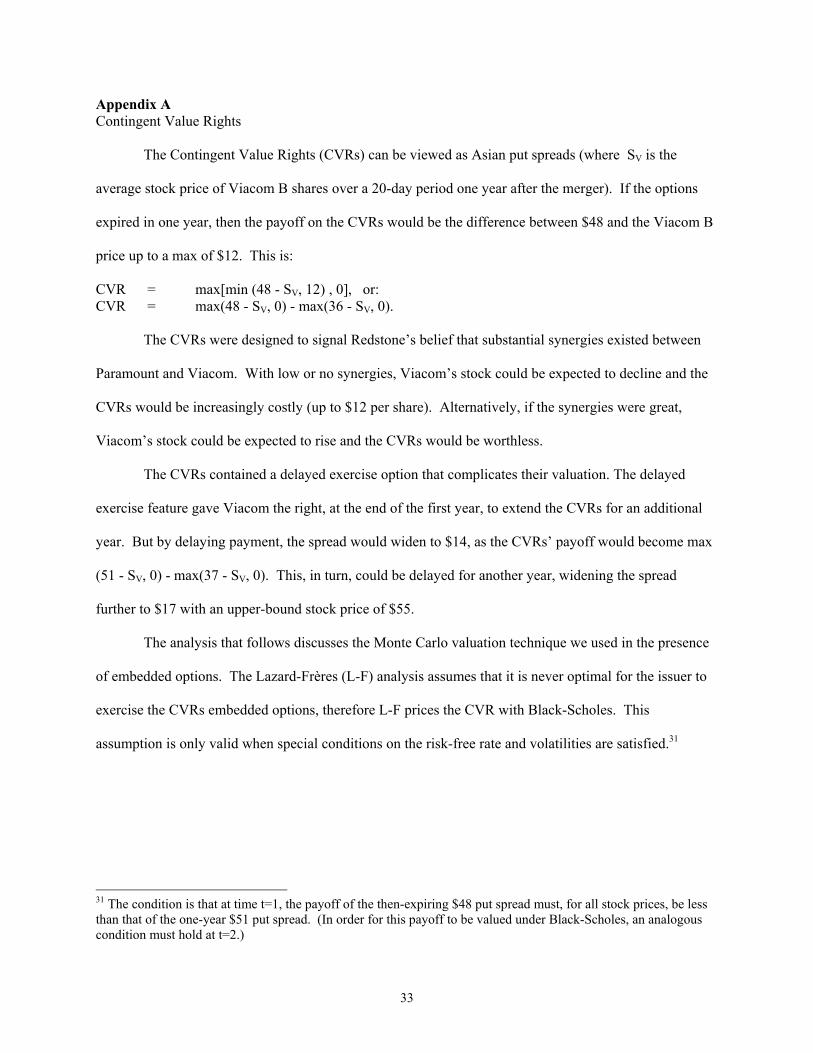
Appendix A Contingent Value Rights
The Contingent Value Rights (CVRs) can be viewed as Asian put spreads (where SV is the
average stock price of Viacom B shares over a 20-day period one year after the merger). If the options
expired in one year, then the payoff on the CVRs would be the difference between $48 and the Viacom B
price up to a max of $12. This is:
CVR = max[min (48 - SV, 12) , 0], or: CVR = max(48 - SV, 0) - max(36 - SV, 0).
The CVRs were designed to signal Redstone’s belief that substantial synergies existed between
Paramount and Viacom. With low or no synergies, Viacom’s stock could be expected to decline and the
CVRs would be increasingly costly (up to $12 per share). Alternatively, if the synergies were great,
Viacom’s stock could be expected to rise and the CVRs would be worthless.
The CVRs contained a delayed exercise option that complicates their valuation. The delayed
exercise feature gave Viacom the right, at the end of the first year, to extend the CVRs for an additional
year. But by delaying payment, the spread would widen to $14, as the CVRs’ payoff would become max
(51 - SV, 0) - max(37 - SV, 0). This, in turn, could be delayed for another year, widening the spread
further to $17 with an upper-bound stock price of $55.
The analysis that follows discusses the Monte Carlo valuation technique we used in the presence
of embedded options. The Lazard-Frères (L-F) analysis assumes that it is never optimal for the issuer to
exercise the CVRs embedded options, therefore L-F prices the CVR with Black-Scholes. This
assumption is only valid when special conditions on the risk-free rate and volatilities are satisfied.31
31 The condition is that at time t=1, the payoff of the then-expiring $48 put spread must, for all stock prices, be less than that of the one-year $51 put spread. (In order for this payoff to be valued under Black-Scholes, an analogous condition must hold at t=2.)

34
We price the CVR taking into account that for certain realized stock prices at t=1,2, it may be
optimal for the issuer to exercise the rollover feature.32 Thus, the set of payoffs that can arise under
certain contingencies can be written as follows:
Time Current Payoff Rollover t = 2 max(51-S2,0) - max(37-S2,0) E2(max(54-S3,0) - max(38-S3,0)) t = 1 max(48-S1,0) - max(36-S1,0) E1(max(51-S2,0) - max(37-S2,0)) t = 0 E0(max(48-S1,0) - max(36-S1,0)) -
To obtain a price for the CVRs, we proceed in three steps:
1. Using the current stock price, current risk-free rate, and historical volatility of Viacom, we simulate a distribution of future stock prices at t=2. Under this distribution, we calculate (pointwise) the payoffs to closing the position at t=2 or rolling over the CVR for an additional year. We then obtain the minimum of these two alternatives and discount this inner payoff envelope back to t=1 at the risk-free rate prevailing at t=1.
2. At t=1 we compare the payoffs to closing out the position to those described above. If it was
never optimal to exercise the embedded rollover option at t=2, then we compare the Black-Scholes price of a one-year, 14-pt. put spread at $54 to closing out a 12-pt. put spread immediately. As before, the inner payoff envelope is obtained.
3. The inner payoff envelope calculated at t=1 is discounted back to t=0, the initiation date of the
CVRs. The CVR price at t=0 is then the mean value of this distribution of discounted payoffs. If it was never optimal to exercise the delay option at t=1, then this is replaced with the Black-Scholes price of a 12-pt. put spread at $51.
This process is repeated up to ten thousand times, and the arithmetic average is obtained over the
entire set of draws. The key parameters in this exercise are the risk-free rate at each decision node and
the stock price volatility for Viacom. Based on the zero-coupon yield curve prevailing on February 1,
1994, we inferred one-year forward rates at one and two years. For volatility, we used the value 45%
assumed in the L-F analysis of the offer.
32 Throughout the appendix, t=2 denotes the time at which the second rollover option is evaluated by the CVR issuer, while t=1 denotes the time at which the first CVR rollover is evaluated.
35
References
Andrade, G., M. Mitchell and E. Stafford, 2001. New evidence and perspectives on mergers. Journal of Economic
Perspectives 15, No. 2, 103-120.
Baghat, S. and D. Hirshleifer, 1997. Do takeovers create value? An intervention approach. Working paper,
University of Michigan Graduate School of Business.
Bebchuk, L. and O. Hart, 2001. Takeover bids versus proxy fights in contests for corporate control. NBER
working paper 8633.
Bradley, M., A. Desai, and E.H. Kim, 1983. The rationale behind interfirm offers: Information or synergy? Journal
of Financial Economics 11, 183-206.
Bradley, M., A. Desai, and E.H. Kim, 1988. Synergistic gains from corporate acquisitions and their division
between the stockholders of target and acquiring firms. Journal of Financial Economics 21, 3-40.
Comment, R. and G. W. Schwert, 1995. Poison or placebo? Evidence on the deterrence and wealth effects of
modern anti-takeover measures. Journal of Financial Economics 39, 3-43.
Eckbo, B. E., 1985. Mergers and the market concentration doctrine: Evidence from the capital market. Journal
of Business 58, 325-349.
Eckbo, B. E., 1992. Mergers and the value of antitrust deterrence. Journal of Finance 47, 1005-1029.
Esty, B., 1998. The acquisition of Consolidated Rail Corporation (A and B), teaching note. Harvard Business
School Case 5-298-087.
Fama, E. and M. Jensen, 1983. Separation of ownership and control. Journal of Law and Economics 26, 301-325.
Franks, J., R. Harris, and S. Titman, 1991. The postmerger share-price performance of acquiring firms. Journal of
Financial Economics 29, 81-96.
Fuller, K., J. Netter, And M. Stegemoller, 2002, What Do Returns to Acquiring Firms Tell Us? Evidence from Firms
that Make Many Acquisitions, Journal of Finance 57, 1763-1793.
Grossman, S. and O. Hart, 1980. Takeover bids, the free rider problem, and the theory of the corporation. Bell
Journal of Economics 11, 42-64.
Heaton, J.B., 2002. Managerial Optimism and Corporate Finance. Financial Management, Summer.
Jarrell, G. and A. Poulsen, 1987. Shark repellents and stock prices: The effects of antitakeover amendments since
1980. Journal of Financial Economics 19, 127-168.
Jensen, M. and W. Meckling, 1976. Theory of the firm: Managerial behavior, agency costs, and ownership
structure. Journal of Financial Economics 3, 305-360.
Jensen, M. and R. Ruback, 1983. The market for corporate control: The scientific evidence. Journal of Financial
Economics 11, 5-50.
Kaplan, S. N., 1994a. Paramount 1993. Case, University of Chicago Graduate School of Business.
Kaplan, S. N., 1994b. Paramount 1994. Case, University of Chicago Graduate School of Business.
Lang, L., R. Stulz, and R. Walkling, 1989. Tobin's q and the distribution of takeover gains. Journal of Financial
Economics 24, 137-154.
Malmendier, U. and G. Tate, 2001. CEO Overconfidence and corporate investment. Working paper, Harvard
36
University.
Mitchell, M., T. Pulvino, E. Stafford, 2001. Limited arbitrage in equity markets. Working paper, Harvard Business
School.
Morck, R. A. Shleifer, and R.Vishny, 1988. Management ownership and market valuation: An empirical analysis.
Journal of Financial Economics 20, 293-315.
Roll, R., 1986. The hubris hypothesis of corporate takeovers. Journal of Business 59, 97-216.
Schurman, S., 1999. Motives and value changes in corporate acquisitions: Evidence from anti-trust intervention.
Ph.D. thesis, University of Chicago Graduate School of Business.
Shleifer, A. and R. Vishny, 2001. Stock market driven acquisitions. Working paper, University of Chicago.
Stulz, R., 1988. Managerial control of voting rights. Journal of Financial Economics 20, 25-54.
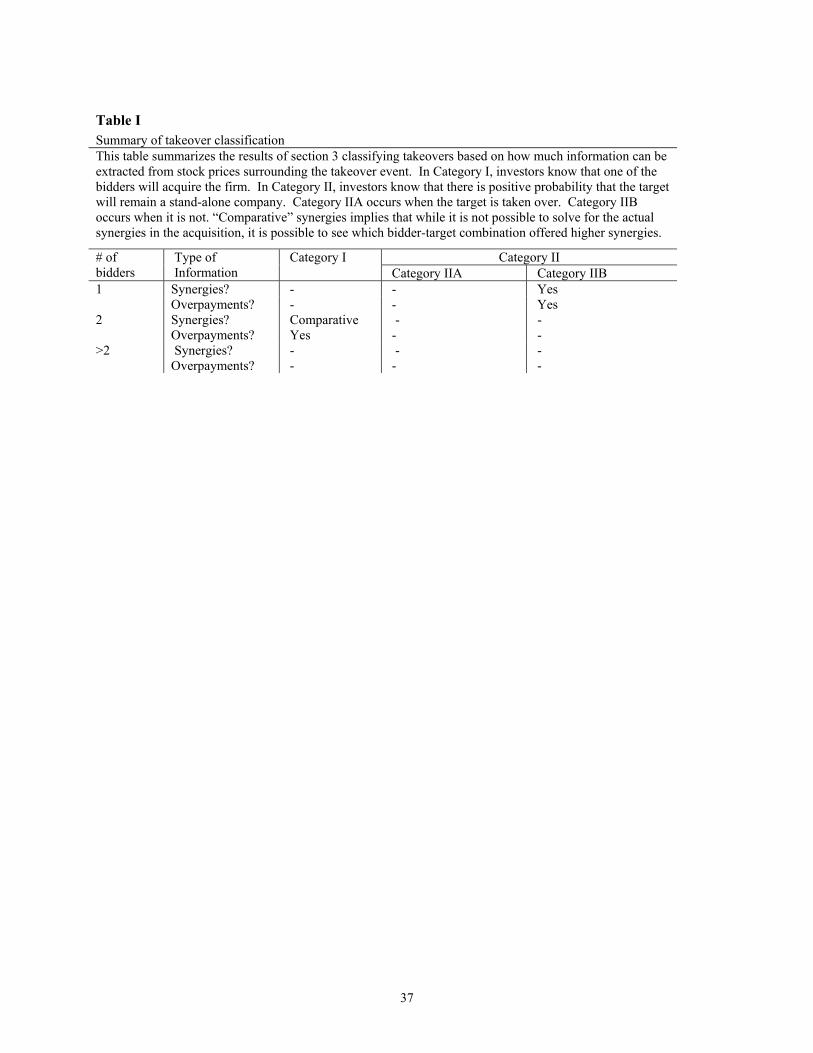
37
Table I Summary of takeover classification This table summarizes the results of section 3 classifying takeovers based on how much information can be extracted from stock prices surrounding the takeover event. In Category I, investors know that one of the bidders will acquire the firm. In Category II, investors know that there is positive probability that the target will remain a stand-alone company. Category IIA occurs when the target is taken over. Category IIB occurs when it is not. “Comparative” synergies implies that while it is not possible to solve for the actual synergies in the acquisition, it is possible to see which bidder-target combination offered higher synergies.
Category I Category II # of bidders
Type of Information Category IIA Category IIB
1 Synergies? - - Yes Overpayments? - - Yes 2 Synergies? Comparative - - Overpayments? Yes - - >2 Synergies? - - - Overpayments? - - -
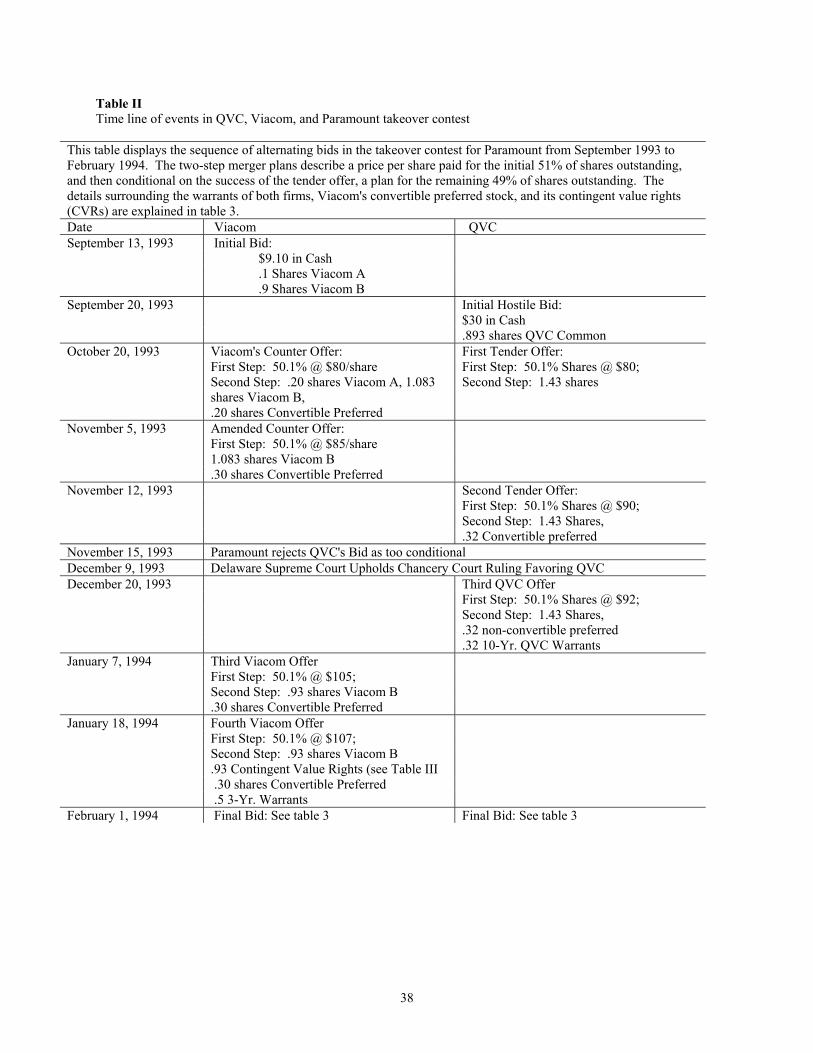
38
Table II Time line of events in QVC, Viacom, and Paramount takeover contest
This table displays the sequence of alternating bids in the takeover contest for Paramount from September 1993 to February 1994. The two-step merger plans describe a price per share paid for the initial 51% of shares outstanding, and then conditional on the success of the tender offer, a plan for the remaining 49% of shares outstanding. The details surrounding the warrants of both firms, Viacom's convertible preferred stock, and its contingent value rights (CVRs) are explained in table 3. Date Viacom QVC September 13, 1993 Initial Bid: $9.10 in Cash .1 Shares Viacom A .9 Shares Viacom B September 20, 1993 Initial Hostile Bid: $30 in Cash .893 shares QVC Common October 20, 1993 Viacom's Counter Offer: First Tender Offer:
First Step: 50.1% @ $80/share Second Step: .20 shares Viacom A, 1.083 shares Viacom B, .20 shares Convertible Preferred
First Step: 50.1% Shares @ $80; Second Step: 1.43 shares
November 5, 1993 Amended Counter Offer: First Step: 50.1% @ $85/share 1.083 shares Viacom B .30 shares Convertible Preferred November 12, 1993 Second Tender Offer: First Step: 50.1% Shares @ $90; Second Step: 1.43 Shares, .32 Convertible preferred November 15, 1993 Paramount rejects QVC's Bid as too conditional December 9, 1993 Delaware Supreme Court Upholds Chancery Court Ruling Favoring QVC December 20, 1993 Third QVC Offer First Step: 50.1% Shares @ $92; Second Step: 1.43 Shares, .32 non-convertible preferred .32 10-Yr. QVC Warrants January 7, 1994 Third Viacom Offer First Step: 50.1% @ $105; Second Step: .93 shares Viacom B .30 shares Convertible Preferred January 18, 1994 Fourth Viacom Offer First Step: 50.1% @ $107; Second Step: .93 shares Viacom B .93 Contingent Value Rights (see Table III .30 shares Convertible Preferred .5 3-Yr. Warrants February 1, 1994 Final Bid: See table 3 Final Bid: See table 3

39
Table III Final offers submitted by QVC and Viacom This table describes the final offers for Paramount submitted by Viacom and QVC as of February 1, 1994.
QVC Cash of $104 per share for 50.1% of Paramount shares. A securities package for the rest. For each of the remaining 49.9% Paramount shares: • 1.2361 shares of QVC Common Stock. • 0.2386 shares of QVC (non-convertible) Preferred Stock. Each share has $50 liquidation value and
pays an annual dividend of 6% or $3 per share. In three years, the shares may be exchanged, at the option of QVC, for junior subordinated debentures.
• 0.32 of a ten-year warrant to buy QVC shares with a strike price of $70.34.
Viacom Cash of $107 per share for 50.1% of shares A securities package for the rest. For each of the remaining 49.9% Paramount shares: • 0.93065 of Viacom B Common Shares. • 0.5 of a three-year Viacom B American Call Warrants with a strike price of $60. • 0.3 of a five-year Viacom B American Call Warrants with a strike price of $70. • $17.50 principal amount of a subordinated debenture with a coupon rate of 8% and a maturity of 12
years. The debentures were non-callable for 5 years assuming Viacom and Blockbuster merge. If the merger was not approved by Blockbuster shareholders, the subordinated debenture would be replaced with $17.50 face value of Viacom preferred stock with a dividend yield of 5%.
• 0.93065 of a Contingent Value Right (CVR): • After one year, Viacom can pay each CVR in cash or Viacom securities the difference between
$48 and the average closing prices of Viacom Class B stock over each twenty trading days over the 60 days prior to the one year maturity, up to $12 per share. In other words, if the average price of Viacom Class B is less than $48 per share, each CVR pays the lesser of ($48 - Via B) or $12.
• At the one year maturity, Viacom can, if it chooses, extend the CVR an addition year (for a total maturity of two years). If Viacom does so, it must pay the difference between $51 (not $48) and the average closing prices up to a maximum of $14 (not $12) per share. Finally at the two year maturity, Viacom can extend the CVR for one last year, after which Viacom must pay the difference between $55 and the average closing prices up to a maximum of $17 per share.

40
Table IV Value of initial and final bids using prevailing stock prices Value of Viacom offers on September 12, 1993 and on February 3, 1994, and QVC offers on September 20, 1993 and February 3, 1994 using closing stock prices on the respective dates. The value of the final Viacom offer assumes the Blockbuster merger occurs. Sources: Lazard Freres presentation to Paramount Board in Paramount Communications 13E3, May 25, 1994.
Viacom's Initial Offer, September 12, 1993
$9.10 in cash $9.10 0.1 shares of Viacom A $6.60 0.9 shares of Viacom B $53.44
Total $69.14
QVC's Hostile Bid, September 20th, 1993 $30.00 in cash $30.00 .893 QVC shares $50.01
Total $80.01
Viacom's Final Offer: February 3, 1994 Security Value Ratio Amount Per Share Cash 107.00 0.501 1.000 53.61 Subordinated Debt 0.96 0.499 17.50 8.41 CVR 8.33 0.499 0.931 3.87 Warrant - 3 year 3.28 0.499 0.500 0.82 Warrant - 5 year 5.48 0.499 0.300 0.82 Common 34.00 0.499 0.931 15.79
Total 83.31
QVC's Final Offer: February 3, 1994 Cash 104.00 0.501 1.000 52.10 Preferred 31.53 0.499 0.239 3.76 Warrant - 10 year 15.97 0.499 0.320 2.55 Common 45.875 0.499 1.236 28.30
Total 86.71
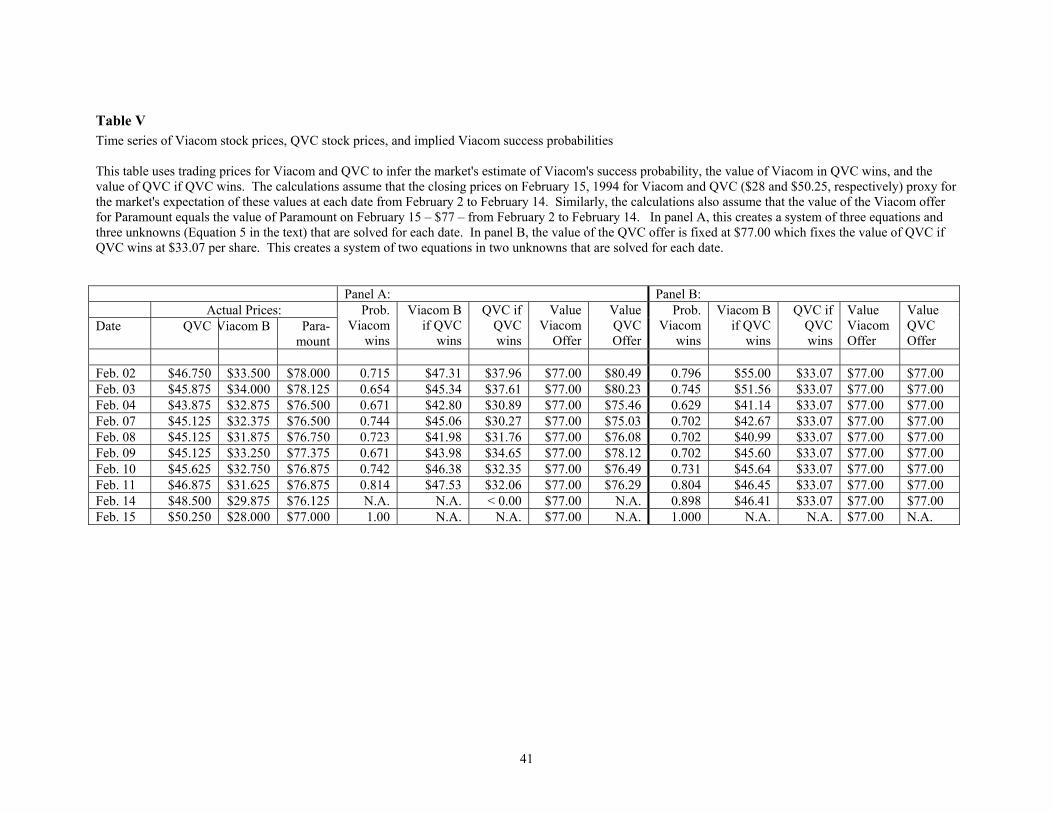
41
Table V Time series of Viacom stock prices, QVC stock prices, and implied Viacom success probabilities This table uses trading prices for Viacom and QVC to infer the market's estimate of Viacom's success probability, the value of Viacom in QVC wins, and the value of QVC if QVC wins. The calculations assume that the closing prices on February 15, 1994 for Viacom and QVC ($28 and $50.25, respectively) proxy for the market's expectation of these values at each date from February 2 to February 14. Similarly, the calculations also assume that the value of the Viacom offer for Paramount equals the value of Paramount on February 15 – $77 – from February 2 to February 14. In panel A, this creates a system of three equations and three unknowns (Equation 5 in the text) that are solved for each date. In panel B, the value of the QVC offer is fixed at $77.00 which fixes the value of QVC if QVC wins at $33.07 per share. This creates a system of two equations in two unknowns that are solved for each date. Panel A: Panel B: Actual Prices: Date QVC Viacom B Para-
mount
Prob. Viacom
wins
Viacom B if QVC
wins
QVC if QVC wins
Value Viacom
Offer
Value QVC Offer
Prob. Viacom
wins
Viacom B if QVC
wins
QVC if QVC wins
Value Viacom Offer
Value QVC Offer
Feb. 02 $46.750 $33.500 $78.000 0.715 $47.31 $37.96 $77.00 $80.49 0.796 $55.00 $33.07 $77.00 $77.00 Feb. 03 $45.875 $34.000 $78.125 0.654 $45.34 $37.61 $77.00 $80.23 0.745 $51.56 $33.07 $77.00 $77.00 Feb. 04 $43.875 $32.875 $76.500 0.671 $42.80 $30.89 $77.00 $75.46 0.629 $41.14 $33.07 $77.00 $77.00 Feb. 07 $45.125 $32.375 $76.500 0.744 $45.06 $30.27 $77.00 $75.03 0.702 $42.67 $33.07 $77.00 $77.00 Feb. 08 $45.125 $31.875 $76.750 0.723 $41.98 $31.76 $77.00 $76.08 0.702 $40.99 $33.07 $77.00 $77.00 Feb. 09 $45.125 $33.250 $77.375 0.671 $43.98 $34.65 $77.00 $78.12 0.702 $45.60 $33.07 $77.00 $77.00 Feb. 10 $45.625 $32.750 $76.875 0.742 $46.38 $32.35 $77.00 $76.49 0.731 $45.64 $33.07 $77.00 $77.00 Feb. 11 $46.875 $31.625 $76.875 0.814 $47.53 $32.06 $77.00 $76.29 0.804 $46.45 $33.07 $77.00 $77.00 Feb. 14 $48.500 $29.875 $76.125 N.A. N.A. < 0.00 $77.00 N.A. 0.898 $46.41 $33.07 $77.00 $77.00 Feb. 15 $50.250 $28.000 $77.000 1.00 N.A. N.A. $77.00 N.A. 1.000 N.A. N.A. $77.00 N.A.

42
Table VI Analysis of overpayments and synergies Estimates of overpayments and synergies in the Viacom - QVC - Paramount takeover contest. QVC share price had QVC won and Viacom Class B share price had Viacom lost are the average of their respective values from February 4 to February 11, 1994 reported in table 5 for panel A and from February 4 to February 14 for panel B. Viacom Class A share price had Viacom lost is calculated to equal 1.22 times the Viacom Class B share price, the same ratio as 34.25 to 28.00. TN denotes the value of Paramount (the target) as a stand-alone firm, i.e. if no acquisition had occurred. We also report total synergies assuming that Paramount’s value, TN, is equal to its value of $55.875 per share on September 7, 1993. Total values of overpayments and relative synergies are based on 120M shares outstanding of Viacom stock (67M class B, 53M class A), 120M shares outstanding of Paramount stock, and 37.7M shares outstanding of QVC stock. New information revealed for each firm is calculated using September 7, 1993 prices for Viacom Class A of $66.25 per share, Viacom Class B of $59.25 per share, and QVC of $63.00. Panel A: Panel B:
QVC
(1) QVC Share Price, Had It Won $32.00 $33.07 (2) Prevailing Share Price, 2/15/94, Having Lost $50.25 $50.25 (3) Offer Value, at $32.00 per share $76.24 $77.00 (4) Overpayment: [(2)-(1)] x 37.7 M $688 M $648 M (5) Total QVC-Paramount Synergies: (3) x 120 M – (4) - TN $8,461 M - TN $8,592 M - TN (5’) Total QVC-Paramount Synergies if TN = T0 $1,756 M $1,887 M (6) New Information Revealed Since Sept. 7:
[(2) - $63.0] x 37.7 M
- $481 M
- $481 M
Viacom Class A Class B Class A Class B (1) Prevailing Share Price, 2/15/94, Having Won $34.25 $28.00 $34.25 $28.00 (2) Viacom Share Price, Had It Lost $54.58 $44.62 $53.98 $44.13 (3) Offer Value, at $28.00 per share $77.00 $77.00 (4) Overpayment:
[(2A)-(1A)] x (53 M A) + [(2B)-(1B)] x (67 M B)
$2,191 M
$2,126 M (5) Total Viacom-Paramount Synergies: (3) x 120M – (4) - TN $7,049 M - TN $7,113 M - TN (5’) Total Viacom-Paramount Synergies if TN = T0 $ 344 M $ 409 M (6) New Information Revealed Since Sept. 7:
[(2A) - $66.25] x 53M A + [(2B) - $59.25] x 67 M B
- $1,599 M
- $1,663 M