Embed Size (px)
Citation preview

V. Bilas: What is the Relationship Between FDI and Economic Growth? Evidence from EU15 CountriesZbornik Veleučilišta u Rijeci, Vol. 8 (2020), No. 1, pp. 253-281
253
Preliminary communication https://doi.org/10.31784/zvr.8.1.8 Received: 3. 12. 2019. Accepted: 30. 1. 2020.
WHAT IS THE RELATIONSHIP BETWEEN FDI AND ECONOMIC GROWTH? EVIDENCE FROM EU15
COUNTRIESVlatka Bilas
PhD, Full Professor, University of Zagreb, Faculty of Economics and Business, Department of International Economics, Trg J. F. Kenedyja 6, 10000 Zagreb, Croatia;
e-mail: [email protected]
ABSTRACTThe aim of the paper is to examine the relationship between foreign direct investment (FDI) and economic growth in EU15 countries over the period 2002-2018. EU15 makes a group of countries which entered the EU prior to the biggest enlargement in 2004, namely latest in 1995 (Austria, Belgium, Denmark, Finland, France, Germany, Greece, Ireland, Italy, Luxembourg, Netherlands, Portugal, Spain, Sweden and United Kingdom). Paper findings contribute to the existing literature on the impact of FDI on economic growth. It employs different unit root tests, panel cointegration test (ARDL model) and Granger causality. Estimated panel ARDL model found some evidence that there are long-run equilibrium between LogGDP, LogFDI and LogFDIP series. The rate of adjustment back to equilibrium is between 4.43% and 5.95%. The long-run coefficients are all positive, but not all of them are statistically significant. In case of LogFDIP series long-run coefficients are statistically significant, varying between 0.1226 and 0.4398. These coefficients indicate that 1% increase in LogFDIP (logarithm of FDI to GDP) increases LogGDP between 0.1226% and 0.4398%. Results of Dumitrescu-Hurlin panel causality test indicated that there is only unidirectional causal relationship from GDP growth rate to FDI growth rate, and from GDP growth rate to LogFDIP. Conclusively, there is only a weak evidence that FDI had statistically significant impact on the GDP in EU15 countries.
Key words: unit root tests, cointegration test, Granger causality, EU15
1. INTRODUCTION
Although projection of the global FDI flows were that FDI will increase by about 5% in 2018 (UNCTAD, 2018), global FDI decreased in 2018 by 13% (UNCTAD (2019). Analysing the FDI flows over the period 1990-2018, it can be concluded that in 1990 more than 60% of FDI inflow in
Creative Commons Attribution – NonCommercial 4.0 International License
V. Bilas: What is the Relationship Between FDI and Economic Growth? Evidence from EU15 CountriesZbornik Veleučilišta u Rijeci, Vol. 8 (2020), No .1, pp. 253-281
254
developed countries went to Europe. In the observed period, the share of Europe was highest in 2005 when it exceeded 80% and after 2005 share of Europe started to decline to 31% in 2018.
In order to stimulate economic growth countries liberalise trade, the movement of capital, and even the labor. Related to FDI, they liberalise the movement of capital expecting positive effects on their economy from FDI inflows. The trends of proliferation and deepening regional economic integrations led to the liberalization of the movement of capital within and beyond regional economic integrations (Bilas, 2007). Developing countries try to attract more FDI with their incentives due to the expectation of a positive impact on the host economy (Kersan Skabic, 2013).
Many authors examined the effects of FDI on the host economy (Carbonell and Werner, 2018). There is a spread belief that FDI promotes economic development (Alfaro et al., 2010; Hunady and Orviska, 2014), especially in developing countries (Sokang, 2018). De Mello (1997) found that impact of FDI on output growth in the host economy depends on the scope of efficiency spillovers to domestic firms. Borensztein, De Gregorio and Lee (1998) examined the effect of FDI on economic growth for the period 1970-1989 on the sample of 69 developing countries and concluded that the effect of FDI on economic growth is dependent on the level of human capital available in the host economy. Gürsoy, Sekreter and Kalyoncu (2013) found biased results on the relationship between GDP and economic growth in the observed period 1997-2010.
Iamsiraroj and Doucouliagos (2015) applied meta-regression analysis to 946 estimates from 140 empirical studies. They found robust positive correlation between economic growth and FDI, significantly larger for single country case studies than with cross-country analysis. Similarly, Ozturk (2007) analysed literature on the relationship between FDI and economic growth and found that consensus has been reached that FDI tends to have significant effect on economic growth through multiple channels. On the other hand, Alfaro et al. (2010) claim that empirical literature finds weak support for an exogenous positive effect of FDI on economic growth.
Jirasavetakul and Rahman (2018) found FDI has played a strong role in the export-led growth of new European Union member countries. De Mello (1999) found on the sample of OECD and non-OECD countries over the period 1970-1990 that extent to which FDI fosters economic growth depends upon the level of complementarity and substitution of FDI and domestic investment. Ekananda and Parlinggoman (2017) found positive role of FDI and domestic investment on economic growth on the sample of 50 countries over the period 1992-2014.
Kurecic and Kozina (2017) examined the correlation between GDP and FDI in EU15 countries over the period 1980-2014 and found most of the EU15 member countries show a significant correlation. Tang (2015) examined the FDI effects on economic growth of the European Union member countries over the period 1987-2012 and concluded that EU countries can maintain sustainable higher growth by attracting more FDI.
Angelopoulou and Liargovas (2014) examined the relationship between FDI and economic growth for three group of countries, EU members, EMU members and transition countries, over the period 1989-2008 and found no robust causality relationship between FDI and economic growth.

V. Bilas: What is the Relationship Between FDI and Economic Growth? Evidence from EU15 CountriesZbornik Veleučilišta u Rijeci, Vol. 8 (2020), No. 1, pp. 253-281
255
Hlavacek and Bal-Domanska (2016) examined the impact of FDI on economic growth on the sample of Central and Eastern European countries (Czech Republic, Estonia, Hungary, Latvia, Lithuania, Poland, Slovakia and Slovenia) over the period 2000-2012 and found statistically significant relation between FDI and GDP, as well as growth of the FDI positively impacts growth of the GDP. Carstensen and Toubal (2004) examined the determinants of FDI into Central and Eastern European countries in the period 1993-1999 and identified the factors which encourage inflow of the FDI: market potential, low relative unit labor costs and skilled labor force. On the other side, Dhakal, Mixon and Upadhyaya (2007) on the same sample of countries for the period 1995-2004 found following determinants of FDI: real exchange rate, openness of the economy and deregulation. Furthermore, Jude and Pop Silaghi (2016) examined the impact of FDI on aggregate employment in Central and Eastern European countries for the observed period 1995-2012 and found a negative short run effect on employment which becomes positive in the long run.
Schmitt and Alexiou (2016) examined the FDI led growth hypothesis in Ireland over the period 1976-2011, using annual data. They found, among others, significant relationship between FDI and GDP, as well as unidirectional Granger causality from GDP to FDI. Similarly, Sârbu and Carp (2015) found that FDI has a positive effect on the economic growth in Romanian over the period 2000-2013.
Kikerkova et al. (2018) examined the impact of the FDI inflow on the economic growth of Macedonia over the period 2003-2015 and found positive bidirectional relationship, higher GDP can lead to higher FDI inflows, as well as the increase in FDI can cause positive reaction to the economic growth.
Mahmoodi and Mahmoodi (2016) examined the causal relationship between FDI, exports and economic growth in two panels of developing countries - eight European developing countries over the period 1992-2013 and eight Asian developing countries over the period 1986-2013. They found in the European developing panel bidirectional causality between GDP and FDI, as well as unidirectional causality from GDP and FDI to exports and for Asian developing panel bidirectional causality between exports and economic growth in short run. However, they found in the long run causality from export and FDI to economic growth, and causality from economic growth and export to FDI for both of the panels.
Chowdhury and Mavrotas (2006) examined the causal relationship between FDI and economic growth on the sample of Chile, Malaysia and Thailand over the period 1969-2000 and found GDP causes FDI in the case of Chile (unidirectional causality), while for both Malaysia and Thailand, there is a strong evidence of a bidirectional causality between the two variables. Suliman et al. (2018) found bidirectional relationship between FDI and economic growth - FDI boosts growth and the growth rate stimulates positively FDI inwards, for the Economic and Social Commission for Western Asia countries over the period 1980-2011. Iqbal et al. (2013) examined the relationship between FDI and GDP in Pakistan over the period 1983-2012 and found positive relationship between FDI and GDP. Similarly, Rahaman and Chakraborty (2015) examined the causal relationship between FDI and GDP in Bangladesh over the period 1987-2011 and found long-run equilibrium relationship and Granger unidirectional causality from FDI to GDP.

V. Bilas: What is the Relationship Between FDI and Economic Growth? Evidence from EU15 CountriesZbornik Veleučilišta u Rijeci, Vol. 8 (2020), No .1, pp. 253-281
256
Empirical evidence of the relationship between FDI and economic growth has been mixed. Therefore, the aim of the paper is to examine the relationship between FDI and GDP in EU15 countries. EU15 makes a group of countries which entered the EU prior to the biggest enlargement in 2004, namely latest in 1995 (Austria, Belgium, Denmark, Finland, France, Germany, Greece, Ireland, Italy, Luxembourg, Netherlands, Portugal, Spain, Sweden and United Kingdom). The hypothesis of the paper is that FDI positively impacts GDP in EU15 countries.
Paper is divided into four parts. After the introduction, second part refers to methodology and data. Third part of the paper presents empirical analysis, results and discussion. Conclusion is given in the fourth part of the paper.
2. METHODOLOGY AND DATA
Paper employed different unit root tests, panel cointegration test (ARDL model) and Granger causality test using EViews v. 10 and Stata v. 15 in order to examine relationship between FDI and economic growth in the EU15 countries (Austria, Belgium, Denmark, Finland, France, Germany, Greece, Ireland, Italy, Luxembourg, Netherlands, Portugal, Spain, Sweden and United Kingdom) over the period 2002-2018. This is a balanced panel with 17 observations for each series and each country. EU15 countries make a group of countries which entered the EU prior to the biggest enlargement in 2004, namely latest in 1995 (Austria, Finland and Sweden).
Annual data for FDI and GDP were retrieved from the World Bank, World Development Indicators. Variables’ description is presented in Table 1.
Table 1. Variables definition
Variable Description
GDP GDP, PPP (constant 2011 international $), PPP GDP is gross domestic product converted to international dollars using purchasing power parity rates.
FDI Foreign direct investment, net inflows (BoP, current US$)
FDIP Foreign direct investment, net inflows (% of GDP)
rGDP GDP growth rate (%)
rFDI FDI growth rate (%)
rFDIP FDIP growth rate (%)
LogGDP Natural logarithm of GDP series
LogFDI Natural logarithm of FDI series
LogFDIP Natural logarithm of FDIP series
∆LogGDP The first difference of LogGDP series
∆LogFDI The first difference of LogFDI series
∆LogFDIP The first difference of LogFDIP seriesSource: Author’s calculation

V. Bilas: What is the Relationship Between FDI and Economic Growth? Evidence from EU15 CountriesZbornik Veleučilišta u Rijeci, Vol. 8 (2020), No. 1, pp. 253-281
257
Table 2. Descriptive statistics for EU15 members
Variable Obs Mean Std. Dev. Min Max
gdp4 255 1.01e+12 1.03e+12 3.79e+10 3.81e+12
fdi 255 4.18e+10 7.96e+10 -2.39e+11 7.34e+11
fdip 255 6.992461 14.45328 -58.32288 86.61077
rgdp4 255 1.521327 2.996384 -9.13254 25.16233
rfdi 253 274.9144 3530.726 -843.0771 55862.27
rfdip 253 255.694 3430.596 -760.4657 54347.48
loggdp4 255 27.04025 1.162207 24.35926 28.96899
logfdi 255 19.4214 13.61418 -26.20086 27.32179
logfdip 255 1.327866 1.400505 -4.082995 4.472904
dloggdp4 255 .0146727 .0291417 -.095768 .2244415
dlogfdi 253 -.7039818 16.65308 -51.49107 48.55619
dlogfdip 253 -.0815229 1.480817 -8.426331 6.703549
Original series: gdp4, fdi, fdip. Growth rates: rgdp4, rfdi, rfdip. Logarithm transformation: loggdp4, logfdi, logfdip. The first
difference: dloggdp4 dlogfdi dlogfdip
Source: Author’s calculation
3. EMPIRICAL ANALYSIS, RESULTS AND DISCUSSION
3. 1 Unit root tests
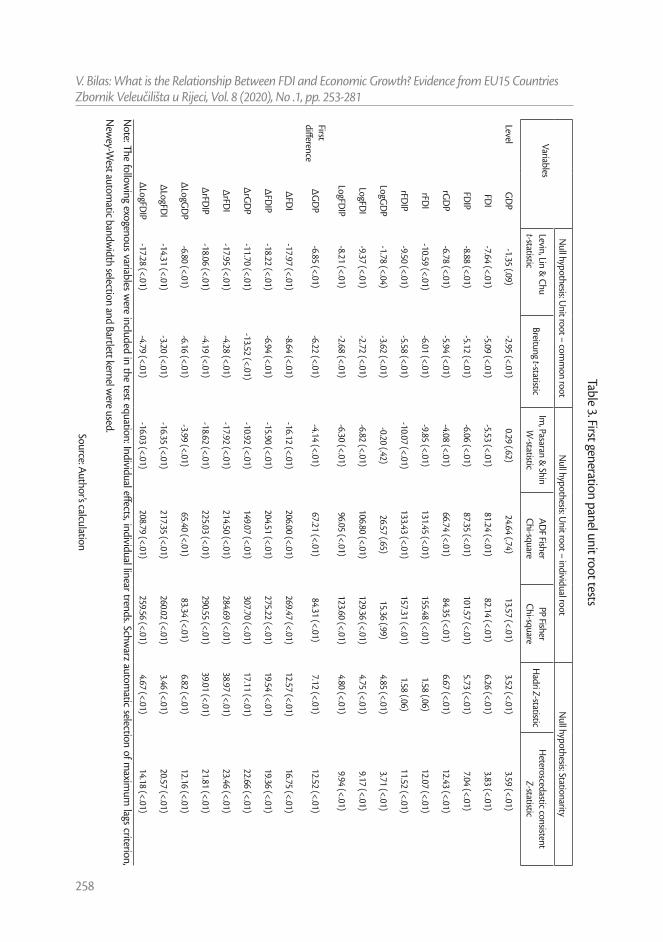
Levin-Lin-Chu (2002) and Breitung (2000, 2002) tests are using t—statistic to test the null hypothesis of common unit root. Im-Pesaran-Shin (2003) with W-statistic, ADF (Dickey and Fuller, 1979, 1981) Fisher and PP Fisher with Chi-square statistics are testing the null hypothesis of individual unit root against an alternative hypothesis of some cross-sections without unit root. Finally, the null hypothesis of stationarity was tested using Hadri (2000) Z-statistic and heteroscedastic consistent Z-statistic. The results are presented in Table 3.
V. Bilas: What is the Relationship Between FDI and Economic Growth? Evidence from EU15 CountriesZbornik Veleučilišta u Rijeci, Vol. 8 (2020), No .1, pp. 253-281
258
Table 3. First generation panel unit root tests
Variables
Null hypothesis: U
nit root – comm
on rootN
ull hypothesis: Unit root – individual root
Null hypothesis: Stationarity
Levin, Lin & Chu
t-statisticBreitung t-statistic
Im, Pasaran &
Shin W
-statisticAD
F Fisher Chi-square
PP Fisher Chi-square
Hadri Z-statistic
Heteroscedastic consistent
Z-statistic
LevelG
DP
-1.35 (.09)-2.95 (<.01)
0.29 (.62)24.64 (.74)
13.57 (<.01)3.52 (<.01)
3.59 (<.01)
FDI
-7.64 (<.01)-5.09 (<.01)
-5.53 (<.01)81.24 (<.01)
82.14 (<.01)6.26 (<.01)
3.83 (<.01)
FDIP
-8.88 (<.01)-5.12 (<.01)
-6.06 (<.01)87.35 (<.01)
101.57 (<.01)5.73 (<.01)
7.04 (<.01)
rGD
P-6.78 (<.01)
-5.94 (<.01)-4.08 (<.01)
66.74 (<.01)84.35 (<.01)
6.67 (<.01)12.43 (<.01)
rFDI
-10.59 (<.01)-6.01 (<.01)
-9.85 (<.01)131.45 (<.01)
155.48 (<.01)1.58 (.06)
12.07 (<.01)
rFDIP
-9.50 (<.01)-5.58 (<.01)
-10.07 (<.01)133.43 (<.01)
157.31 (<.01)1.58 (.06)
11.52 (<.01)
LogGD
P-1.78 (<.04)
-3.62 (<.01)-0.20 (.42)
26.57 (.65)15.36 (.99)
4.85 (<.01)3.71 (<.01)
LogFDI
-9.37 (<.01)-2.72 (<.01)
-6.82 (<.01)106.80 (<.01)
129.36 (<.01)4.75 (<.01)
9.17 (<.01)
LogFDIP
-8.21 (<.01)-2.68 (<.01)
-6.30 (<.01)96.05 (<.01)
123.60 (<.01)4.80 (<.01)
9.94 (<.01)
First difference
∆G
DP
-6.85 (<.01)-6.22 (<.01)
-4.14 (<.01)67.21 (<.01)
84.31 (<.01)7.12 (<.01)
12.52 (<.01)
∆FD
I-17.97 (<.01)
-8.64 (<.01)-16.12 (<.01)
206.00 (<.01)269.47 (<.01)
12.57 (<.01)16.75 (<.01)
∆FD
IP-18.22 (<.01)
-6.94 (<.01)-15.90 (<.01)
204.51 (<.01)275.22 (<.01)
19.54 (<.01)19.36 (<.01)
∆rG
DP
-11.70 (<.01)-13.52 (<.01)
-10.92 (<.01)149.07 (<.01)
307.70 (<.01)17.11 (<.01)
22.66 (<.01)
∆rFD
I-17.95 (<.01)
-4.28 (<.01)-17.92 (<.01)
214.50 (<.01)284.69 (<.01)
38.97 (<.01)23.46 (<.01)
∆rFD
IP-18.06 (<.01)
-4.19 (<.01)-18.62 (<.01)
225.03 (<.01)290.55 (<.01)
39.01 (<.01)21.81 (<.01)
∆LogG
DP
-6.80 (<.01)-6.16 (<.01)
-3.99 (<.01)65.40 (<.01)
83.34 (<.01)6.82 (<.01)
12.16 (<.01)
∆LogFD
I-14.31 (<.01)
-3.20 (<.01)-16.35 (<.01)
217.35 (<.01)260.02 (<.01)
3.46 (<.01)20.57 (<.01)
∆LogFD
IP-17.28 (<.01)
-4.79 (<.01)-16.03 (<.01)
208.79 (<.01)259.56 (<.01)
4.67 (<.01)14.18 (<.01)
Note: Th
e following exogenous variables w
ere included in the test equation: Individual effects, individual linear trends. Schwarz autom
atic selection of maxim
um lags criterion,
New
ey-West autom
atic bandwidth selection and Bartlett kernel w
ere used.Source: Author’s calculation
V. Bilas: What is the Relationship Between FDI and Economic Growth? Evidence from EU15 CountriesZbornik Veleučilišta u Rijeci, Vol. 8 (2020), No. 1, pp. 253-281
259
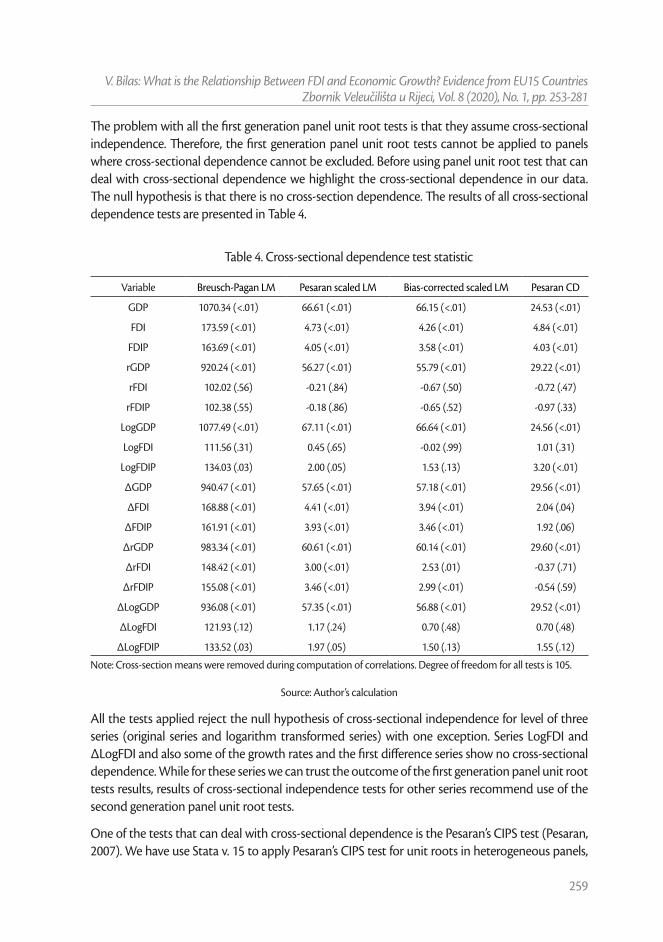
The problem with all the first generation panel unit root tests is that they assume cross-sectional independence. Therefore, the first generation panel unit root tests cannot be applied to panels where cross-sectional dependence cannot be excluded. Before using panel unit root test that can deal with cross-sectional dependence we highlight the cross-sectional dependence in our data. The null hypothesis is that there is no cross-section dependence. The results of all cross-sectional dependence tests are presented in Table 4.
Table 4. Cross-sectional dependence test statistic
Variable Breusch-Pagan LM Pesaran scaled LM Bias-corrected scaled LM Pesaran CD
GDP 1070.34 (<.01) 66.61 (<.01) 66.15 (<.01) 24.53 (<.01)
FDI 173.59 (<.01) 4.73 (<.01) 4.26 (<.01) 4.84 (<.01)
FDIP 163.69 (<.01) 4.05 (<.01) 3.58 (<.01) 4.03 (<.01)
rGDP 920.24 (<.01) 56.27 (<.01) 55.79 (<.01) 29.22 (<.01)
rFDI 102.02 (.56) -0.21 (.84) -0.67 (.50) -0.72 (.47)
rFDIP 102.38 (.55) -0.18 (.86) -0.65 (.52) -0.97 (.33)
LogGDP 1077.49 (<.01) 67.11 (<.01) 66.64 (<.01) 24.56 (<.01)
LogFDI 111.56 (.31) 0.45 (.65) -0.02 (.99) 1.01 (.31)
LogFDIP 134.03 (.03) 2.00 (.05) 1.53 (.13) 3.20 (<.01)
∆GDP 940.47 (<.01) 57.65 (<.01) 57.18 (<.01) 29.56 (<.01)
∆FDI 168.88 (<.01) 4.41 (<.01) 3.94 (<.01) 2.04 (.04)
∆FDIP 161.91 (<.01) 3.93 (<.01) 3.46 (<.01) 1.92 (.06)
∆rGDP 983.34 (<.01) 60.61 (<.01) 60.14 (<.01) 29.60 (<.01)
∆rFDI 148.42 (<.01) 3.00 (<.01) 2.53 (.01) -0.37 (.71)
∆rFDIP 155.08 (<.01) 3.46 (<.01) 2.99 (<.01) -0.54 (.59)
∆LogGDP 936.08 (<.01) 57.35 (<.01) 56.88 (<.01) 29.52 (<.01)
∆LogFDI 121.93 (.12) 1.17 (.24) 0.70 (.48) 0.70 (.48)
∆LogFDIP 133.52 (.03) 1.97 (.05) 1.50 (.13) 1.55 (.12)
Note: Cross-section means were removed during computation of correlations. Degree of freedom for all tests is 105.
Source: Author’s calculation
All the tests applied reject the null hypothesis of cross-sectional independence for level of three series (original series and logarithm transformed series) with one exception. Series LogFDI and ∆LogFDI and also some of the growth rates and the first difference series show no cross-sectional dependence. While for these series we can trust the outcome of the first generation panel unit root tests results, results of cross-sectional independence tests for other series recommend use of the second generation panel unit root tests.
One of the tests that can deal with cross-sectional dependence is the Pesaran’s CIPS test (Pesaran, 2007). We have use Stata v. 15 to apply Pesaran’s CIPS test for unit roots in heterogeneous panels,
V. Bilas: What is the Relationship Between FDI and Economic Growth? Evidence from EU15 CountriesZbornik Veleučilišta u Rijeci, Vol. 8 (2020), No .1, pp. 253-281
260
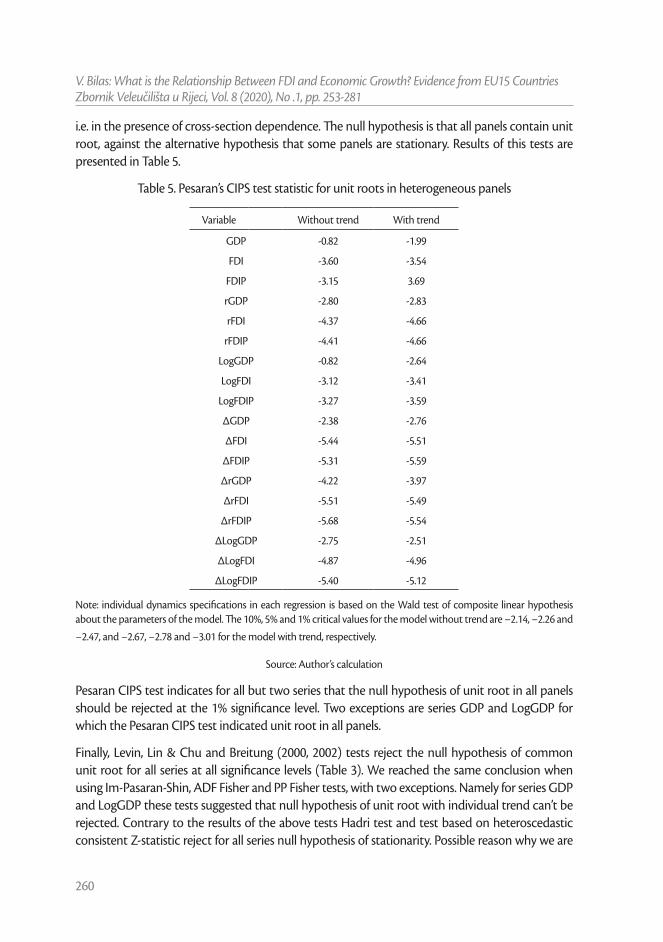
i.e. in the presence of cross-section dependence. The null hypothesis is that all panels contain unit root, against the alternative hypothesis that some panels are stationary. Results of this tests are presented in Table 5.
Table 5. Pesaran’s CIPS test statistic for unit roots in heterogeneous panels
Variable Without trend With trend
GDP -0.82 -1.99
FDI -3.60 -3.54
FDIP -3.15 3.69
rGDP -2.80 -2.83
rFDI -4.37 -4.66
rFDIP -4.41 -4.66
LogGDP -0.82 -2.64
LogFDI -3.12 -3.41
LogFDIP -3.27 -3.59
∆GDP -2.38 -2.76
∆FDI -5.44 -5.51
∆FDIP -5.31 -5.59
∆rGDP -4.22 -3.97
∆rFDI -5.51 -5.49
∆rFDIP -5.68 -5.54
∆LogGDP -2.75 -2.51
∆LogFDI -4.87 -4.96
∆LogFDIP -5.40 -5.12
Note: individual dynamics specifications in each regression is based on the Wald test of composite linear hypothesis about the parameters of the model. The 10%, 5% and 1% critical values for the model without trend are −2.14, −2.26 and
−2.47, and −2.67, −2.78 and −3.01 for the model with trend, respectively.
Source: Author’s calculation
Pesaran CIPS test indicates for all but two series that the null hypothesis of unit root in all panels should be rejected at the 1% significance level. Two exceptions are series GDP and LogGDP for which the Pesaran CIPS test indicated unit root in all panels.
Finally, Levin, Lin & Chu and Breitung (2000, 2002) tests reject the null hypothesis of common unit root for all series at all significance levels (Table 3). We reached the same conclusion when using Im-Pasaran-Shin, ADF Fisher and PP Fisher tests, with two exceptions. Namely for series GDP and LogGDP these tests suggested that null hypothesis of unit root with individual trend can’t be rejected. Contrary to the results of the above tests Hadri test and test based on heteroscedastic consistent Z-statistic reject for all series null hypothesis of stationarity. Possible reason why we are

V. Bilas: What is the Relationship Between FDI and Economic Growth? Evidence from EU15 CountriesZbornik Veleučilišta u Rijeci, Vol. 8 (2020), No. 1, pp. 253-281
261
getting such mixed results could be that these tests have lower power in case of the structural break in time series, which is evident in case of GDP and LogGDP series.
Therefore, because of the strong cross-sectional dependence for some of the series, results of the Pesaran CPIS tests are more reliable than the results of the first generation panel unit root tests. In summary, we may say that all series both in level and the first difference are I(0), with GDP and LogGDP being the only exception. These two series are considered to be I(1).
3. 2 Panel cointegration test (ARDL model)
Since unit root tests result suggested that GDP/LogGDP and FDI/LogFDI series are of different order of integration (I(1) and I(0) respectively), for these series cointegration tests based on ARDL model will be used.
The panel ARDL technique was selected to investigate the long-term and short-term cointegration correlations between GDP and FDI and extract the error correction version of the panel characteristics to identify the short-term dynamic. The panel ARDL method was preferred over more traditional cointegration techniques, such as Johansen (1991) cointegration test, because it could be used with the studied factors regardless of whether they were I(0), I(1), or both I(0) and I(1). Using panel ARDL, both long-term and short-term coefficients are provided at once.
This approach is based on the use of the panel form of ARDL model proposed by Pesaran and Shin (1999) and Pesaran Shin and Smith (2001). The asymptotic features of these panels are different from the traditional panels’ assumptions, with homogeneous slope parameters across the groups. They developed the pooled mean group (PMG) estimator, where the PMG assumes the combination of both pooling and averaging of the coefficients. In this respect, therefore, the intercept and slope parameters, and the error correction variances may all differ across the groups. To assess impact of the optimal lag length criteria on the ARDL results we have used both Akaike (1974) information criterion (AIC) and Schwarz (1978) information criterion (SIC). We have also estimated ARDL models for both original and logarithm transformation of the original series. Finally, ARDL models were estimated with two different trend specification: constant level and linear trend.
ARDL models based on logarithm transformation of the original series are preferred, for at least two reasons. First, most of the ARDL models estimated in literature are based on logarithm transformed series. Second, interpretation of the coefficients in such models is more intuitive. Coefficients in these models are elasticities, showing for how much will change the dependent variable for 1% change in independent variables. Therefore we are presenting all the results, but will comment only on those models with logarithm transformed series.

V. Bilas: What is the Relationship Between FDI and Economic Growth? Evidence from EU15 CountriesZbornik Veleučilišta u Rijeci, Vol. 8 (2020), No .1, pp. 253-281
262
Table 6. Panel ARDL (PMG) estimation (dependent variable: GDP)
VariableConstant Linear trend
Coefficient t-statistic P-value Coefficient t-statistic P-value
Long run equation
FDI 4.9547 4.83 <.01 1.9042 8.69 <.01
Short run equation
Cointegrating equation -0.0494 -1.37 .17 -0.2014 -2.42 .02
∆FDI 0.1038 0.66 .51 -0.0548 -0.43 .67
Trend 3.71E+09 1.42 .16
Constant 1.00E+11 1.40 .16 2.99E+11 2.09 .04
Note: Schwarz criterion (SIC) was used for optimal lag length selection. ARDL(1,1) model was selected.
Source: Author’s calculation
Table 7. Panel ARDL (PMG) estimation (dependent variable: GDP)
VariableConstant Linear trend
Coefficient t-statistic P-value Coefficient t-statistic P-value
Long run equation
FDI 4.8973 8.23 <.01 4.3829 6.71 <.01
Short run equation
Cointegrating equation -0.0700 -1.42 .16 -0.0873 -1.52 .13
∆GDP(-1) 0.1695 1.41 .16 0.0227 0.17 .87
∆GDP(-2) -0.2367 -2.94 <.01 -0.2943 -2.32 .02
∆GDP(-3) -0.0451 -0.54 .59
∆FDI 0.0932 0.33 .74 0.0598 0.23 .82
∆FDI(-1) 0.1950 0.83 .41 0.2609 0.96 .34
∆FDI(-2) 0.0042 0.02 .98 0.1826 0.66 .51
∆FDI(-3) -0.1089 -0.88 .38 0.0241 0.16 .87
Trend -1.03E+9 -0.89 .38
Constant 1.20E+11 1.20 .23 1.13E+11 1.40 .16Note: Akaike criterion (AIC) was used for optimal lag length selection. ARDL(3,4) model with constant and ARDL(4,4) model with trend were selected.
Source: Author’s calculation

V. Bilas: What is the Relationship Between FDI and Economic Growth? Evidence from EU15 CountriesZbornik Veleučilišta u Rijeci, Vol. 8 (2020), No. 1, pp. 253-281
263
Table 8. Panel ARDL (PMG) estimation (dependent variable: GDP)
VariableConstant Linear trend
Coefficient t-statistic P-value Coefficient t-statistic P-value
Long run equation
FDIP 9.51E+10 4.60 <.01 8.22E+10 8.13 <.01
Short run equation
Cointegrating equation -0.0448 -1.28 .20 -0.1280 -2.28 .02
∆FDIP -6.65E+8 -0.29 .77 -4.71E+9 -1.60 .11
Trend 2.68E+9 1.29 .20
Constant 9.26E+10 1.31 .19 1.98E+11 1.98 .05
Note: Schwarz criterion (SIC) was used for optimal lag length selection. ARDL(1,1) model was selected.
Source: Author’s calculation
Table 9. Panel ARDL (PMG) estimation (dependent variable: GDP)
VariableConstant Linear trend
Coefficient t-statistic P-value Coefficient t-statistic P-value
Long run equation
FDIP 8.98E+10 4.09 <.01 6.70E+10 7.00 <.01
Short run equation
Cointegrating equation -0.0424 -1.16 .25 -0.1408 -2.16 .03
∆GDP(-1) 0.1914 2.61 <.01 0.1735 2.90 <.01
∆FDIP -3.05E+8 -0.13 .90 -4.03E+9 -1.44 .15
Trend 3.35E+9 1.35 .18
Constant 8.78E+10 1.18 .24 2.27E+11 1.90 .06
Note: Akaike criterion (AIC) was used for optimal lag length selection. ARDL(2,1) model was selected.
Source: Author’s calculation

V. Bilas: What is the Relationship Between FDI and Economic Growth? Evidence from EU15 CountriesZbornik Veleučilišta u Rijeci, Vol. 8 (2020), No .1, pp. 253-281
264
Table 10. Panel ARDL (PMG) estimation (dependent variable: LogGDP)
VariableConstant Linear trend
Coefficient t-statistic P-value Coefficient t-statistic P-value
Long run equation
LogFDI 0.8026 0.14 .89 0.0292 7.34 <.01
Short run equation
Cointegrating equation -0.0005 -0.52 .61 -0.1643 -2.44 .02
∆LogFDI 0.0020 1.66 .10 -0.0021 -1.93 .05
Trend 0.0010 0.92 .36
Constant 0.0190 2.51 .01 4.4572 2.44 .02
Note: Schwarz criterion (SIC) was used for optimal lag length selection. ARDL(1,1) model was selected.
Source: Author’s calculation
Table 11. Panel ARDL (PMG) estimation (dependent variable: LogGDP)
VariableConstant Linear trend
Coefficient t-statistic P-value Coefficient t-statistic P-value
Long run equation
LogFDI 0.0321 1.73 .09 2.6923 0.05 .96
Short run equation
Cointegrating equation -0.0477 -2.27 .02 -0.0004 0.87 .39
∆LogGDP(-1) 0.2351 3.32 <.01 0.2094 2.99 <.01
∆LogFDI 0.0011 0.95 .34 0.0027 2.14 .03
Trend 0.0003 1.03 .30
Constant 1.2669 2.34 .02 0.0167 0.98 .33
Note: Akaike criterion (AIC) was used for optimal lag length selection. ARDL(2,1) model was selected.
Source: Author’s calculation

V. Bilas: What is the Relationship Between FDI and Economic Growth? Evidence from EU15 CountriesZbornik Veleučilišta u Rijeci, Vol. 8 (2020), No. 1, pp. 253-281
265
Table 12. Panel ARDL (PMG) estimation (dependent variable: LogGDP)
VariableConstant Linear trend
Coefficient t-statistic P-value Coefficient t-statistic P-value
Long run equation
LogFDIP 0.1226 3.74 <.01 0.4398 5.76 <.01
Short run equation
Cointegrating equation -0.0523 -1.95 .05 -0.0408 -1.71 .09
∆LogFDIP 0.0006 0.19 .85 -0.0064 -1.19 .23
Trend -0.0005 -0.49 .62
Constant 1.4660 1.95 .05 1.13 1.73 .09
Note: Schwarz criterion (SIC) was used for optimal lag length selection. ARDL(1,1) model was selected.
Source: Author’s calculation
Table 13. Panel ARDL (PMG) estimation (dependent variable: LogGDP)
VariableConstant Linear trend
Coefficient t-statistic P-value Coefficient t-statistic P-value
Long run equation
LogFDIP 0.1350 3.33 <.01 0.3245 4.87 <.01
Short run equation
Cointegrating equation -0.0595 -2.48 .01 -0.0443 -2.12 .04
∆LogGDP(-1) 0.2382 2.71 <.01 0.1460 2.07 .04
∆LogGDP(-2) -0.2855 -6.53 <.01
∆LogFDIP 0.0005 0.13 .90 -0.0034 -0.99 .32
Trend 1.58E-5 0.03 .98
Constant 1.65 2.44 .02 1.22 2.14 .04
Note: Akaike criterion (AIC) was used for optimal lag length selection. ARDL(3,1) model with constant and ARDL(2,1)
model with trend were selected.
Source: Author’s calculation
The coefficient of the error correction term (ECT) goes in line with the underlying convergence assumptions in order to validate the long-run equilibrium nature of the model. These include that the ECT be negative, significant, and less than one (Pesaran et al., 1999). We are commenting on the results of models based on Akaike information criterion presented in Tables 11 and 13. The reason is that the Schwarz information criterion tends to underestimate optimal lag length.

V. Bilas: What is the Relationship Between FDI and Economic Growth? Evidence from EU15 CountriesZbornik Veleučilišta u Rijeci, Vol. 8 (2020), No .1, pp. 253-281
266
For instance Akaike criterion suggested ARDL(3,1), while Schwarz criterion suggested ARDL(1,1) model. As a consequence of such underestimation there could be some residual autocorrelation. While Akaike information criterion tends to overestimate the optimal lag length, this has less serious consequence on the reliability of the estimated panel ARDL model.
The cointegrating equations (model with trend: –0.0443 and model with constant: –0.0595) in Table 13 explain that the rate of adjustment back to (long-run) equilibrium is 4.43% (model with trend) and 5.95% (model with constant) which are significant at 4% and 1 % significance level respectively. In the short-run, only the coefficients of each of LogGDP(–1) and LogGDP(–2) are each significantly related to LogGDP, at less than 1% significance level.
More mixed results are presented in Table 11 for LogFDI series. Here we have the cointegrating equation (model with constant: –0.0477) explains that the rate of adjustment back to (long-run) equilibrium is 4.77% which are significant at 2% significance level. However, the ECT in the model with trend is not statistically significant, though it is negative and less than one. In the short-run, only the coefficient of LogGDP(–1) is significantly related to LogGDP, at less than 1% significance level.
The panel ARDL is a long-run estimate of the equilibrium analysis, and therefore the long-run coefficients are usually given higher importance. The long-run coefficients are all positive, but not all of them are statistically significant. For instance the long-run coefficient for LogFDI (0.029) is statistically significant only in the model with trend (Table 9) but not in other models (Table 11). In case of LogFDIP series long-run coefficients are statistically significant in all four models in Tables 12 and 13, varying between 0.1226 and 0.4398. These coefficients indicate that 1% increase in LogFDIP (logarithm of FDI to GDP) increases LogGDP between 0.1226% and 0.4398%.
Therefore, the cointegration test based on panel ARDL (PMG) model confirm that there are long-term relationship between LogGDP, LogFDI and LogFDIP series in case of 15 “old” European Union countries for the period being investigated (2002-2018).
3. 3 Granger causality analysis
We tested whether there is a causal relationship among the variables using the panel Granger non-causality test developed by Dumitrescu and Hurlin (2012). The null hypothesis is that variable X does not homogeneously cause variable Y, against the alternative hypothesis that X does Granger-cause Y for at least one panel. Table 14 gives the results of this test.

V. Bilas: What is the Relationship Between FDI and Economic Growth? Evidence from EU15 CountriesZbornik Veleučilišta u Rijeci, Vol. 8 (2020), No. 1, pp. 253-281
267
Table 14. Dumitrescu-Hurlin panel causality test
Null hypothesis Decision*
rGDP does not Granger-cause FDI 2.58 4.34 (.07) 2.55 (.07) No causality
FDIP does not Granger-cause rGDP 1.50 1.36 (.31) 0.51 (.61) No causality
rGDP does not Granger-cause FDIP 2.46 4.01 (.09) 2.33 (.09) No causality
LogFDI does not Granger-cause ∆LogGDP 1.98 2.68 (.09) 1.52 (.10) No causality
∆LogGDP does not Granger-cause LogFDI 1.63 1.72 (.20) 0.83 (.27) No causality
LogFDIP does not Granger-cause ∆LogGDP 1.22 0.33 (.75) -0.15 (.92) No causality
∆LogGDP does not Granger-cause LogFDIP 2.46 3.99 (.04) 2.45 (.04) Causality
LogFDI does not Granger-cause LogGDP 1.66 1.82 (.26) 0.97 (.39) No causality
LogGDP does not Granger-cause LogFDI 2.30 3.55 (.09) 2.24 (.09) No causality
LogFDIP does not Granger-cause LogGDP 1.46 1.25 (.38) 0.56 (.56) No causality
LogGDP does not Granger-cause LogFDIP 1.66 1.82 (.40) 0.97 (.50) No causality
∆LogFDI does not Granger-cause ∆LogGDP 1.79 2.17 (.15) 1.56 (.28) No causality
∆LogGDP does not Granger-cause ∆LogFDI 1.64 1.77 (.01) 0.87 (.02) Causality
∆LogFDIP does not Granger-cause ∆LogGDP 1.13 0.36 (.77) -0.13 (.92) No causality
∆LogGDP does not Granger-cause ∆LogFDIP 1.89 2.42 (.13) 1.33 (.19) No causalityNote: P-values were computed using 100 bootstrap replications and provided in the brackets. BIC criterion used to
decide on the optimal number of lags. * Decision was made based on the 5% significance level.
Source: Author’s calculation
According to Table 14 there is no causal relationship between any two variables considered with only two exceptions. When investigated the causal relationship between GDP growth rate (∆LogGDP) and FDI growth rate (∆LogFDI) we can say that GDP growth rate cause FDI growth rate at least of 2% significance level, while FDI growth rate does not cause GDP growth rate. Thus, there is a unidirectional causal relationship between the GDP growth rate and FDI growth rate. Similarly, there is a unidirectional causal relationship between the GDP growth rate and LogFDI at 4% significance level.
Expectation is that if there is a cointegration between two series then they are also causally related. However, mixed results of cointegration test based on ARDL (PMG) model and the Dumitrescu-Hurlin panel causality test do not confirm this, which could be caused by lower power of these tests and weak relationship between series. Therefore we can say that there is only a weak evidence of the positive impact FDI has on GDP growth in the “old” European Union member countries.
4. CONCLUSION
The aim of this paper was to examine the relationship between FDI and economic growth in EU15 countries over the period 2002-2018. Based on the conducted analysis following conclusions can be drawn. Results of the Pesaran CIPS panel unit root test indicated that all series considered

V. Bilas: What is the Relationship Between FDI and Economic Growth? Evidence from EU15 CountriesZbornik Veleučilišta u Rijeci, Vol. 8 (2020), No .1, pp. 253-281
268
are stationary, i.e. I(0), with two exceptions. This test indicated that series GDP and LogGDP are with unit root, i.e. I(1). Since level of GDP series is I(1) and levels of FDI and FDIP are I(0) only the ARDL modelling approach to cointegration could be used, because this approach allows series to be different order of integration. Estimated panel ARDL (PMG) model found some evidence that there are long-run equilibrium between LogGDP, LogFDI and LogFDIP series. The rate of adjustment back to equilibrium is between 4.43% and 5.95%. The long-run coefficients are all positive, but not all of them are statistically significant. For instance the long-run coefficient for LogFDI (0.029) is statistically significant only in the model with trend, but not in other models. In case of LogFDIP series long-run coefficients are statistically significant in all four models, varying between 0.1226 and 0.4398. These coefficients indicate that 1% increase in LogFDIP (logarithm of FDI to GDP) increases LogGDP between 0.1226% and 0.4398%. Results of Dumitrescu-Hurlin panel causality test indicated that there is only unidirectional causal relationship from GDP growth rate to FDI growth rate, and from GDP growth rate to LogFDIP. There is no other causal relationship between any other two variables considered. Conclusively, there is only a weak evidence that FDI had statistically significant impact on the GDP in EU15 countries for the period being investigated. Despite its insights and accomplishments, this research has some limitations, for example number of variables which could have impact on FDI and GDP should be extended. Therefore, it is advised to include in future research other variables (for example, institutional quality, human capital, market size, unit labour costs, openness of the economy, etc.). There is also a need to extend the period of research and/or to use quarterly/monthly data if possible in order to increase the number of observations. Also, single-country studies are needed, due to the heterogeneous relationship between FDI and growth.
REFERENCES
Akaike, H. (1974) “A new look at the statistical model identification”, IEEE Transactions on Automatic Control, 19(6), pp. 716–723. http://dx.doi.org/10.1109/tac.1974.1100705
Alfaro, L., Chanda, A., Kalemli-Ozcan, S., Sayek, S. (2010) “Does Foreign Direct Investment Promote Economic Growth? Exploring the Role of Financial Markets on Linkages?” Journal of Development Economics, 91(2), pp. 242-256. http://dx.doi.org/10.1016/j.jdeveco.2009.09.004
Angelopoulou, A., Liargovas, P. (2014) “Foreign Direct Investment and Growth: EU, EMU, and Transition Economies”, Journal of Economic Integration, 29(3), pp. 470-495. http://dx.doi.org/10.11130/jei.2014.29.3.470
Bilas, V. (2007) “Regional economic integrations and capital movement – measuring the level of capital mobility”, Zbornik radova Ekonomskog fakulteta u Rijeci, 25(2), pp. 269-290
Borensztein, E., De Gregorio, J., Lee, J-W. (1998) “How does foreign direct investment affect economic growth?”, Journal of International Economics, 45(1998), pp. 115–135
Breitung, J. (2000). “The Local Power of Some Unit Root Tests for Panel Data,” in B. Baltagi (ed.), Advances in Econometrics, (15): Nonstationary Panels, Panel Cointegration, and Dynamic Panels, Amsterdam: JAI Press, pp. 161–178. http://dx.doi.org/10.1016/s0731-9053(00)15006-6
Breitung, J. (2002). “Nonparametric tests for unit roots and cointegration”, Journal of Econometrics, 108(2), pp. 343–363. http://dx.doi.org/10.1016/s0304-4076(01)00139-7
V. Bilas: What is the Relationship Between FDI and Economic Growth? Evidence from EU15 CountriesZbornik Veleučilišta u Rijeci, Vol. 8 (2020), No. 1, pp. 253-281
269
Carbonell, J. B., Werner, R. A. (2018) “Does Foreign Direct Investment Generate Economic Growth? A New Empirical Approach Applied to Spain”, Economic Geography, 94(4), pp. 425-456. http://dx.doi.org/10.1080/00130095.2017.1393312
Carstensen, K., Toubal, F. (2004) “Foreign direct investment in Central and Eastern European countries: a dynamic panel analysis”, Journal of Comparative Economics, 32(1), pp. 3–22. https://doi.org/10.1016/j.jce.2003.11.001
Chowdhury, A., Mavrotas, G. (2006) “FDI and Growth: What Causes What?”, The World Economy, 29(1), pp. 9-19. http://dx.doi.org/10.1111/j.1467-9701.2006.00755.x
De Mello, L. R. (1997) “Foreign direct investment in developing countries and growth: A selective survey”, The Journal of Development Studies, 34(1), pp. 1-34. http://dx.doi.org/10.1080/00220389708422501
De Mello, L. R. (1999) “Foreign direct investment-led growth: evidence from time series and panel data”, Oxford Economic Papers, 51(1), pp. 133-151. http://dx.doi.org/10.1093/oep/51.1.133
Dhakal, D., Mixon, F., Upadhyaya, K. (2007) “Foreign direct investment and transition economies: empirical evidence from a panel data estimator”, Economics Bulletin, 6(33), pp. 1-9
Dickey, D. A., Fuller, W. A. (1981) “Likelihood ratio statistics for autoregressive time series with a unit root”, Econometrica, 49(4), pp. 1057–1072. http://dx.doi.org/10.2307/1912517
Dickey, D. A., W. A. Fuller (1979) “Distribution of the Estimators for Autoregressive Time Series with a Unit Root”, Journal of the American Statistical Association, 74(366a), pp. 427–431. http://dx.doi.org/10.1080/01621459.1979.10482531
Dumitrescu, E. I., Hurlin, C. (2012) “Testing for Granger non-causality in heterogeneous panels”, Economic Modelling, 29(4), pp. 1450-1460. http://dx.doi.org/10.1016/j.econmod.2012.02.014
Ekananda, M., Parlinggoman, D. J. (2017) “The Role of High-Tech Exports and of Foreign Direct Investments (FDI) on Economic Growth”, European Research Studies Journal, XX(4A), pp. 194-212.
Gürsoy, F., Sekreter, A., Kalyoncu, H. (2013) „FDI and Economic Growth Relationship Based on Cross-Country Comparison“, International Journal of Economics and Financial Issues, 3(2), pp. 519-524
Hadri, K. (2000) “Testing for Stationarity in Heterogeneous Panel Data”, Econometric Journal, 3(2), pp. 148–161. http://dx.doi.org/10.1111/1368-423x.00043
Hlavacek, P., Bal-Domanska, B. (2016) “Impact of Foreign Direct Investment on Economic Growth in Central and Eastern European Countries”, Inzinerine Ekonomika-Engineering Economics, 27(3), pp. 294-303. http://dx.doi.org/10.5755/j01.ee.27.3.3914
Hunady, J., Orviska, M. (2014) “Determinants of Foreign Direct Investment in EU countries – Do Corporate Taxes Really Matter?”, Procedia Economics and Finance, 12, pp. 243-250. http://dx.doi.org/10.1016/s2212-5671(14)00341-4
Iamsiraroj, S., Doucouliagos, H. (2015) “Does growth attract FDI?”, Kiel Institute for the World Economy, Economics Discussion Papers, No. 2015-18. http://dx.doi.org/10.5018/economics-ejournal.ja.2015-19
Im, K. S., M. H. Pesaran, Y. Shin (2003) “Testing for Unit Roots in Heterogeneous Panels”, Journal of Econometrics, 115(1), pp. 53–74. http://dx.doi.org/10.1016/s0304-4076(03)00092-7
Iqbal, N., Ahmad, N., Haider, Z., Anwar, S. (2013) “Impact of foreign direct investment (FDI) on GDP: A Case study from Pakistan”, International Letters of Social and Humanistic Sciences, 16, pp. 73-80. http://dx.doi.org/10.18052/www.scipress.com/ilshs.16.73
Jirasavetakul, L-B. F., Rahman, J. (2018) “Foreign Direct Investment in New Member States of the EU and Western Balkans: Taking Stock and Assessing Prospects”, IMF Working Paper, 18(187), p.1. http://dx.doi.org/10.5089/9781484373323.001
Johansen, S. (1991) “Estimation and Hypothesis Testing of Cointegration Vectors in Gaussian Vector Autoregressive Models”, Econometrica, 59 (6), pp. 1551–1580. http://dx.doi.org/10.2307/2938278
Jude, C., Pop Silaghi, M. I. (2016) “Employment effects of foreign direct investment: New evidence from Central and Eastern European countries”, International Economics, 145(2016), pp. 32–49. https://doi.org/10.1016/j.inteco.2015.02.003
V. Bilas: What is the Relationship Between FDI and Economic Growth? Evidence from EU15 CountriesZbornik Veleučilišta u Rijeci, Vol. 8 (2020), No .1, pp. 253-281
270
Kersan-Skabic, I. (2013) “Institutional Development as a Determinant of FDI Attractiveness in Southeast Europe”, Drustvena istrazivanja, 22(2), pp. 215-235. http://dx.doi.org/10.5559/di.22.2.01
Kikerkova, I. et al. (2018) “Vector Error Correction Model on FDI and their Impact in the Republic of Macedonia”, Zagreb International Review of Economics & Business, 21(2), pp. 19-35. http://dx.doi.org/10.2478/zireb-2018-0012
Kurecic, P., Kozina, G. (2017) “The Correlation between the FDI and the GDP in the EU15 Member States in the period 1980-2014”, Tehnicki vjesnik, 24(2), pp. 521-524. http://dx.doi.org/10.17559/tv-20150920174332
Levin, A., Lin, C. F., Chu, C. (2002) “Unit Root Tests in Panel Data: Asymptotic and Finite-Sample Properties”, Journal of Econometrics, 108(1), pp. 1-24. http://dx.doi.org/10.1016/s0304-4076(01)00098-7
Mahmoodi, M., Mahmoodi, E. (2016) “Foreign direct investment, exports and economic growth: evidence from two panels of developing countries”, Economic Research-Ekonomska Istrazivanja, 29(1), pp. 938-949. http://dx.doi.org/10.1080/1331677x.2016.1164922
Ozturk, I. (2007) “Foreign Direct Investment - Growth Nexus: A Review of the Recent Literature”, International Journal of Applied Econometrics and Quantitative Studies, 4-2, pp. 79-98
Pesaran, M. H. (2007) “A simple panel unit root test in the presence of cross-section dependence”, Journal of Applied Econometrics, 22(2), pp. 265–312. http://dx.doi.org/10.1002/jae.951
Pesaran, M. H., Shin, Y. (1999) “An Autoregressive Distributed-Lag Modelling Approach to Cointegration Analysis,” in Strøm, S. (ed.) Econometrics and Economic Theory in the 20th Century: The Ragnar Frisch Centennial Symposium. Cambridge: Cambridge University Press (Econometric Society Monographs), pp. 371–413. http://dx.doi.org/10.1017/ccol521633230.011
Pesaran, M. H., Shin, Y., Smith, R. J. (2001) “Bounds testing approaches to the analysis of level relationships”, Journal of Applied Econometrics, 16(3), pp. 289-326. http://dx.doi.org/10.1002/jae.616
Rahaman, A., Chakraborty, S. (2015) “Effects of Foreign Direct Investment on GDP: Empirical Evidence from Developing Country”, Advances in Economics and Business, 3(12), pp. 587-592
Sârbu, M-A., Carp, L. (2015) “The Impact of Foreign Direct Investment on Economic Growth: The Case of Romania”, Economica, 11(4), pp. 127-137
Schmitt, D., Alexiou, C. (2016) “On the FDI-led Growth Hypothesis: Empirical Evidence from Ireland”, The Empirical Economics Letters, 15(2), pp. 135-144
Schwarz, G. E. (1978) “Estimating the dimension of a model”, The Annals of Statistics, 6 (2), pp. 461–464. http://dx.doi.org/10.1214/aos/1176344136
Sokang, K. (2018) “The Impact of Foreign Direct Investment on the Economic Growth in Cambodia: Empirical Evidence”, International Journal of Innovation and Economic Development, 4(5), pp. 31-38. http://dx.doi.org/10.18775/ijied.1849-7551-7020.2015.45.2003
Suliman, A. H., Elian, M. I., Ali, H. E. (2018) “Endogenous Specification of FDI and Economic Growth: Cross-Economies’ Evidence”, International Journal of Business, 23(1), pp. 89-109
Tang, D. (2015) “Has the Foreign Direct Investment Boosted Economic Growth in the European Union Countries?”, Journal of International and Global Economic Studies, 8(1), pp. 21-50
UNCTAD (2018) World Investment Report 2018. New York and Geneva: United Nations
UNCTAD (2019) World Investment Report 2019. New York and Geneva: United Nations
V. Bilas: What is the Relationship Between FDI and Economic Growth? Evidence from EU15 CountriesZbornik Veleučilišta u Rijeci, Vol. 8 (2020), No. 1, pp. 253-281
271
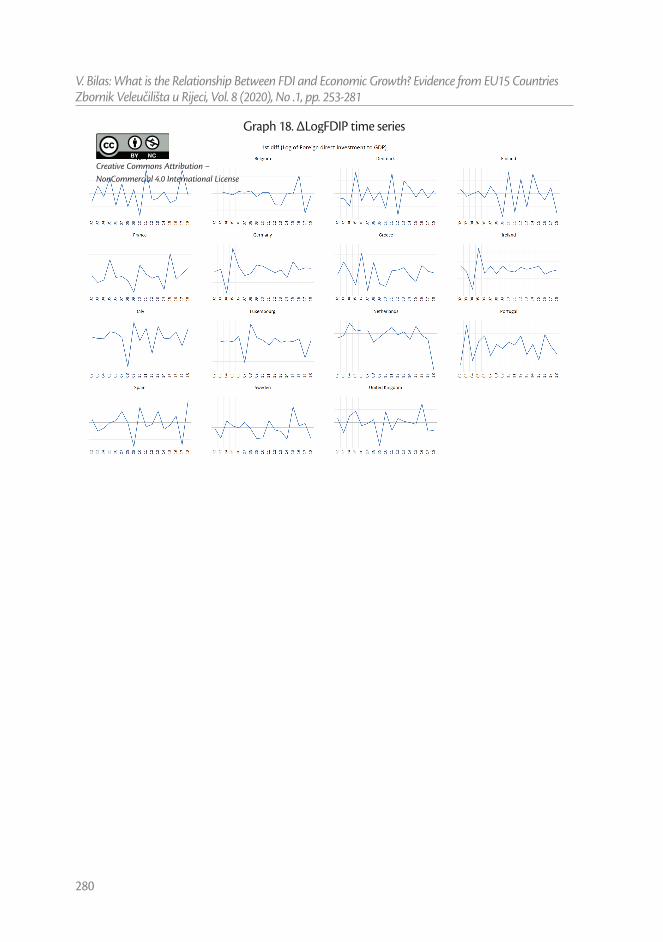
ANNEX 1. LINE GRAPHS
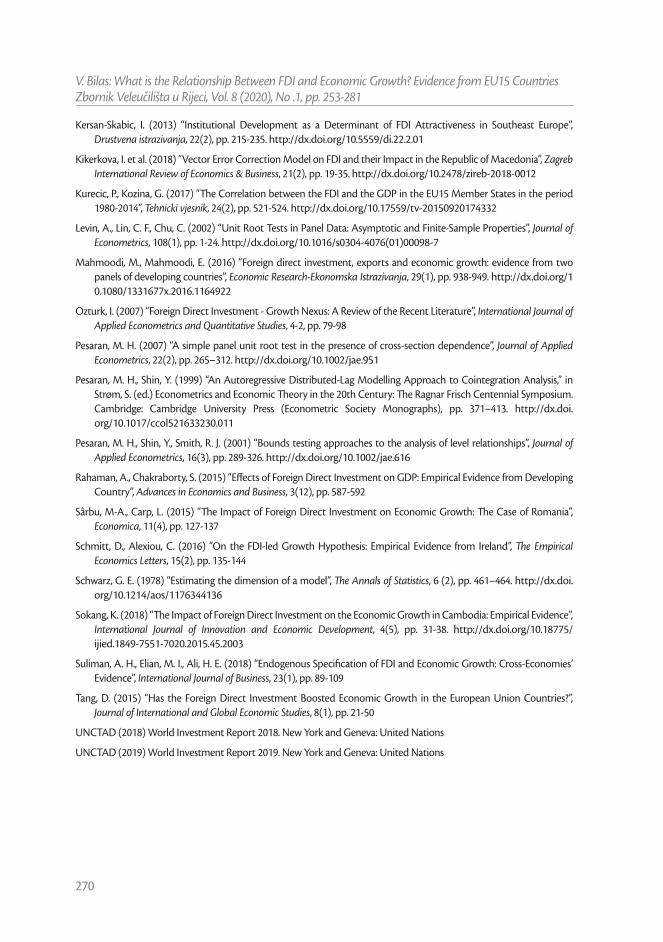
Line graphs for all variables in Table 1 are presented in Figures 1 to 12. The first three figures show the first three series: GDP, FDI and FDIP, the next three annual growth rates, then three natural logarithm series, and the last three figures display the first difference of the logarithm series.
Graph 1. GDP time series

V. Bilas: What is the Relationship Between FDI and Economic Growth? Evidence from EU15 CountriesZbornik Veleučilišta u Rijeci, Vol. 8 (2020), No .1, pp. 253-281
272
Graph 2. FDI time series
Graph 3. FDIP time series
V. Bilas: What is the Relationship Between FDI and Economic Growth? Evidence from EU15 CountriesZbornik Veleučilišta u Rijeci, Vol. 8 (2020), No. 1, pp. 253-281
273
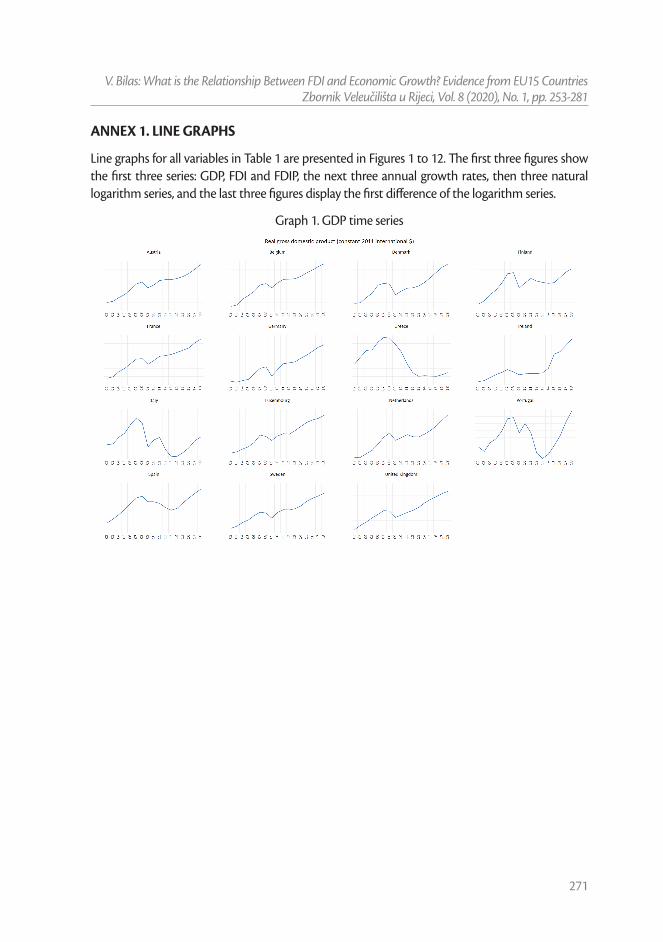
Graph 4. GDP growth rate
Graph 5. FDI growth rate

V. Bilas: What is the Relationship Between FDI and Economic Growth? Evidence from EU15 CountriesZbornik Veleučilišta u Rijeci, Vol. 8 (2020), No .1, pp. 253-281
274
Graph 6. FDIP growth rate
Graph 7. LogGDP time series

V. Bilas: What is the Relationship Between FDI and Economic Growth? Evidence from EU15 CountriesZbornik Veleučilišta u Rijeci, Vol. 8 (2020), No. 1, pp. 253-281
275
Graph 8. LogFDI time series
Graph 9. LogFDIP time series
V. Bilas: What is the Relationship Between FDI and Economic Growth? Evidence from EU15 CountriesZbornik Veleučilišta u Rijeci, Vol. 8 (2020), No .1, pp. 253-281
276
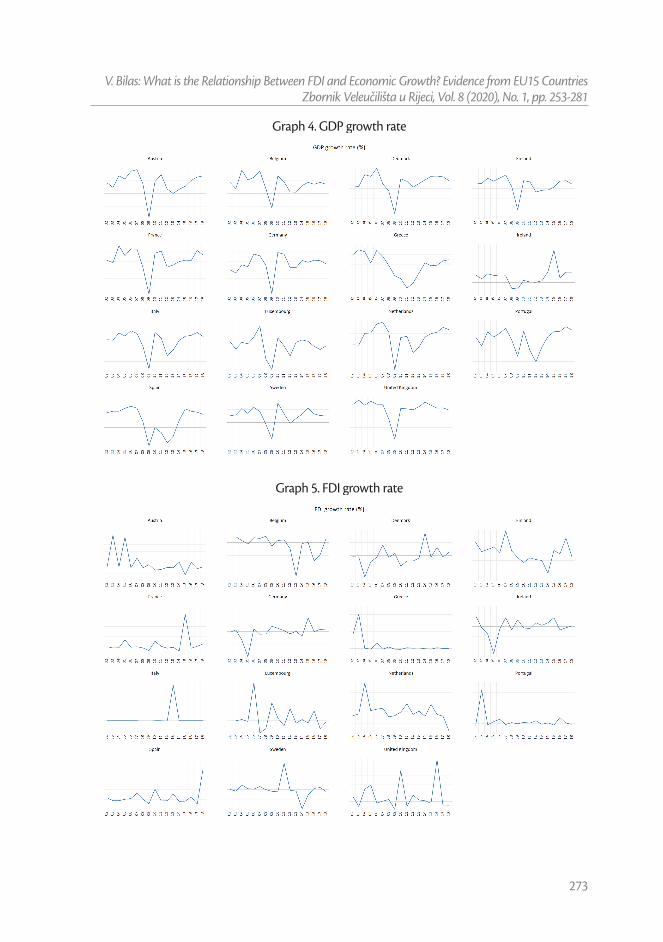
Graph 10. ∆GDP time series
Graph 11. ∆FDI time series

V. Bilas: What is the Relationship Between FDI and Economic Growth? Evidence from EU15 CountriesZbornik Veleučilišta u Rijeci, Vol. 8 (2020), No. 1, pp. 253-281
277
Graph 12. ∆FDIP time series
Graph 13. ∆rGDP time series

V. Bilas: What is the Relationship Between FDI and Economic Growth? Evidence from EU15 CountriesZbornik Veleučilišta u Rijeci, Vol. 8 (2020), No .1, pp. 253-281
278
Graph 14. ∆rFDI time series
Graph 15. ∆rFDIP time series

V. Bilas: What is the Relationship Between FDI and Economic Growth? Evidence from EU15 CountriesZbornik Veleučilišta u Rijeci, Vol. 8 (2020), No. 1, pp. 253-281
279
Graph 16. ∆LogGDP time series
Graph 17. ∆LogFDI time series
V. Bilas: What is the Relationship Between FDI and Economic Growth? Evidence from EU15 CountriesZbornik Veleučilišta u Rijeci, Vol. 8 (2020), No .1, pp. 253-281
280
Graph 18. ∆LogFDIP time series
Creative Commons Attribution – NonCommercial 4.0 International License

V. Bilas: What is the Relationship Between FDI and Economic Growth? Evidence from EU15 CountriesZbornik Veleučilišta u Rijeci, Vol. 8 (2020), No. 1, pp. 253-281
281
Prethodno priopćenje https://doi.org/10.31784/zvr.8.1.8 Datum primitka rada: 3. 12. 2019. Datum prihvaćanja rada: 30. 1. 2020.
KOJA JE POVEZANOST IZMEĐU INOZEMNIH IZRAVNIH ULAGANJA I EKONOMSKOG RASTA?
PRIMJER ZEMALJA EU15Vlatka Bilas
Dr. sc., redovita profesorica, Sveučilište u Zagrebu, Ekonomski fakultet, Katedra za međunarodnu ekonomiju, Trg J. F. Kenedyja 6, 10 000 Zagreb, Hrvatska;
e-mail: [email protected]
SAŽETAK
Cilj rada je istražiti povezanost inozemnih izravnih ulaganja (FDI) i ekonomskog rasta u zemljama EU15 tijekom razdoblja 2002-2018. EU15 čini skupina zemalja koje su ušle u Europsku uniju prije najvećeg proširenja 2004. godine, a posljednji put 1995. godine (Austrija, Belgija, Danska, Finska, Francuska, Njemačka, Grčka, Irska, Italija, Luksemburg, Nizozemska, Portugal, Španjolska, Švedska i Ujedinjeno Kraljevstvo). Zaključci iz rada doprinose postojećoj literaturi o utjecaju inozemnih izravnih ulaganja na ekonomski rast. U radu se koriste testovi jediničnih korijena, testovi panel kointegracije (ARDL model) i Grangerova uzročnost. Prema procijenjenom ARDL modelu postoji dugotrajna ravnoteža između LogGDP, LogFDI i LogFDIP (logaritam udjela FDI u BDP-u) serija. Stopa prilagođavanja vraćanja u ravnotežu je između 4,43% i 5,95%. Svi koeficijenti su pozitivni u dugom roku, ali nisu svi statistički značajni. U slučaju LogFDIP serije, koeficijenti su statistički značajni i variraju između 0,1226 i 0,4398. Ti koeficijenti pokazuju da porast LogFDIP od 1% povećava LogGDP između 0,1226% i 0,4398% u dugom roku. Rezultati Dumitrescu-Hurlin testa uzročnosti pokazali su kako postoji samo jednosmjerna uzročna veza od stope rasta BDP-a i stope rasta FDI te stope rasta BDP-a prema LogFDIP. Zaključno, postoje slabi dokazi da su inozemna izravna ulaganja imala statistički značajan utjecaj na BDP u zemljama EU15.
Ključne riječi: testovi jediničnih korijena, testovi kointegracije, Grangerova uzročnost, EU15