Embed Size (px)
Citation preview
What is the safest means of transportation? An overview of online resources and what to make of them
Rudy Pont 13-December-2013

What is the safest means of transportation?
Ch
apte
r: A
bo
ut
me
1
Table of contents About me ................................................................................................................................................. 2
What is the safest means of transportation? .......................................................................................... 2
Aviation Safety - Worldwide .................................................................................................................... 3
ICAO ..................................................................................................................................................... 3
Accident definition .......................................................................................................................... 3
Actual figures ................................................................................................................................... 3
IATA ..................................................................................................................................................... 5
Accident definition .......................................................................................................................... 5
Hull loss definition ........................................................................................................................... 5
Actual figures ................................................................................................................................... 5
GSIE Harmonized Accident Rate .......................................................................................................... 6
Boeing statistical sumary ..................................................................................................................... 7
Scope ............................................................................................................................................... 7
Accident definition .......................................................................................................................... 7
Actual figures ................................................................................................................................... 8
Aviation Safety Network .................................................................................................................... 10
Accident definition ........................................................................................................................ 10
Actual figures ................................................................................................................................. 10
Ascend - FlightGlobal ......................................................................................................................... 11
EASA .................................................................................................................................................. 12
Aviation Safety – Europe ....................................................................................................................... 13
Conclusion on Aviation Safety ............................................................................................................... 14
Road safety ............................................................................................................................................ 15
United States/Global ......................................................................................................................... 15
Europe ............................................................................................................................................... 15
Pedestrians, cyclists and users of motorized two-wheelers ................................................................. 16
Railroad safety ....................................................................................................................................... 16
Maritime safety ..................................................................................................................................... 16
Conclusion ............................................................................................................................................. 17
Appendix: Infographics on global road safety 2013 (WHO) .................................................................. 18
References ............................................................................................................................................. 19
List of figures ......................................................................................................................................... 21

What is the safest means of transportation?
Ch
apte
r: A
bo
ut
me
2
About me Acting as a Flight Safety Officer for Thomas Cook Airlines (Belgium), I have
been involved in aviation safety since 2007. Combining my duties as an A320
First Officer with safety management gives me a unique insight in everyday
safety issues. In order to keep up-to-date with the latest industry trends, I try
to participate as much as possible in conferences, seminars, and other safety
relevant meetings.
Because EASA has set the deadline for Safety Management Systems (SMS) implementation to end of
October 2014, we are currently writing a Safety Management Manual (SMM), training people and
putting everything in place to achieve an effective SMS. Every now and then, some interesting
questions pop up during these training sessions. This paper is part of a collection which intends to
provide more elaborate answers and additional references to these questions.
What is the safest means of transportation? If you google this question, you probably end up with something like this:
“Flying is considered as the safest form of transport due to the fact that airplane accidents are less
frequent. Statistics show that it is about twice as safe as train and six times safer than car
transportation. However, when airplane accidents occur there is usually high fatalities.” (Ask.com,
2013)
Unfortunately only a few of the article I found made actual references to factual data or relevant
publications. So let’s try to find them ourselves.
What is the safest means of transportation?
Ch
apte
r: A
viat
ion
Saf
ety
- W
orl
dw
ide
3
Aviation Safety - Worldwide
ICAO
The first slide of our SMS training course is all about image and perception. Despite
the extensive coverage of aircraft accidents, most people are still convinced that
aviation remains the safest way to travel. But do the facts support this dogma?
First of all let us take a look at the global level. Each year the International Civil
Aviation Organization (ICAO) publishes an annual Safety Report. This report takes into account all
accidents as defined by ICAO Annex 13.
Accident definition
An occurrence associated with the operation of an aircraft which takes place between the time any
person boards the aircraft with the intention of flight until such time as all such persons have
disembarked, in which:
a. a person is fatally or seriously injured as a result of:
- being in the aircraft, or
- direct contact with any part of the aircraft, including parts which have become
detached from the aircraft, or
- direct exposure to jet blast, except when the injuries are from natural causes, self-
inflicted or inflicted by other persons, or when the injuries are to stowaways hiding
outside the areas normally available to the passengers and crew; or
b. the aircraft sustains damage or structural failure which: — adversely affects the structural
strength, performance or flight characteristics of the aircraft, and — would normally require
major repair or replacement of the affected component, except for engine failure or damage,
when the damage is limited to the engine, its cowlings or accessories; or for damage limited
to propellers, wing tips, antennas, tires, brakes, fairings, small dents or puncture holes in the
aircraft skin; or
c. the aircraft is missing or is completely inaccessible.
Note 1.— For statistical uniformity only, an injury resulting in death within thirty days of the date of
the accident is classified as a fatal injury by ICAO.
Note 2.— An aircraft is considered to be missing when the official search has been terminated and the
wreckage has not been located. (ICAO, 2001)
Actual figures
“The air transport system carried approximately 2.9 billion passengers in 2012, up 5 per cent since
2011. (…) The number of accidents (as defined in ICAO Annex 13) decreased by 21 per cent and the
global accident rate involving scheduled commercial operations for 2012 has decreased significantly
to 3.2 accidents per million departures. Compared to 2011, the number of fatalities decreased by 10
per cent making 2012 the safest year with regard to fatalities since 2004.” (ICAO, 2013)

What is the safest means of transportation?
Ch
apte
r: A
viat
ion
Saf
ety
- W
orl
dw
ide
4
Figure 1: ICAO Accident Records 2006-2012
You don’t need to have an IQ exceeding 130 to realize that flying isn’t equally safe throughout the
world. There are large variations between regions. While Africa accounted for only 5 per cent of total
accidents, 45 per cent of all fatalities occurred in that region. Keep in mind though that with a such a
good safety record in 2012 – only 9 fatal accidents worldwide! – statistics are easily distorted.
Figure 2: ICAO Accident statistics and rates 2012
What is the safest means of transportation?
Ch
apte
r: A
viat
ion
Saf
ety
- W
orl
dw
ide
5
IATA
The International Air Transport Association (IATA) uses a different definition of
what they consider to be an accident. Excluding business aviation, training and
test flights they focus on the actual (non-)scheduled civil air transport, the
calculated accident rate is only a fraction of ICAO’s number.
Accident definition
IATA defines an accident as an event where ALL of the following criteria are satisfied:
- Person(s) have boarded the aircraft with the intention of flight (either flight crew or passengers).
- The intention of the flight is limited to normal commercial aviation activities, specifically
scheduled/charter passenger or cargo service. Executive jet operations, training,
maintenance/test flights are all excluded.
- The aircraft is multi-engine, turbine powered, and has a certificated Maximum Take-Off Weight
(MTOW) of at least 5,700KG (12,540 lbs) for Turboprops and 15,000KG (33,000 lbs) for Jets.
- The aircraft has sustained major structural damage exceeding $ 1 million or 10% of the aircraft's
hull reserve value, whichever is lower, or has been declared a hull loss. (IATA, 2013)
Hull loss definition
- A hull loss is an accident in which the aircraft is destroyed
or substantially damaged and is not subsequently
repaired for whatever reason including a financial
decision of the owner. (IATA, 2013)
Actual figures
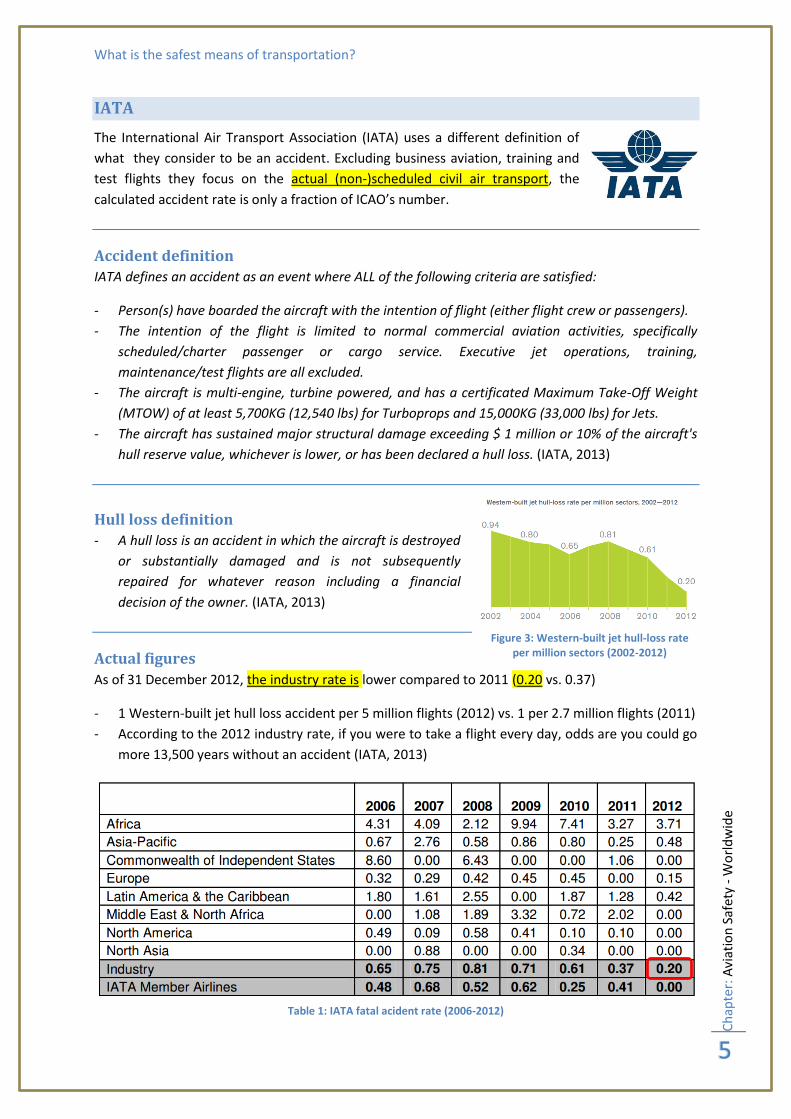
As of 31 December 2012, the industry rate is lower compared to 2011 (0.20 vs. 0.37)
- 1 Western-built jet hull loss accident per 5 million flights (2012) vs. 1 per 2.7 million flights (2011)
- According to the 2012 industry rate, if you were to take a flight every day, odds are you could go
more 13,500 years without an accident (IATA, 2013)
Table 1: IATA fatal acident rate (2006-2012)
Figure 3: Western-built jet hull-loss rate per million sectors (2002-2012)

What is the safest means of transportation?
Ch
apte
r: A
viat
ion
Saf
ety
- W
orl
dw
ide
6
GSIE Harmonized Accident Rate
So what is it now? 3,2 (ICAO) or 0,2 (IATA) per million departures? Well apparently the people at
ICAO and IATA agreed that it would be nice to have a single number for the worldwide aviation
accident rate per year.
In the spirit of promoting aviation safety, the Department of Transportation (DOT) of the United
States, the Commission of the European Union, the International Air Transport Association (IATA) and
ICAO signed a Memorandum of Understanding (MoU) on a Global Safety Information Exchange
(GSIE) on 28 September 2010 during the 37th Session of the ICAO Assembly. (…)The GSIE developed a
harmonized accident rate beginning in 2011. This was accomplished through close cooperation
between ICAO and IATA to align accident definitions, criteria and analysis methods used to calculate
the harmonized rate, which is considered a key safety indicator for commercial aviation operations
worldwide. (ICAO, 2013)
Note: Unfortunately I didn’t find what actual definitions are used.
Figure 4: GSIE Harmonized accident rate 2012
Conclusion: as expected the GSIE working group ended up somewhere in the middle at 2,4 accidents
per million departures.
What is the safest means of transportation?
Ch
apte
r: A
viat
ion
Saf
ety
- W
orl
dw
ide
7
Boeing statistical sumary
As if having 3 numbers isn’t enough, the Boeing company also publishes a
renowned report. They tried to have their definition in line with ICAO and the US
National Transportation Safety Board (NTSB). Boeing only takes into-account
Western built jet aircraft (see list below) and focusses on a 10 year period (2003-
2012) i.s.o. a yearly rate and distinguishes US and Canadian operators from the rest of the world.
Scope
The accident statistics presented in this summary are confined to worldwide commercial jet airplanes
that are heavier than 60,000 pounds maximum gross weight. Within that set of airplanes, there are
two groups excluded:
1) Airplanes manufactured in the Commonwealth of Independent States (CIS) or the Union of Soviet
Socialist Republics (USSR) are excluded because of the lack of operational data; and
2) Commercial airplanes operated in military service. (However, if a military-owned commercial jet
transport is used for civilian commercial service, those data will be included in this summary.)
The following airplanes are included in the statistics:
707/720 717 A300 BAe 146 F-28 Concorde Comet 4
727 DC-8 A300-600 Avro RJ-70/-85/-100 F-70 L-1011 Trident
737 DC-9 A310 CRJ-700/-900/-1000 F-100 BAC 1-11 Caravelle
747 DC-10/MD-10 A320/321/319/318 EMB-170/-175 Mercure
757 MD-11 A330 EMB-190/-195 CV-880/-990
767 MD-80/-90 A340 VC-10
777 A380
787
Accident definition
An occurrence associated with the operation of an airplane that takes place between the time any
person boards the airplane with the intention of flight and such time as all such persons have
disembarked, in which:
a. The airplane sustains substantial damage, or
b. The airplane is missing or is completely inaccessible, or
c. Death or serious injury results from:
– Being in the airplane, or
– Direct contact with the airplane or anything attached thereto, or
– Direct exposure to jet blast.
Excluding:
- Fatal and nonfatal injuries from natural causes, and
- Fatal and nonfatal self-infl icted injuries or injuries infl icted by other persons, and
What is the safest means of transportation?
Ch
apte
r: A
viat
ion
Saf
ety
- W
orl
dw
ide
8
- Fatal and nonfatal injuries of stowaways hiding outside the areas normally available to the
passengers and crew, and
- Nonfatal injuries resulting from atmospheric turbulence, normal maneuvering, loose objects,
boarding, disembarking, evacuation, and maintenance and servicing, and
- Nonfatal injuries to persons not aboard the airplane.
The following occurrences are not considered airplane accidents – those that are the result of
experimental test flights or the result of a hostile action, including sabotage, hijacking, terrorism, and
military action.
Note: (…) This publication excludes events that result in nonfatal injuries from atmospheric
turbulence, normal maneuvering, etc.; nonfatal injuries to persons not aboard the airplane; and any
events that result from an experimental test flight or from hostile action, such as sabotage, hijacking,
terrorism, and military action.
Actual figures
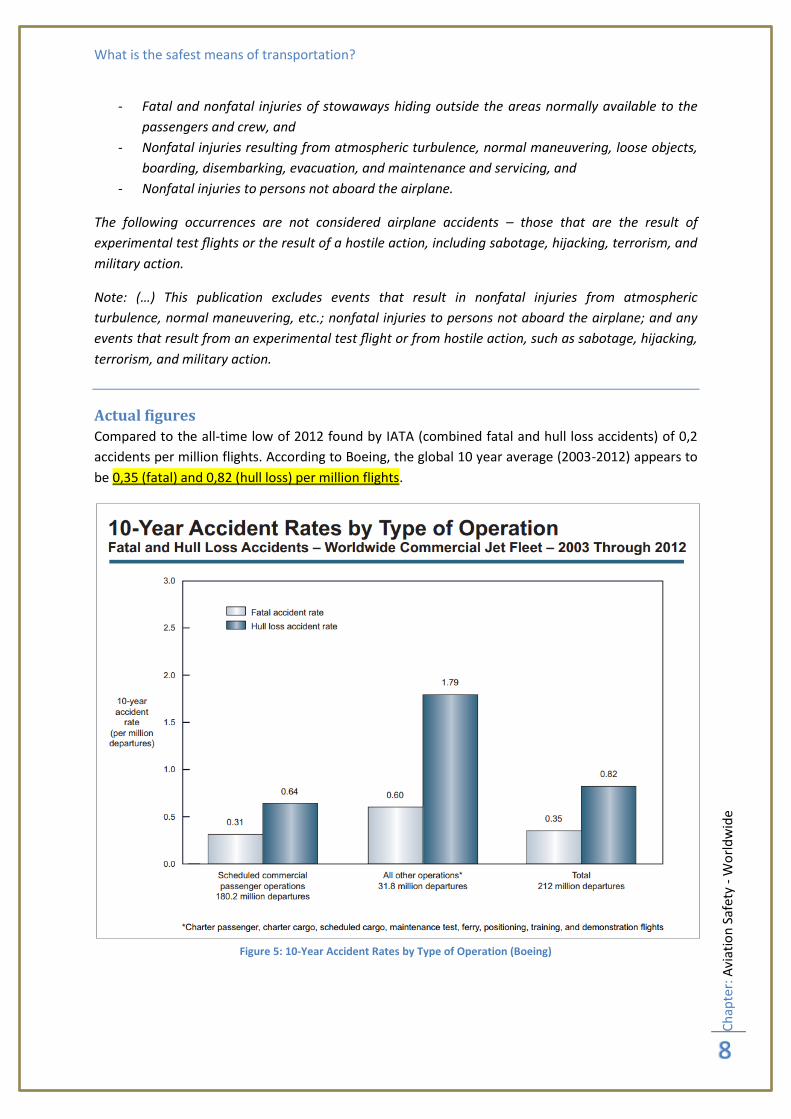
Compared to the all-time low of 2012 found by IATA (combined fatal and hull loss accidents) of 0,2
accidents per million flights. According to Boeing, the global 10 year average (2003-2012) appears to
be 0,35 (fatal) and 0,82 (hull loss) per million flights.
Figure 5: 10-Year Accident Rates by Type of Operation (Boeing)

What is the safest means of transportation?
Ch
apte
r: A
viat
ion
Saf
ety
- W
orl
dw
ide
9
Figure 6: Accident Rates and Onboard fatalities by Year 1959-2012 (Boeing)
Boeing also presents figures by flight phase. With the rise in runway excursions and loss of control In
Flight (LOC-I) over the last years it comes as no surprise that the majority of the accidents (41% of
fatal accidents and 33% of on-board fatalities) happens during final approach and landing.
Figure 7: Fatal Accidents and Onboard Fatalities by Phase of Flight 2003-2012 (Boeing)

What is the safest means of transportation?
Ch
apte
r: A
viat
ion
Saf
ety
- W
orl
dw
ide
1
0
Aviation Safety Network
The last resource I want to mention is the Aviation Safety Network (ASN). Although not an official
authority, this database is considered a trustworthy source of information. Most of the information
contained on the ASN is based on information from official sources (authorities, safety boards).
Sources used as a basis for the accident database are aircraft production lists, ICAO Aircraft Accident
Digests since 1952, and NTSB, TSB etc. For a specific list of publications used, check out the
references list. (Aviation Safety Network, 2013)
Accident definition
ASN uses the ICAO Annex 13 definition (see page 3), but excludes corporate jets and takes into
account only 14+ seat aircraft.
Actual figures
Most of the time we are speaking in terms of rates i.e. number of accidents divided by number of
flights. This is logical, because absolute figures don’t mean a lot. However it is interesting to see that
there is a distinct downward trend during the last 20 years.
Figure 8: Fatal airliner (14+ passengers) hull-loss accidents (ASN)

What is the safest means of transportation?
Ch
apte
r: A
viat
ion
Saf
ety
- W
orl
dw
ide
1
1
Ascend - FlightGlobal
Another popular resource is Flight International Magazine. In their January 15th edition of 2013 they
quote: “Flight International figures show there were 21 fatal airline accidents in 2012, resulting in
425 fatalities. (…) Flight International’s comprehensive statistical methodology produces figures that
vary slightly from other stories even if they tell the same story. They take into account all fatal airline
accidents that involve Wester or Eastern-built aircraft, and also include aircraft of all weights, sizes
and engine types, in both passenger and non-passenger airline operations.” (Learmount, 2013)
Figure 9: Flights per fatal accident 1992-2012 (FlightGlobal - Ascend)
“2012 was another good year for safety, with the fatal accident rate dropping from one to 1,4 million
flights overall in 2011 to one per 2,3 million flights in 2012. [=0,43 per 106]” (Learmount, 2013)
Figure 10: World airline fatala accidents and fatalities 2003-2013 (FlightGlobal Ascend)

What is the safest means of transportation?
Ch
apte
r: A
viat
ion
Saf
ety
- W
orl
dw
ide
1
2
EASA
Although EASA focusses on European matters, Chapter 2 of their EASA Annual Safety
Review provides information on the worldwide fatal accident rate for aeroplanes with a
maximum take-off mass above 2,250 kg, engaged in scheduled passenger or cargo
operations. Acts of unlawful interference are not included in these figures. (EASA, 2013)
Figure 11: Nr/Rate per 10 million flights of sched. pax and cargo fatal accidents worldwide per year 1993-2012 (EASA)
Figure 12: Global distribution of fatal accidents worldwide 1993-2012 (EASA)

What is the safest means of transportation?
Ch
apte
r: A
viat
ion
Saf
ety
– Eu
rop
e
1
3
Aviation Safety – Europe Now that we have taken a look at the global picture, let’s have a closer look at Europe. EASA’s annual
Safety Review 2012 mentions: “For Commercial Air Transport Aeroplanes between 2001 and 2010
there was an average of 25 accidents per year, including 3 fatal accidents per year. In 2012 there
were 34 accidents, of which 1 was fatal. The fatality occurred when a ground operator was killed
during aircraft loading. The most common type of accident is an ‘abnormal runway contact’ while the
most common type of fatal accident is a loss of control in flight’.” The report also states that 910
million passengers were carried in Europe. (EASA, 2013)
Figure 13: Total # Accidents, Fatal accidents & Fatalities for EASA MS Operated Aeroplanes MTOM>2250kg (EASA)
Figure 14: Rate of Fatal accidents in EASA MS and 3rd country sched. passenger ops MTOM>2250kg 2003-2012 (EASA)

What is the safest means of transportation?
Ch
apte
r: C
on
clu
sio
n o
n A
viat
ion
Saf
ety
1
4
Conclusion on Aviation Safety The table below lists all data covered in this paper. If you want to know what the exact global
accident rate is, take your pick. Nearly every source uses its own definition, causing the accident
rates to vary with a factor 10!
If you are looking for a truly global overview: take ICAO or GSIE. If you are interested only in
Western-built aircraft, consider using the Boeing statistical summary. The IATA definition doesn’t
mention what aircraft types are included, however the report text states: “1 Western-built jet hull
loss accident per 5 million flights (2012)” (IATA, 2013) which could explain the low figure.
# Accidents
(2012)
# Fatalities
(2012)
Accident Rate
Accident Rate
per million flights
accident per # flights
ICAO Scheduled commercial flights Annex 13: a) ≥1 fatality or serious injury (incl. jet blast) b) damage requiring major repair (no engine failure) c) a/c missing or completely inaccessible
99 372 3,2 312.500
IATA IATA definition (Western built jets only?) - Scheduled/charter passenger or cargo service - Multi-engine, turbine powered - MTOM>5700kg (turbo-prop) & >15000kg (jet) - Major damage (>1 million or 10% hull value) or hull loss
75 0,2 5.000.000
GSIE Harmonized accident rate
91 2,4 416.667
Boeing Annex 13, but only Western-built a/c (see list)
0,3 3.333.333
ASN Annex 13, fatal airliners (14+ passengers) hull loss accidents
23 475
Ascend Fatal accidents - Western/Eastern-built a/c, all weights, sizes and engine types (14+ seats) - both passenger and non-passenger airline operations
21 425 0,43 2.300.000
EASA ?
22 1,00 1.000.000
Table 2: Summary of Accident & Fatality Rate 2012

What is the safest means of transportation?
Ch
apte
r: R
oad
saf
ety
1
5
Road safety
United States/Global
Figure 15: Fatalities and Rate per 100 Million Vehicle Miles Traveled by Year 2011 (US DOT)
“(…), the NSC reported that the odds of dying in a car accident in the US over a lifetime was about one
in 83. While the number of global vehicle passengers and drivers may not be known, the World Health
Organization estimates that 1.2 million people die each year in road traffic accidents (roughly half of
which are pedestrians, cyclists and motorcyclists). So even though we drive more than we fly, it seems
that there is basis for the claim that on the road is more dangerous than up in the air.” (Sood, 2012)
Europe
I have created the table below, based on the data found in the EU Transport Commission statistical
pocketbook ed. 2013. Based solely on fatalities and population, living in Europe it appears as if flying
is 6000 times safer than getting on the road and 8 times safer than taking a train. On the other hand
the average European spends a lot more time in his car, than on an airplane. (Levitt & Dubner, 2013)
Accident statistics (2011) EU-27
(Europe)
Rate per million
nationals Belgium
Rate per million
nationals
Road Fatalities 30.268 60 858 78
Road accidents (personal injury) 1.115.406 2223 42.050 3809
Railway Fatalities 38 0,08 0 0
Air Fatalities (EU-27 Operators, MTOW>5700kg) 6 0,01 Table 3: Accident statistics 2011 (EU Transport Commission)
Mode of transportation (EU-27)
billion pkm (EU-27)
# Fatalities Fatlity Rate
per 100 billion pkm
Passenger cars 4.822 215 4,5
Powered two-wheelers 123 86 69,9
Buses & coaches 512 0 0,0
Railways 407 38 9,3
Tram & metro 93 Intra-EU Air Transport 575 0 0,0
Table 4: Fatality Rate per 100 billion pkm (EU Transport Commission)
What is the safest means of transportation?
Ch
apte
r: P
edes
tria
ns,
cyc
lists
an
d u
sers
of
mo
tori
zed
tw
o-w
hee
lers
1
6
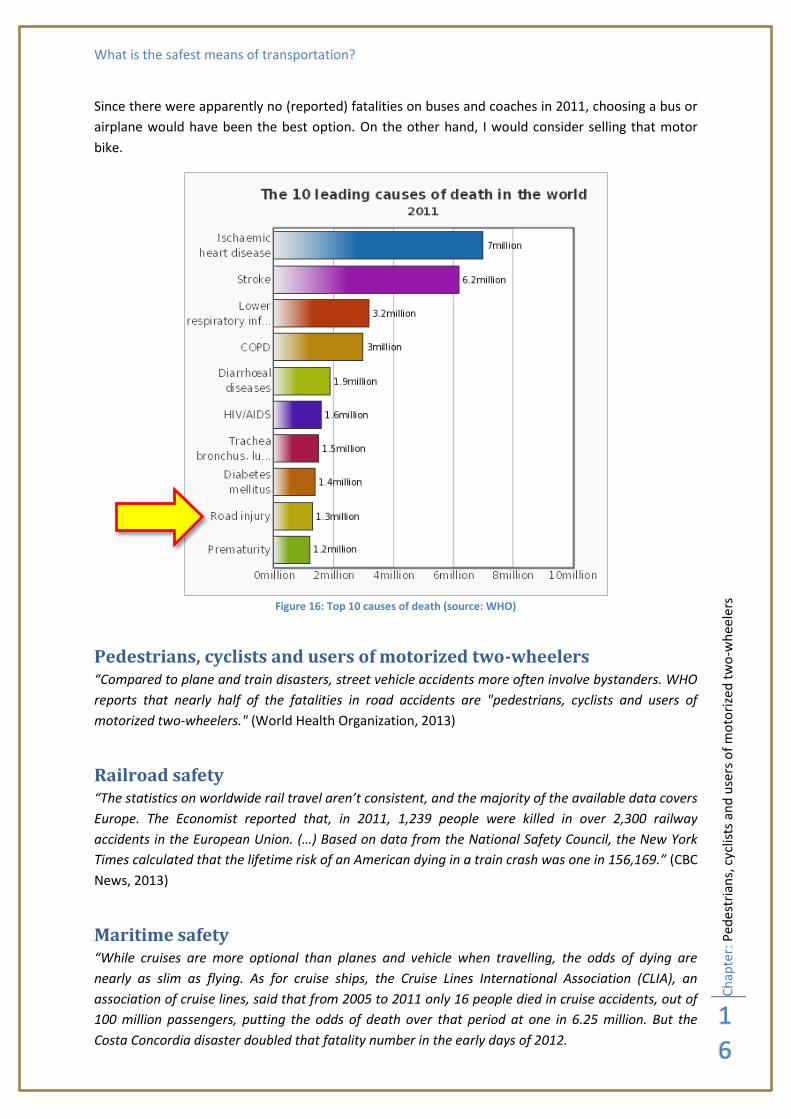
Since there were apparently no (reported) fatalities on buses and coaches in 2011, choosing a bus or
airplane would have been the best option. On the other hand, I would consider selling that motor
bike.
Figure 16: Top 10 causes of death (source: WHO)
Pedestrians, cyclists and users of motorized two-wheelers “Compared to plane and train disasters, street vehicle accidents more often involve bystanders. WHO
reports that nearly half of the fatalities in road accidents are "pedestrians, cyclists and users of
motorized two-wheelers." (World Health Organization, 2013)
Railroad safety “The statistics on worldwide rail travel aren’t consistent, and the majority of the available data covers
Europe. The Economist reported that, in 2011, 1,239 people were killed in over 2,300 railway
accidents in the European Union. (…) Based on data from the National Safety Council, the New York
Times calculated that the lifetime risk of an American dying in a train crash was one in 156,169.” (CBC
News, 2013)
Maritime safety “While cruises are more optional than planes and vehicle when travelling, the odds of dying are
nearly as slim as flying. As for cruise ships, the Cruise Lines International Association (CLIA), an
association of cruise lines, said that from 2005 to 2011 only 16 people died in cruise accidents, out of
100 million passengers, putting the odds of death over that period at one in 6.25 million. But the
Costa Concordia disaster doubled that fatality number in the early days of 2012.

What is the safest means of transportation?
Ch
apte
r: C
on
clu
sio
n
1
7
However, a new report by Reuters questions the validity of any cruise safety statistics because there is
no public database on cruise line accidents. The International Maritime Organisation (IMO), which
provides regulations for cruise ships, does not keep complete records of marine casualties but
recorded fewer than 300 incidents since 2000, while the independent website CruiseJunkie, run by
sociology professor Ross Klein of Memorial University Newfoundland, has published reports of 644
incidents in the same period.” (Sood, 2012)
I apologize for not digging deeper into the topic of maritime safety, but I consider maritime transport
less important in the scope of this question. Apart from ferry shuttle services, I consider cruise ships
a non-essential mode of transport.
Conclusion It seems to be quite difficult to find accurate comparisons between the different means of
transportation. Some guidelines:
- The scope of the data should be restricted to a specific region (e.g. USA, Europe,…)
- Make sure your data cover the same period, since there can be large differences in rate
(especially with the historically low rates in aviation nowadays)
- Specify what you are looking for: # fatalities per passenger per km, # fatal accidents per capita
per year, # fatalities per hour of travel,…
- Consider the base data: only Western-built jets, MTOM>5700kg, include/exclude truck drivers,…
- Check you references: use data from official organizations (NSC, EASA, ICAO,…)
Instead of trying to setup my own definitions - for which I would almost certainly lack data – I will list
some verified facts which can hopefully answer the question on the safest means of transportation:
“According to the NSC, in 2010 there were 0.50 deaths per 100 million passenger miles (cars). The
death rate for buses was 0.05 and passenger trains 0.02, while no one died in scheduled airline travel
during that period.” (MSN News, 2013)
Figure 17: US Fatalities per 100 million passenger miles
“On a per passenger mile basis, you're over seventy times likelier to die driving a car.” (Yglesias, 2013)
“In the last five years, the death risk for passengers in the United States has been one in 45 million
flights, according to Arnold Barnett, a professor of statistics at M.I.T. In other words, flying has
become so reliable that a traveler could fly every day for an average of 123,000 years before being in
a fatal crash, he said.” (Mouawad & Drew, 2013)

What is the safest means of transportation?
Ch
apte
r: A
pp
end
ix: I
nfo
grap
hic
s o
n g
lob
al r
oad
saf
ety
20
13
(W
HO
)
1
8
Appendix: Infographics on global road safety 2013 (WHO)

What is the safest means of transportation?
Ch
apte
r: R
efe
ren
ces
1
9
References Ask.com. (2013, December 13). What Is the Safest Form of Transport? Retrieved from Ask.com:
http://www.ask.com/question/what-is-the-safest-form-of-transport
Aviation Safety Network. (2013, December 13). Aviation-safety.net - References. Retrieved from ASN:
http://aviation-safety.net/database/ref.php
Boeing. (2013). Statistical summary of commercial jet airplane accidents 1959-2012. Seattle: Boeing.
CBC News. (2013, August 1). Is it safer to fly, drive or take the train? Retrieved from CBC news:
http://www.cbc.ca/news/world/is-it-safer-to-fly-drive-or-take-the-train-1.1409337
EASA. (2013). Annual Safety Review 2012. Cologne: EASA.
EU. (2013). EU Transport in Figures, statistical pocketbook 2013. Brussels: European Union.
Highland, J. (2011, Aug 03). What's the Safest Mode of Transportation? Retrieved Dec 13, 2013, from
Yahoo.com: http://voices.yahoo.com/whats-safest-mode-transportation-8910789.html
IATA. (2013). 2012 Aviation Safety Performance. Geneva: IATA.
IATA. (2013). Annual Review 2013. Geneva: IATA.
ICAO. (2001). Annex 13: Aircraft Accident and Incident Investigation, 9th ed. Montreal: ICAO.
ICAO. (2013). 2013 Safety Report. Montreal, Canada: ICAO.
Learmount, D. (2013). A very good year for safety. Flight International Magazine ed. 15-Jan-2013.
Levitt & Dubner. (2013, December 14). Freakonomics : A Rogue Economist Explores the Hidden Side
of Everything. Retrieved from About.com - Contemporary literature:
http://contemporarylit.about.com/od/socialsciences/fr/freakonomics.htm
Mouawad, J., & Drew, C. (2013, February 11). Airline Industry at Its Safest Since the Dawn of the Jet
Age. Retrieved from New York Times: http://www.nytimes.com/2013/02/12/business/2012-
was-the-safest-year-for-airlines-globally-since-1945.html
MSN News. (2013, July 26). Despite recent accidents, airplane travel still safest. Retrieved from MSN
News: http://news.msn.com/us/despite-recent-accidents-airplane-travel-still-safest
Sood, S. (2012, January 27). What is the safest mode of travel? Retrieved December 2013, 13, from
BBC.com Travel Wise: http://www.bbc.com/travel/blog/20120127-travelwise-what-is-the-
safest-mode-of-travel
US DOT - National Highway Traffic Safety Administration (NHTSA). (2013). Traffic Safety Facts 2012
(DOT HS 811 856). Washington DC: US DOT.
Wikipedia. (2013, December 14). Aviation Safety. Retrieved from Wikipedia:
http://en.wikipedia.org/wiki/Air_safety#Statistics
World Health Organization. (2013). Who.int - Infographics on global road safety 2013. Retrieved
December 13, 2013, from World Health Organization:

What is the safest means of transportation?
Ch
apte
r: R
efe
ren
ces
2
0
http://www.who.int/violence_injury_prevention/road_safety_status/2013/facts/en/index.ht
ml
Yglesias, M. (2013, July 6). Passenger Airplanes Are Amazingly Safe. Retrieved from Slate.com:
http://www.slate.com/blogs/moneybox/2013/07/06/passenger_airplanes_are_amazingly_s
afe.html
What is the safest means of transportation?
Ch
apte
r: L
ist
of
figu
res
2
1
List of figures Figure 1: ICAO Accident Records 2006-2012 ........................................................................................... 4
Figure 2: ICAO Accident statistics and rates 2012 ................................................................................... 4
Figure 3: Western-built jet hull-loss rate per million sectors (2002-2012) ............................................ 5
Figure 4: GSIE Harmonized accident rate 2012 ....................................................................................... 6
Figure 5: 10-Year Accident Rates by Type of Operation (Boeing) ........................................................... 8
Figure 6: Accident Rates and Onboard fatalities by Year 1959-2012 (Boeing) ....................................... 9
Figure 7: Fatal Accidents and Onboard Fatalities by Phase of Flight 2003-2012 (Boeing)...................... 9
Figure 8: Fatal airliner (14+ passengers) hull-loss accidents (ASN) ....................................................... 10
Figure 9: Flights per fatal accident 1992-2012 (FlightGlobal - Ascend) ................................................ 11
Figure 10: World airline fatala accidents and fatalities 2003-2013 (FlightGlobal Ascend) ................... 11
Figure 11: Nr/Rate per 10 million flights of sched. pax and cargo fatal accidents worldwide per year
1993-2012 (EASA) ................................................................................................................ 12
Figure 12: Global distribution of fatal accidents worldwide 1993-2012 (EASA) ................................... 12
Figure 13: Total # Accidents, Fatal accidents & Fatalities for EASA MS Operated Aeroplanes
MTOM>2250kg (EASA) ........................................................................................................ 13
Figure 14: Rate of Fatal accidents in EASA MS and 3rd country sched. passenger ops MTOM>2250kg
2003-2012 (EASA) ................................................................................................................ 13
Figure 15: Fatalities and Rate per 100 Million Vehicle Miles Traveled by Year 2011 (US DOT) ............ 15
Figure 16: Top 10 causes of death (source: WHO) ................................................................................ 16
Figure 17: US Fatalities per 100 million passenger miles ...................................................................... 17
Index ICAO Annex 13 ......................................................................................................................................... 3 International Civil Aviation Organization (ICAO) ..................................................................................... 3 Safety Management Manual (SMM) ....................................................................................................... 2 Safety Management Systems .................................................................................................................. 2


![U.S. Transportation Innovation Means Mobile WiFi is on the Move [Infographic]](https://img.pdfslide.net/doc/110x75/55a4fb2c1a28ab762e8b45a7/us-transportation-innovation-means-mobile-wifi-is-on-the-move-infographic.jpg)