Embed Size (px)
Citation preview

1
What is the True Rate of Social
Mobility in Sweden? A Surname
Analysis, 1700-20121 Gregory Clark, University of California, Davis [email protected] August 2, 2013
On conventional measures, modern Sweden has rapid social and
economic mobility. Analyzing surname distributions among Swedish
elites - attorneys, physicians, university students, and academicians -
this paper shows that conventional measures greatly overstate
underlying social mobility rates. The Swedish elite of 1700 is still
an elite, and is becoming average only slowly. The b measuring
status persistence across surname generations is 0.7-0.8, compared to
the 0.2-0.4 found in conventional studies. This illustrates a general
feature that conventional studies overstate generalized or long-term
social mobility rates. True rates of mobility in modern Sweden are
similar to those of the supposedly more socially immobile
economies of the UK and USA. They are perhaps no higher than in
pre-industrial Sweden.
As standardly measured, modern Sweden has rapid social and economic
mobility, more rapid than in either the UK or USA. And Sweden is a representative
of a group of Nordic Countries – Denmark, Finland, Iceland, Norway, and Sweden –
believed to have achieved a similar configuration of low inequality, promotion of
widespread educational attainment, and rapid social mobility. In recent years these
societies have been cited as a reproach to the Anglo-Saxon economic model of the
UK and USA, where there is greater inequality in outcomes, and lower rates of social
mobility.
1 I thank my former colleague, Pontus Rendahl, for his assistance in helping me locate the Swedish data. Anna Dreben Almenberg and Johan Almenberg kindly supplied the underlying data to redraw figure 3 from their article.

2
Figure 1: Intergenerational Earnings Elasticities and Inequality
Source: Corak, 2012, Figure 2. Canada, person communication from Miles Corak. Hnatkovska et al., 2012 (India). Figure 2: Intergenerational Education Correlation and Inequality
Sources: Hertz et al., 2011, table 2. Gini for Income, World Bank.
JapanSweden
Norway
Finland
Canada
India
UK
NZ
USA
China
Argentina
Peru
Chile
0
0.1
0.2
0.3
0.4
0.5
0.6
0.7
0.8
0.1 0.2 0.3 0.4 0.5 0.6
Ear
nin
gs C
orr
elat
ion
Gini Coefficient Income
Sweden
Norway
Denmark
USA
UK
Italy
Brazil
Peru
0.2
0.3
0.4
0.5
0.6
0.7
0.2 0.3 0.4 0.5 0.6
Ed
uca
tio
n C
orr
elat
ion
Gini Coefficient Income

3
Figure 1, for example, shows a recent estimate of intergeneration earnings
elasticities, compared to the degree of overall income inequality, across a range of
countries. These mobility rates would also imply that only 4-7% of earnings
variance in Sweden in any generation is explained by the observed earnings of
parents. In terms of educational mobility the Nordic countries are less distinct, as
figure 2 shows. But the intergenerational correlation of years of education is still
modest both in absolute terms, and compared to most other countries.
A recent study by Mikael Lindahl et al. also suggests that intergeneration
earnings correlations in Sweden have been at the modern level for at least three
generations, back as far as those born 1925-30 compared to their fathers (Lindalh
et al., 2012, table 5). Intergenerational correlations in years of education are low
over four generations, from an initial cohort born 1865-1912 (Lindahl et al., 2012,
table 2).
Such enhanced mobility in a country like Sweden would suggest that
institutional arrangements – the support for public education, for example, or the
progressive taxation of wealth - play a vital role in determining rates of social
mobility. The implication is that the lower rates of social mobility observed in
countries such as England or the USA represent a social failure. The life chances of
the descendants of high and low status ancestors can be equalized at low social cost.
Sweden is, after all, one of the richest economies in the world.
Here I show, however, that in Sweden true intergenerational mobility rates for
measures of status such as occupation or education are much lower. Also the
rates of social mobility in recent decades exceed by little the rates of the
eighteenth century. Whatever the short run mobility of earnings, or years of
education, there is considerable persistence of status – measured through wealth,
education and occupation - over as many as 10 generations in Sweden. The true
intergenerational correlation of social status between parents and children measured
in a more general sense, in Sweden is in the region of 0.7-0.8, as is summarized in
table 1.

4
Table 1: Summary Surname b Estimates by Period from Surnames, Sweden
Group
1700-1900
1890-1979
1950-2012
Attorneys - - 0.71
Physicians - 0.75 0.76
University Students 0.78 0.85 0.66
Academicians 0.89 0.75 0.84
The way I show this is my following the relative frequency of two elite sets of
surnames, those of the Swedish nobility, and those of the educated elite of the
seventeenth and eighteenth centuries, among modern social elites compared to
their shares of the population. These elite surnames from several hundred years
ago are still overrepresented among modern Swedish elites - physicians, attorneys,
and university students – showing that social mobility rates in Sweden have been
low. But by looking at the rate with which their overrepresentation has declined
over the last two or three generations, we can measure mobility rates up to 2012.
The answer is that current social mobility in Sweden is very slow, and no higher
than in countries such as the UK or USA. But further it is little faster than social
mobility in pre-industrial eighteenth century Sweden under monarchic rule.
Why are these results in table 1 so different from the conventional studies for
Sweden? One suggestion is that by looking at surname groupings we are implicitly
controlling for errors in the measurement of current status that will reduce the
estimated intergenerational correlation β, so estimating higher values for b. But the
correlation estimates in figure 1 are those corrected for measurement error. And in
the case of education in figure 2 measurement errors are believed to a relatively
insignificant. The different bs estimated in these ways are not about different degrees
of control for measurement errors.
The resolution proposed here that individuals and families have some
underlying general level of social status in generation t, xt, where xt is always

5
regressing toward the mean across generations to that
(1)
where xt and xt+1 are assumed to have a mean of 0, and a constant variance ., and
x is normally distributed.
However, x is a latent variable, not directly observed. Instead observe various
partial measures of status, yt , where such measures would be earnings, wealth, years
of education, educational status, or occupational status. For each generation t
(2)
where ut is a random component linking the underlying status of the family to the
particular observed measure of status.
The random component linking aspects of social status to underlying social
status exists for two reasons. First there is an element of luck in the status attained
by individuals given their underlying competence. If we look at earnings, people
happen to choose a successful field to work in, or a successful firm to work for.
They just succeed in being admitted to Lund University, as opposed to just failing.
They marry a supportive spouse, or end up instead shackled to a needy partner. But,
second, people trade off income and wealth for other aspects of status. They choose
a career as a philosophy professor as opposed to a lower occupational status, but
more lucrative career, as a plumbing hardware salesman.
The above implies that the conventional studies of social mobility, based on
estimating the β in the relationship
(3)
will underestimate the true b linking underlying social status across generations. In
particular the expected value of β will be not be b, but instead θb, where θ <1. The
greater the random components linking underlying status and any measured aspect
of status, the smaller will be θ. For

6
( )
(
)
(4)
Thus conventional estimates of social mobility, based as they are on one
generation studies, and on partial measures of overall social status, will systematically
tend to overestimate social mobility rates. However, the surname measures that we
use here over multiple generations, even when they are based on partial measures of
social mobility such as educational or occupational status, will closely approximate to
the true underlying b. This is because by aggregating over groups of individuals with
the same surname we can make the error component linking observed status y and
underlying status x go to zero.
Swedish Surnames
Sweden has a number of distinctive classes of surnames that we can potentially
use to track socio-economic status over many generations. The first of these are the
surnames of nobles. Surprisingly a class of nobles is very much alive and functioning
in Swedish society, despite its reputation as a model social democracy. Sweden has a
formal guild of noble families, the Riddarhuset (House of Nobility). Though noble
families existed since medieval times, the modern Riddarhuset was created in 1626.
During the Diet of the Four Estates, 1668-1865, the Riddarhuset functioned as one of
the four governing estates of the kingdom (analogous to the House of Lords in
England).2 Since 2003 the Riddarhuset has been a purely private institution, which
maintains the records of the Swedish noble families, and lobbies on their behalf.
Despite its location in a world of Scandinavian gender equality, only men get to vote
in the Riddarhuset, and only sons can transmit titles to their offspring.
The families enrolled in the Riddarhuset come in three descending status ranks:
counts, barons, and “untitled” nobility. Each family has a number corresponding to
their order of enrollment. In total 2,330 families have been enrolled, though only
about 700 have living representatives.3 The timing of these ennoblements are all
recorded, and are summarized in figure 3. The important thing revealed by the
figure is that almost all noble families in the current stock were enrolled before 1815.
2 The organization has an elaborate building in Stockholm, also called the Riddarhuset, erected in the seventeenth century. 3 Ridderhuset, 2012.

7
Figure 3: The History of Ennoblement in Sweden
Source: Almenberg and Dreber, 2009, 178.
And indeed a large fraction of all noble families were created before 1721, when
Sweden enjoyed conquests that brought its territories to their maximum extent of
1658-1721. At this point Sweden had possession also of Finland, Estonia, and some
north German states. In this period the crown rewarded many military commanders
with ennoblement. This is reflected in the foreign (particularly German) names of
many of the nobility, who served the crown as military commanders.
From 1680 the nobility gradually lost its privileges, starting with the reclamation
by the crown in 1680 of much of the land granted to nobles in previous years. By
1866 the nobles had no privileges of economic significance.
When domestic families were enrolled in the Riddarhuset they typically adopted a
new surname if they were Swedish, embodying status elements such as Gyllen (gold),
Silfver (silver), Adler (eagle), Leijon (lion), Stjerna (star), Creutz (cross), and Ehren
(honor): thus Leijonhufvud, Gyllenstjerna, Ehrensvärd, Adlercreutz. Such heraldic
surnames can be of great antiquity. Thus in Shakespeare’s Hamlet, written around
1600, the two unfortunate Danish nobles are Rosencrantz and Guildenstern.
0
500
1000
1500
2000
2500
3000
3500
1600 1650 1700 1750 1800 1850 1900 1950 2000
Num
ber
s o
f F
amili
es
Nobles Created
Net Stock Families

8
Rosencrantz and Gyllenstjerna (Guildenstern) were such common Danish and Swedish
noble surnames in these years that one tenth of the aristocrats participating in the
Danish royal coronation of 1596 bore one or other name.4
Many of the noble surnames in Sweden, however, are German in origin,
reflecting the importance of German military commanders in the service of the
Swedish crown in the seventeenth century: thus von Buddenbrock, von Köningsmarck .
There are also Scottish, English, Russian, French and other surnames: Douglas,
Maclean, Bennet, de la Gardie. Some noble surnames are, however, quite common and
held by many people probably not descended from these noble families, such as
Björnberg held by 925 people in 2011, or Hamilton, held by 586 people. In the analysis
below I thus restrict the sample to noble surnames held by 400 or fewer people in
2011, where a large fraction will likely be related to the name holder who was
ennobled.
One privilege that the nobility obtained in the Names Adoption Act of 1901
was a ban on anyone else adopting their surnames.5 Thus apart from foreign
imports, and name changing before 1901, the surnames of the enrolled nobles in the
Ridderhuset identify uniquely the lineage of these noble families. Such surnames
constitute a small Swedish elite. Thus, of the Count and Baronial family surnames,
there are only 16,000 current holders of such surnames, for those surnames held by
fewer than 400 people now. The untitled nobility add a further 40,000 people
holding the rarer surnames.
Sign that these surnames are mostly derived by descent from those ennobled
many years ago comes from the stock of these names as a share of the population
over time. Figure 4 shows the share of a sample of aristocratic surnames among
male deaths 1901-2009, male births 1810-1989, and for marriages 1700-1920. From
1810 to the present there has been little change in the share of noble surnames
among all Swedish surnames, though earlier than 1800 they constituted a larger
fraction of the surnames of those marrying. This, however, may stem from the
unrepresentative sources of the earlier marriages, which could have been drawn more
heavily from the communities where the aristocrats lived.
4 Boyce, 2005, ---. 5 There had been concern that disreputable people had been adopting noble surnames.

9
Figure 4: The Population Share of Aristocratic surnames, 1700-1999
Sources: Swedish Death Index, 1901-2009 (version 5.00), 2011, Parish Records of
Birth, Death, and Marriage, 1630-1920.
Sign that these surnames are mostly derived by descent from those ennobled
many years ago comes from the stock of these names as a share of the population
over time. Figure 4 shows the share of a sample of aristocratic surnames among
male deaths 1901-2009, male births 1810-1989, and for marriages 1700-1920. From
1810 to the present there has been little change in the share of noble surnames
among all Swedish surnames, though earlier than 1800 they constituted a larger
fraction of the surnames of those marrying. This, however, may stem from the
unrepresentative sources of the earlier marriages, which could have been drawn more
heavily from the communities where the aristocrats lived.
The second class of surnames of interest are Latinized surnames. In the pre-
industrial era, most Swedes had impermanent patronyms, changing each generation.
But in these years the educated class – clerics, academics, and some merchants -
adopted such permanent Latinized surnames (typically ending “ius” or “æus”), which
became characteristic of them as a class. This is reflected in the names of a number
0.00
0.05
0.10
0.15
0.20
0.25
0.30
0.35
0.40
1700 1740 1780 1820 1860 1900 1940 1980
Per
cen
tage
Share Aristocrats (deaths)
Share Aristocrats (marriages)
Share Aristocrats (births)

10
of famous Swedish scientists of the seventeenth and eighteenth centuries: Carolus
Linnaeus, 1707-78, Anders Celsius, 1701-44, Jöns Jakob Berzelius, 1779-1848, and Olaus
Rudbeckius, 1630-1702. Typical examples of these surnames now are Aquilonius,
Arrhenius, Berzelius, Boethius, and Cnattingius.
Only a small fraction of the modern population bears such Latinized surnames.
Of those dying 2000-9, for example, only 0.47 percent bore a surname ending in
either ius or eus. However, as Figure 5 shows, for men dying 1901-2009 the share
bearing a Latinized surname nearly doubled between those born in 1860 and 1980.
This was because in the late nineteenth and early twentieth century significant
numbers of people switched to such Latinized surnames.
However, as figure 5 also shows, if we take only Latinized surnames where 40 or
more people held the surname in 2010, which are mainly the Latinized surnames
created first in the eighteenth century or earlier, the the population share was stable
for men born 1860-1979.6 These old established Latinized surnames, deriving from
the eighteenth century or earlier, are overwhelmingly held by those who inherited
them from their parents. This may stem in part from restrictions on surname
changing in the Names Adoption Act of 1901, and the Surname Law of 1982. In the
analysis below I thus use these more common Latinized surnames that existed before
1800, 0.18-0.22 percent of the current stock of surnames in Sweden, inherited from
the eighteenth century elite.7
The most common Swedish surnames are patronyms – surnames ending in son
(and before 1901 also dotter for women), and starting with the first name of the
father. These were the predominant surname in Sweden in the pre-industrial era. A
sample of 17th century parish marriage records, for example, shows 93 percent of
those marrying carrying such patronyms.
6 The names were checked against the register of Lund and Uppsala universities, and the International Genealogical Index of the Church of Jesus Christ of Latter-Day Saints, which has a sample of parish records in Sweden 1630-1920
(http://www.familysearch.org/eng/search/frameset_search.asp). 7 As Walton and Galton famously demonstrated, rare surnames over many generations will tend to either die out, or survive at relatively higher frequency. Walton and Galton, 1875.

11
Figure 5: The Share of Latinized Surnames at Death, Births, 1860-1979
Sources: Swedish Death Index, 1901-2009 (version 5.00), 2011.
Figure 6: Percentage of Men Named ..son, by Date of Death, and Date of
Birth
Source: Swedish Death Index, 1901-2009 (version 5.00), 2011.
0.0
0.1
0.2
0.3
0.4
0.5
1860 1880 1900 1920 1940 1960 1980
% o
f m
ale
bir
ths
All ius, eus
ius, eus 40+
0
10
20
30
40
50
60
70
80
90
100
1800 1820 1840 1860 1880 1900 1920 1940 1960 1980 2000
Per
cen
tage
Deaths
Births

12
In early Sweden such surnames also were not fixed, but changed from
generation to generation. Such patronyms gradually declined as a proportion of all
surnames, as families adopted more permanent surnames in the eighteenth and
nineteenth centuries. The 1901 Naming Law called for each family to have a family
surname passed unchanged across generations, thus freezing in place these
previously changing patronyms.
But the decline of the patronyms as a share of the population has continued to
this day. Figure 6 thus shows an estimate for Swedish men by 20 year periods of the
number dying with a patronym as surname, and the number born. By 2000-9 only
40 percent of males dying in Sweden bore a patronym. But for those ages less than
10 at death the share was even lower at 25 percent.8
We can observe the sources of this decline if we take all births for 1950-1, and
measure the percentage of patronyms by date of death. This is shown in figure 7.
Of men born in 1950-1, 48 percent of those dying aged 0-9 had a patronym. But
only 35 percent of those dying ages 50-59 had a patronym. Assuming the same
death rates by age, nearly one third of men born with patronyms changed their
surname, with most of the changes occurring by age 30. This means that while we
will see below that patronyms in Sweden are associated with low social status, we
have to be careful in using them to measure social mobility, since such patronyms are
selectively retained by the modern population.
Nina Benner, a reporter for Sverige Radio, has a nice story from her own family
of how such surname changes took place. Her grandfather and his four brothers
changed their surname from Andersson to Benner in 1916, when her grandfather
was 16. His oldest brother was studying to become a doctor, and his professor made
it clear that Andersson wasn´t a suitable name in that profession. The name Benner
stems from the small village of Bennebo, where her great-grandfather grew up.
There are other Swedish names, however, where the proportion of men at birth
with the surname is the same as the proportion at older ages. Consider surnames
ending in berg (mountain). As figure 7 also shows, for men born in 1950-1 the same
fraction held the name for those dying aged 0-9 as for those dying in 50-9. These are
the surnames we can use as a standard against which to measure social mobility rates.
8 Though this reflects in part a substantial increase in children in this period born from
immigrants. Of males born in 2000, and dying 2000-9, about 10 percent had Muslim names, and another 10 percent names that indicated an immigrant parent.

13
Figure 7: ..son and ..berg Surnames, Men Born 1950-1
Source: Swedish Death Index, 1901-2009 (version 5.00), 2011.
Measuring Social Mobility through Surnames
The measures I have of status at any time for various surname groups in Sweden
is their share in an elite occupation or educational status compared to their
population share. To extract implied bs for these cases we can proceed as follows.
Define the relative representation of each surname or surname type, z, in an elite group
as
With social mobility any surname which in an initial period has a relative
representation differing from 1 should tend towards 1, and the rate at which it tends
to 1 is determined by the rate of social mobility.
To extract implied bs from information on the distribution of surnames among
elites compared to the general population we proceed as follows. Assume that any
measure of social status, y, follows a normal distribution, with mean 0 and variance
. Suppose that a surname, z, has a relative representation greater than 1 among
0
10
20
30
40
50
60
0 10 20 30 40 50 60
Dea
ths
(%)
Age at Death
% ..berg
% ..son

14
Figure 8: Regression to the Mean of Elite Surnames
elite groups. The situation looks as in figure 8, which shows the general probability
distribution function for status (assumed normally distributed) as well as the pdf for
the elite group.
The overrepresentation of the surname in this elite could be produced by a
range of values for the mean status, , and the variance of status, , for this
surname. But for any assumption about ( , ) there will be an implied path of
relative representation of the surname over generations for each possible b. This is
because
(5)
(6)
With each generation, depending on b, the mean status of the elite surname will
regress towards the population mean, and its variance increase to the population
variance (assuming that < ). Its relative representation in the elite will decline
Rel
ativ
e F
requen
cy
ln Wealth
All Surnames
Elite Surnames
All - Probated Limit

15
in a particular pattern.
Thus even though we cannot initially fix and for the elite surname just
by observing its overrepresentation among an elite in the first period, we can fix
these by choosing them along with b to best fit the relative representation of the elite
surname z in the social elite in each subsequent generation. In practice it turns out
to matter little to the estimated size of b in later generations what specific initial
variance is assumed. Below we assume that the initial variance of the elite surname
status is the same as the overall variance, since this assumption fits the observed time
path of relative representation well in for elites in Sweden.
Figure 9 thus shows what we would expect the relative representation of a
surname, which had a relative representation of 8 times its share in the population in
the first year, to have in each subsequent 30 year interval with different assumptions
about b. If b = .35, the kind of b we expect from standard studies of Sweden, then
within two generations surnames heavily overrepresented among the elite should
have close to a proportional representation among the elite.
Attorneys
The Swedish Bar Association maintains a register of member attorneys with the
date of birth of each member, and date of entry to the bar.9 As of June 20, 2012
there were 7,111 such members. If we compare the frequency of surname types in
this register with the frequency of surname types in the population 2011 then we find
great variations in the relative representation of surname types. As figure 10 shows
the surnames held by titled nobles – Counts and Barons – appear at nearly 6 times
the rate these surnames appear in the general population.10 Other overrepresented
surnames include those shared with untitled nobles, and Latinized surnames, both
about 3 times the expected rate. Surnames beginning with Lund.. appear at just the
expected rate. In contrast surnames ending in ..son appear at half the expected rate.11
9 As of June 20, 2012. Swedish attorneys are not required to qualify for the Bar Association, but only those who qualify can use the title advokat. 10 This is excluding 88 attorneys employed at the foreign offices of one large firm with offices in Russia, Germany, Brussels, New York, Hong Kong, and China who seem mainly to be foreign nationals. 11 The relative frequency of the ..son surnames was measured using the four most frequent: Andersson, Johansson, Karlsson and Nilsson.

16
Figure 9: Relative Representation by Generation with Different bs
Figure 10: Relative Representation of Surnames, Attorneys, Sweden, 2012
Source: Swedish Bar Association, Membership Registry, June 20, 2012. Statistics
Sweden, Surname Frequency, December 2011.
Notes: “Titled A” are surnames of Counts and Barons. “Untitled A” are surnames
of Untitled Nobility. “..e/ius” are Latinized surnames found before 1800 in Sweden.
“Lund” are all surnames beginning with these letters. “..sson” are four common
surnames ending with sson. Since some noble surnames were common, for nobles
only surnames with a frequency in 2011 or 400 or less were used.
1
2
4
8
0 30 60 90 120 150 180 210
Rel
ativ
e R
epre
sen
tati
on
Years
b = .35
b = .55
b = .75
0
1
2
3
4
5
6
Titled A Untitled A ..e/ius Lund.. ..sson
Rel
ativ
e R
epre
sen
tati
on

17
Figure 11: Relative Representation of Surnames, Attorneys, by Cohort
Source: Swedish Bar Association, Membership Registry, June 20, 2012. Statistics
Sweden, Surname Frequency, December 2011.
Note: The vertical axis is on a logarithmic scale.
This implies that the distant past again has a surprising impact on the present
even in Sweden. Surnames that were differentiated socially in 1700 have remained
differentiated even to the present time, 10 generations later. Also the noble
surnames have retained their relative ranking in the social hierarchy, even to today,
with the surnames of Counts and Barons more elite than those of the Untitled
Nobles.
Bar members have birth dates varying from the 1910s to 1988. Using these
birth dates I divide the members into two generations, those born 1930-59, and
those born 1960-88. Figure 11 shows the relative representation of each surname
type across these two cohorts. Two things appear. First is that each of the surname
types has been regressing towards the expected mean representation of 1, for the
average surname in the population. The second, however, is that the rate of
regression to the mean is slow. Even for attorneys born 1960-88, those qualifying in
the last 30 years, there are substantial differences in the relative representation of
different types of surnames.
0.25
0.50
1.00
2.00
4.00
8.00
1940 1950 1960 1970 1980 1990
Rel
ativ
e R
epre
sen
tati
on
Birth Date
CB Noble
U Noble
..ius
..sson
b = 0.78
b = 0.74
b = 0.61
b = 0.67

18
The implied intergenerational correlation of occupational status from the
attorney data is as follows by surname group: high aristocrats, 0.78, lower aristocrats,
0.74, Latinized surnames, 0.61, and Patronyms, 0.67. Note, however, that for the
patronyms we have to be cautious about interpreting the b, since significant numbers
of people switched from the patronyms of their birth to other types of surnames. If
this switching was mainly by the socially more successful, the b estimated could be
significantly higher than the true b. The average b reported for attorneys in table 1
above is thus the 0.71 for the three elite surname groups. The estimated bs do differ
by surname group, but since for the high status surnames we are dealing with, the
samples of attorneys in each cohort are only 18-54, these variations in estimated b’s
could easily stem from chance alone.
Physicians
A second source that measures social mobility rates back to the 1890s is the list
of registered physicians in Sweden. I can get estimates of the relative frequency of
surnames among physicians for those first registering between 1890 and 2011, which
covers four generations of physicians in Sweden. Starting with currently registered
physicians we see the same differences in relative representation that we saw among
attorneys.
Thus figure 12 shows the relative representation of each surname type among
currently registered physicians. The same pattern as with the attorneys appears here.
The surnames of the three elite groups of the eighteenth century are still
overrepresented relative to their share of the population, and the Patronyms are
greatly underrepresented. Here even surnames such as Lund.. which had an average
representation among attorneys are underrepresented.
The reason for this is that a substantial fraction of the current stock of doctors
in Sweden is of foreign origin. Doctors with a medical license from any other EU
country can register as a doctor in Sweden without any further required training.
Thus in 2007 18.4% of all doctors registered in Sweden were trained abroad,
though this includes Swedes who attended foreign medical schools. But of those
registered first in 2007, excluding Swedes training in foreign medical schools, 40%
19
of new doctors were foreign.12
To correct for this, and calculate the relative representation of Swedish surname
types among Swedish born doctors in Sweden, I assume all foreign doctors were
registered post 1979, and that the relative representation of the surnames Lund.. and
Berg. both averaged one in 1980-2011. This implies that in this cohort Swedish born
doctors now constitute only 70% of all doctors, reasonable in light of the statistics in
the paragraph above. I adjust the overall doctor population for these years
accordingly. For the years 1890-1979 I assume all registered doctors in Sweden were
of Swedish birth.
Table 2 shows the data needed to calculate social mobility rates. The second
column shows for each group the number of doctors with the surname recorded in
each period from that surname group. Also shown is the share of this group among
doctors of domestic origin. The share of the surname group in the population is
estimated from the share of the surname in deaths of men born in the years 30 years
before the registration period. By dividing the first share by the second I get the
relative representation of each surname group among doctors by period. Notice that
a small share of doctors in Sweden registering first after 1980 comes from these
three elites, 2% only. But what is interesting is that this is still much greater than the
share of such surname holders in the domestic population, 0.8%.
Figure 13 shows for the four surname types – Titled Nobles, Untitled Nobles,
Latizined, and Patronyms – their relative representation by estimated year of entry
into practice, for the cohorts entering 1890-1919, 1920-49, 1950-79, and 1980-2011.13
All four groups regress towards the mean, but their rate of regression is again very
slow across all the cohorts. Figure 14, for example, shows the fitted relative
representation for all those in the three high status groups across the four
generations. The estimated b in this case is 0.74, and the fit is good and similar for
all three elite groups and all periods 1890-2011. The rate of regression to the mean
was no faster in the last period, at 0.76, the people entering medical practice within
the last 30 years, than in the earlier ones (0.75).
12 “Every other doctor in Sweden from abroad”, The Local, 30 August
2009 (http://www.thelocal.se/21768/20090830/)
13 The Latinized surnames here are all such surnames held by 40 or more people in Sweden in 2010. The Patronyms are the 9 most common: Andersson, Eric(k)sson, Johansson, C(K)arlsson, Larsson, Nilsson, O(h)lsson, Persson, Svensson.

20
Table 2: Surname Types among Doctors and in the Population
Period of
Qualification
Doctors
Share of
Domestic
Doctors
Share of
Cohort
Population
Relative
Representation
Titled Nobles
1980-2011 125 0.45 0.17 2.64
1950-79 122 0.60 0.17 3.55
1920-49 37 0.94 0.17 5.59
1890-1919 13 1.36 0.19 7.16
Untitled Nobles
1980-2011 296 1.07 0.43 2.52
1950-79 273 1.35 0.42 3.20
1920-49 91 2.32 0.42 5.54
1890-1919 33 3.46 0.47 7.34
Latinized (40+)
1980-2011 123 0.45 0.20 2.29
1950-79 97 0.48 0.17 2.87
1920-49 37 0.94 0.16 5.77
1890-1919 14 1.47 0.18 8.40
..son (top 9)
1980-2011 2,282 8.28 16.4 0.50
1950-79 1,308 6.47 18.5 0.35
1920-49 192 4.90 22.1 0.22
1890-1919 45 4.72 25.0 0.19
Notes: The share of each surname group in the total numbers of doctors before
1950 is determined from the total stock of doctors. After 1950 it is measured
relative to the surnames Berg.. and Lund..

21
Figure 12: Relative Representation of Surname Types among Swedish
Physicians
Sources: Swedish Death Index, 1901-2009 (version 5.00), 2011. Sverige,
Socialstyrelsen. 2011.
Figure 13: Representation of Surname Types Among Doctors, 1890-2011
Sources: Swedish Death Index, 1901-2009 (version 5.00), 2011. Sverige,
Socialstyrelsen. 2011, 1972, 1939.
0.0
0.5
1.0
1.5
2.0
2.5
TitledNoble
UntitledNoble
Lat40+ Berg.. Lund.. ..sson
Rel
ativ
e R
epre
sen
tati
on
of
Surn
ame
Typ
e
0.1
0.3
0.5
1.0
2.0
4.0
8.0
1900 1920 1940 1960 1980 2000
Rel
ativ
e R
epre
sen
tati
on
Titled Nobles Untitled Nobles
Latin40 ..sson

22
Figure 14: Estimated b for Elite Surnames, Doctors
Sources: As for figure 13.
The corresponding b for the Patronyms is similarly high at 0.74. We have to again be
cautious about the estimate for Patronyms, however. People were switching from these
surnames in all generations, and this switching likely was selective by the upwardly mobile.
This implies the b estimated here overestimates the persistence of status among the Patronym
surnames. However, the b estimated for this group is very similar to the three elite types of
surname.
Thus the surnames of attorneys and doctors in Sweden suggest a similar pattern. Social
mobility in Sweden is much slower than the conventional estimates suggest, even for very
recent generations. The congruence of the evidence from attorney and doctor surnames is
highlighted graphing in figure 15 the relative representation of surnames among attorneys
and doctors (measured relative to the surnames Berg.. and Lund..). The correlation
between the status of surname types across these professions suggests this reflects a general
difference in status across surname types.
1
2
4
8
1900 1920 1940 1960 1980 2000
Rel
ativ
e R
epre
sen
tati
on
Titled Nobles
Untitled Nobles
Latin40
Fit
b = 0.74

23
Figure 15: The Correlation of Surname Status between Attorneys and Doctors
A second surprising suggestion from the surname distribution of Swedish doctors is that
not only are true social mobility rates very slow, they are also no faster now than they were in
the early twentieth century. The enlargement of the political franchise, and the adoption of
the extensive welfare state of modern Sweden, that includes free university education, and
maintenance subsidies to students, have done nothing to increase rates of social mobility.
Educational Mobility, 1948-2012
Looking at college graduates in Sweden, we also see evidence of very low rates of social
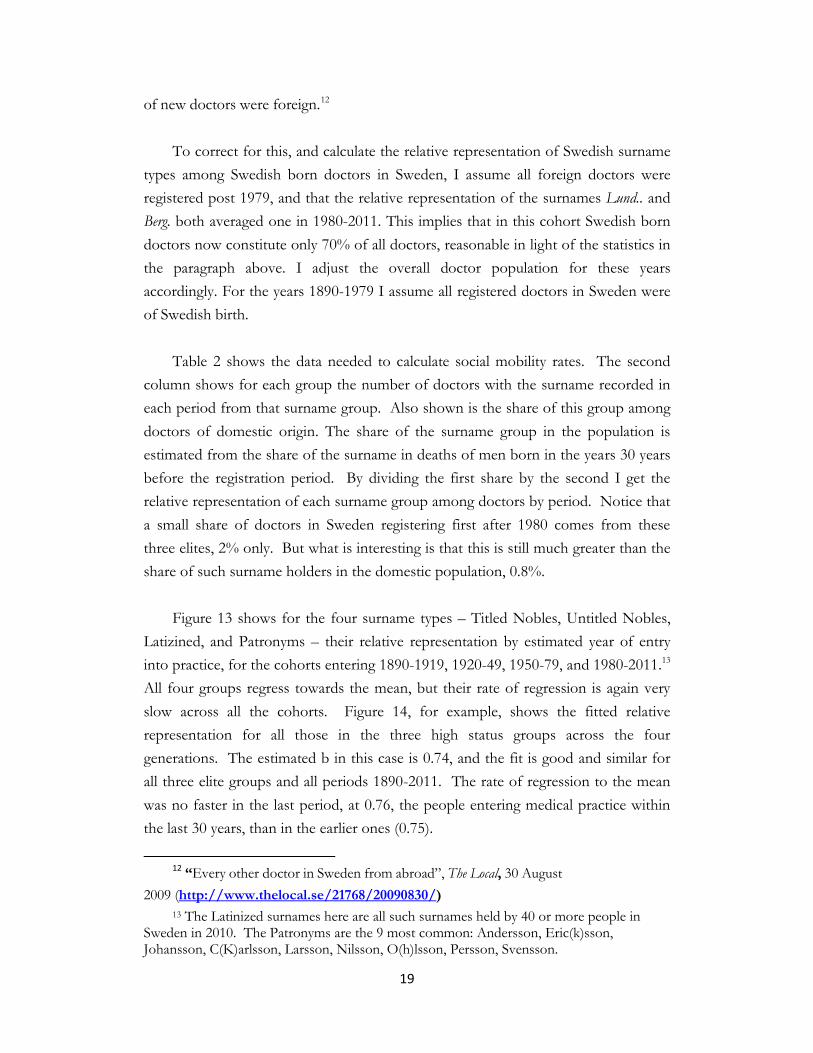
mobility, even in the most recent decades. Figure 16, for example, shows for Uppsala
University the relative representation of our surname groups among those completing
Master’s Theses in the last 12 years, 2000-12. Taking surnames of the form Lund.. or Berg.. as
having an average representation, we see that the Noble and Latinized surnames, largely
originating before 1800, still have a 50-80% overrepresentation.14 The most common
patronyms are at half their expected representation.15
14 Only Latinized surnames originating before 1820 were employed here. 15 The surname frequencies for this age group are estimated from the distribution of surnames in the death register for males born 1985-1994.
Titled A
U Arist
..e/ius
..son0
1
2
3
4
5
6
0 1 2 3 4 5
Rep
rese
nta
tio
n A
tto
rney
s
Relative Representation Doctors
24
Figure 16: Surnames among Uppsala Master’s Theses, 2000-12
Sources: Uppsala University, 1975-2011 http://uu.diva-portal.org/smash/searchadthe.jsf
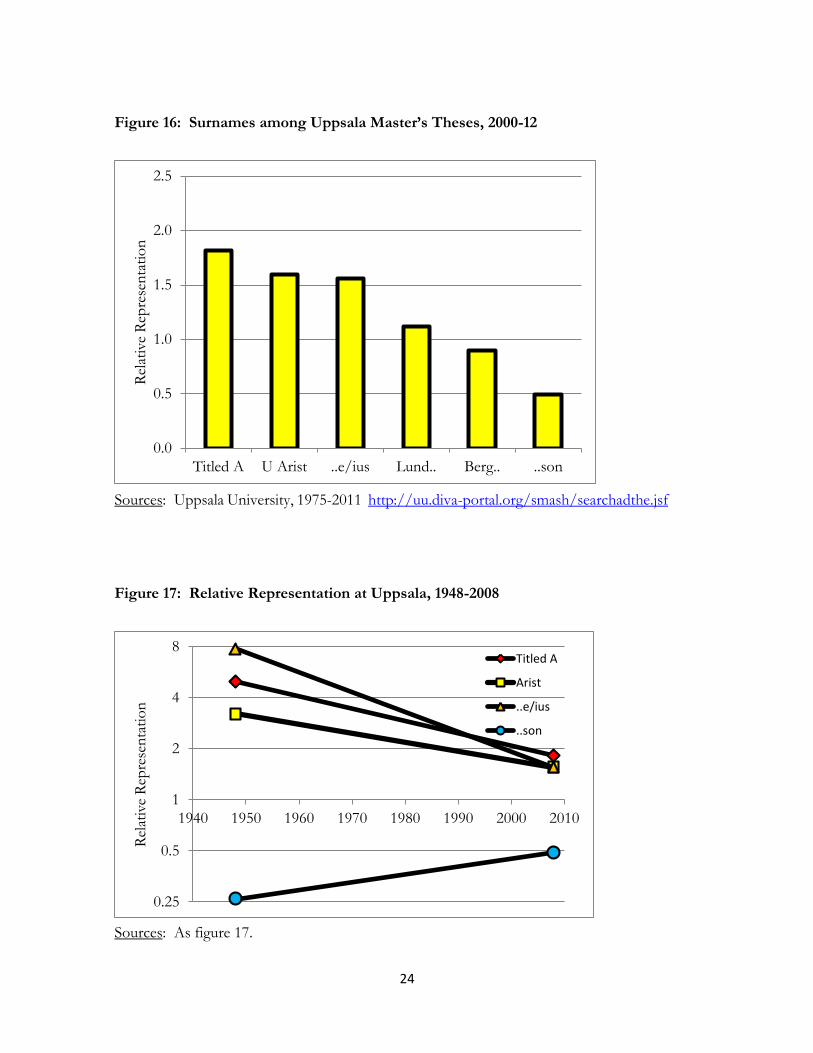
Figure 17: Relative Representation at Uppsala, 1948-2008
Sources: As figure 17.
0.0
0.5
1.0
1.5
2.0
2.5
Titled A U Arist ..e/ius Lund.. Berg.. ..son
Rel
ativ
e R
epre
sen
tati
on
0.25
0.5
1
2
4
8
1940 1950 1960 1970 1980 1990 2000 2010
Rel
ativ
e R
epre
sen
tati
on
Titled A
Arist
..e/ius
..son

25
The differences here between the elite surnames and patronyms are less sharp than for
attorneys and doctors. But those completing Master’s theses, even at elite universities such as
Uppsala, are a less exclusive share of the population than those qualifying as attorneys or
doctors. Indeed based on the numbers of master’s theses per year at the Gothenburg, Lund,
Stockholm and Uppsala, the most exclusive Swedish universities, 8% of the cohort of Swedes
born 1990 will complete a master’s thesis at one of these universities.16
If a surname type, such as ..(e)ius is at a relative representation of 2 for the top 8% of the
population, then its relative representation at the top 1%, more characteristic of attorneys or
doctors, would be 2.8. Thus the information here is very consistent with the evidence for
doctors and attorneys in the most recent generations, and suggests again that there is currently
very slow regression to the mean for elite and underrepresented surnames. These data imply
that if 8% of the general population of 22 year olds in Sweden now get a masters degree from
one of these four elite universities, the rate for those sharing the surnames of the 18th century
elite is 12-14%. The differential status of Swedish surnames will not end soon.
There are extensive records of those enrolled at the only two Swedish universities
established before 1954, Uppsala, founded in 1477 and Lund, founded in 1666. Thus there
are volumes recording the surnames of 1,894 students attending two of the student nations at
Uppsala 1942-1954.17 Using these we get the picture in figure 17 of the relative representation
of different surnames types at Uppsala circa 1948 and circa 2008, two generations later. Once
again there is a clear convergence of all four groups towards the mean across these two
generations.
To calculate the b for education implied by the data in figure 17 I need to take account
that Uppsala and Lund were much more elite institutions in the 1940s than in 2000-12. The
fraction of Swedes attending Uppsala and Lund in the late 1940s can be roughly estimated as
still only 1% of the population, compared to an estimate for master’s theses now of 8% of the
population. The estimated bs for the three elite groups individually, allowing for this shift in
the upper proportion of the population being observed, are 0.72 for the Titled Noble
surnames, 0.75 for the Untitled Noble surnames, and 0.53 for the old established Latinized
surnames.
16 The numbers of theses from domestic students were estimated from the numbers of Berg. and Lund.. authors in 2011, taking them based on the birth data as 2.7% of the population. Students have the option of completing one or two theses for a masters degree. A sample of 100 Berg.. surnames from Uppsala suggested that the average masters student completes 1.26 theses. This gave an estimate of 8.4% of the 1989 birth cohort completing an MA at one of these universities. 17 These student nations were dining and residence associations.

26
However, the sample size for these surnames at Uppsala in 1942-54 is small, meaning
there will be significant sampling error in these estimates. Combining these groups into one
elite implies an overall b in these two generations of 0.65. Yet the two subsequent generations
entered university after major reforms in 1977 which greatly expanded access to universities.
Tuition is now free, and there are grants and loans available to students to cover living costs.
For the Patronym surname group, here estimated on the basis of the surnames
Andersson, Johansson, Karlson, and Nilsson, the implied b, 0.87, is even lower. The shift of
people away from these surnames probably biases this implied b upwards, however.
Educational Mobility, 1700-1948
There is good data available on the surnames of Lund attendees 1666-1908 from
publication of a register of all students 1732-1830, and detailed biographies of students in a
number of the student nations that all students had to enroll in 1666-1908.18 For Uppsala
there is complete registry data 1477-1817, but data from only one student nation 1817-1902.
Figure 18 shows the relative representation of Latinized surnames at Lund by 30 year
generations starting in 1700-29. In the first generation observed Latinized surnames were
14.3% of Lund students, but only an estimated 0.21% of the population.19 They were thus 71
times more common among students as in the population. The share of Latinized surnames
fell to 1.1% by 1880-1909. They were still 5.3 times as frequent among Lund students as in
the general population. The pace of this decline in representation implies a high persistence of
this group however. The b estimated for 1700-1909 is 0.78, assuming the university
represented an upper 1% of the socio-economic distribution.
18 These nations are Blekingska, Göteborgs, Kalmar, Skånska (to 1882), Smålands, Vermlands. 19 Based on the share of male births 1800-1829 in the 1901-2009 death register.

27
Figure 18: Latinized Surnames, Lund and Uppsala students, 1700-2012
Sources: See university section in references.
Figure 19: Fraction of Latinized Surnames Inherited, 1730-1908
Sources: Lund, Lundin, 1882, Sjo stro m, 1897, 1901, 1904, 1907, 1908. Uppsala, Odén, 1902.
1
2
4
8
16
32
64
128
1700 1730 1760 1790 1820 1850 1880 1910 1940 1970 2000
Rel
ativ
e R
epre
sen
tati
on
Cohort
LundFitted LundUppsalaFitted Uppsala
b = 0.85
b = 0.78
0.0
0.2
0.4
0.6
0.8
1.0
1730-59 1760-89 1790-1819 1820-49 1850-79 1880-1908
Fra
ctio
n I
nh
erit
ing
Surn
ame
Generation
LUND UPPSALA

28
One thing we have to beware in calculating persistence is surname changing. If students
born with the surname Anderson were changing this to Wigonius, then persistence would be
exaggerated. The biographical sources for some of the student nations at Lund and Uppsala
allow me to estimate the fraction of Latinized surnames newly adopted in each generation,
since they give the parents’ surnames for most students also. Figure 19 shows what fraction
of students in each generation inherited rather than adopted a Latinized surname.20 1730-
1819, 96% of students acquired the name by inheritance from their father. However, 1820-
1909 that proportion fell to 88%, even though by design these are all surnames that first
existed before 1730.21 This will bias upwards the estimated b, but can be corrected for by
calculating for each period a b based just on the relative representation of the surname among
the inheritors in that period.
Figure 20 shows just at the implied relative representation of the surname as derived from
inheritance from fathers. These paths produce an estimated b for Lund 1700-1909 of 0.75,
only modestly lower than the uncorrected estimate, with a very constant rate of regression to
the mean throughout the 210 years of this period. For Uppsala the trends are very similar to
Lund from 1700-1849, but in the last two periods the regression to the mean is much slower.
However, this again may just be sampling error, since there is only one third as much data for
Uppsala as Lund, and for Uppsala 1880-1909 there are only 22 people observed with Latinized
surnames.
Thus the gradual tendency of Swedes 1700-2012 to switch from patronyms, even if
carried out only by those of higher status, will bias upwards the estimates of b, but only by
very modest amounts. The extraordinary persistence in the status of Latinized surnames, and
of aristocratic surnames, is largely the product of the great persistence in status of those who
inherit these surname types across generations. But this persistence seems to be little greater
on average in the eighteenth and nineteenth centuries than it has been in recent years, despite
the enormous institutional changes in Sweden between these dates.
An even more elite group than Lund and Uppsala students are members of the various
Royal Academies of Sweden. There are nine such Academies. Comprehensive membership
lists are available for the Swedish Academy of Sciences (founded 1739), the Swedish Academy
of Music (1771), and the Royal Academy (1786). Together these three academies have had
2,834 domestic members.
20 In the first period, 1700-29 a larger fraction of students were freshly adopting Latinized surnames, but this does not affect the calculated b, only the fraction of students post 1730 who changed their surname. 21 Some acquired the name by inheriting it from their mother.

29
Figure 20: Inherited Latinized Surnames, Lund and Uppsala, 1700-1909
Sources: As for figures 2.14 and 2.15.
Figure 21: Elite Surnames in the Swedish Royal Academies
Sources: See reference list on Academies.
1
2
4
8
16
32
64
128
1700 1730 1760 1790 1820 1850 1880 1910 1940 1970 2000
Rel
ativ
e R
epre
sen
tati
on
Cohort
LundFitted LundUppsalaFitted Uppsala
b = 0.82
b = 0.75
0.02
0.06
0.25
1.00
4.00
16.00
64.00
1740 1770 1800 1830 1860 1890 1920 1950 1980 2010
Rel
ativ
e R
epre
sen
tati
on
Cohort
Elite
Fitted Elite
..son
Fitted ..son
b = 0.88
b = 0.87

30
Figure 21 shows the relative representation of the surnames of the eighteenth century
elite – Latinized surname and the surnames of nobles - in these three academies by 30 year
generations starting in 1739-1769, and ending in 1980-2012. In the earliest period such
surnames made up half of the members of the academy. By 1980-2012 this had declined 4.1%
of the Academies. But these surnames in 2011 were only 0.71% of the Swedish population, so
they were still strongly overrepresented in the Academies.
The small number of members compared to other groups we have looked at means that
in the latter years there is a lot of sampling error in terms of the frequency of elite surnames.
Taking these academies to represent the top 0.1% of Swedish society the implied persistence b
over these 273 years is 0.88. There is also little sign of an increased rate of regression to the
mean for the entrants to the academies 1980-2012 compared to 1950-79. The estimated b for
elite surnames is still 0.84 for this last generation.
Figure 21 also shows the relative representation of Patronyms in the Academies. Such
surnames are of course still strongly underrepresented, but they have shown a slow but steady
convergence towards proportional representation. However, the implied b is 0.87, close to
that for the elite surnames. However, as always there is a caveat that many people in Sweden
whose father had a patronym switched to another name as an adult, and this switching was
likely selective.
Interpretation
Despite the conventional estimates, Sweden appears to be a society with very modest
rates of intergenerational mobility for occupation and education. Also rates of social mobility
seem no higher now in the modern inclusive, social democrat state than in the pre-industrial
past. Why do the results presented here differ so much from those of conventional mobility
studies?
One objection that has been raised is that the surname evidence above relates to the top
0.1% to 8% of the status distribution, while conventional studies look at mobility across the
entire distribution. Could there be high persistence of status at the upper extreme of the
distribution, but for 99% or more of families in Sweden the high rate of social mobility
traditionally found? Björklund, Roine, and Waldenström (2012), for example, find an
expected overall income mobility b for Swedish men of only 0.26, but for the top 0.1% of the
income distribution the b is 0.9.

31
Suppose this argument of much lower mobility at the top is correct. Then one thing we
would learn is that for social elites – doctors, university professors, lawyers, business leaders –
the standard estimates of social mobility rates would be too high. Persistence at the top of
society, which is perhaps the persistence people care most about, is much greater. But also
consider what would happen in this case to families with the surnames of the eighteenth
century elite, the nobles and the Latinized surnames. Once such families fell out of the top
1% of status, with rapid social mobility in the bottom 99% of the distribution, their status
would quickly fall to the social mean. Status distribution among the surname elite would no
longer be normal, and might even be bi-modal, with a cluster at the top and then a near
normal distribution around the social mean, as in figure 22. In particular there should be no
marked deficiency of elite surnames now at the bottom of the distribution, if mobility rates are
rapid for all below the top 1%.
We can observe the overall distribution of income by surname from the tax returns from
modern Sweden. Figure 23 shows this calculated for six kommuns in the Stockholm region
for 2008. With the tax data that noble and Latinized names are as underrepresented at the
bottom of the income and wealth distribution as they are overrepresented at the top. Even
when they fall out of the top 1% in various measures of status they are still experiencing
markedly slower rates of downwards mobility than we would expect.
The underlying rates of social mobility revealed by surnames turn out to be as high as
those discovered here for Sweden in all societies where we can observe this. Table 3 shows
these estimates for a variety of countries, social groupings, and time periods. If the underlying
rate of social mobility varies little across societies, why is the measured rate for particular
aspects of status lower for societies like Sweden, and why is that measured rate correlated with
income inequality? The hypothesis I would suggest here is that in societies where inequality in
aspects of status such as income, wealth or years of education is lower, the bias in estimating
the underlying rate of social mobility from conventional methods will be greater. For the
relationship of the observed β to the underlying b is given by
( )
(
)
(4)
where y = x + u is the observed status, x is the underlying social competence of families,
assumed to have a similar distribution across societies, and u is the random component. When
we look at earnings or income in a society such as Sweden, the compression of the variation in

32
Figure 22: A Bimodal Status Distribution among the Surname Elite
Figure 23: Actual Status Distribution among Surname Elites, 2008
Source: Income tax returns for Botkyrka, Haninge, Huddinge, Nacka, Stockholm, and Täby,
2008 (884,000 potential tax payers).
Rel
ativ
e F
requen
cy
Social Status
All
Elite
All - Top 2%
0
5
10
15
20
25
30
35
0-249 250-299 300-399 400-599 600-1199 1200-
Per
cen
t
Income (SEK 000)
Noble
Andersson
Latinized

33
Table 3: Estimates of b from Surnames, by Country
Country
Measure
Period
Intergenerational
Correlation
MODERN
USA Attorneys 1950-2011 0.83-0.94
USA Doctors 1950-2011 0.73-0.80
England Attorneys, Doctors 1950-2012 0.69-1.00
England Wealth 1950-2012 0.74
England Education 1950-2012 0.80
Chile Occupations 1940-2010 0.83
China Education 1950-2011 0.66-0.92
Japan Education 1950-2012 0.84
India Doctors 1950-2009 0.89
HISTORIC
England Wealth 1650-1850 0.71-0.85
England Wealth 1380-1650 0.74-0.85
England Education 1200-1500 0.80-0.90
England Education 1500-1800 0.80-0.90
India Doctors 1860-1950 0.89
Japan Education 1880-1900 0.72
China Education 1700-1900 0.81
Sources: England, Clark, 2013, Clark and Cummins, 2013, China, Hua and Clark, 2012, India,
Clark and Landes, 2012, Japan, Clark and Ishii, 2012, USA, Clark et al., 2012. Chile
communication from Daniel Diaz.

34
these means that they function less well as a signal of underlying social competence. is
large for earnings or income. The noise component in relating earnings to underlying
social competence in a society such as Sweden compared to the USA is relatively more
important. Thus the downwards bias of the conventional β as a measure of b is greater.
This simple model of slowly evolving latent status, with the process Markov, the same in
every generation and dependent only on the underlying status of parents, will also predict
another feature of recent studies of social mobility across multiple generations in England,
Sweden and Denmark, which is the stronger than expected connection between grandparents
and grandchildren, and even great-grandparents and great-grandchildren.22 For this Markov
model for the latent variable contains the prediction that after the second generation,
measured social mobility rates will slow down to the underlying mobility rate of social
competence. Measured downwards mobility for a high income family will be fast in the
generation of the children, but then much slower for the generation of the grandchildren, the
great-grandchildren and so on measured relative to the first generation.
If we now indicate the correlation measured between members of families n generations
apart as βn, then the one generation correlation normally estimated will relate to the underlying
persistence of status in the form
(5)
where θ is the attenuation factor caused by the random components linking observed status
on any one dimension with underlying status.23 When we look, however, at the correlation
between n generations, and estimate now , the correlation across n generations, we will
predict that
(6)
The downward bias caused by the error component in the measure of status is the same across
all generations.
22 See, for example, Clark and Cummins, 2013, Lindahl, et al., 2012, Boserup et al., 2013. 23
(
)

35
Table 4: Underlying b Implied by Multi-Generation Status Correlations
Source
Measure
β1
β2
β3
Implied b
England,
1858-2012
Wealth 0.467 0.368 0.315 0.81
Sweden,
1865-2005
Education
Gen 1-4
0.353
0.216
0.123 0.60
Sweden,
1925-2005
Earnings,
Gen 2-4
0.288
0.141
- 0.49
Denmark,
1983-2011
Wealth 0.168
0.094
- 0.56
Sources: Clark and Cummins, 2013, Lindahl, et al., 2012, Boserup, Kopczuk, and Kreiner,
2013.
Table 4 shows some estimates for recent years of the correlations between parents and
children in wealth, education, and earnings compared to the correlation between parents and
grandchildren, and parents and great-grandchildren. In each case the data is consistent with a
much more highly correlated underlying social status for families. The value implied for the
correlation of the underlying status is 0.49-0.81, two to three times as high as the measured
one generation correlation. However, the implied values for this underlying correlation are
not as high in the Nordic countries as would be predicted from the surname evidence above in
Sweden. The degree of error attenuation by generation may not be constant, however. If
more of the variance in earnings, for example, at the grandparent level was from the error
component for the Swedish earnings study, since the grandparent earnings were imputed from
occupations, it will reduce the two generation correlations more than the one generation
correlations in earnings.

36
So my conclusion is the recent multigenerational Nordic evidence on mobility is
consistent with a much slower change of underlying social status between generations, as
observed above. The persistence coefficient implied, 0.5-0.6, is not, however, as great as
would be predicted from surname persistence, which implies 0.7-0.8. But it is still a great deal
higher than the normal estimates of intergenerational correlation of education, income and
wealth for Nordic countries.
Conclusions
Generalized and long-term social mobility in Sweden in recent years is much lower
than the rates reported in standard two generation studies of the intergenerational correlation
of income or education. Rates of long run social mobility are indeed so low that the 18th
century elite in Sweden have persisted to the present as a relatively advantaged group. There
is little evidence that intergenerational mobility rates have increased within the last 2-3
generations, compared to rates in the pre-industrial era. The b for underlying social status
may indeed be as high as 0.70-0.80. Such mobility rates are the same as we observe for
underlying social status in a variety of other countries such as the UK, USA, and even
India and Chile.
The strong intergenerational persistence of status in a country with many years of
generous public provision of opportunities and funding for education, at rates similar to
other countries without such equalizing expenditures, suggests that the forces that
determine intergenerational mobility must be fundamental to the formation and functioning
of families. These may be forces that are impossible to change with public policy.

37
References
Surname Data:
Surname frequencies, Dec 31, 2011: Statistics Sweden, Surname Search,
Earlier Surname Frequencies:
Swedish Death Index, 1901-2009 (version 5.00). 2011. Federation of Swedish Genealogical
Societies.
Parish Records of Birth, Death, and Marriage, 1630-1920
(http://www.familysearch.org/eng/search/frameset_search.asp).
Attorneys:
Members of the Swedish Bar Association (http://www.advokatsamfundet.se/Advokatsamfundet-
engelska/Find-a-lawyer/)
Doctors:
Sverige, Socialstyrelsen. 2011. Förteckning över Sveriges legitimerade läkare,
2010/2011. Stockholm : Fritze.
Sverige, Socialstyrelsen. 1972. Legitimerade läkare, 1972. Stockholm : Fritze.
Listing of Doctors, with date of birth, 1939.
Widstrand, A. (ed.) 1939. Sveriges Läkare i ord och bild 1939 (Swedish doctor in words
and pictures). Stockholm.
University Theses:
Lund University, 1960 – 2011
http://www.lunduniversity.lu.se/o.o.i.s/24965?ref=simple&orgid=&query=W%C3
%A5lander&luur_simplesearch_submit=Search
Stockholm University, 1999-2011 http://su.diva-portal.org/smash/searchadthe.jsf
Uppsala University, 1975-2011 http://uu.diva-portal.org/smash/searchadthe.jsf

38
Noble Family Surnames:
Ridderhuset. 2012. Ätter I vapendatabasen (Arms Lineage Database)
http://www.riddarhuset.se/jsp/admin/archive/sbdocarchive/atter_i_AK07_vapendatabasen.pdf
Tax Assessments, 2008:
Taxerings- och förmögenhetskalendar för Stockholms kommun 2008. Taxerings- och
förmögenhetskalendar för Stockholms län Norra 2008. Taxerings- och
förmögenhetskalendar för Stockholms län Södra 2008.
(http://www.taxeringskalendern.se/)
Real estate prices up to and including March 2012 - Statistics Sweden
Members of the Royal Academies Royal Academy of Sciences (1739-2012):
http://sv.wikipedia.org/wiki/Lista_%C3%B6ver_ledam%C3%B6ter_av_Kungliga_
Vetenskapsakademien
2012 – Communication from Maria Asp Dahlbäck, Archivist of the Royal Academy
Royal Academy (1779-2012):
http://en.wikipedia.org/wiki/List_of_members_of_the_Swedish_Academy
Royal Academy of Music (1771-2012):
http://sv.wikipedia.org/wiki/Lista_%C3%B6ver_Musikaliska_Akademiens_ledam%
C3%B6ter
Lund University Matriculates, 1668-1908:
Edlund, Barbro. 1979. Lunds universitets matrikel 1732-1830: album Academiae
Carolinae. Lund.
Karlberg, Gustaf. 1908. Studerande Kalmarbor I Lund, 1668-1907: Biografiska och

39
Genealogiska Anteckningar. Lund.
Lundin, A. H. 1882. Småländska Nationen I Lund: Biografiska och Genealogiska
Anteckningar. Lund.
Sjo stro m, Carl. 1897. Skånska Nationen Före Afdelningars Tid (1682-1833):
Biografiska och Genealogiska Anteckningar. Lund.
Sjo stro m, Carl. 1901. Blekingska Nationen, 1697-1900. Lund.
Sjo stro m, Carl. 1904. Skånska Nationen, 1833-1889: Biografiska och Genealogiska
Anteckningar. Lund.
Sjo stro m, Carl. 1907. Go teborgs nation i Lund, 1669-1906. Lund. Sjo stro m, Carl. 1908.
Vermlands nation i Lund 1682-1907. Lund.
Uppsala University Matriculates, 1595-1902, 1942-1954:
Brenner, S. Otto and Gösta Thimon. 1971. Uppsala universitets matrikel 1595-
1817: register. Uppsala: Almqvist and Wiksell.
Odén, Klas Gustav. 1902. Östgötars Minne. Biografiska Anteckningar om
Studerande Östgötar I Uppsala, 1595-1900. Stockholm.
Elvin, Gösta Vilhelm. 1956. O stgo ta Nation i Uppsala 1944-1954, Porträttkatalog med
biografiska uppgifter. Uppsala: Östgöta nation.
Uppsala Universitet. 1954. Va stmanlands-Dala Nation i Uppsala, 1942-1952.
Uppsala: Va stmanlands-Dala Nation.
Other References:
Almenberg, Johan and Anna Dreber. 2009. “Lady and the Trump: Status and Wealth in the
Marriage Market,” Kyklos, 62(2): 161-181.
Björklund, Anders, Jesper Roine, and Daniel Waldenström. 2012. “Intergenerational top
income mobility in Sweden: Capitalist dynasties in the land of equal opportunity?” Journal
of Public Economics,96: 474-484.
Boserup, Simon Halphen, Wojciech Kopczuk, and Claus Thustrup Kreiner. 2013.
“Intergenerational Wealth Mobility: Evidence from Danish Wealth Records of Three
Generations.” Working Paper, University of Copenhagen.
Clark, Gregory and Neil Cummins. 2013. “Intergenerational Mobility in England, 1858-
2012. Wealth, Surnames, and Social Mobility.” Working Paper, University of
California, Davis.

40
Clark, Gregory and Tatsuya Ishii. 2012. “Social Mobility in Japan, 1868-2012: The Surprising
Persistence of the Samurai.” Working Paper.
Clark, Gregory and Zach Landes. 2012. “Caste versus Class: Social Mobility in India, 1860-
2012” Working paper.
Clark, Gregory, Daniel Marcin, Kuk Mo Jung, Ariel M. Marek, Kevin M. Williams. 2012.
“Social Mobility Rates in the USA, 1920-2010: A Surname Analysis.” Working Paper,
UC Davis.
Corak, Miles. 2012. "Inequality from Generation to Generation: The United States in
Comparison," in Robert Rycroft (editor), The Economics of Inequality, Poverty, and
Discrimination in the 21st Century, ABC-CLIO.
Hao, Yu and Gregory Clark. 2012. ““Social Mobility in China, 1645-2012: A Surname Study”
Working paper.
Hertz, Tom, Tamara Jayasundera, Patrizio Piraino, Sibel Selcuk, Nicole Smith, and Alina
Verashchagina. 2008. "The Inheritance of Educational Inequality: International
Comparisons and Fifty-Year Trends" The B.E. Journal of Economic Analysis & Policy 7.2.
Lindahl, Mikael, Mårten Palme, Sofia Sandgren Massih, Anna Sjögren. 2012. “The
Intergenerational Persistence of Human Capital: an Empirical Analysis of Four
Generations” Working Paper, IFAU, Uppsala University.
OECD/WHO, 2010. Policy Brief on the International Migration of Health Workforce. Feb.
www.oecd.org/health/workforce
Watson, Henry William and Francis Galton. 1875. “On the Probability of the Extinction of
Families.” Journal of the Anthropological Institute of Great Britain, 4, 138-145.

41