Embed Size (px)
Citation preview

WHAT KIND OF STRATEGIES CAN I USE TO HELP 4TH
GRADE
STUDENTS LEARN THEIR MULTIPLICATION FACTS?
2
ABSTRACT
The study investigates the value and rationale of using some multiplication learning
strategies in the Mathematics classroom with special focus on their effectiveness in
promoting problem solving skills in Mathematics. The work involves comparison
with traditional teaching methods. The sample was composed of 4th
grade students,
separated into two groups, taught various strategies on how to master their
multiplication facts. Pre- and post- mathematical proficiency tests were adopted to
evaluate students’ performance in multiplication problem solving skills and
achievement. This was done over a period of four weeks. After the study, an
evaluation questionnaire was given to each of the participants at the end of the
experiment.
3
Table of Contents
CHAPTER 1: INTRODUCTION .................................................................................. 5
Background and Research Context ............................................................................ 5 Purpose of Study ........................................................................................................ 6
The Academic Context and Key Academic Theory .................................................. 8 Hypothesis and Research Questions ........................................................................ 10 Key Assumptions ..................................................................................................... 11
CHAPTER 2: LITERATURE REVIEW ..................................................................... 12
Introduction to Chapter ............................................................................................ 12 Multiplication Facts Teaching Strategies ................................................................. 12 Integrating the Strategies ......................................................................................... 16
Definitions ................................................................................................................ 17
CHAPTER 3: METHOD (PROCEDURES FOR INVESTIGATING QUESTIONS) 19
Introduction to Chapter ............................................................................................ 19 Participants and Setting ............................................................................................ 19
Materials and Data Collection Instruments .............................................................. 19 Procedure ................................................................................................................. 22
CHAPTER 4: RESULTS (OUTCOMES) ................................................................... 27
Introduction to Chapter ............................................................................................ 27
Measures of Facts .................................................................................................... 27
CHAPTER 5: DISCUSSION ....................................................................................... 31
Discussion ................................................................................................................ 31 Limitations of Study ................................................................................................ 32
Importance of Findings ............................................................................................ 34 Summary / Conclusion ............................................................................................. 35
REFERENCES ............................................................................................................ 36
LIST OF FIGURES ..................................................................................................... 45
Figure 1: Example of visual representation of derived fact strategy for 6 x 7 ......... 45
Figure 2: Connection between facts and extended facts using number lines and
blocks ....................................................................................................................... 46
Figure 3: Extended Fact and Partial Product Algorithm .......................................... 47 Figure 4: Number Lines for Teaching Approximation ............................................ 47 Figure 5: Sample Word Problems for Integrated Group .......................................... 48 Figure 6: Graphical representation of pre-, post -tests & maintenance mean scores
for common multiplication facts .............................................................................. 48
4
Figure 7: Graphical representation of pre-, post -tests & maintenance mean scores
for hard multiplication facts ..................................................................................... 49
LIST OF TABLES ....................................................................................................... 50
Table 1: Participants' Demographic Information ..................................................... 50 Table 2: Mean, Standard Deviation, Percent Correct for Common Multiplication
Facts ......................................................................................................................... 50 Table 3: Mean, Standard Deviation, Percent Correct for Hard Multiplication Facts
.................................................................................................................................. 51 Table 4: Mean, Standard Deviation, Percent Correct for Extended Facts Tests ...... 51 Table 5: Mean, Standard Deviation, Percent Correct for Computation Tests ......... 52
Table 6: Mean, Standard Deviation, Percent Correct for Approximation Tests ...... 52 Table 7: Mean, Standard Deviation for Attitude towards Math .............................. 52
LIST OF APPENDICES .............................................................................................. 53
Appendix 1: Weekly Activity Chart ........................................................................ 53 Appendix 2: Letter of Permission ............................................................................ 54 Appendix 3a: Program Evaluation Letter to Students ............................................. 55
Appendix 3b: Students' perspectives about teaching methods ................................ 56 Appendix 4: Guidance Observation Sheet ............................................................... 59
5
CHAPTER 1: INTRODUCTION
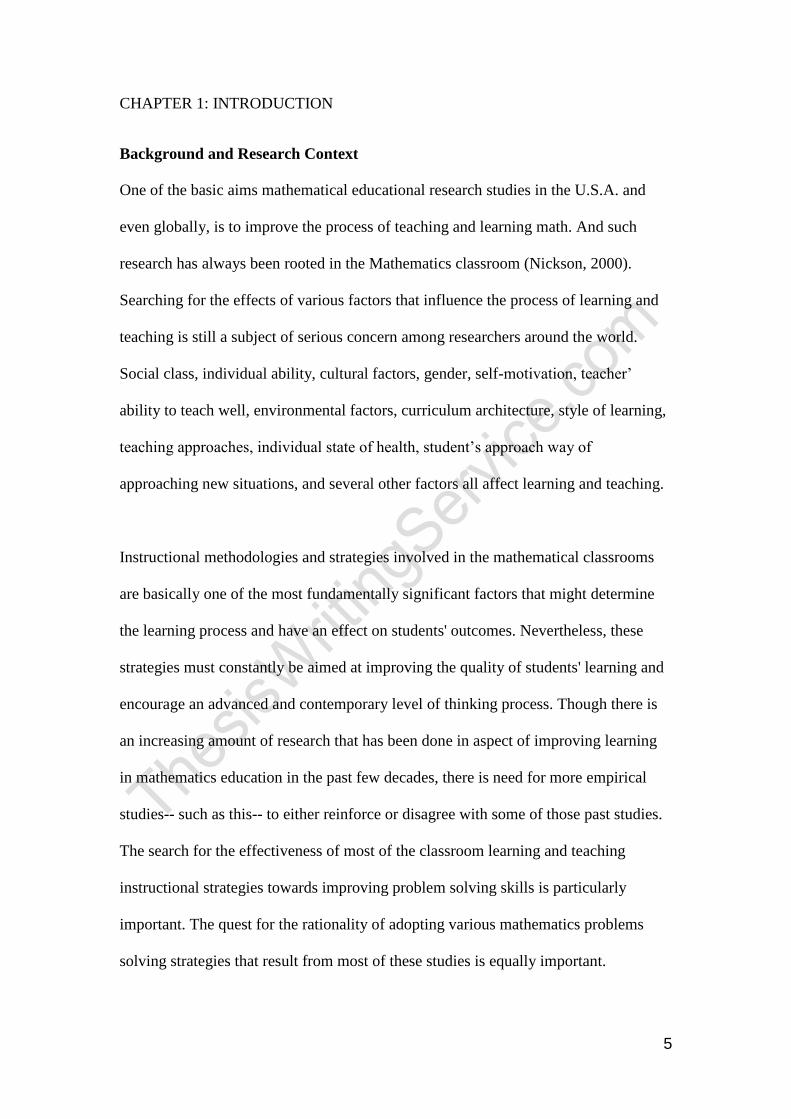
Background and Research Context
One of the basic aims mathematical educational research studies in the U.S.A. and
even globally, is to improve the process of teaching and learning math. And such
research has always been rooted in the Mathematics classroom (Nickson, 2000).
Searching for the effects of various factors that influence the process of learning and
teaching is still a subject of serious concern among researchers around the world.
Social class, individual ability, cultural factors, gender, self-motivation, teacher’
ability to teach well, environmental factors, curriculum architecture, style of learning,
teaching approaches, individual state of health, student’s approach way of
approaching new situations, and several other factors all affect learning and teaching.
Instructional methodologies and strategies involved in the mathematical classrooms
are basically one of the most fundamentally significant factors that might determine
the learning process and have an effect on students' outcomes. Nevertheless, these
strategies must constantly be aimed at improving the quality of students' learning and
encourage an advanced and contemporary level of thinking process. Though there is
an increasing amount of research that has been done in aspect of improving learning
in mathematics education in the past few decades, there is need for more empirical
studies-- such as this-- to either reinforce or disagree with some of those past studies.
The search for the effectiveness of most of the classroom learning and teaching
instructional strategies towards improving problem solving skills is particularly
important. The quest for the rationality of adopting various mathematics problems
solving strategies that result from most of these studies is equally important.
6
In America's modern-day academics setting, mathematics education is regarded as the
practice of teaching and learning mathematics, in conjunction with the related
scholarly research. Primarily in mathematics education, researchers are concerned
with methods, tools and approaches that promote study of practice or practice itself.
Today, mathematics education research has grown into a far-reaching field of study
(Orton, 1992), having its own theories, concepts, methods, organizations –both at
national and international levels, literature and conferences. This study especially
focuses on multiplication problem solving skills as a way of contributing to the
existing body of studies in the mathematics educational research field.
The contents of this chapter consist of many sections that provide answers to the
following questions: Why is the study needed? What is researcher aiming at? What
are the research questions? Moreover, what is the context of the study?
Purpose of Study
Generally as found in the review of literature in mathematics education and
researcher’s observation based on personal experience in classroom teaching in
America, this study is important and needed due to the concerns discussed below.
Prospect of Improving Mathematical Problem Solving Skills via Multiplication
Many researchers in various parts of the world have drawn attention to the benefits
which mathematics learning strategies can have over the conventional and
individualized forms of support that have been provided for students who find it
learning difficult in the mathematics classroom. This study was specifically designed
to look at the effects of various strategies of teaching and learning multiplication facts
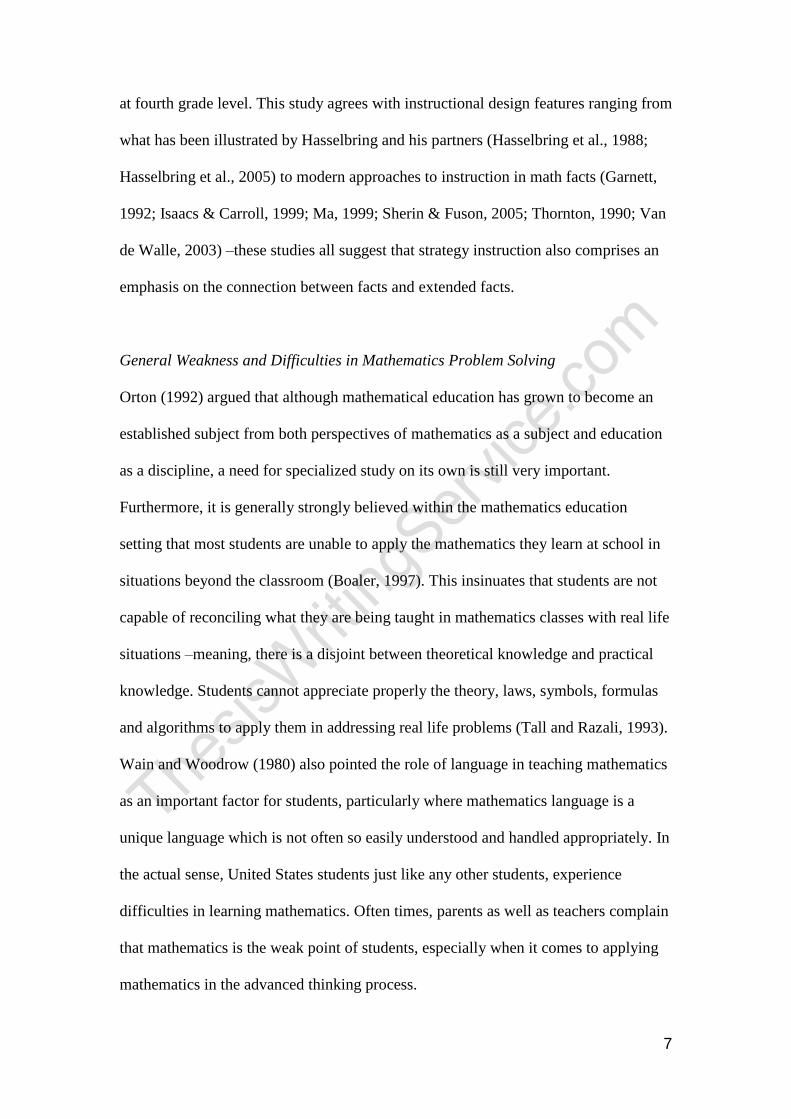
7
at fourth grade level. This study agrees with instructional design features ranging from
what has been illustrated by Hasselbring and his partners (Hasselbring et al., 1988;
Hasselbring et al., 2005) to modern approaches to instruction in math facts (Garnett,
1992; Isaacs & Carroll, 1999; Ma, 1999; Sherin & Fuson, 2005; Thornton, 1990; Van
de Walle, 2003) –these studies all suggest that strategy instruction also comprises an
emphasis on the connection between facts and extended facts.
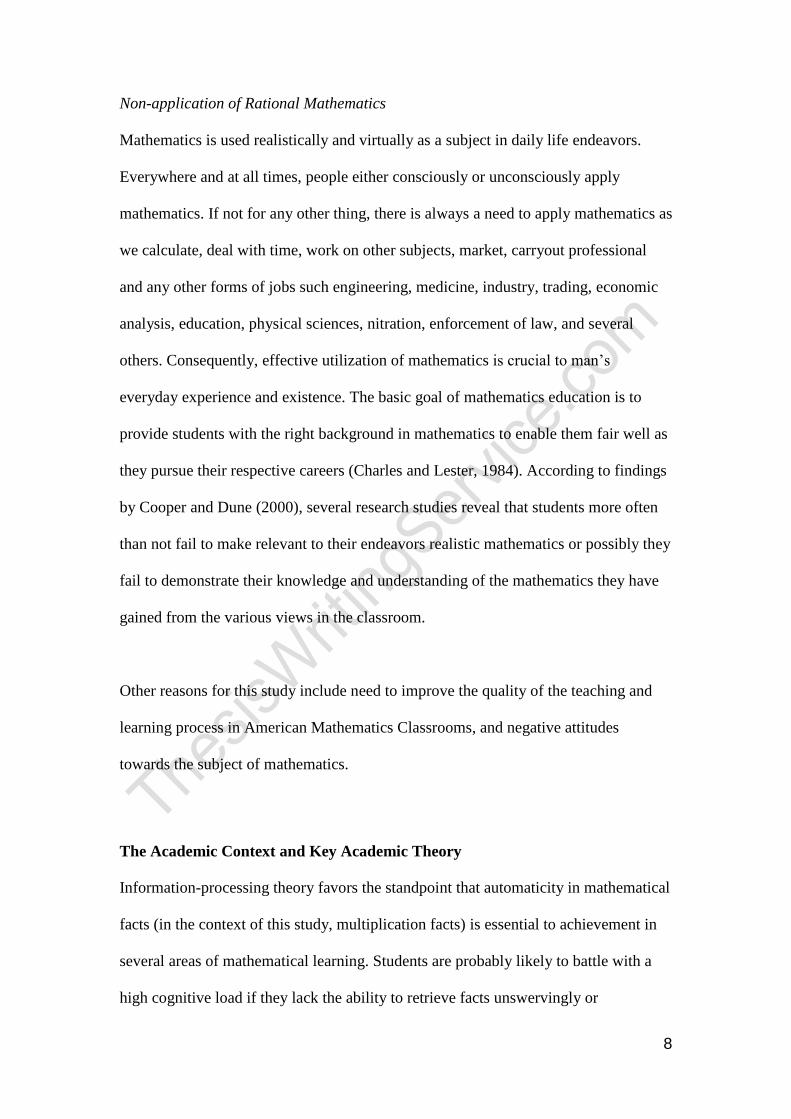
General Weakness and Difficulties in Mathematics Problem Solving
Orton (1992) argued that although mathematical education has grown to become an
established subject from both perspectives of mathematics as a subject and education
as a discipline, a need for specialized study on its own is still very important.
Furthermore, it is generally strongly believed within the mathematics education
setting that most students are unable to apply the mathematics they learn at school in
situations beyond the classroom (Boaler, 1997). This insinuates that students are not
capable of reconciling what they are being taught in mathematics classes with real life
situations –meaning, there is a disjoint between theoretical knowledge and practical
knowledge. Students cannot appreciate properly the theory, laws, symbols, formulas
and algorithms to apply them in addressing real life problems (Tall and Razali, 1993).
Wain and Woodrow (1980) also pointed the role of language in teaching mathematics
as an important factor for students, particularly where mathematics language is a
unique language which is not often so easily understood and handled appropriately. In
the actual sense, United States students just like any other students, experience
difficulties in learning mathematics. Often times, parents as well as teachers complain
that mathematics is the weak point of students, especially when it comes to applying
mathematics in the advanced thinking process.
8
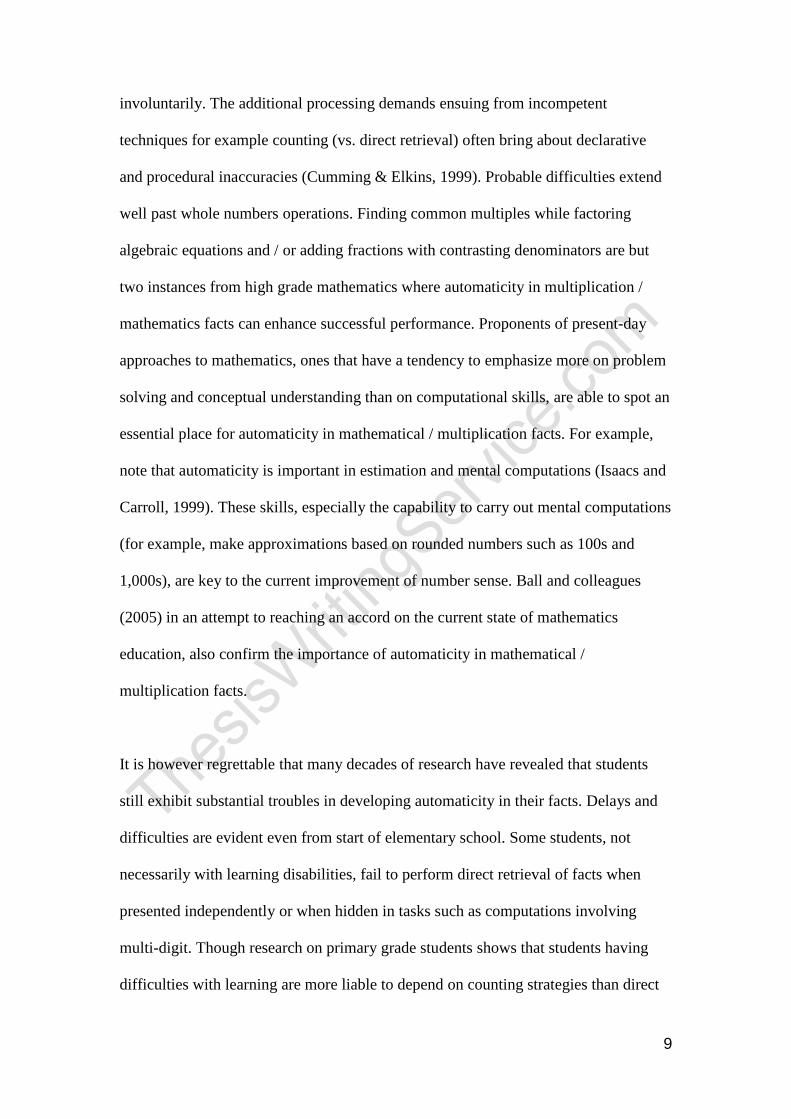
Non-application of Rational Mathematics
Mathematics is used realistically and virtually as a subject in daily life endeavors.
Everywhere and at all times, people either consciously or unconsciously apply
mathematics. If not for any other thing, there is always a need to apply mathematics as
we calculate, deal with time, work on other subjects, market, carryout professional
and any other forms of jobs such engineering, medicine, industry, trading, economic
analysis, education, physical sciences, nitration, enforcement of law, and several
others. Consequently, effective utilization of mathematics is crucial to man’s
everyday experience and existence. The basic goal of mathematics education is to
provide students with the right background in mathematics to enable them fair well as
they pursue their respective careers (Charles and Lester, 1984). According to findings
by Cooper and Dune (2000), several research studies reveal that students more often
than not fail to make relevant to their endeavors realistic mathematics or possibly they
fail to demonstrate their knowledge and understanding of the mathematics they have
gained from the various views in the classroom.
Other reasons for this study include need to improve the quality of the teaching and
learning process in American Mathematics Classrooms, and negative attitudes
towards the subject of mathematics.
The Academic Context and Key Academic Theory
Information-processing theory favors the standpoint that automaticity in mathematical
facts (in the context of this study, multiplication facts) is essential to achievement in
several areas of mathematical learning. Students are probably likely to battle with a
high cognitive load if they lack the ability to retrieve facts unswervingly or
9
involuntarily. The additional processing demands ensuing from incompetent
techniques for example counting (vs. direct retrieval) often bring about declarative
and procedural inaccuracies (Cumming & Elkins, 1999). Probable difficulties extend
well past whole numbers operations. Finding common multiples while factoring
algebraic equations and / or adding fractions with contrasting denominators are but
two instances from high grade mathematics where automaticity in multiplication /
mathematics facts can enhance successful performance. Proponents of present-day
approaches to mathematics, ones that have a tendency to emphasize more on problem
solving and conceptual understanding than on computational skills, are able to spot an
essential place for automaticity in mathematical / multiplication facts. For example,
note that automaticity is important in estimation and mental computations (Isaacs and
Carroll, 1999). These skills, especially the capability to carry out mental computations
(for example, make approximations based on rounded numbers such as 100s and
1,000s), are key to the current improvement of number sense. Ball and colleagues
(2005) in an attempt to reaching an accord on the current state of mathematics
education, also confirm the importance of automaticity in mathematical /
multiplication facts.
It is however regrettable that many decades of research have revealed that students
still exhibit substantial troubles in developing automaticity in their facts. Delays and
difficulties are evident even from start of elementary school. Some students, not
necessarily with learning disabilities, fail to perform direct retrieval of facts when
presented independently or when hidden in tasks such as computations involving
multi-digit. Though research on primary grade students shows that students having
difficulties with learning are more liable to depend on counting strategies than direct
10
retrieval whilst handling problems involving single-digit fact (Hanich, Jordan,
Kaplan, & Dick, 2001). Furthermore, these students are likely to make more retrieval
as well as counting mistakes on simple addition and multiplication problems. The
outcome of Goldman and her partners’ research on second through sixth grade
students with learning disabilities shows that these students tend to depend more
profoundly on counting rather than direct retrieval methods (Goldman et al, 1988).
Also at fourth grade and even other grades, studies have revealed that two groups
often emerge when facts retrieval challenges are given. The two groups are those who
use suboptimal strategies and those who employ more sophisticated strategies –with
the former group being largely dominated by students having learning challenges. As
a result, Goldman et al. (1988) in their conclusion state that elementary students with
learning challenges are belated in their capability to learn facts automatically, and
propose that this delay can be tackled through systematic practice –a finding that is in
agreement with the outcomes of other research (e.g., Geary, 1993) suggesting the
necessity of interventions for students with learning disabilities in order to make
certain that they are able to retrieve facts automatically upon completion of
elementary school.
Hypothesis and Research Questions
This study is intended to scrutinize the impact of various strategies to teaching
multiplication facts to groups of low level fourth grade students. My intervention
intends to draw on the instructional design based on the fact that strategy instruction
also comprises an emphasis on the association between facts and extended facts.
11
The research questions below guided this study:
1. Would any other specific approach to teaching multiplication facts result to
greater automaticity in facts than just timed practice?
2. Would the specific approach above help the students master learning their
multiplication facts better?
3. Utilizing a pre- and post- test, would extensive practice on multi-digit
computational challenges in the comparison circumstance bring about any
noteworthy differences?
Key Assumptions
Without doubt, any research methodology is bound to have both merits and demerits,
and there is not likely to be one particular best system of approaching the task in
question. As Silverman (1993) lays the point, methodologies are not like theories,
which are either true or false; rather they are only more or less useful. Therefore, the
following assumptions are proposed in order to boost the usefulness of the
methodology adopted in this research:
1. The case study methodology applied is accurate.
2. The subject under investigation has been able to set a record that worthy of this
kind of study.
3. Unbiased and uncomplicated analyses have been provided by researcher.
4. Researcher has maintained equilibrium between theoretical aspiration and what is
practically obtainable in mainstream / conventional setting.
5. All that has been sketched out in the previous brief topics as well as problems
above constitute the most noteworthy in mathematics teaching and have brought
about a rethink of strategies for learning.
12
CHAPTER 2: LITERATURE REVIEW
Introduction to Chapter
A concrete understanding of the fundamentals of multiplication / mathematics is
desirable in order to be able to appreciate the sufficiency of any multiplication method
together with its application restrictions. This understanding will aid in analyzing how
accurately the flow is mathematically described, which abridging assumptions were
made, and how they influence the end result of the calculation. To help satisfy this
requirement, literature facts will be discussed in detail in this chapter. Therefore, this
chapter reviews literature on fundamentals of learning from the standpoint of
elementary math / multiplication, and some teaching methodologies which help in
improving learning multiplication facts at fourth grade. Then the significance of
integrating these teaching strategies is also discussed.
Multiplication Facts Teaching Strategies
It has been asserted that quick recall of basic multiplication facts is crucial in the
application of math to everyday / real-life circumstances and same may also enhance
success with more complex problems in mathematics (Mercer & Miller, 1992). A
survey in the United States however, found that quite a number of adults could not
cope with simple, basic multiplication. Susan (2011), and Lombardo and Drabman
(1985) suggested that failure to be able to master multiplication tables can drastically
hinder a student’s progress in math / arithmetic, whereas Mercer and Miller (1992)
maintained their point that the rate of learning in the subject of mathematics may be
cut to half that of regular students due to difficulties with basic mathematics facts.
These claims are also particularly correct when applied to the context of learning
multiplication facts. It is very likely that, as such basic skills get more vastly
13
practiced, they turn out to be automatic, thereby requiring less cognitive processing
faculty, which in turn creates more allowance for the capacity to understand and
interrelate higher order concepts (Hasselbring et al 1987; 1988).
Students having learning difficulties in particular are more likely to have difficulties
with immediate memory for multiplication / number facts (Miles & Miles, 1992).
Extra practice may be required to help them learn these facts in addition to them
requiring help in using the most helpful compensatory strategies to derive facts that
are not automatically retrievable (Lloyd & Keller, 1989). This additional assistance
however may go beyond the available resources of many schools; consequently,
parental support may be next and only option to fall back on.
Although several unconventional strategies have been applied in teaching
multiplication facts to students and people in general, each of these strategies works
differently with different students in terms of efficiency. Rote memorization,
otherwise known as drilling, was once a generally applied instructional strategy for
teaching multiplication / mathematics facts. The New York Times Magazine reveals
that studies suggest that this method is ineffective and can perhaps be harmful. That
is, while some subjects discovered that the rules and strategies were too complicated
(Chinn & Ashcroft, 1992), attaining an automatic level of response was simply
impossible for others (Hasselbring et al., 1988). Consequently, new strategies have
surfaced to assist students master their multiplication facts much better. Those
strategies that offer promise are the basis of this study. They include: Count-By; Time
Delay; and Strategy Instruction.
14
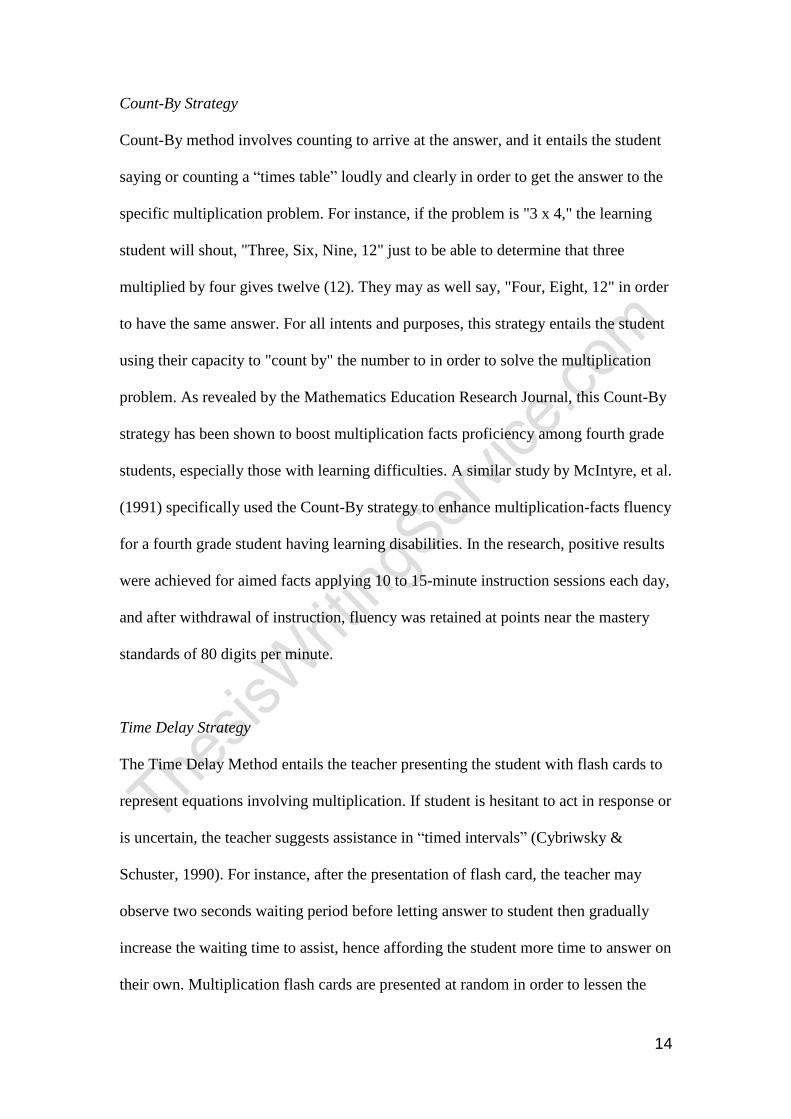
Count-By Strategy
Count-By method involves counting to arrive at the answer, and it entails the student
saying or counting a “times table” loudly and clearly in order to get the answer to the
specific multiplication problem. For instance, if the problem is "3 x 4," the learning
student will shout, "Three, Six, Nine, 12" just to be able to determine that three
multiplied by four gives twelve (12). They may as well say, "Four, Eight, 12" in order
to have the same answer. For all intents and purposes, this strategy entails the student
using their capacity to "count by" the number to in order to solve the multiplication
problem. As revealed by the Mathematics Education Research Journal, this Count-By
strategy has been shown to boost multiplication facts proficiency among fourth grade
students, especially those with learning difficulties. A similar study by McIntyre, et al.
(1991) specifically used the Count-By strategy to enhance multiplication-facts fluency
for a fourth grade student having learning disabilities. In the research, positive results
were achieved for aimed facts applying 10 to 15-minute instruction sessions each day,
and after withdrawal of instruction, fluency was retained at points near the mastery
standards of 80 digits per minute.
Time Delay Strategy
The Time Delay Method entails the teacher presenting the student with flash cards to
represent equations involving multiplication. If student is hesitant to act in response or
is uncertain, the teacher suggests assistance in “timed intervals” (Cybriwsky &
Schuster, 1990). For instance, after the presentation of flash card, the teacher may
observe two seconds waiting period before letting answer to student then gradually
increase the waiting time to assist, hence affording the student more time to answer on
their own. Multiplication flash cards are presented at random in order to lessen the
15
likelihood that the student will turn out memorizing correct responses. Actually, the
goal is utilize a repetitive method to assist student; that is, through repetition student
will in the long run be able to respond without delay and more accurately exclusive of
teacher’s assistance.
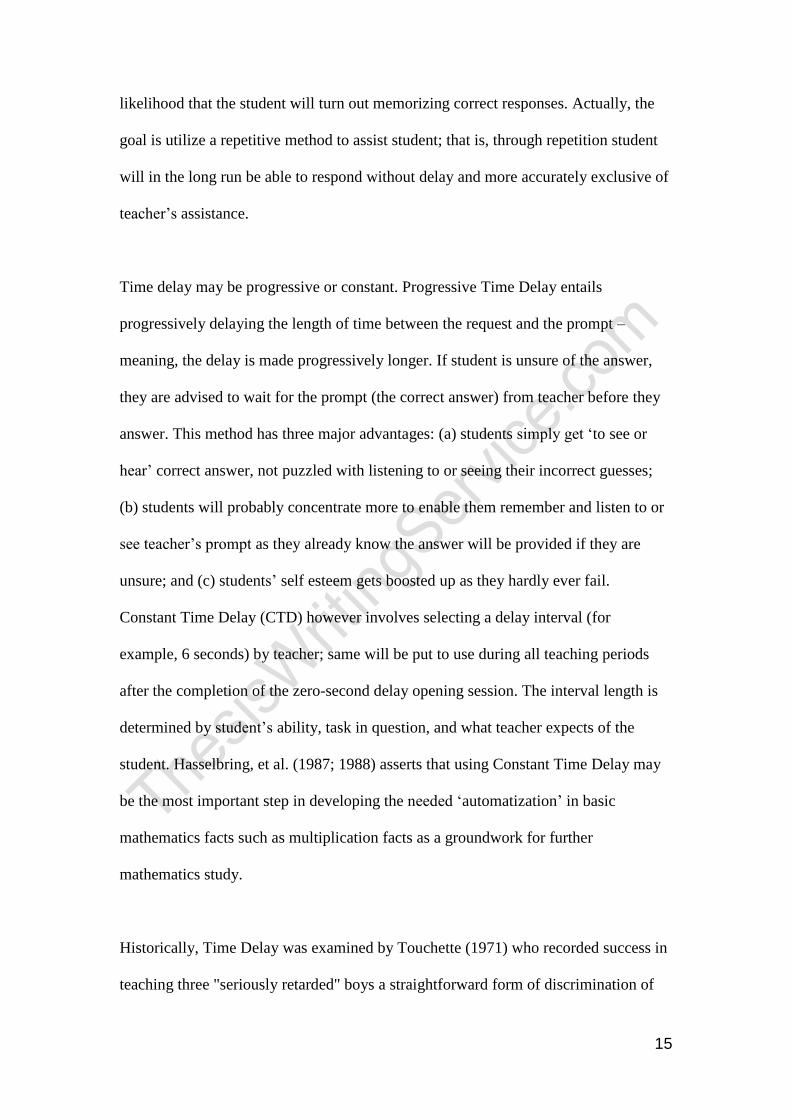
Time delay may be progressive or constant. Progressive Time Delay entails
progressively delaying the length of time between the request and the prompt –
meaning, the delay is made progressively longer. If student is unsure of the answer,
they are advised to wait for the prompt (the correct answer) from teacher before they
answer. This method has three major advantages: (a) students simply get ‘to see or
hear’ correct answer, not puzzled with listening to or seeing their incorrect guesses;
(b) students will probably concentrate more to enable them remember and listen to or
see teacher’s prompt as they already know the answer will be provided if they are
unsure; and (c) students’ self esteem gets boosted up as they hardly ever fail.
Constant Time Delay (CTD) however involves selecting a delay interval (for
example, 6 seconds) by teacher; same will be put to use during all teaching periods
after the completion of the zero-second delay opening session. The interval length is
determined by student’s ability, task in question, and what teacher expects of the
student. Hasselbring, et al. (1987; 1988) asserts that using Constant Time Delay may
be the most important step in developing the needed ‘automatization’ in basic
mathematics facts such as multiplication facts as a groundwork for further
mathematics study.
Historically, Time Delay was examined by Touchette (1971) who recorded success in
teaching three "seriously retarded" boys a straightforward form of discrimination of
16
the letter E reversals, with errorless results. Constant Time Delay was used by
Cybriwsky and Schuster (1990); multiplication facts were taught to a student with
behavioral disorders and learning difficulties – who learnt 15 math facts with an error
rate of 2.8% in just about one hour of instruction. In a similar study, Mattingly and
Bott (1990) got almost an error-free learning, 98.3%, for 30 multiplication facts
involving a group of four students having learning difficulties in Grades 5 and 6.
The minimal preparation and training time needed for Constant Time Delay Strategy
and Count-By Strategy makes them predominantly appropriate as means of teaching
students quick recall of multiplication facts, whether they are experiencing difficulties
or not. However, it must be noted at this point that investigative studies on their
effectiveness are way too small in number.
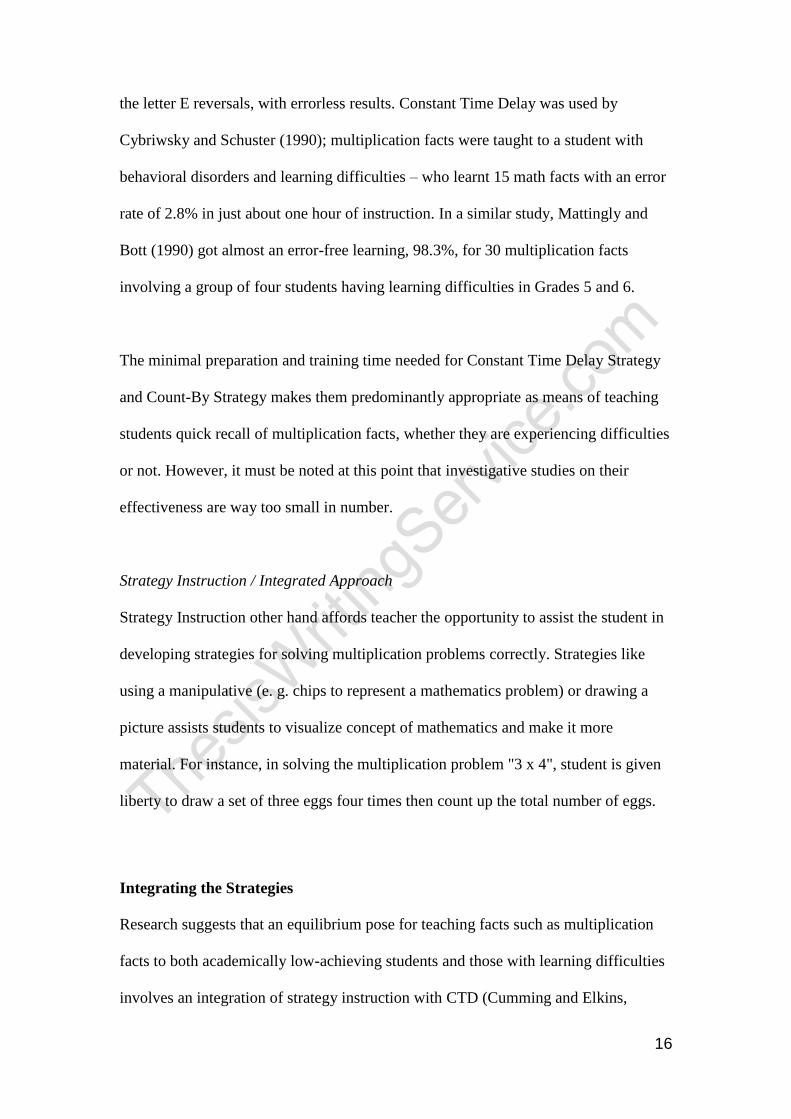
Strategy Instruction / Integrated Approach
Strategy Instruction other hand affords teacher the opportunity to assist the student in
developing strategies for solving multiplication problems correctly. Strategies like
using a manipulative (e. g. chips to represent a mathematics problem) or drawing a
picture assists students to visualize concept of mathematics and make it more
material. For instance, in solving the multiplication problem "3 x 4", student is given
liberty to draw a set of three eggs four times then count up the total number of eggs.
Integrating the Strategies
Research suggests that an equilibrium pose for teaching facts such as multiplication
facts to both academically low-achieving students and those with learning difficulties
involves an integration of strategy instruction with CTD (Cumming and Elkins,
17
1999). According to their research, instruction in strategies alone may not essentially
bring about automaticity. CTD is crucial. However, strategies assist in increasing a
student’s ability to use numbers in a more flexible manner, and in view of that,
Cumming and Elkins argue the adoption of strategy instruction for all students all the
way through the end of elementary school. In fact, an international comparative math
research shows that fact strategies are a regular feature of instruction for Asian
students in their elementary grade (Ma, 1999; Fuson & Kwon, 1992). In line with the
above arguments, strategy instruction can also be advantageous to the development of
mental calculations and estimation. In this regard, strategy instruction assists the
student in developing number sense, and this used to be topic of fanatical interest in
the special education literature in the late 1990s (Gersten & Chard, 1999).
Definitions
Within the content of this study, below are the terms used and their definitions:
Traditional teaching method: the conventional teaching methods that teachers have
long used in their mathematics classes where information is didactically presented by
teachers.
Teaching strategies: refers to all teacher's moves, objectives, procedures and
apparatus used from commencing the lesson to finishing it, towards achieving the
aims including the class organization and supervision, the learning ambiance plus
students' response.
Time Delay Method: entails the teacher presenting the student with flash cards to
represent equations involving multiplication.

18
Count-By Method: involves counting to arrive at the answer, and it entails the student
saying or counting a “times table” loudly and clearly in order to get the answer to the
specific multiplication problem.
Integrated learning strategy: refers to the model of implementation that parents /
teachers were trained to use for the purpose of this experiment. It was actually a blend
of other strategies generated from different learning methodologies towards achieving
most of the basic components for an effective learning.
19
CHAPTER 3: METHOD (PROCEDURES FOR INVESTIGATING QUESTIONS)
Introduction to Chapter
This chapter discusses the motivation behind this study, preliminary steps taken to
secure approval from the subjects’ school authority, the ground work done in order to
facilitate the study, highlights of the study approach and techniques adopted (plus
sources of primary data as well as sample size, the method data collection, and
techniques used to analyze the data.
Participants and Setting
The experimental subjects involved 10 fourth grade-aged students with diverse
socioeconomic backgrounds grouped into two – they were selected from a public
school in Southgate, MI where learning of tables is a part of the usual school program.
The selected students for the experimental group had not mastered their required
grade knowledge as well as multiplication facts automaticity.
Materials and Data Collection Instruments
Pertinent data were collected from the subjects, their teachers, school authority and
parents / guardians – through oral and semi-structured interviews. The method
adopted was more of an inducting theory utilizing details akin to case studies rather
than sticking to hypothesis testing alone. In this approach, theoretical models were
applied all through the empirical study in a grounded approach instead of utilizing
hypothesis testing. Therefore, in this approach a large number of cases towards
achieving validity is not required, but rather the more profound study of a relatively
small number of subjects to examine adequately what is happening (Remenyi et al.,
1998; Burgoyne & Reynolds, 1998).
20
Integrated Strategy Group
Students in the respective intervention groups were taught multiplication facts
strategies as reviewed in the literature on multiplication facts cited above. It has been
noted that many of these strategies have been included in “Fact Fluency and More!”
(Woodward and Stroh, 2004a) and “Transitional Mathematics, Level 1” (Woodward
and Stroh, 2004b) curricular facilitating materials, which were applied as the basis for
the daily instruction. Facts were divided into relatively less challenging ones and
those that have in general been regarded as more challenging. A variety of descriptive
and empirical literature was applied to support this distinction. Therefore, fact like 0s
and 1s, doubles, and times 5s that are rule-based have appeared to be less challenging
for students to learn at an automaticity level (Wood & Frank, 2000; Van de Walle,
2003; Sherin & Fuson, 2005).
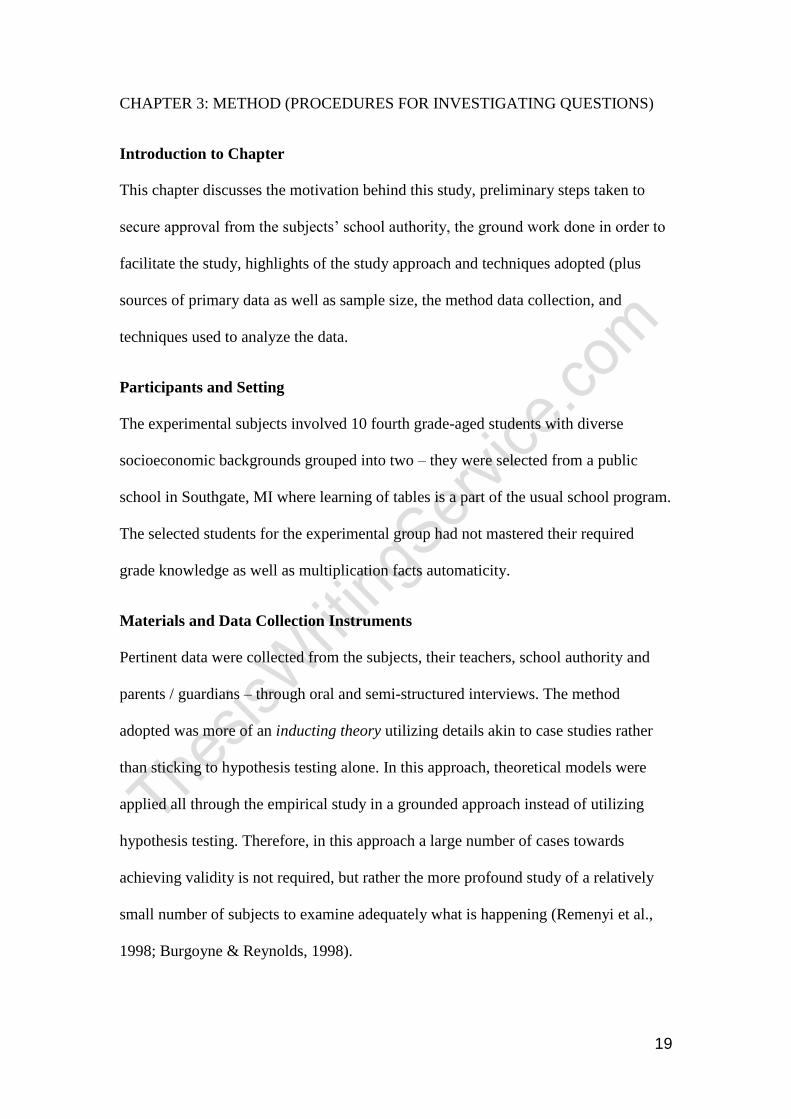
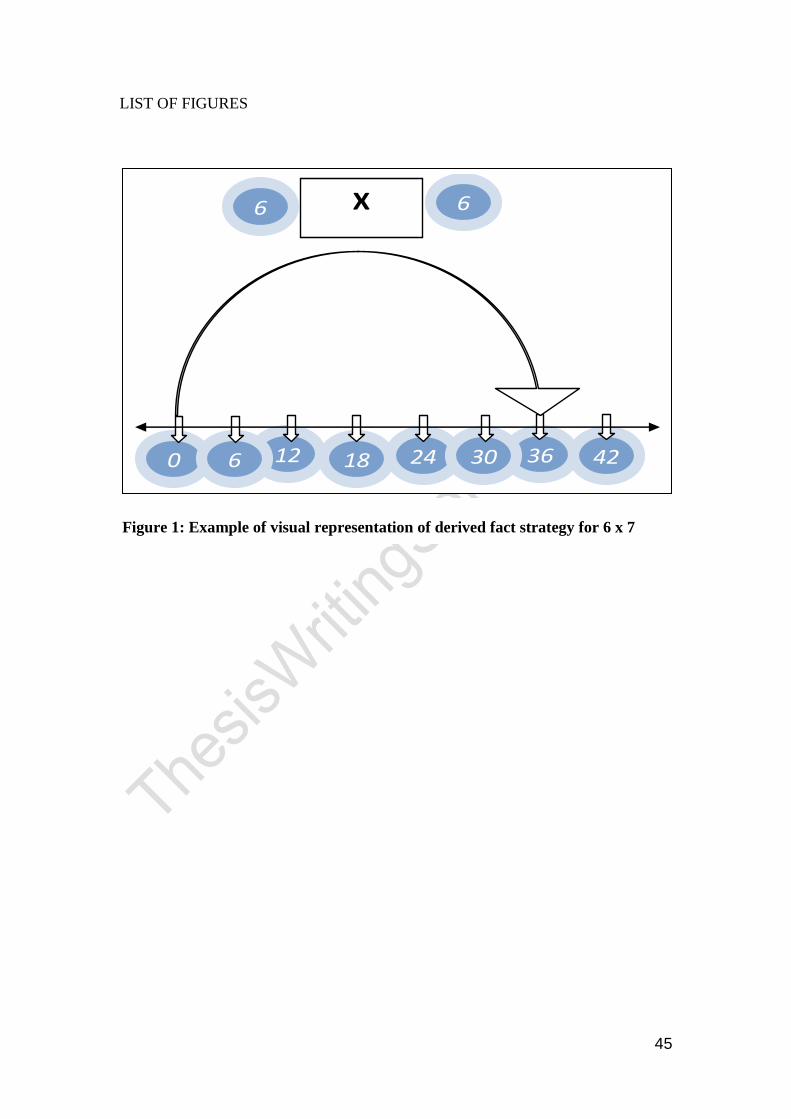
As recommended by literature, more difficult facts are to be taught via derived fact or
doubling and doubling-again strategies – e. g., multiplication facts like 6 x 7 and 7 x 8
that were contained in the study materials were taught via a derived strategy which is
as follows: (6 x 7 = 6 x 6 + 6, 7 x 8 = 7 x 7 + 7)
The visual illustration of the derived fact strategy above may be found in Figure 1
below.
Facts such as 6 x 4 were taught to the students via a doubling and doubling-again
strategy (for example, 6 x 4 is presented as 6 x 2 = 12; then 12 x 2 = 24). Number
lines and a variety of blocks projected overhead – to enhance the students’ visual
appreciation of multiplication facts strategies – were the materials used with the
Integrated group.
21
The daily timed practice worksheets were organized using a controlled practice
scheme identical to one adopted by Hasselbring et al. (2005). New facts were
administered in small portions; that is, an average of 7 facts and no more than 10 facts
per strategy. The timed practice worksheets were weaved round a specific strategy
with each daily timed practice worksheet having 40 facts of which half of the facts
were review facts and the remaining half were randomly presented new facts. The
review facts was meant to serve as distributed practice.
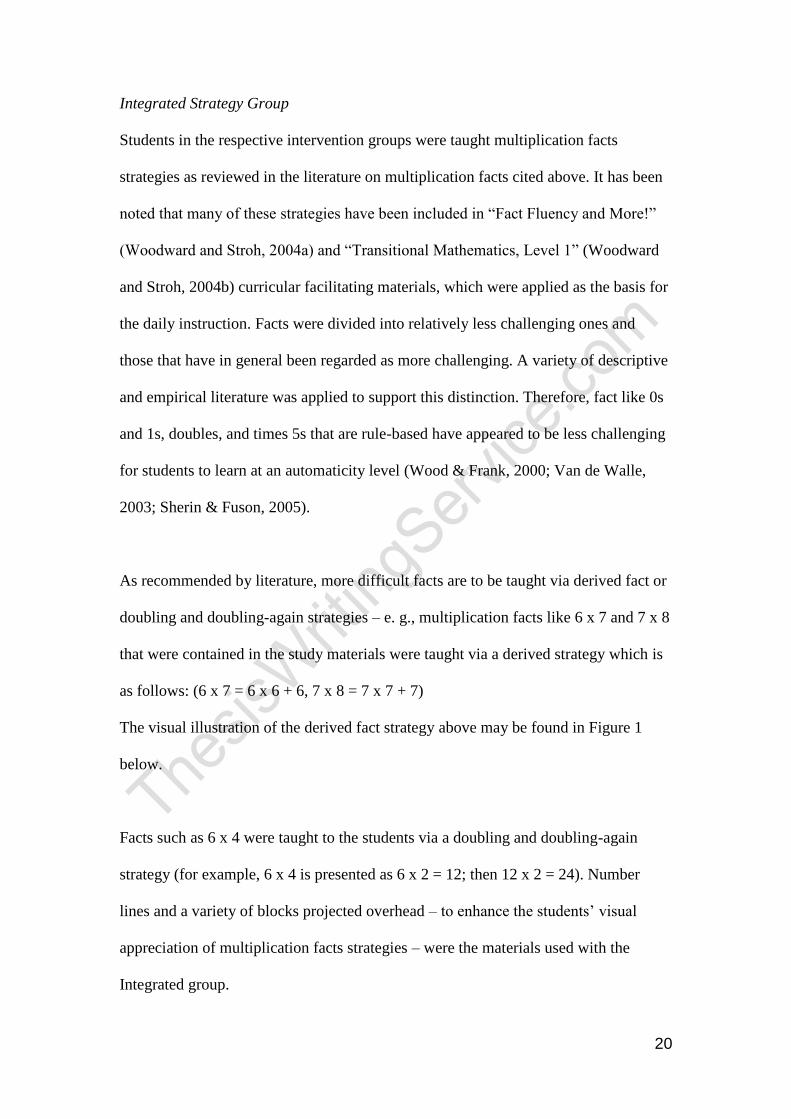
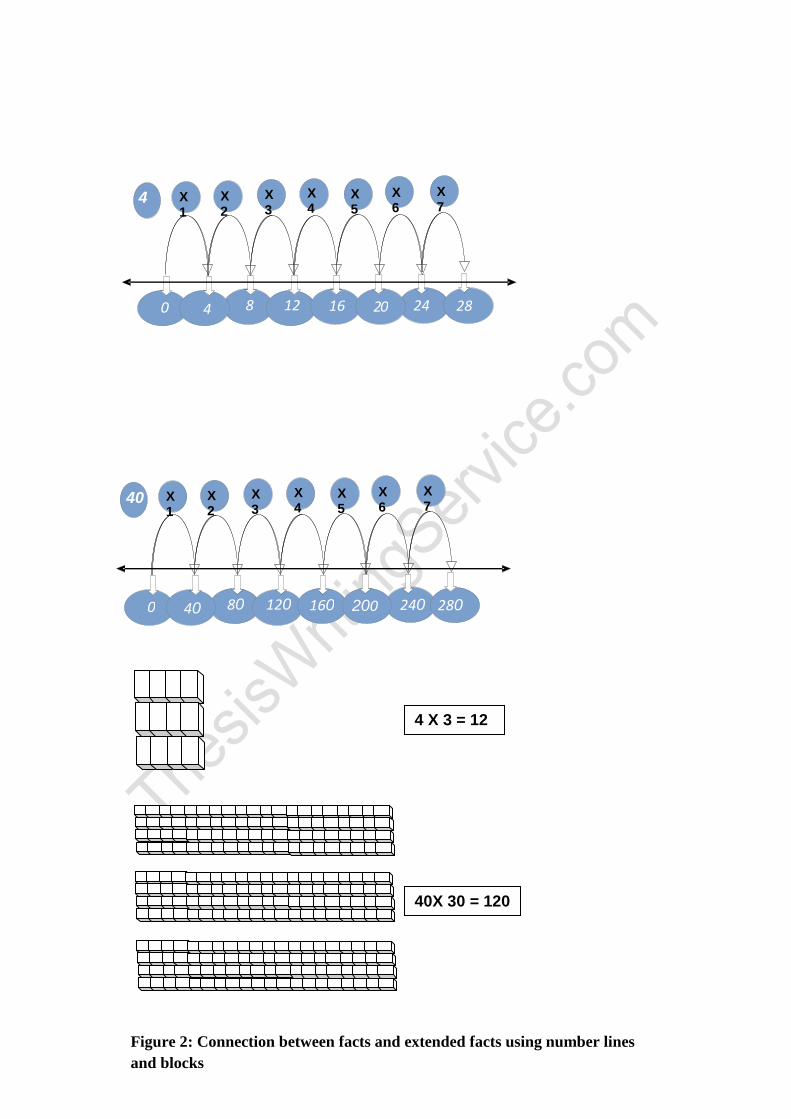
Finally, the connection between the single-digit facts shown above and extended facts
such as extending 4 x 2 to 40 x 2 and 400 x 2 were taught to the student with the aid
of other materials. Instructional materials featured worksheets where students handled
20 randomly ordered single-digit facts as well as extended facts. This however was an
untimed activity, meant to assist students towards generalizing their knowledge of
facts. An array of block overhead transparencies and number lines like the one shown
in Figure 2 below were applied when the parents and students discussed extended
multiplication facts.
Timed practice only group
The methods adopted for students in this group were practically based almost entirely
on the controlled practice technique found in the literature, especially the adoption of
direct instruction for teaching multiplication / math facts and the traditional
multiplication algorithm (Stein et al., 1997). This approach included many of the
instructional principles explained in the Hasselbring et al. (2005) research.
Sequentially (that is, starting with the 1s, then the 2s), new facts were taught while
22
previously taught facts were reviewed on each day and same were incorporated into
the daily CTD.
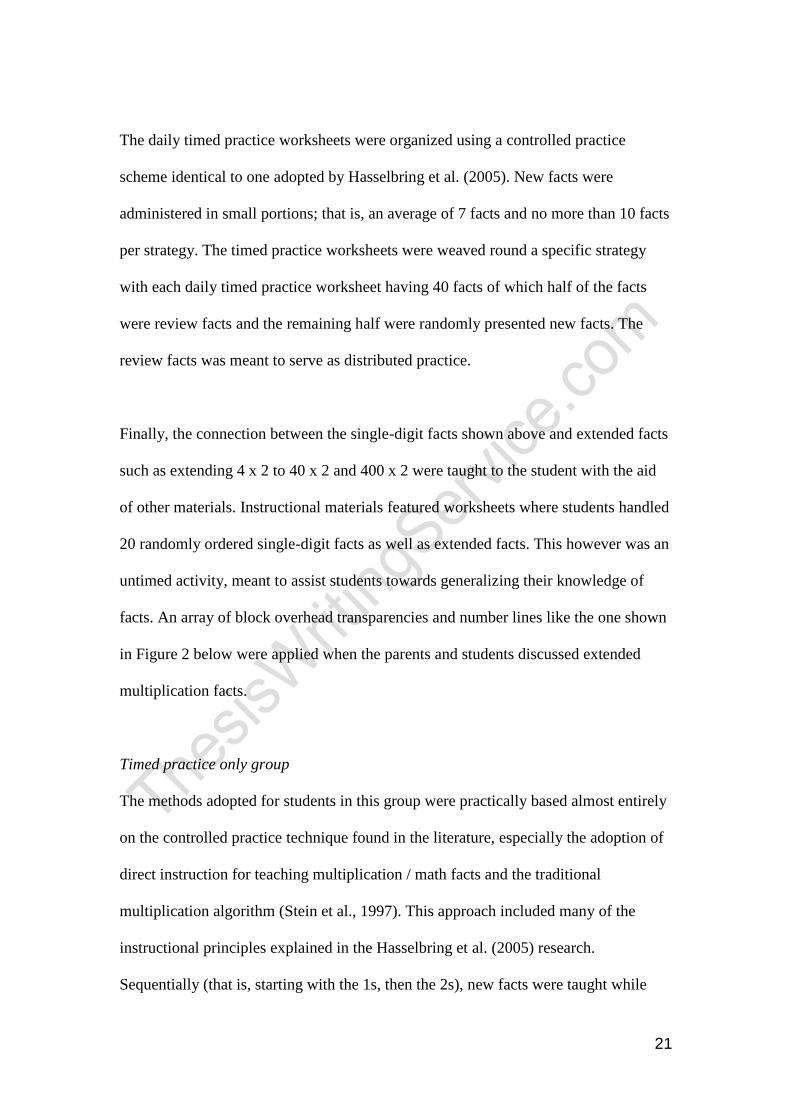
The direct instruction strategy adopted for multi-digit multiplication worksheets
emphasized an unambiguous presentation of the traditional algorithm. At the
beginning of study, problems were 2 x 1 digit problems – progressed gradually up
through 2 x 2 and 3 x 1 digit problems. The design of the material was such that it
provided a systematic review of prior problem types as students ascended
hierarchically from easier to more challenging problems.
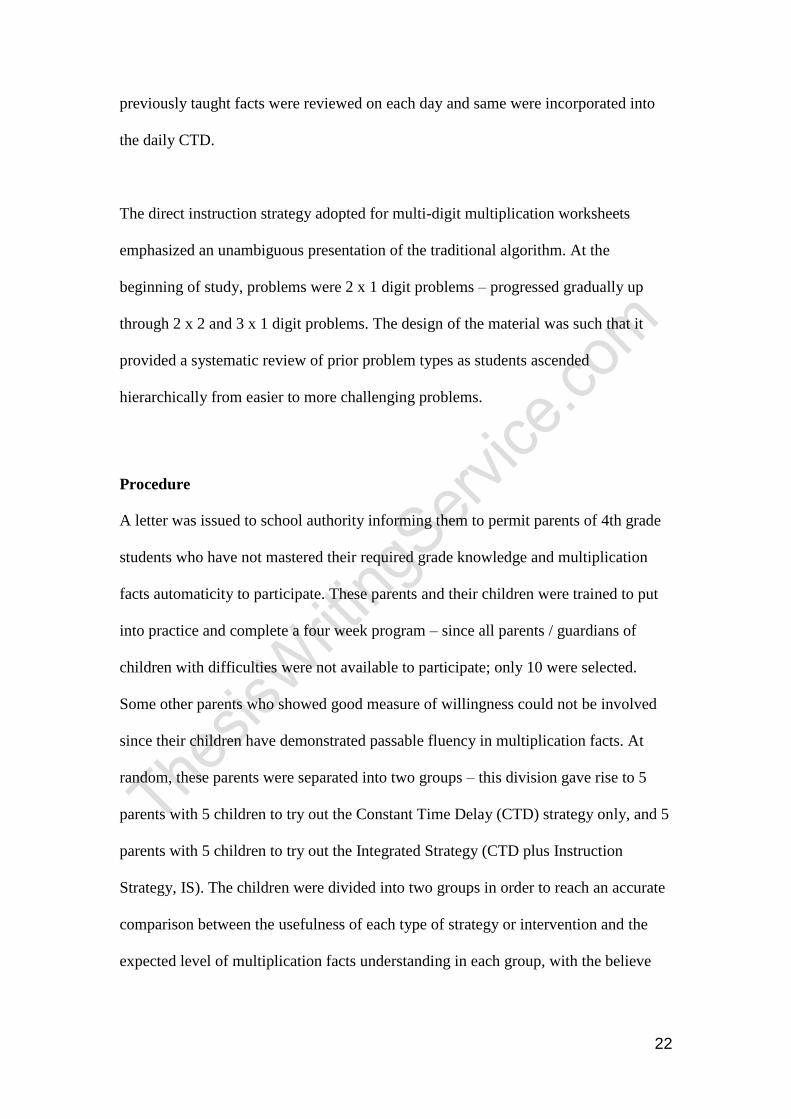
Procedure
A letter was issued to school authority informing them to permit parents of 4th grade
students who have not mastered their required grade knowledge and multiplication
facts automaticity to participate. These parents and their children were trained to put
into practice and complete a four week program – since all parents / guardians of
children with difficulties were not available to participate; only 10 were selected.
Some other parents who showed good measure of willingness could not be involved
since their children have demonstrated passable fluency in multiplication facts. At
random, these parents were separated into two groups – this division gave rise to 5
parents with 5 children to try out the Constant Time Delay (CTD) strategy only, and 5
parents with 5 children to try out the Integrated Strategy (CTD plus Instruction
Strategy, IS). The children were divided into two groups in order to reach an accurate
comparison between the usefulness of each type of strategy or intervention and the
expected level of multiplication facts understanding in each group, with the believe
23
that grade 4 students generally have limited knowledge since they have all had less
exposure to multiplication facts.
The subject students’ multiplication facts individual fluency level was tested prior to
administration of intervention strategies – that is, a pre-test was applied to quantify
their multiplication facts fluency. Parents were then encouraged and guided as to
following up the intervention with their respective children at home. After
undertaking the intervention programs, CTD and CTD + IS, another test (post-test)
was administered to examine and determine which strategy works better. Subjects
were distributed according to method of assistance; see Table 1.
Students were coordinated and assigned at random based on results of pretest
measures – i.e., the Common Multiplication Facts Test. Scores were position ordered,
and students’ names were placed at the top of each list and randomly attached to each
condition. At the commencement of each instructional session, the students took the
materials to their respective parents (i.e., whether Integrated or CTD). Parents in both
groups were instructed to take their take their children for 25 minutes each day, five
days in a week, and for four consecutive weeks. Every necessary effort was made by
researcher to control the amount of instructional time for each group in order to
maintain a fair balance between the groups each day. The teachers who participated in
the study were guided such that they developed extensive knowledge with both the
adopted materials in each condition and the instructional methods. The researcher met
with the parents prior to the study and reviewed important teaching elements for their
respective method (that is, the integrated and the CTD only). To guarantee
dependability of implementation every week researcher met with students’ parents

24
using a checklist that contained the major instructional techniques for each
intervention. The observational notes and checklists were used as the basis for
discussions with respective parents. This weekly discussion with parents helped in
ensuring that each method was consistently and appropriately implemented. Finally,
to control for parents effects, researcher organized two sessions with the students
midway through the study.
Integrated group
The daily instruction for the integrated group was administered in three distinct
phases –the first being either a review of the previously taught strategies or an
introduction of new fact strategies. Parents devoted more time to this phase of the
session on the days when their children were shown a new strategy (such as seen in
the derived fact strategy for 6 x 7 in Figure 1 above where arrays or number lines on
the overhead were used to visualize the strategy. Students were then cheered to
discuss the strategy and compare it with earlier taught strategies. For example, 5 x 8
could be considered a “times 5” strategy, but it was a part of the “times 9 strategy”,
too.
On other days, parents used the overhead to talk about facts that represented the
hitherto taught strategies. Number lines or arrays were used in visualizing the strategy
since it was not requisite for students to memorize the strategies and apply them in a
rote mode on any of the worksheets employed during the intervention.
Phase two of daily instruction was a two-minute CTD – materials used have been
described above. At the end of each two minutes, parent dictated answers to
25
multiplication facts, and student corrected his or her own work, circling any incorrect
facts and writing correct answers after the parent finished dictating the answers.
Researcher collected the daily worksheets to monitor the advancement of the students
in each group as they drew nearer automaticity in a particular strategy. When a
student got 90% correct on a particular strategy, parent moved a step further to next
strategy in the instruction. Basically, automaticity was regarded as 36 correct
problems within the time period of two minutes. The final stage of daily instruction
varied. Once in a while, the relationship between facts and extended facts was taught
to students. Parents used number lines and arrays as visual models to foster this
connection (review Figure 2).
Timed practice only group.
The first phase here involved either a systematic review of already taught facts or the
introduction of new multiplication facts. In each lesson, parents used a prepared set of
facts. Upon being taught new facts, their parents introduced the fact including its
answer, after which the students were asked the answer to the fact (for example, “7 x
3 is 21. What is 7 x 3?”). And in the case of the previously taught facts, the students
were simply asked the answers to fact questions (for example, “What is 7 x 4?”). Oral
responses were demanded in both instances. Stein et al (1997) considered these
formats as key features of direct instruction.
In the second phase of instruction, a two-minute CTD was involved; materials for this
have been described above. In the last part of the drill, parents dictated correct
answers to the facts and students righted their own work by circling the incorrect facts
and writing in correct responses. While shifting to instruction on new facts, parents

26
adopted the same procedures as those in the integrated situation. When students got
90% correct on a strategy, parent moved to the next set of facts.
In the third phase of instruction, worksheet practice on computational problems
utilizing the conventional multiplication algorithm was involved. Parents modeled
how to craft new types of problems as they advanced from 3 x 1 to 2 x 2 digit
problems over the course of the study. Students were also reminded by their parents to
use their knowledge of facts as they solved problem sets. Problems involving
computation were limited to those involving facts that had been taught to the students
up to this end in the study. As a result, students did not really work any computational
problems that contained any facts that they had not been taught as a part of the study.
The moment students had completed each stage of problems, the parents dictated
answers and any errors were corrected by the students themselves.
To evaluate students’ understanding of multiplication facts as well as related skills, a
range of measures were developed. The standardized measure of computational skills
adopted was Iowa Test of Basic Skills, ITBS. And an independent group of five
fourth grade students was used to calculate the reliability of test-retest for each
measure for all other computational measures. Test-retest reliability above .90 was
achieved in all of the measures. Students’ general disposition towards the subject of
mathematics was also assessed. On the Math Computations subtest of the Iowa Test
of Basic Skills (Hoover et al, 1996) for the 10 participants, mean grade equivalence
was 3.6 (the 41st percentile), which indicated that on the average, subject students
were obviously half to one year behind fourth grade level as at the time the study was
conducted. Table 1 gives further demographic information on the participants.
27
CHAPTER 4: RESULTS (OUTCOMES)
Introduction to Chapter
Facts, computational abilities in multiplication, and attitudes in the direction of
mathematics are the basis of grouping for analyses of the data in this study. Math
Computations subtest score of the ITBS was employed as the covariate in all analyses
of covariance (ANCOVA). To quantify effect size for all statistically significant
between-group relationships, Cohen’s d was used. The sample size of students did not
naturally call for the use of inferential statistics; however, comparative data to shed
light on the efficacy of each of the respective instructional methods for all students
were obtained.
Measures of Facts
Familiar Facts
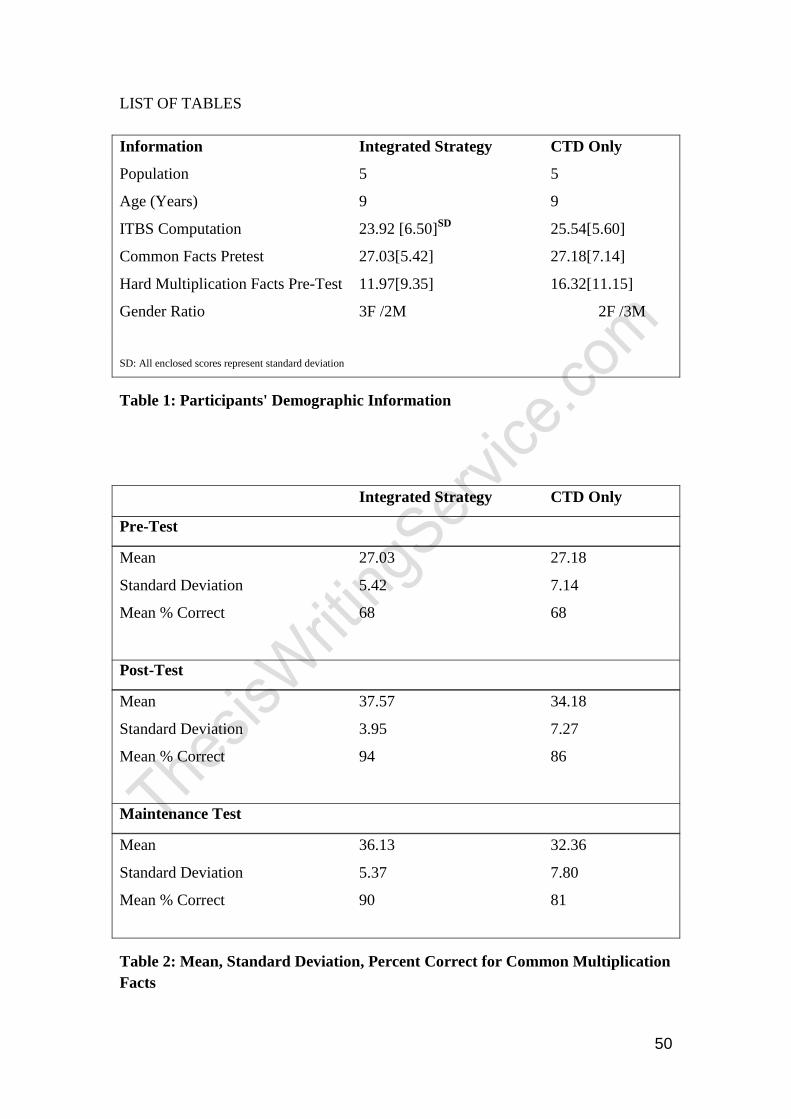
A time by group i.e., 3 x 2 ANCOVA was carried out on the Common Multiplication
Facts Test. Table 2 gives the statistical description for students by group and time.
Wilks’ lambda criterion was used to analyze data, results of which suggested a
considerable variation between condition groups [F (1, 55) = 6.38, p = .01, d = .68].
There was a noteworthy relation for time and group [F (2, 54) = 3.89, p = .02].
The array of t-tests carried out on the pretest, post-test, and maintenance tests showed
no considerable differences between groups on the pre-test [t (56) = -.09], however
there were sizeable differences between groups on the post-test [t (56) = 2.22, p = .02, d
= .27]. Similarly, significant differences were seen on the maintenance test [t (56) =
2.20, p = .02, d = .27].
28
For both groups, mean percent correct on post-test and maintenance tests was
comparatively high, especially when compared with the pre-test scores. The data
imply that the Integrated group continued at a mastery level from post-test to
maintenance test – at or exceeding 90%, but this was not the case for the CTD Only
group. See Figure 3 for graphical representation. Performance however declined for
both subgroups from the post-test to the maintenance test.
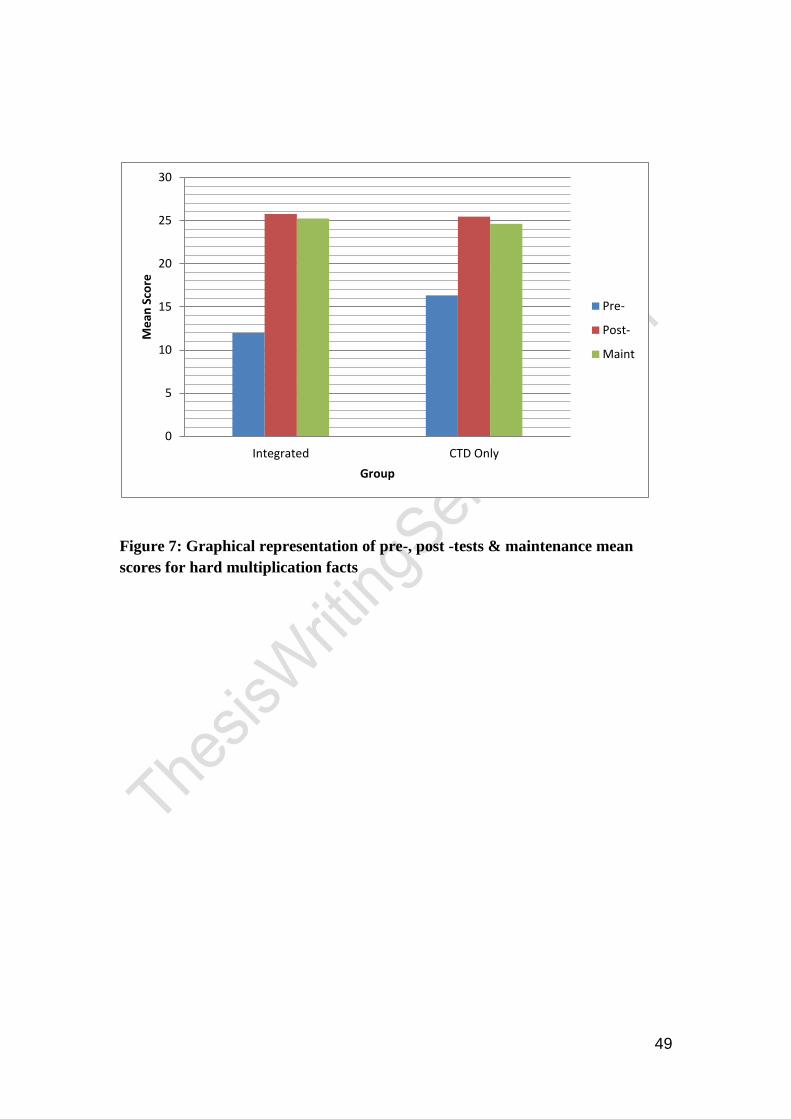
Hard facts
A time by group (3 x 2 ANCOVA) was carried out on the Hard Multiplication Facts
Test. Table 3 presents the descriptive statistics for students by group and time. Wilks’
lambda criterion was also employed to analyze data on these repeated measures.
Results however did not show significant differences between groups [F (1, 55) = .13, p
= .72] and close to significant differences within groups [F (1, 55) = 3.83, p = .06]. For
time and group [F (2, 54) = 4.61, p = .01], interaction was significant, with the source
occurring between pre-test and post-test. Significant differences within groups (F (1, 55)
= 4.52, p < .05) were revealed by a 2 x 2 ANCOVA carried out on this phase of the
repeated measures. Mean score changes help explain the significant interaction. For
Integrated group, mean pre-test score was 11.97 (30% correct) – compared to 16.32
(41% correct) for CTD Only group. Post-test mean scores for both groups rose to
virtually the same levels – at 25.76 and 25.46 (64% correct), respectively. A
significant level (F (1, 55) = 3.55, p = .07) was indicated by the differences between
groups for this phase of the study.
Table 3 and Figure 7 show the comparison of students on the Hard Facts Test. A
considerable gain from pre-test to post-test was reflected for students in both groups.
29
Though, no group of students attained mastery of these facts by the conclusion of the
four-week intervention. Interestingly, decline from post-test to maintenance test on
these facts was comparable, and marginal, across groups (that is, approximately 2%
correct on the average).
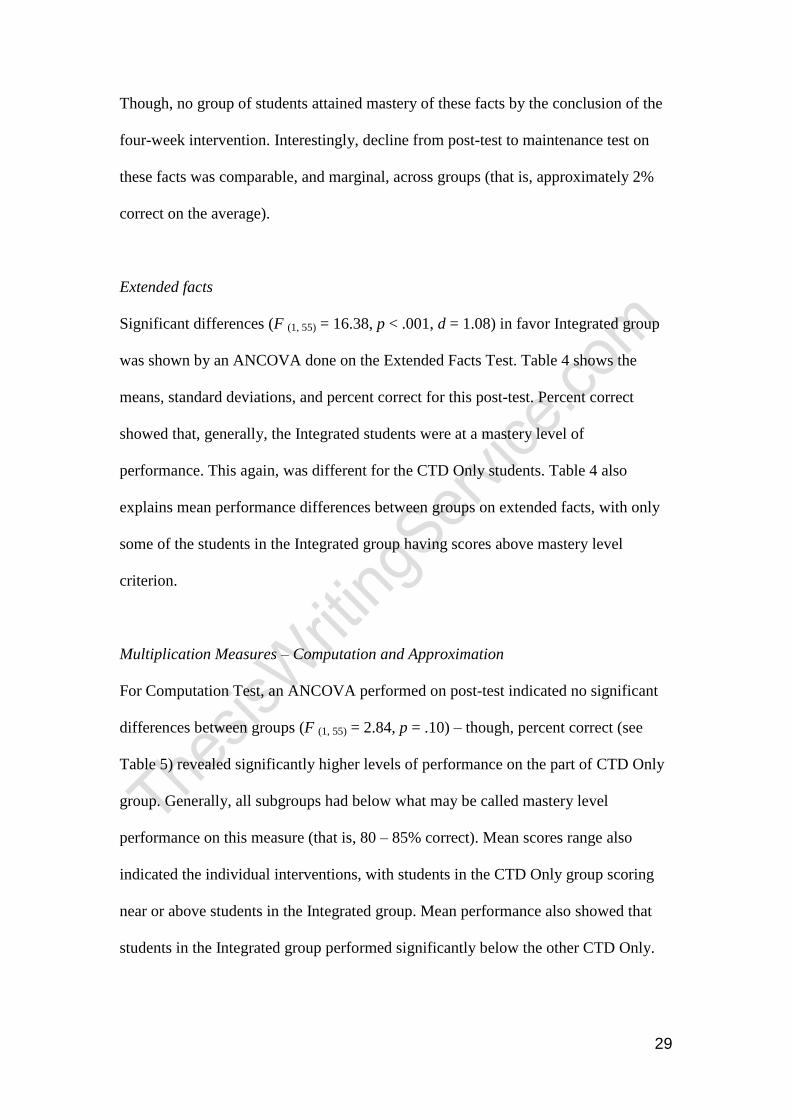
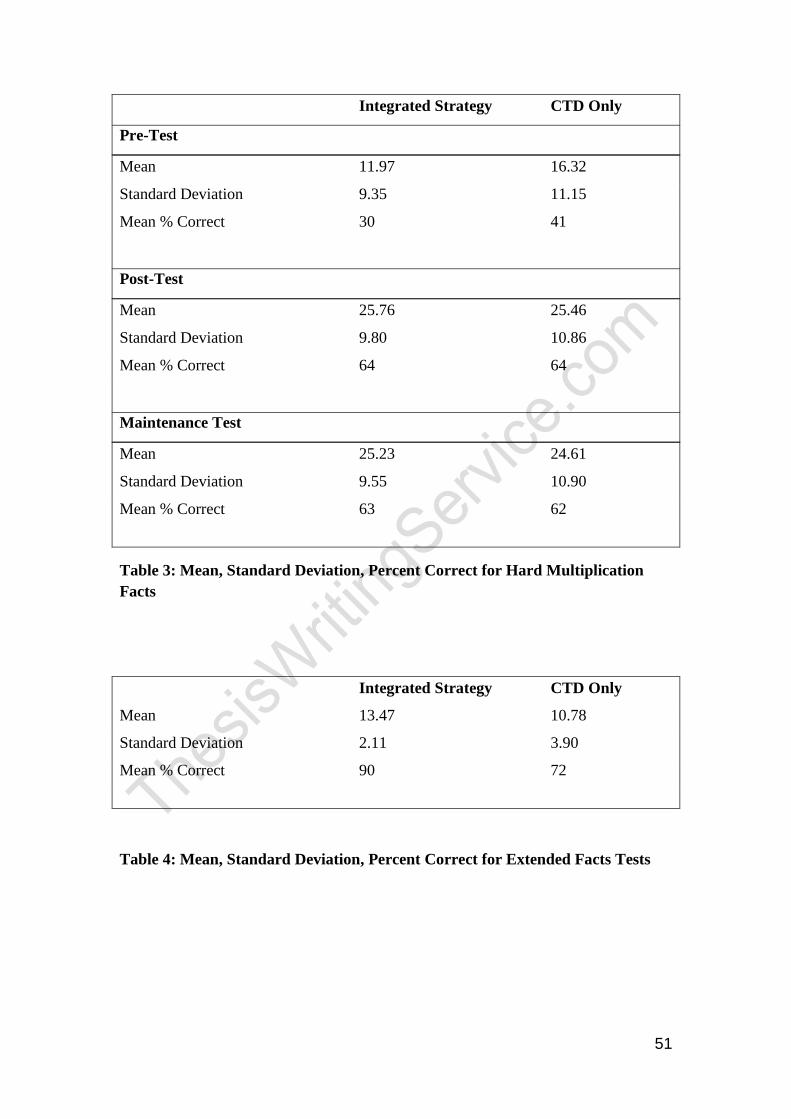
Extended facts
Significant differences (F (1, 55) = 16.38, p < .001, d = 1.08) in favor Integrated group
was shown by an ANCOVA done on the Extended Facts Test. Table 4 shows the
means, standard deviations, and percent correct for this post-test. Percent correct
showed that, generally, the Integrated students were at a mastery level of
performance. This again, was different for the CTD Only students. Table 4 also
explains mean performance differences between groups on extended facts, with only
some of the students in the Integrated group having scores above mastery level
criterion.
Multiplication Measures – Computation and Approximation
For Computation Test, an ANCOVA performed on post-test indicated no significant
differences between groups (F (1, 55) = 2.84, p = .10) – though, percent correct (see
Table 5) revealed significantly higher levels of performance on the part of CTD Only
group. Generally, all subgroups had below what may be called mastery level
performance on this measure (that is, 80 – 85% correct). Mean scores range also
indicated the individual interventions, with students in the CTD Only group scoring
near or above students in the Integrated group. Mean performance also showed that
students in the Integrated group performed significantly below the other CTD Only.
30
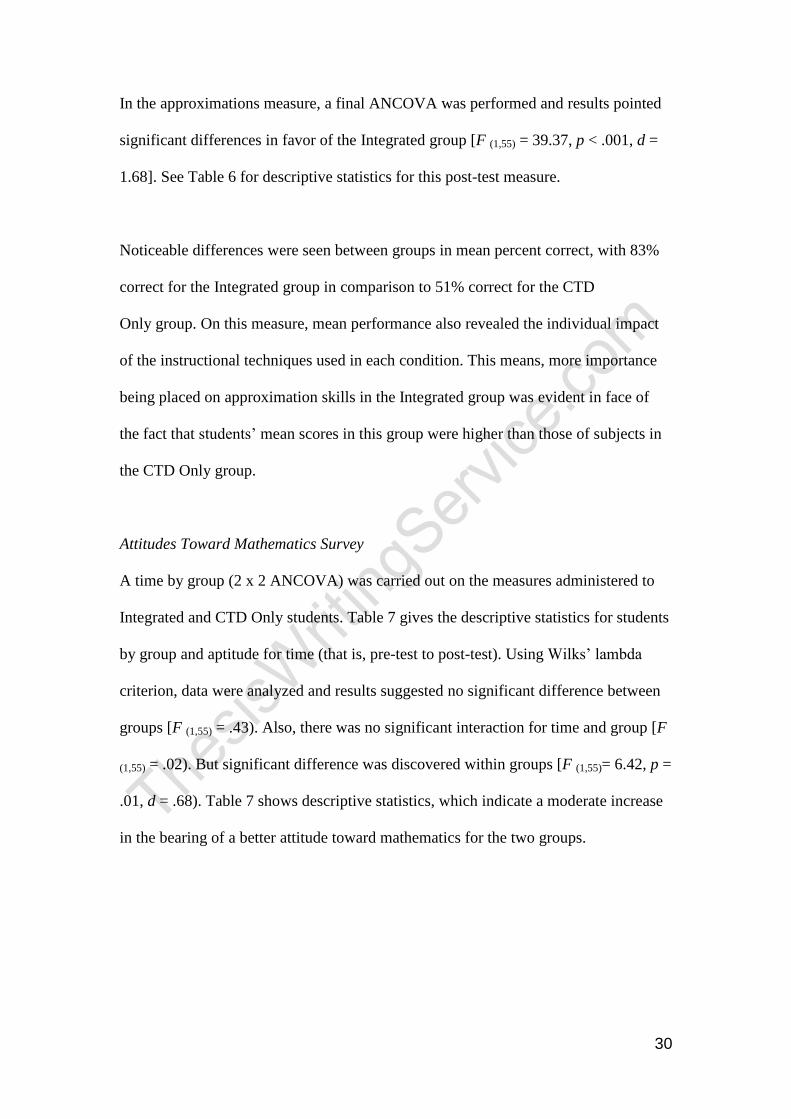
In the approximations measure, a final ANCOVA was performed and results pointed
significant differences in favor of the Integrated group [F (1,55) = 39.37, p < .001, d =
1.68]. See Table 6 for descriptive statistics for this post-test measure.
Noticeable differences were seen between groups in mean percent correct, with 83%
correct for the Integrated group in comparison to 51% correct for the CTD
Only group. On this measure, mean performance also revealed the individual impact
of the instructional techniques used in each condition. This means, more importance
being placed on approximation skills in the Integrated group was evident in face of
the fact that students’ mean scores in this group were higher than those of subjects in
the CTD Only group.
Attitudes Toward Mathematics Survey
A time by group (2 x 2 ANCOVA) was carried out on the measures administered to
Integrated and CTD Only students. Table 7 gives the descriptive statistics for students
by group and aptitude for time (that is, pre-test to post-test). Using Wilks’ lambda
criterion, data were analyzed and results suggested no significant difference between
groups [F (1,55) = .43). Also, there was no significant interaction for time and group [F
(1,55) = .02). But significant difference was discovered within groups [F (1,55)= 6.42, p =
.01, d = .68). Table 7 shows descriptive statistics, which indicate a moderate increase
in the bearing of a better attitude toward mathematics for the two groups.
31
CHAPTER 5: DISCUSSION
Discussion
Two approaches to teaching multiplication facts to academically low-achieving
students at fourth grade level were juxtaposed in this study. Literally both methods
proved effective in improving the mean performance level based on a blend of
common math facts to mastery or near mastery levels; only slight decreases were seen
in these levels during the maintenance phase of the study. According to Cohen’s d
analyses in which small effect sizes were indicated, the Integrated group generally on
the expansion of automaticity in these math facts was favored. The two groups
improved noticeably in their knowledge / understanding of the harder multiplication
facts. But the limited time frame for the intervention period of four weeks prevented
student in neither group from attaining mastery levels of performance. With mean
success levels approximating 63%, post-test and maintenance test scores for both
groups were virtually identical.
Generally, students improve in performance levels across groups but for some
differences – with the most visible differences between groups appearing a propos the
instructional activities that accompanied the daily facts instruction. Students in
Integrated group got the opportunity to visually observe and discuss the factors
connecting facts (basic and extended) and methods for approximating answers to
multiplication problems. Consequently, their performance on the Approximation
Tests and Extended Facts seemed appreciably higher than that of students in the CTD
Only group.
32
Conversely, students in the CTD Only group were allowed many more practicing
opportunities to learn 3 x 1 and 2 x 2 multiplication problems via the traditional
algorithm. And of course, this extra practice engendered higher performance levels,
albeit the differences between groups on the Computations post-test were not
statistically significant.
On a final note, students in both groups appeared to be positive in terms of feelings
about the subject of mathematics and the intervention in particular. This accounts for
slight rise observed in mean scores on the Attitudes Toward Math Survey over the
period of intervention.
Limitations of Study
No research is faultless, and many times, some limitations are outside the control of
the purposes of research. So as to have a reasonable outcome, a researcher’s choice of
a particular case study methodology must be kept germane to the mean between what
is practically obtainable and what is theoretically understood —researcher must
maintain equilibrium between theoretical aspiration and realistic limitations.
Consequently, there is no best, specific methodology that has been scientifically
designed for conducting such a case study—rather, the chosen technique must be
suited to the circumstantial variables that are prevalent in the environment in which
the research is being conducted (David, 2001).
However, in this case study, a pre-test method and a post-test method were used to
source required information in order to shift away from a widely recognized fact that
an observation is influenced by an observer’s background and past experiences,
including previous technical training, cultural background as well as system of beliefs.
33
According to Stuart et al, the concern expressed above could lead to a biased sample,
which usually affects the manner of interpretations of observations—this
consequentially affects parameter estimation (2002).
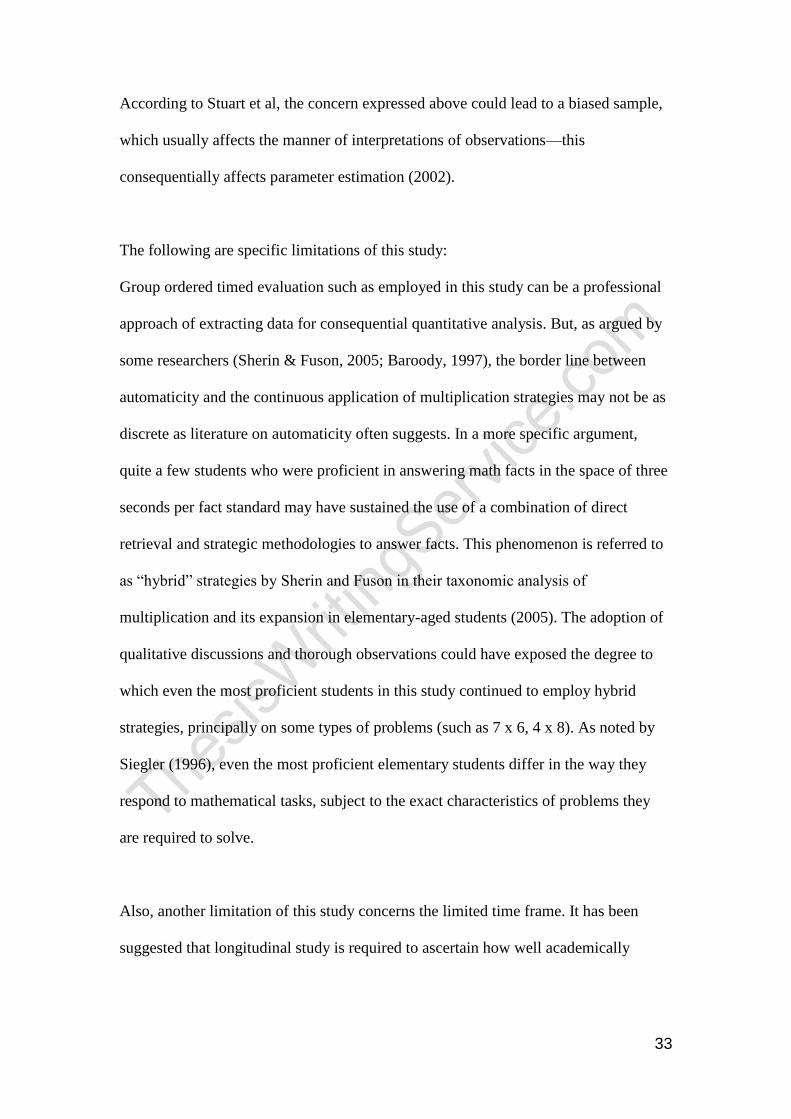
The following are specific limitations of this study:
Group ordered timed evaluation such as employed in this study can be a professional
approach of extracting data for consequential quantitative analysis. But, as argued by
some researchers (Sherin & Fuson, 2005; Baroody, 1997), the border line between
automaticity and the continuous application of multiplication strategies may not be as
discrete as literature on automaticity often suggests. In a more specific argument,
quite a few students who were proficient in answering math facts in the space of three
seconds per fact standard may have sustained the use of a combination of direct
retrieval and strategic methodologies to answer facts. This phenomenon is referred to
as “hybrid” strategies by Sherin and Fuson in their taxonomic analysis of
multiplication and its expansion in elementary-aged students (2005). The adoption of
qualitative discussions and thorough observations could have exposed the degree to
which even the most proficient students in this study continued to employ hybrid
strategies, principally on some types of problems (such as 7 x 6, 4 x 8). As noted by
Siegler (1996), even the most proficient elementary students differ in the way they
respond to mathematical tasks, subject to the exact characteristics of problems they
are required to solve.
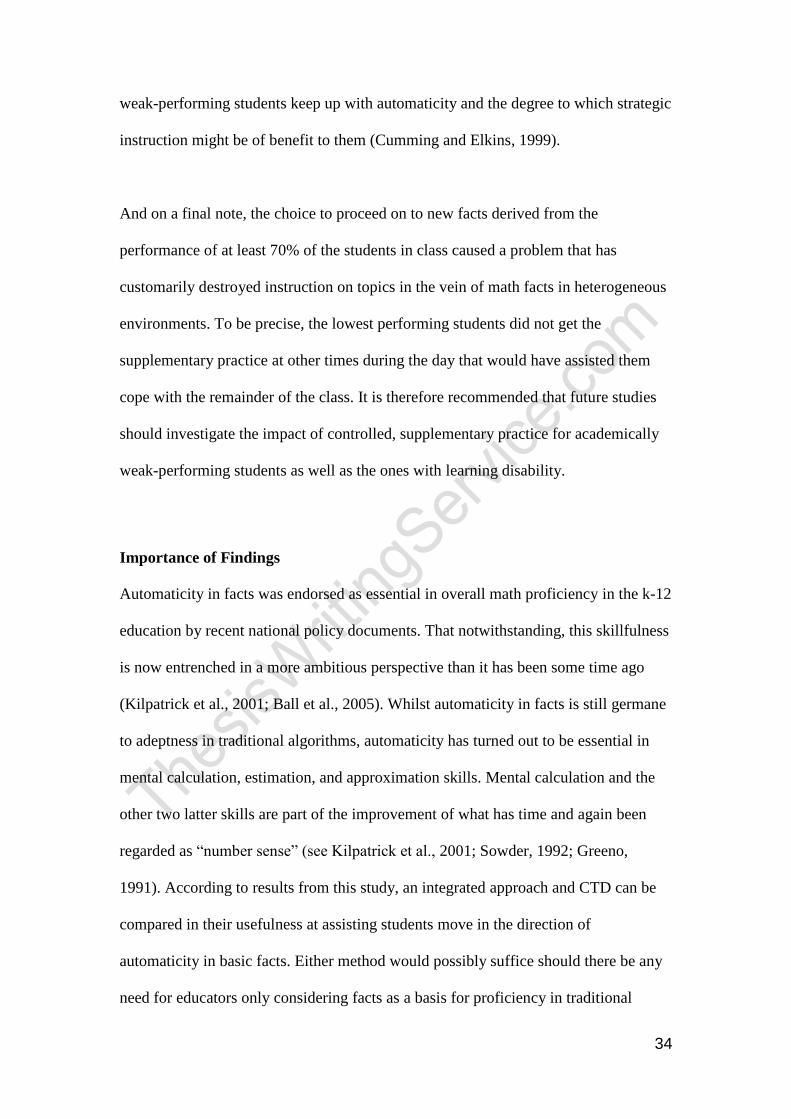
Also, another limitation of this study concerns the limited time frame. It has been
suggested that longitudinal study is required to ascertain how well academically
34
weak-performing students keep up with automaticity and the degree to which strategic
instruction might be of benefit to them (Cumming and Elkins, 1999).
And on a final note, the choice to proceed on to new facts derived from the
performance of at least 70% of the students in class caused a problem that has
customarily destroyed instruction on topics in the vein of math facts in heterogeneous
environments. To be precise, the lowest performing students did not get the
supplementary practice at other times during the day that would have assisted them
cope with the remainder of the class. It is therefore recommended that future studies
should investigate the impact of controlled, supplementary practice for academically
weak-performing students as well as the ones with learning disability.
Importance of Findings
Automaticity in facts was endorsed as essential in overall math proficiency in the k-12
education by recent national policy documents. That notwithstanding, this skillfulness
is now entrenched in a more ambitious perspective than it has been some time ago
(Kilpatrick et al., 2001; Ball et al., 2005). Whilst automaticity in facts is still germane
to adeptness in traditional algorithms, automaticity has turned out to be essential in
mental calculation, estimation, and approximation skills. Mental calculation and the
other two latter skills are part of the improvement of what has time and again been
regarded as “number sense” (see Kilpatrick et al., 2001; Sowder, 1992; Greeno,
1991). According to results from this study, an integrated approach and CTD can be
compared in their usefulness at assisting students move in the direction of
automaticity in basic facts. Either method would possibly suffice should there be any
need for educators only considering facts as a basis for proficiency in traditional
35
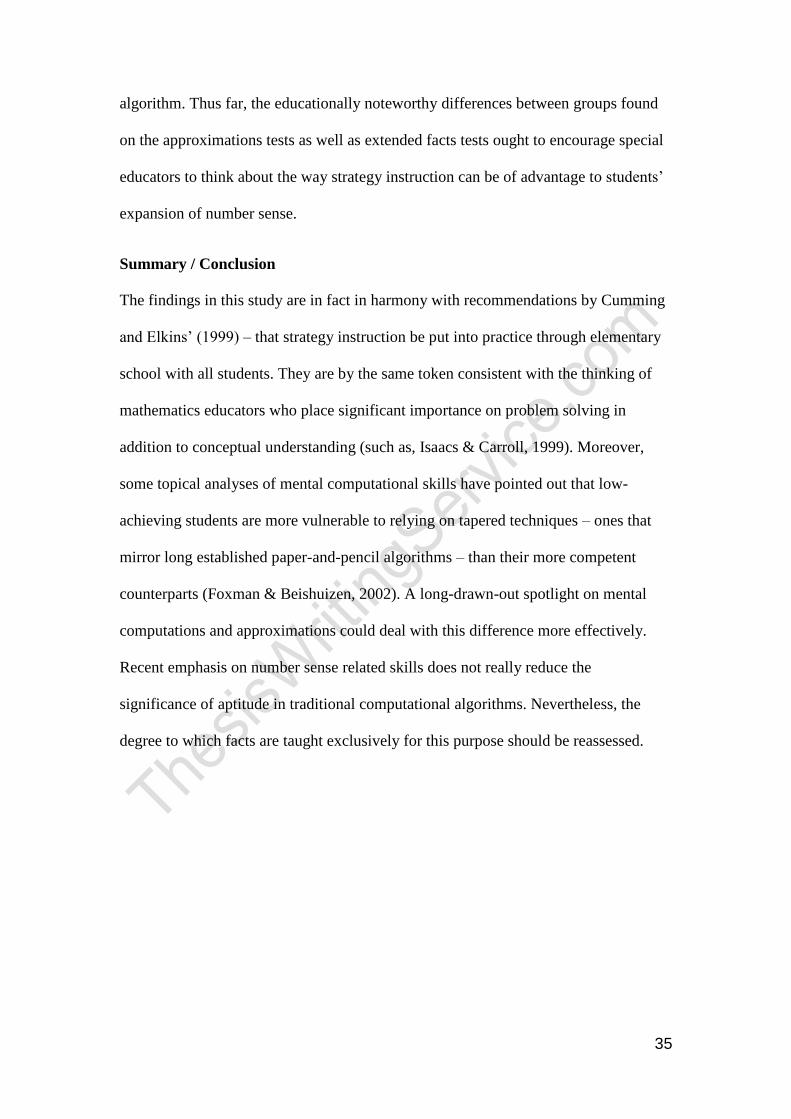
algorithm. Thus far, the educationally noteworthy differences between groups found
on the approximations tests as well as extended facts tests ought to encourage special
educators to think about the way strategy instruction can be of advantage to students’
expansion of number sense.
Summary / Conclusion
The findings in this study are in fact in harmony with recommendations by Cumming
and Elkins’ (1999) – that strategy instruction be put into practice through elementary
school with all students. They are by the same token consistent with the thinking of
mathematics educators who place significant importance on problem solving in
addition to conceptual understanding (such as, Isaacs & Carroll, 1999). Moreover,
some topical analyses of mental computational skills have pointed out that low-
achieving students are more vulnerable to relying on tapered techniques – ones that
mirror long established paper-and-pencil algorithms – than their more competent
counterparts (Foxman & Beishuizen, 2002). A long-drawn-out spotlight on mental
computations and approximations could deal with this difference more effectively.
Recent emphasis on number sense related skills does not really reduce the
significance of aptitude in traditional computational algorithms. Nevertheless, the
degree to which facts are taught exclusively for this purpose should be reassessed.
36
REFERENCES
Anderson, J. R., Reder, L. M., & Simon, H. A. (1996). Situated learning and
education. Educational Researcher, 25(4), 5-11.
Anghileri, J. (1989). An investigation of young children’s understanding of
multiplication. Educational Studies in Mathematics,20, 367-385.
Ashcraft, M., & Christy, K. (1995). The frequency of arithmetic facts in elementary
texts: Addition and multiplication in Grades 1-6. Journal for Research in
Mathematics Education, 26(5), 396-421.
Ball, D., Ferrini-Mundy, J., Kilpatrick, J., Milgram, J., Schmid, W., & Schaar, R.
(2005). Reaching for common ground in K-12 mathematics education. Notices
of the American Mathematical Society, 52(9), 1055-1058.
Ball, D., Ferrini-Mundy, J., Kilpatrick, J., Milgram, J., Schmid, W., & Schaar, R.
(2005). Reaching for common ground in K-12 mathematics education. Notices
of the American Mathematical Society, 52(9), 1055-1058.
Baroody, A. (1997, April). The development of third-graders’ mental multiplication.
Paper presented at the annual meeting of the American Educational Research
Association, Chicago.
Baroody, A. (1997, April). The development of third-graders’ mental multiplication.
Paper presented at the annual meeting of the American Educational Research
Association, Chicago.
Baroody, A., & Coslick, R. (1998). Fostering children’s mathematical power: An
investigative approach to K-8 mathematics instruction. Mahwah, NJ: LEA.
Baroody, A., & Ginsburg, H (1986). The relationship between initial meaning and
mechanical knowledge of arithmetic. In J.
37
Behr, M., Harel, G., Post, T. and Lesh, R. (1992). Rational Number, Ratio, and
Proportion. In D. Grouws (ed.) Handbook of Research on Mathematics
Teaching and Learning.
Bell, A., Greer, B., Mangan, C. & Grimison, L. (1989). Children’s Performance on
Multiplicative Word Problems: Elements of a Descriptive Theory. Journal for
Research in Mathematics Education, 20(5), 434–449.
Brownell, W., & Chazal, C. (1935). The effects of premature drill in third-grade
arithmetic. Journal of Educational Research, 29, 17- 28.
Burns, M. (2005). Using incremental rehearsal to increase fluency of single-digit
multiplication facts with children identified as learning disabled in
mathematics computation. Education and Treatment of Children, 28(3), 237-
249.
Carpenter, T., & Moser, J. (1984). The acquisition of addition and subtraction
concepts in grades one through three. Journal for Research in Mathematics
Education, 15, 179-202.
Chambers, D. (1996). Direct modeling and invented procedures: Building on
children’s informal strategies. Teaching Children Mathematics, 3, 92-95.
Clark, F., & Kamii, C. (1996). Identification of multiplicative thinking in children in
grades 1-5. Journal for Research in Mathematics Education, 27, 41-51.
Cumming, J., & Elkins, J. (1999). Lack of automaticity in the basic addition facts as a
characteristic of arithmetic learning problems and instructional needs.
Mathematical Cognition, 5(2), 149-180.
Cumming, J., & Elkins, J. (1999). Lack of automaticity in the basic addition facts as a
characteristic of arithmetic learning problems and instructional needs.
Mathematical Cognition, 5(2), 149-180.
38
Cumming, J., & Elkins, J. (1999). Lack of automaticity in the basic addition facts as a
characteristic of arithmetic learning problems and instructional needs.
Mathematical Cognition, 5(2), 149- 180.
Engelwood Cliffs, NJ: Prentice Hall. Kilpatrick, J., Swafford, J., & Findell, B. (2001).
Adding it up: Helping children learn mathematics. Washington, DC: National
Academy Press.
English, L. and Halford, G. (1995). Mathematics Education: Models and Processes.
Mahwah (NJ).
Foxman, D., & Beishuizen, M. (2002). Mental calculation methods used by 11-year-
olds in different attainment bands: A reanalysis of data from the 1987 APU
survey in the UK. Educational Studies in Mathematics, 51, 41-69.
French, D. (2005). Double, double, double. Mathematics in School,34(5) 8-9.
Fuson, K. C., & Kwon, Y. (1992). Learning addition and subtraction: Effects of
number words and other cultural tools. In J. Bideaud, C. Meljac, & J. P.
Fischer (Eds.), Pathways to number: Children’s developing numerical abilities
(pp. 283-306). Hillsdale, NJ: Erlbaum.
Garnett, K. (1992). Developing fluency with basic number facts: Intervention for
students with learning disabilities. Learning Disabilities Research & Practice
7, 210-216.
Geary, D. (1993). Mathematical disabilities: Cognitive, neuropsychological, and
genetic components. Psychological Bulletin, 114,345– 362.
Geary, D. (1996). The problem-size effect in mental addition: Developmental and
cross-national trends. Mathematical Cognition, 2(1), 63–93.
39
Geary, D., & Brown, S. (1991). Cognitive addition: Strategy choice and speed-of-
processing differences in gifted, normal, and mathematically disabled children.
Developmental Psychology, 27(3), 398-406.
Geary, D., & Brown, S. (1991). Cognitive addition: Strategy choice and speed-of-
processing differences in gifted, normal, and mathematically disabled children.
Developmental Psychology,27(3), 398-406.
Gersten, R., & Chard, D. (1999). Number sense: Rethinking arithmetic instruction for
students with mathematical disabilities. Journal of Special Education, 33(1),
18-28.
Gersten, R., Lloyd, J., & Baker, S. (2000). Designing high quality research in special
education: Group design experiments. Journal of Special Education, 24(1),
218-237.
Goldman, S. R., Pellegrino, J. W., & Mertz, D. L. (1988). Extended practice of basic
addition facts: Strategy changes in learning disabled students. Cognition and
Instruction, 5, 223- 265.
Goldman, S., & Pellegrino, J. (1987). Information processing and educational
microcomputer technology: Where do we go from here? Journal of Learning
Disabilities, 20, 144– 154.
Greeno, J. (1991). Number sense as situated knowing in a conceptual domain. Journal
for Research in Mathematics Education, 22(3), 170-218.
Hanich, L., Jordan, N. C., Kaplan, D., & Dick, J. (2001). Performance across different
areas of mathematical cognition in children with learning difficulties. Journal
of Educational Psychology, 93(3), 615- 626.
40
Hanich, L., Jordan, N. C., Kaplan, D., & Dick, J. (2001). Performance across different
areas of mathematical cognition in children with learning difficulties. Journal
of Educational Psychology, 93(3), 615- 626.
Hasselbring, T., Goin, L, & Bransford, J. (1988). Developing math automaticity in
learning handicapped children: The role of computerized drill and practice.
Focus on Exceptional Children, 20(6), 1-7.
Hasselbring, T., Lott, A., & Zydney, J. (2005). Technology supported math
instruction for students with disabilities: Two decades of research and
development. Retrieved May 31, 2011, from http://www.citeducation.org/
mathmatrix/default.asp
Hiebert (Ed.), Conceptual and procedural knowledge: The case of mathematics (pp.
38-56). Hillsdale, NJ: Lawrence Erlbaum Associates.
Hoard, M., Geary, D., & Hamson, C. (1999). Numerical and arithmetical cognition:
Performance of low- and average-IQ children. Mathematical Cognition, 5, 65–
91.
Hoard, M., Geary, D., & Hamson, C. (1999). Numerical and arithmetical cognition:
Performance of low- and average-IQ children. Mathematical Cognition, 5, 65–
91.
Hoover, H., Nieronymus, A., Dunbar, S., & Frisbie, D. (1996). Iowa Test of Basic
Skills. Itasca, IL: Riverside Publishing Company.
Isaacs, A., & Carroll, W. (1999). Strategies for basic fact instruction. Teaching
Children Mathematics, 5(9), 508-515.
Kameenui, E., Carnine, D., Dixon, R., Simmons, D., & Coyne, M. (2001). Effective
teaching strategies that accommodate diverse learners.
41
Koscinski, S., & Gast, D. (1993). Use of constant time delay in teaching
multiplication facts to students with learning disabilities. Journal of Learning
Disabilities, 26(8), 533-544.
Kroesbergen, E. & Van Luit, J. (2003). Mathematics interventions for children with
special educational needs: A meta-analysis. Remedial and Special Education.
24(2), 97-114.
Kroesbergen, E. & Van Luit, J. (2003). Mathematics interventions for children with
special educational needs: A meta-analysis. Remedial and Special Education.
24(2), 97-114.
Ma, L. (1999). Knowing and teaching elementary mathematics: Teachers’
understanding of fundamental mathematics in China and the United States.
Mahwah, NJ: Lawrence Erlbaum Associates.
Mercer, C. D., & Miller, S. P. (1992). Teaching students with learning problems in
maths to acquire, understand and apply basic math facts. Remedial and Special
Education, 13(3), 19-35.
Miller, S., Strawser, S., & Mercer, C. (1996). Promoting strategic math performance
among students with learning disabilities. LD Forum, 21(2), 34-40.
Morton, R., & Flynt, S. (1997). A comparison of constant time delay and prompt
fading to teach multiplication facts to students with learning disabilities.
Journal of Instructional Psychology, 24, 3- 13.
Mulligan, J., & Mitchelmore, M. (1997). Young children’s intuitive models of
multiplication and division. Journal for Research in Mathematics Education,
28(4), 309-330.
Nickson, M. (2000). Teaching and Learning Mathematics: A Teacher's Guide to
Recent Research and Application, CASSELL London and New York.
42
Orton, A. (1992). Learning Mathematics: issues, Theory and Classroom Practice. 2nd
ed., Cassell, London and New York.
Pellegrino, J. W., & Goldman, S. J. (1987). Information processing and elementary
mathematics. Journal of Learning Disabilities, 20, 23- 32.
Putnam, R., deBettencourt, L., & Leinhardt, G. (1990). Understanding of derived-fact
strategies in addition and subtraction. Cognition and Instruction, 7(3), 245-
285.
Rathmell, E. (1978). Using thinking strategies to teach the basic facts. In M. Suydam
& R. Reys (Eds.), Developing computational skills: 1978 yearbook of the
National Council of Teachers of Mathematics (pp. 13-38). Reston, VA:
NCTM.
Resnick, L. (1983). A developmental theory of number understanding. In H. Ginsburg
(Ed.), The development of mathematical thinking (pp. 109-151). New York:
Academic Press.
Sherin, B., & Fuson, K. (2005). Multiplication strategies and the appropriation of
computational resources. Journal for Research in Mathematics Education
36(4), 163-171.
Sherin, B., & Fuson, K. (2005). Multiplication strategies and the appropriation of
computational resources. Journal for Research in Mathematics Education
36(4), 163-171.
Siegler, R. (1996). Emerging minds: The process of change in children’s thinking.
New York: Oxford University Press.
Siegler, R., & Jenkins, E. (1989). How children discover new strategies. Hillsdale,
NJ: Lawrence Erlbaum Associates.
43
Sowder, J. (1992). Making sense of numbers in school mathematics. In G. Leinhardt,
R. Putnam, & R. Hattrup (Eds.), Analysis of arithmetic for mathematics
teaching (pp. 1-51). Hillsdale, NJ: Lawrence Erlbaum Associates.
Stein, M., Silbert, J., & Carnine, D. (1997). Designing effective mathematics
instruction: A direct instruction approach (3rd ed.). Columbus, OH: Merrill.
Steinberg, R. (1985). Instruction on derived facts strategies in addition and
subtraction. Journal for Research in Mathematics Education, 16, 337- 355.
Swanson, L., Hoskyn, M., & Lee, C. (1999). Interventions for students with learning
disabilities: A meta-analysis of treatment outcomes. New York: The Guilford
Press.
Swanson, L., Hoskyn, M., & Lee, C. (1999). Interventions for students with learning
disabilities: A meta-analysis of treatment outcomes. New York: The Guilford
Press.
Tall, D. and Razali, M. R. (1993). Diagnosing Students' Difficulties in Learning
Mathematics. International Journal of Mathematics Education, Science and
Technology, 24 (2) pp. 209-222.
Thompson, C., & Van de Walle, J (1984). Let’s do it: Modeling subtraction situations.
Arithmetic Teacher, 32, 8- 12.
Thornton, C. (1990). Strategies for the basic facts. In J. Payne (Ed.), Mathematics for
the young child (pp. 133-51). Reston, VA: National Council of Teachers of
Mathematics.
Thornton, C., & Smith, P. (1988). Action research: Strategies for learning subtraction
facts. Arithmetic Teacher, 35, 8- 12. Tournaki, N. (2003). The differential
effects of teaching addition through strategy instruction versus drill and
44
practice to students with and without learning disabilities. Journal of Learning
Disabilities, 36(5), 449-458.
Van de Walle, J. (2003). Elementary and middle school mathematics: Teaching
developmentally (5th ed.). New York: Addison- Wesley.
Wain, G. T. and Woodrow, D. (1980). Mathematics Teacher Education Project:
Tutor's Guide. Editors G. T. Wain, D. Woodrow, Glasgow London, Blackie.
Wood, D., & Frank, A. (2000). Using memory enhancing strategies to learn
multiplication facts. Teaching Exceptional Children, 32(5), 78-82.
Wood, D., Frank, A., & Wacker, D. (1998). Teaching multiplication facts to students
with learning disabilities. Journal of Applied Behavior Analysis, 31, 323- 338.
Woodward, J., & Stroh, M. (2004a). Transitional mathematics program, level 1:
Developing number sense. Longmont, CO: Sopris West.
Woodward, J., & Stroh, M. (2004b). Fact fluency and more! Longmont, CO: Sopris
West.
45
LIST OF FIGURES
12
6
18 0 6 36 42 24 30
6
X
Figure 1: Example of visual representation of derived fact strategy for 6 x 7
46
80
120 0 40 240 280 160 200
40 X 1
X 2
X 3
X 4
X 5
X 6
X 7
8
12 0 4 24 28 16 2 0
4 X 1
X 2
X 3
X 4
X 5
X 6
X 7
Figure 2: Connection between facts and extended facts using number lines
and blocks
4 X 3 = 12
40X 30 = 120
47
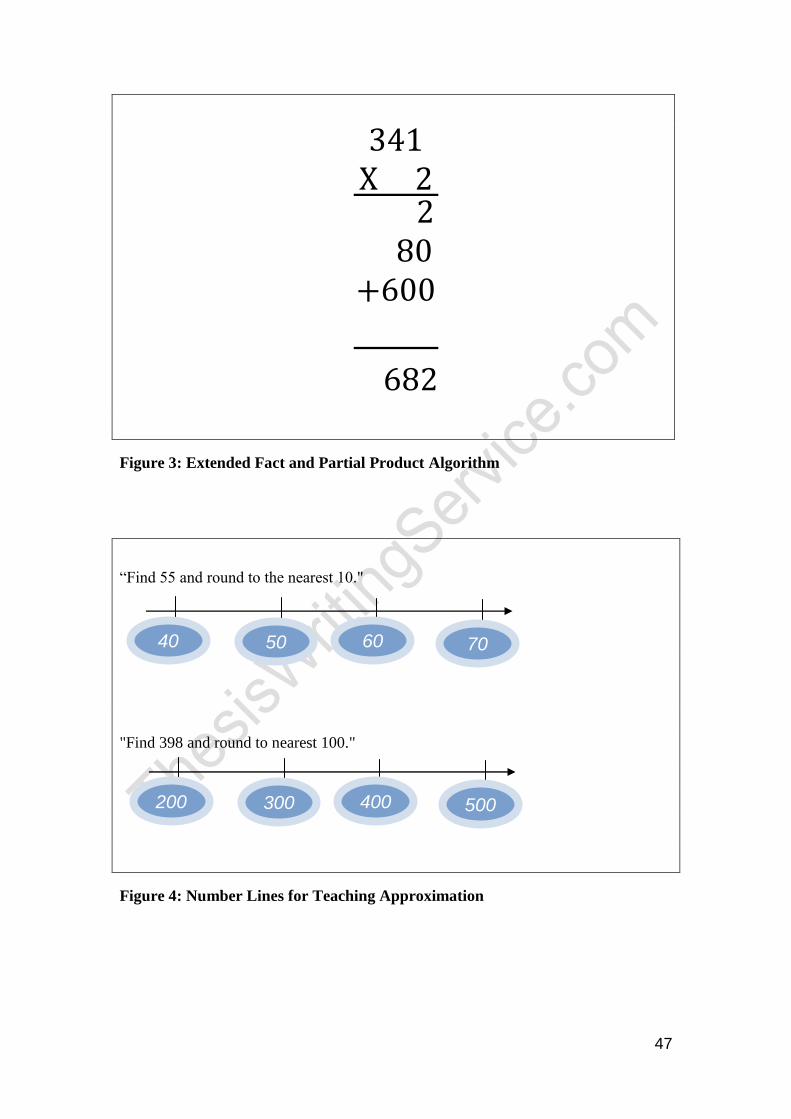
Figure 3: Extended Fact and Partial Product Algorithm
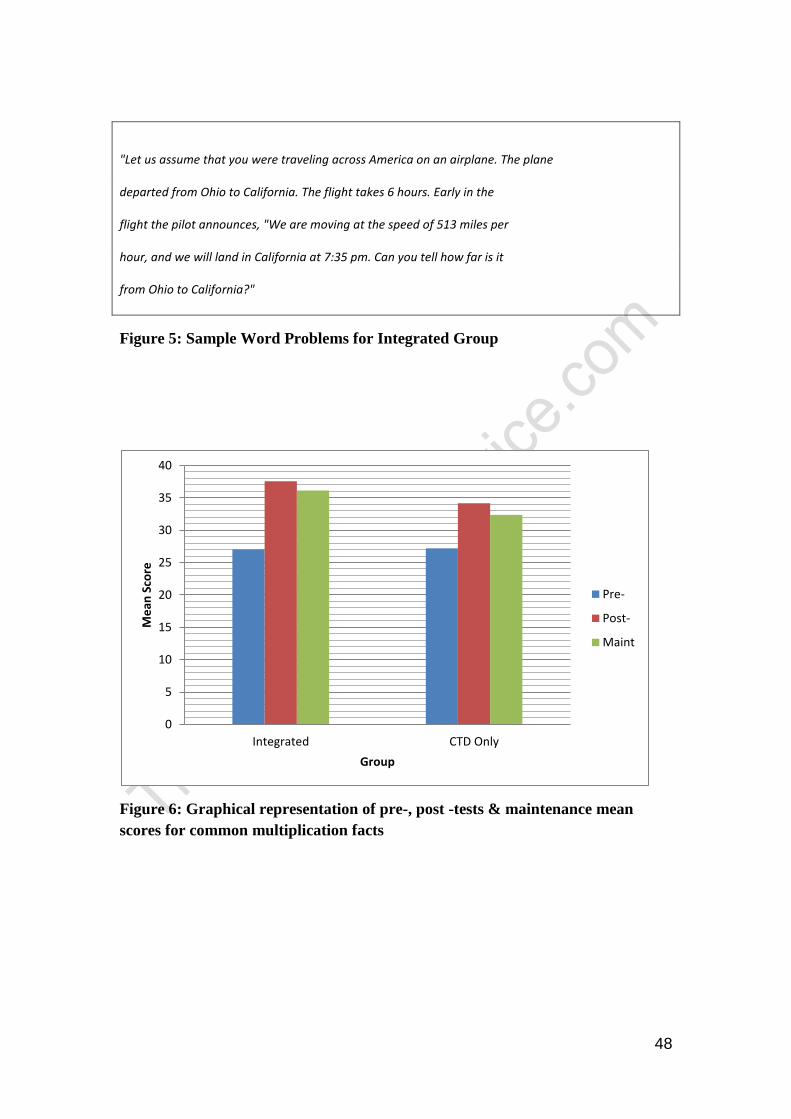
“Find 55 and round to the nearest 10."
"Find 398 and round to nearest 100."
Figure 4: Number Lines for Teaching Approximation
40 50 60 70
200 300 400 500
48
"Let us assume that you were traveling across America on an airplane. The plane
departed from Ohio to California. The flight takes 6 hours. Early in the
flight the pilot announces, "We are moving at the speed of 513 miles per
hour, and we will land in California at 7:35 pm. Can you tell how far is it
from Ohio to California?"
Figure 5: Sample Word Problems for Integrated Group
Figure 6: Graphical representation of pre-, post -tests & maintenance mean
scores for common multiplication facts
0
5
10
15
20
25
30
35
40
Integrated CTD Only
Me
an S
core
Group
Pre-
Post-
Maint
49
Figure 7: Graphical representation of pre-, post -tests & maintenance mean
scores for hard multiplication facts
0
5
10
15
20
25
30
Integrated CTD Only
Me
an S
core
Group
Pre-
Post-
Maint
50
LIST OF TABLES
Information Integrated Strategy CTD Only
Population 5 5
Age (Years) 9 9
ITBS Computation 23.92 [6.50]SD
25.54[5.60]
Common Facts Pretest 27.03[5.42] 27.18[7.14]
Hard Multiplication Facts Pre-Test 11.97[9.35] 16.32[11.15]
Gender Ratio 3F /2M 2F /3M
SD: All enclosed scores represent standard deviation
Table 1: Participants' Demographic Information
Integrated Strategy CTD Only
Pre-Test
Mean 27.03 27.18
Standard Deviation 5.42 7.14
Mean % Correct 68 68
Post-Test
Mean 37.57 34.18
Standard Deviation 3.95 7.27
Mean % Correct 94 86
Maintenance Test
Mean 36.13 32.36
Standard Deviation 5.37 7.80
Mean % Correct 90 81
Table 2: Mean, Standard Deviation, Percent Correct for Common Multiplication
Facts
51
Integrated Strategy CTD Only
Pre-Test
Mean 11.97 16.32
Standard Deviation 9.35 11.15
Mean % Correct 30 41
Post-Test
Mean 25.76 25.46
Standard Deviation 9.80 10.86
Mean % Correct 64 64
Maintenance Test
Mean 25.23 24.61
Standard Deviation 9.55 10.90
Mean % Correct 63 62
Table 3: Mean, Standard Deviation, Percent Correct for Hard Multiplication
Facts
Integrated Strategy CTD Only
Mean 13.47 10.78
Standard Deviation 2.11 3.90
Mean % Correct 90 72
Table 4: Mean, Standard Deviation, Percent Correct for Extended Facts Tests
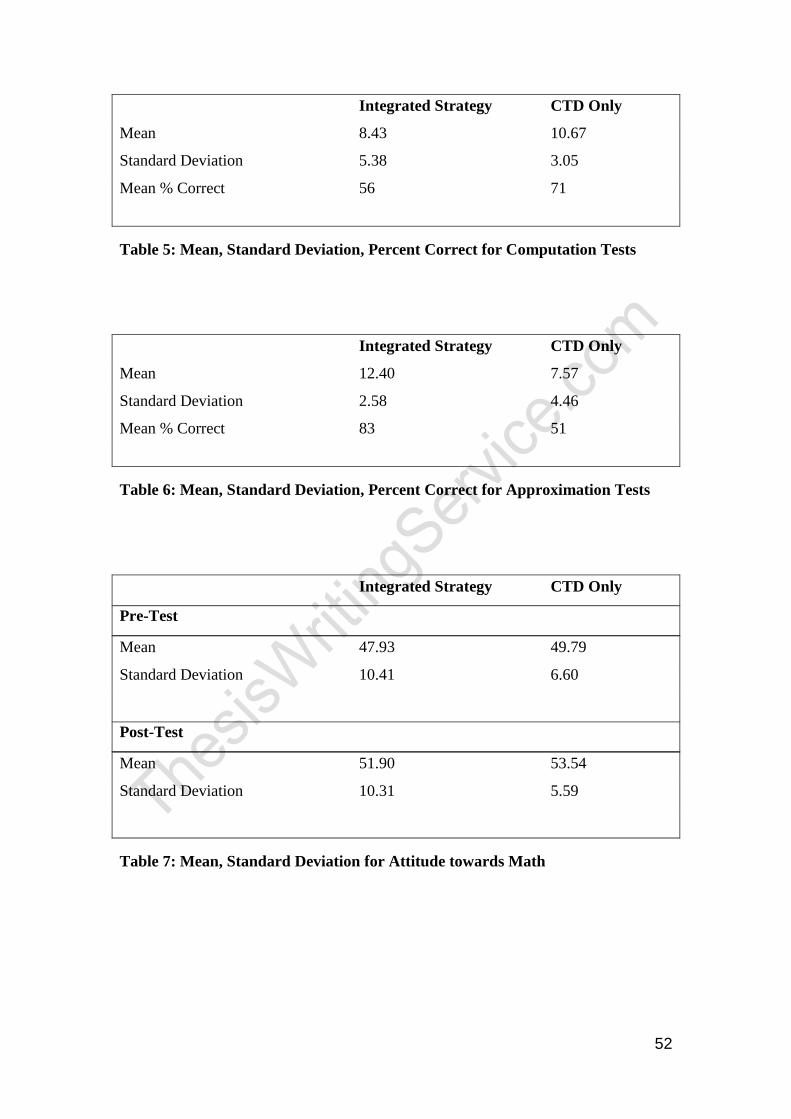
52
Integrated Strategy CTD Only
Mean 8.43 10.67
Standard Deviation 5.38 3.05
Mean % Correct 56 71
Table 5: Mean, Standard Deviation, Percent Correct for Computation Tests
Integrated Strategy CTD Only
Mean 12.40 7.57
Standard Deviation 2.58 4.46
Mean % Correct 83 51
Table 6: Mean, Standard Deviation, Percent Correct for Approximation Tests
Integrated Strategy CTD Only
Pre-Test
Mean 47.93 49.79
Standard Deviation 10.41 6.60
Post-Test
Mean 51.90 53.54
Standard Deviation 10.31 5.59
Table 7: Mean, Standard Deviation for Attitude towards Math
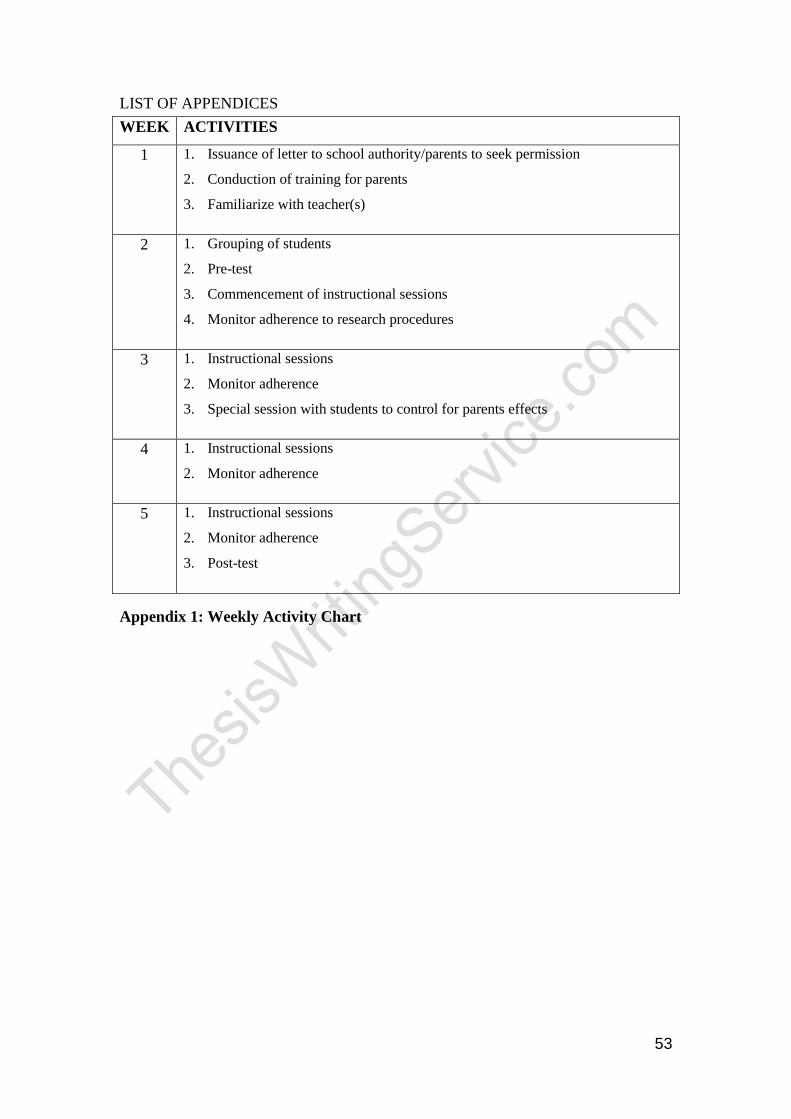
53
LIST OF APPENDICES
WEEK ACTIVITIES
1 1. Issuance of letter to school authority/parents to seek permission
2. Conduction of training for parents
3. Familiarize with teacher(s)
2 1. Grouping of students
2. Pre-test
3. Commencement of instructional sessions
4. Monitor adherence to research procedures
3 1. Instructional sessions
2. Monitor adherence
3. Special session with students to control for parents effects
4 1. Instructional sessions
2. Monitor adherence
5 1. Instructional sessions
2. Monitor adherence
3. Post-test
Appendix 1: Weekly Activity Chart
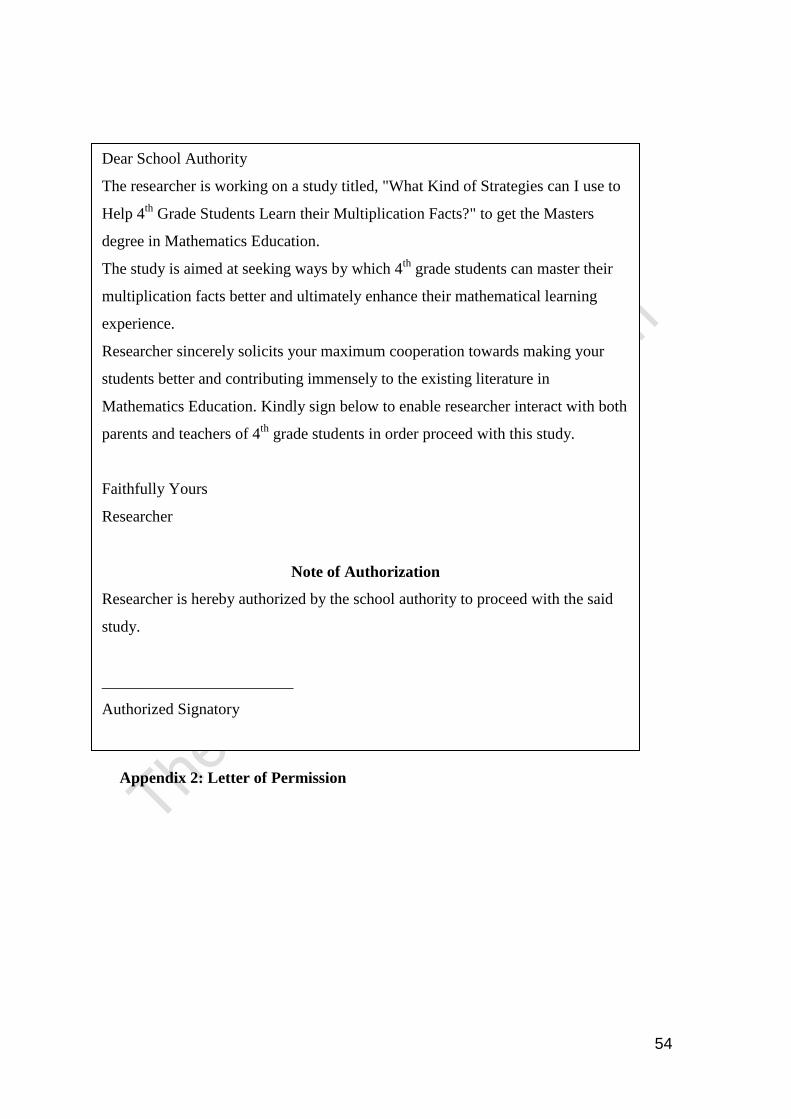
54
Appendix 2: Letter of Permission
Dear School Authority
The researcher is working on a study titled, "What Kind of Strategies can I use to
Help 4th
Grade Students Learn their Multiplication Facts?" to get the Masters
degree in Mathematics Education.
The study is aimed at seeking ways by which 4th
grade students can master their
multiplication facts better and ultimately enhance their mathematical learning
experience.
Researcher sincerely solicits your maximum cooperation towards making your
students better and contributing immensely to the existing literature in
Mathematics Education. Kindly sign below to enable researcher interact with both
parents and teachers of 4th
grade students in order proceed with this study.
Faithfully Yours
Researcher
Note of Authorization
Researcher is hereby authorized by the school authority to proceed with the said
study.
________________________
Authorized Signatory
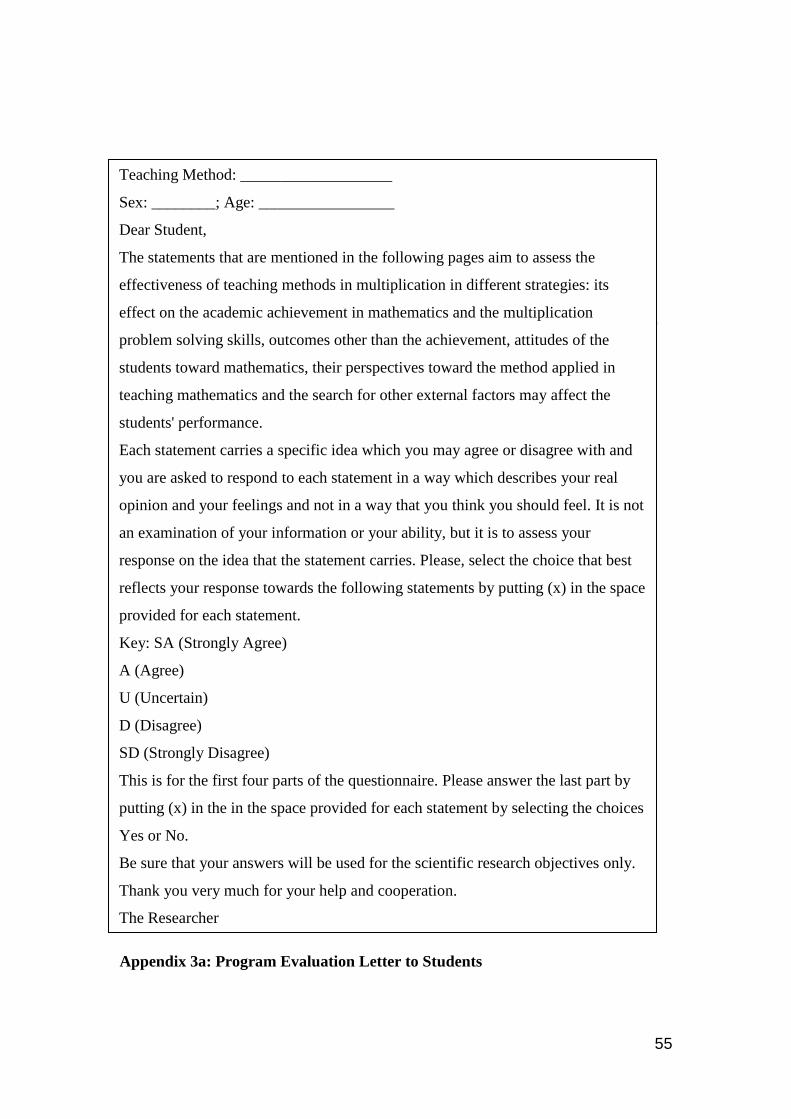
55
Appendix 3a: Program Evaluation Letter to Students
Teaching Method: ___________________
Sex: ________; Age: _________________
Dear Student,
The statements that are mentioned in the following pages aim to assess the
effectiveness of teaching methods in multiplication in different strategies: its
effect on the academic achievement in mathematics and the multiplication
problem solving skills, outcomes other than the achievement, attitudes of the
students toward mathematics, their perspectives toward the method applied in
teaching mathematics and the search for other external factors may affect the
students' performance.
Each statement carries a specific idea which you may agree or disagree with and
you are asked to respond to each statement in a way which describes your real
opinion and your feelings and not in a way that you think you should feel. It is not
an examination of your information or your ability, but it is to assess your
response on the idea that the statement carries. Please, select the choice that best
reflects your response towards the following statements by putting (x) in the space
provided for each statement.
Key: SA (Strongly Agree)
A (Agree)
U (Uncertain)
D (Disagree)
SD (Strongly Disagree)
This is for the first four parts of the questionnaire. Please answer the last part by
putting (x) in the in the space provided for each statement by selecting the choices
Yes or No.
Be sure that your answers will be used for the scientific research objectives only.
Thank you very much for your help and cooperation.
The Researcher
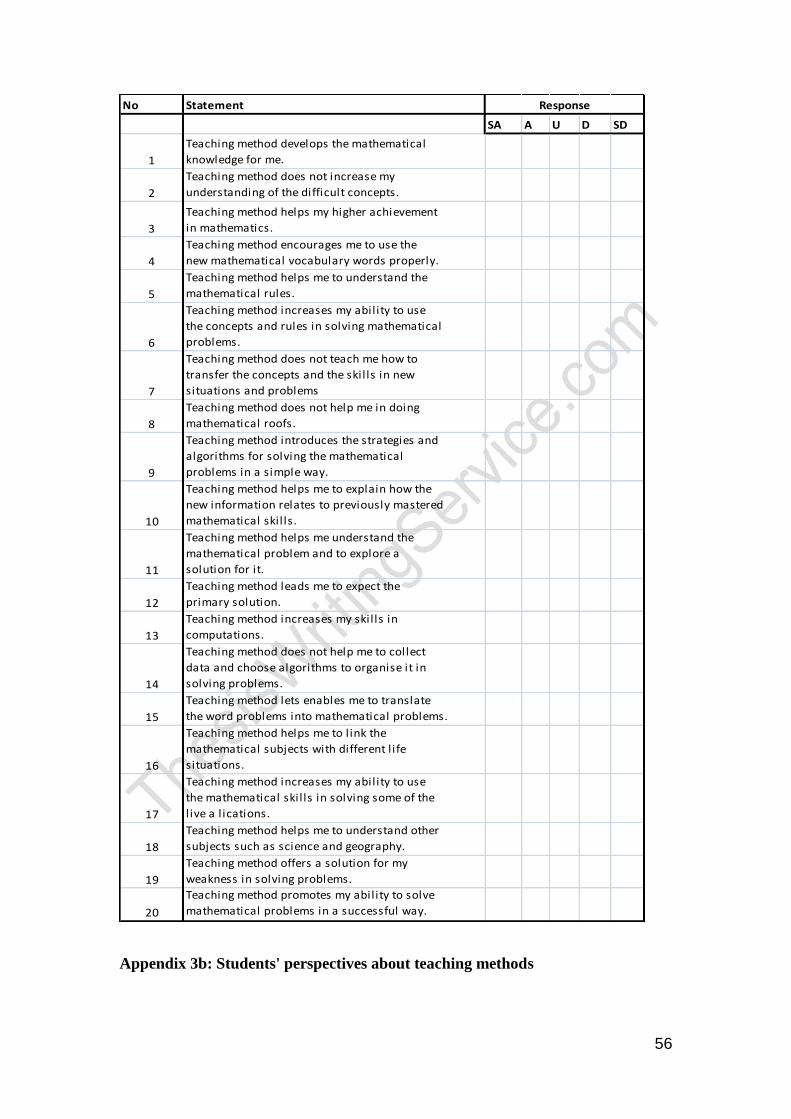
56
No Statement
SA A U D SD
1
Teaching method develops the mathematical
knowledge for me.
2
Teaching method does not increase my
understanding of the difficult concepts.
3
Teaching method helps my higher achievement
in mathematics.
4
Teaching method encourages me to use the
new mathematical vocabulary words properly.
5
Teaching method helps me to understand the
mathematical rules.
6
Teaching method increases my ability to use
the concepts and rules in solving mathematical
problems.
7
Teaching method does not teach me how to
transfer the concepts and the skil ls in new
situations and problems
8
Teaching method does not help me in doing
mathematical roofs.
9
Teaching method introduces the strategies and
algorithms for solving the mathematical
problems in a simple way.
10
Teaching method helps me to explain how the
new information relates to previously mastered
mathematical skil ls.
11
Teaching method helps me understand the
mathematical problem and to explore a
solution for it.
12
Teaching method leads me to expect the
primary solution.
13
Teaching method increases my skil ls in
computations.
14
Teaching method does not help me to collect
data and choose algorithms to organise it in
solving problems.
15
Teaching method lets enables me to translate
the word problems into mathematical problems.
16
Teaching method helps me to l ink the
mathematical subjects with different l ife
situations.
17
Teaching method increases my ability to use
the mathematical skil ls in solving some of the
live a l ications.
18
Teaching method helps me to understand other
subjects such as science and geography.
19
Teaching method offers a solution for my
weakness in solving problems.
20
Teaching method promotes my ability to solve
mathematical problems in a successful way.
Response
Appendix 3b: Students' perspectives about teaching methods
57
Observer: ..................................
Day / Date: ...............................
Parent: ...................................
Grade / Class: ............................
No. of Students: ...........................
Strategy Type: ............................
Parent's Math Teaching Skills Observations & Field Notes
Introduction:
Explaining the assignment and the
objectives of the lesson.
Presenting the concepts that are needed
for the lesson.
Explaining the academic task and the
problem to be solved.
Presenting similar and small problems for
discussion.
Introducing the lesson in an interesting
and exiting way.
Linking between the objectives of the
lesson and our daily life situations.
Making connections between
mathematical concepts, roles, facts,
algorithms and problem solving.
Exploration
Encouraging and monitoring the
student to work properly.
Helping the child if they need help.
Asking the child to monitor their
performance, behaviour, and
functioning.
Observing and listening to the
students' individual ideas, discussions,
procedures and strategies for solving
58
the problems.
Providing additional activities for
groups that finish more quickly than
the others.
Reflection and Evaluation Processing
Group/ students summarizing their
work and sharing their processes.
Group/ students presenting their
solutions.
Evaluating students' achievement.
Providing feedback after evaluation.
Group Management
Explaining the positive goal
interdependence, the learning task and
the expectation for the group, the
expected learning behavior, the
procedure to follow and the definition
of the group.
Making sure of the contribution and
the interaction of the students to
accomplish their goal and sharing the
materials.
Supporting the students to explain, to
elaborate and to encourage the
students' academic achievement.
Ensuring that students understand that
they are individuals accountable for
their assignment.
Assigning students into different
groups.
Instruments and Materials:
Structuring the materials and the
instructions for the use of the
students.
59
Deciding how to distribute
instructional materials.
Using different and variety
instruments.
Indicate which of the following:
Yes No
Textbook
Work Sheet
Manipulative / Games
Test
Other ( Specify.... )
Appendix 4: Guidance Observation Sheet