Embed Size (px)
Citation preview

Translation to the English language: Orlando González RiveraThis research was completed thanks to the sponsoring of Filantropía PR (formerly known as Red de Fundaciones de Puerto Rico) and the assistance of the student Antonio Gil de Rubio Cruz. Thanks to the comments made by the team of researchers of the Education Observatory: Dr. César Rey Hernández, Dr. Héctor Cordero Guzmán, Dr. José Caraballo Cueto and Dra. Indira Luciano Montalvo. We also appreciate the collaboration of the Puerto Rico Department of Education staff.
S T U D Y # 3
Dr. Eileen V. Segarra Alméstica,Full Professor
Department of Economics
Researcher at CEMGAP
University of Puerto Rico, Río Piedras Campus
WHAT LIES BEHIND THE VARIATIONSOF ACADEMIC PERFORMANCE AMONG PUBLIC SCHOOLS IN PUERTO RICO? SOCIODEMOGRAPHIC, COMMUNITYAND SCHOOL FACTORS
WHAT LIES BEHIND THE VARIATIONSOF ACADEMIC PERFORMANCE AMONG PUBLIC SCHOOLS IN PUERTO RICO? SOCIODEMOGRAPHIC, COMMUNITYAND SCHOOL FACTORS

i
SummaryThe differences in academic performance among schools can result from disparities in school quality, students' sociodemographic characteristics, or community resources. This work objective is to measure the effect of sociodemographic, community, and school factors in average academic performance per school within the public system of Puerto Rico. The effect of the sociodemographic and community variables was measured; the aggregate value of each school was estimated after controlling the sociodemographic and community variables; and the school factors that may be contributing to the aggregate value of each school were identified.
The results indicated that the sociodemographic and community factors account for more than 60% of the observed variation in academic performance among secondary schools and around a third of junior high schools' variation. The percentage of students under the poverty level was the strongest predictor of school academic performance. The percentage of students enrolled in the special education program was associated with lower academic performance among junior high schools and high schools and increased school dropout rates in junior high schools. The school size was also negatively associated with the value-added in primary schools and junior high schools, while the quality of teachers had a positive and significant effect on the value-added for all schools.
ii
Table of Contents
Summary � � � � � � � � � � � � � � � � � � � � � � � � � � � � � � � � � � � � � � � � � � � � � � � � � � � � � � � � � � � � � � � � � � � � � � � � � � � � i
Introduction � � � � � � � � � � � � � � � � � � � � � � � � � � � � � � � � � � � � � � � � � � � � � � � � � � � � � � � � � � � � � � � � � � � � � � � � � 1
Inequality in school performance and unequal opportunities � � � � � � � � � � � � � � � � � � � � � � � � � � � � � � � � � � � 2
Factors having an impact on academic performance � � � � � � � � � � � � � � � � � � � � � � � � � � � � � � � � � � � � � � � � � 3
Individual or family factors � � � � � � � � � � � � � � � � � � � � � � � � � � � � � � � � � � � � � � � � � � � � � � � � � � � � � � � � � � � � � � � 4
Community factors . . . . . . . . . . . . . . . . . . . . . . . . . . . . . . . . . . . . . . . . . . . . . . . . . . . . . . . . . . . . . . . . . . . . . . . . . .6
School factors . . . . . . . . . . . . . . . . . . . . . . . . . . . . . . . . . . . . . . . . . . . . . . . . . . . . . . . . . . . . . . . . . . . . . . . . . . . . . .6
Description of the study � � � � � � � � � � � � � � � � � � � � � � � � � � � � � � � � � � � � � � � � � � � � � � � � � � � � � � � � � � � � � � � 9
Data sources � � � � � � � � � � � � � � � � � � � � � � � � � � � � � � � � � � � � � � � � � � � � � � � � � � � � � � � � � � � � � � � � � � � � � � � � 10
Definition of the academic performance indicators � � � � � � � � � � � � � � � � � � � � � � � � � � � � � � � � � � � � � � � � 10
Limitations � � � � � � � � � � � � � � � � � � � � � � � � � � � � � � � � � � � � � � � � � � � � � � � � � � � � � � � � � � � � � � � � � � � � � � � � � � � 12
Analysis of the effect of socioedemographic and community factors on academic performance � � � � � � � � � � � � � � � � � � � � � � � � � � � � � � � � � � � � � � � � � � � � � � � � � � � � � � 12
Results of the analysis related to the GPI � � � � � � � � � � � � � � � � � � � � � � � � � � � � � � � � � � � � � � � � � � � � � � � � � � 15
Results of the analysis relate to dropout rates � � � � � � � � � � � � � � � � � � � � � � � � � � � � � � � � � � � � � � � � � � � � � � 20
Evaluation of the value-added per school � � � � � � � � � � � � � � � � � � � � � � � � � � � � � � � � � � � � � � � � � � � � � � � � 24
Estimate of value-added � � � � � � � � � � � � � � � � � � � � � � � � � � � � � � � � � � � � � � � � � � � � � � � � � � � � � � � � � � � � � � � � 24
Analysis of the effect of school variables on the value-added � � � � � � � � � � � � � � � � � � � � � � � � � � � � � � � � � 27
Conclusions and recommendations � � � � � � � � � � � � � � � � � � � � � � � � � � � � � � � � � � � � � � � � � � � � � � � � � � � � � 35
References � � � � � � � � � � � � � � � � � � � � � � � � � � � � � � � � � � � � � � � � � � � � � � � � � � � � � � � � � � � � � � � � � � � � � � � � � � � 37
Appendix A: Technical Appendix � � � � � � � � � � � � � � � � � � � � � � � � � � � � � � � � � � � � � � � � � � � � � � � � � � � � � � � � � 40
Spatial regressions . . . . . . . . . . . . . . . . . . . . . . . . . . . . . . . . . . . . . . . . . . . . . . . . . . . . . . . . . . . . . . . . . . . . . . . . 41
Appendix B: Lists of schools rank according to the estimated value-added� � � � � � � � � � � � � � � � � � � � � � � 43
1
IntroductionDisparities in the quality of education in the education system have been of great concern in the United States as well as in Latin America, affecting disproportionately the marginal communities and perpetuating poverty and inequality (Renewing America, 2013; CEPAL, 2015). In Puerto Rico, Ladd and Rivera-Bátiz (2006) have also mentioned the lack of uniformity in the public education system's quality as one of its main problems. The lack of uniformity rises from the bifurcation between the public and the private systems as well as the quality differences within each one.
According to Ladd and Rivera-Bátiz (2006), the percentage of primary and secondary students enrolled in private schools increased from 10% in 1980 to 25% by 2005. This percentage has remained between 24 to 25% in recent years (Disdier Flores and Jara Castro, 2017). This private system attracts higher-income students, while the public system serves the economically disadvantaged population, which reduces the resources of the system and undermines its quality creating a vicious circle of neglect.¹ Private schools are perceived as offering better education and a safer environment. However, Ladd and Rivera-Bátiz mentioned that the proliferation in the number of private schools has resulted in great diversity in the quality of their offer. On the other hand, noticeable quality differences have been shown within the public system, which could be related to the socioeconomic level of the communities where they are located. The dropout rate was higher for low-income students, and achievement levels were lower in schools located in poorer communities (Ladd and Rivera-Bátiz, 2006).² The ABRE Puerto Rico (2018) report pointed out the diverse scores received by schools according to their academic performance. Even further, it pointed out that in junior high schools and high schools, there was a gap among schools with high-performance levels versus the rest. These differences contribute to perpetuating inequality in Puerto Rico.
This work has focused on measuring how much of an effect sociodemographics, and community factors have had on the average academic performance of each school of the public system in Puerto Rico. Although schools' performance has been measured, we still needed to go beyond that measurement to study the factors impacting it. Identifying the internal and external factors affecting school performance could help define public policies focusing on the most relevant elements, not only from the Department of Education (DE) standpoint but also from other relevant agencies standpoint.
The objectives of this study are the following:
a. To evaluate the different factors impacting academic performance to identify public policy to foster positive reinforcement and reduce the negative factors.
b. To estimate the value-added of each school after considering the effect of factors that are not under the school's control, in other words, the sociodemographic and community characteristics.
c. To identify the factors that may contribute to the value-added brought by the school.
d. To provide a ranking of schools according to their value-added.
The data used for this analysis included information on active schools in Puerto Rico during the 2016-2017, 2017-2018, and 2018-2019 school years. The DE provided the Measurement and Evaluation for the Transformation
¹ According to data from the 2018 Puerto Rico Community Survey (5 years sample), the median household income for children and adolescents between 5 and 17 years old attending private schools ($51,232) is three times higer than for those attending public schools ($16,928).² See Cordero-Guzmán (2020) in this report for an updated analysis of the droput rate based on socioeconomic level.
2
of Academics (META) standardized test results for each student, the dropout percentage per school, and data related to students' socioeconomic and demographic level. According to the community where it was located, each school was assigned different characteristics obtained from the Puerto Rico Community Survey (PRCS) by census tract. The type 1 crime rate for the census tract was calculated using the crime data from the Puerto Rico police. Based on META test results, an academic performance indicator was constructed for each school and each education level (elementary, junior high school, and high school).
Among high schools, the sociodemographic factors accounted for 60% of the variation observed among schools concerning the academic performance index and around one third among junior high schools. The sociodemographic variables were less relevant in accounting for the variation observed in elementary schools, which opened some room for public policy to significantly impact economically disadvantaged populations. The results showed that rural schools had better performance indicators for elementary schools and junior high schools. The percentage of students under the poverty level and participation in the special education program turned out to be the most significant variables for junior high school and high school. The percentage of students in the special education program was also associated with an increase in school dropout rates in junior high school. In contrast, school dropout rates in high school showed a strong relationship with the poverty level.
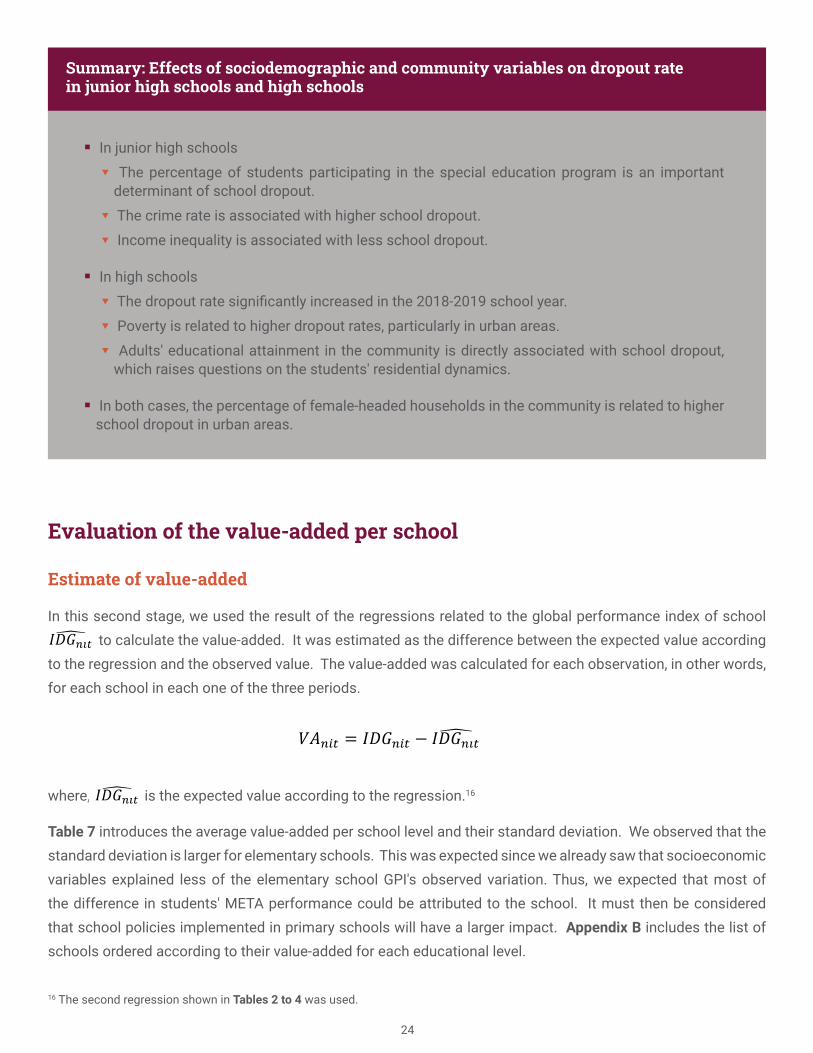
In the second stage of the analysis, the school value-added was estimated as the difference between the academic performance indicator observed in each school for each education level and the expected indicator according to the statistical regression analysis. On average, schools in Humacao's education region produced a significantly lower average value-added at all levels, even after controlling for differences in school environment variables. The same was true in Bayamón at the elementary school and high school levels and in Ponce for junior high schools. Elementary schools and junior high schools were associated with higher value-added. The teachers' attendance rate and the percentage of teachers with exemplary evaluations positively and significantly affected the value-added at all levels, while the percentage of teachers with graduate education only significantly affected the high schools' value-added.
Next, we present a literature review related to this topic. The following section will then introduce the description of the study, followed by a fourth section where the analysis of the sociodemographic and community factors affecting academic performance will be discussed. In the fifth section, the value-added per school is analyzed, and the factors affecting it.
Literature review
Inequality in school performance and unequal opportunities
Due to the inequities observed in the quality of education throughout the education system, it is being debated whether school acts foster equity or, on the contrary, the education system perpetuates or increases the preexisting socioeconomic inequalities. This is not a trivial question in Puerto Rico since alarming levels of inequality in the income distribution have been shown.
3
A source of inequality may arise from different levels of financing. Condron and Roscigno (2003) proved a significant variation in financing within the same school district. This inequality was associated with the percentage of students under the poverty level and from minority groups. This effect is due to the school financing structure in the United States since the primary monetary resources for schools originate from property tax at the local level, which in turn is related to the residential segregation concentrating the disadvantaged students in one school. Logan, Minca, and Adar (2012) emphasized that the race/ethnic origin, poverty, location, and migration factors were interconnected with the student composition, contributing to the school segregation process. According to Chaplin (2002), cited by Logan, Minca, and Adar (2012), the concentration of poverty within the student population negatively affected the students' performance, even after controlling the students' own family characteristics. In the case of Brazil, Costa Almeida (2017) found segregation patterns among schools reproducing the existing inequalities. He concluded that free school selection programs did not solve the segregation problem since they fostered voluntary segregation, favoring families with greater mobility and socialization patterns connected to the school.
Another aspect stressed by the literature is the inequality in the quality of teachers among schools. Mansfield (2015) confirmed that the most disadvantaged students attended schools whose teachers' quality was below average, at least in North Carolina's public education system. However, this difference in quality is quite small.
Downey and Condron (2016) also mentioned curricular differences as another factor that may encourage inequality to the extent that it exposed some students to more advanced materials compared to others. However, the authors argued that the correct question is if inequality would be greater or lesser in the absence of an education system. The school can be an equalizing agent since it compensates for significant differences in the students' family and community environment. The results of counterfactual studies, contrasting changes in students' cognitive capacity during summer versus changes shown during the school year, found that schools had a "compensatory" effect reducing inequality among students from different socioeconomic environments, but not among students from different races or ethnic origin.
Downey and Condron (2016) underlined that to reduce the gap among students of different socioeconomic environments requires to go beyond merely making schools equal in quality, arguing that it would require creating learning environments substantially better to address the disadvantaged populations. Likewise, Costa Almeida (2017) proposed to organize schoolwork by rethinking the education process given the inequalities occurring in schools. To develop policies addressing the inequality problem in education, we must identify different factors that affect student performance and evaluate the importance of family, community, and school factors. Evaluating schools without considering all these factors, especially if low-performance schools are penalized, may exacerbate educational and socioeconomic disparities.
Factors having an impact on academic performance:
Multiple factors having an impact on students' performance have been identified in the literature. We could summarize it in three groups: individual or family, community, and school. The table below summarizes the sub-themes within each one of the categories discussed below.

4
Individual or family factors:■ Socioeconomic level■ Migrant status ■ Health condition■ Parent's education level■ Gender ■ Family composition
Factors having an impact on academic performance
Community factors:■ Unemployed population■ Educational attainment of
the adult population■ Family composition among
families in the community■ Immigrant proportion■ Crime rate
School factors:■ Curriculum■ Quality of teachers■ School budget■ Group size■ School size
Individual or family factors
The literature has identified multiple individual or family factors that have an impact on students' performance. As aforementioned, the family's socioeconomic level is a determinant factor. The migrant status is too (Pong and Hao, 2007). Harris, Jamison and Trujillo (2008) found that the migrant status helped predict school performance, although the direction of this variable's effect depended on other aspects such as socioeconomic status and culture. However, Dustman et al. (2012) observed an interrelation between migrant status and parents' educational attainment. Their results suggested that the gap between students' performance according to their migrant status was reduced or even disappeared in countries where migrant parents had a similar or higher educational attainment to that of the locals. On the other hand, the school performance gap will put the children of immigrants at a disadvantage in countries where immigrant parents have lower educational attainment.
The socioeconomic level relates to another aspect that can influence school performance: students' health. Roos et al. (2013) suggested that adolescents' health condition affected their school performance, which at the same time influenced their future socioeconomic status and future health. They identified the most important factors influencing adolescents' development: receiving social assistance, mother's age when having the first child, gender, residence mobility, having ADHD or other behavioral disorders, and family functioning measurements. They stated that the children's mental health also played an important role.
Gaps in performance due to gender are also among the individual factors identified. Ma (2008) stated that historically in the U.S.A., females have demonstrated better reading skills than males. In Science and Math, studies before 1980, showed little difference between genders in primary school, but there was an advantage for males in junior high school and high school. Recent studies have shown that this gap has been reduced or has been inverted. Likewise, before the '80s, females' science academic performance was lower in Great Britain, but since the '90s, females have shown a better performance than males. Internationally, using the PISA tests in 41 countries, Ma (2008) found differences in reading performance favoring females in all countries except for Rumania. In math, small but significant gaps were found favoring males in 29 countries. While in science, small but significant differences were found in 19 countries, 14 favoring males and 5 favoring females. Stetsenko, Little, Gordeeva, Grasshof, and Oettingen (2000) studied students' performance from second through sixth grade

5
in 7 European, Asian and U.S.A. cities. In 5 of the 7 cities, females' academic performance was higher. This was mainly due to verbal advantages; however, math performance was quite similar for both genders.
Many theories have been used to explain: (1) Why the differences in language, math, and science? and (2) Why the gap in favor of females becomes more prominent as time passes? Concerning the first question, the biological explanation refers to the brain's lateralization, implying that women are biologically better in language and men in math. However, the changes observed through time do not seem to support that theory. From the sociological perspective, gender behavior is analyzed within the context of the household, the school, and the community. Gender stereotypes may reinforce the differences observed in these subject matters. Guiso, Monte, Sapienza and Zingales (2008) found that as societies become more equal and inclusive for women, the gap in favor of males in math is either reduced or eliminated, while the language gap in favor of females increases.
With respect to the second question, Burke (1989) established a relationship between self-identification with characteristics that are considered feminine or masculine, as defined by the students themselves, and academic performance. He found that regardless of the sex, identifying with "more feminine" characteristics was related to higher academic performance in sixth through eighth-grade students. The author argued that schools, particularly in primary schools and junior high school, were perceived as "feminine" institutions; thus, those students who identified themselves with feminine characteristics showed a better performance. Ma (2008) also argued that females respond better to learning environments due to schools' order and discipline. Along that line, Legewie and DiPrete (2012) argued that males were more prone to having a lower school performance than their female counterparts if they are in a school environment tending to ideas of masculinity that fostered anti-school attitudes and behaviors. On the other hand, an environment gear towards academics may eliminate the construction of confrontational masculinity and encourage academic competitiveness among males. They discovered that the gap tended to be smaller in schools with a higher socioeconomic level; hence, they postulated that the gap by gender was a matter of access to learning resources and educational quality. In this context, males could particularly benefit from school resources directed to a culture of learning.
The household structure has also been underlined as a determinant factor in academic performance for children and adolescents. There are two routes through which children of single parents may be affected. First, at the family level, single parents' households have fewer resources. For example, single parents have fewer financial resources than married parents; they are less inserted in the education process and their children's development; lastly, they have fewer social resources. We must also point out that in single-parent families, the burden of raising falls on one person reducing available guidance time. Furthermore, since single parents have an inferior socioeconomic status, they tend to live in more impoverished communities; hence, their children go to lower-quality schools. The concentration of single parents in a school means that the school will have an inferior socioeconomic status and less social capital. De Lange and Dronkers (2018) used data from PISA tests for 25 OECD countries to study what effect living with a single parent has on students' math scores. It also included the percentage of students in schools who came from single-parent families. Their results showed that students from single-parent families had lower performance levels after controlling for the students' sociodemographic and school variables; however, this effect disappeared after controlling for the household resource level. Therefore, they identified the lack of resources as the determinant factor.

6
Heuveline, Yang, and Timberlake (2010), in an international comparative study, also confirmed that there was a gap between children with single parents versus married parents. However, the authors acknowledged that families exist within a context of public policies that might have an effect on factors such as the cost of raising a child, for example. Higher expenditure levels in education and larger aids for parents were associated with smaller gaps.
Community factors
Pong and Hao (2007) summarized in four models the theoretical arguments related to the effect of neighborhood characteristics on children's school performance.
� The epidemic model predicts that peers' negative behavior could be spread through group pressure that tends to be greater among groups with antisocial conduct.
� The collective socialization model stresses the role of adults in the community who serve as role models, supervise minors, and give cohesion to the community. On this matter, Logan, Minca and Adar (2012) found that adults' educational attainment in a community has a larger impact than the family composition.
� The Relative deprivation model states that being at a disadvantage in relation to the rest of the school population could have a negative impact due to feeling relatively deprived. On the other hand, being in a school with a population with a better socioeconomic position may encourage competitive behavior and better performance among disadvantaged students.
� The institutional model stresses the importance of community institutions such as schools, the neighbors' organizations, or community services in educational performance.
In their study, Pong and Hao (2007) used the household census tract as the neighborhood unit. Some of the community variables considered important were the number of idle peers, the percentage of two-parent households, the percentage of households that moved within the last 5 years, and the proportion of immigrants with English deficiency. The percentage of the population with English deficiency negatively affected grade point averages, especially for the immigrant population. Likewise, Dustmann et al. (2012) concluded that the quality of the high school, the quality of peers, and the language spoken at home also impacted school performance.
Another critical aspect of the community environment is violence and crime. Caudillo and Torch (2014) used panel data in Mexico's case. Their study suggested that being exposed to violent events increased an elementary school student's probability of failing the grade. According to the authors, the link between both variables could occur through the effect of violence on an individual's fear and anxiety. Thus, violence stresses the intergenerational reproduction of poverty. In other words, students living in disadvantaged zones are more exposed to violence; hence, they are more prone to having their school performance affected and not achieving social mobility.
School factors
Acknowledging the effect that family and community background may have on students' performance must make us careful when analyzing a school's quality based solely on said performance. As Downey and Condron (2016) showed, the current accountability systems undervalued teachers' and directors' work in schools serving
7
disadvantaged students. In fact, Knight and Olofson (2018) found that schools and teachers' characteristics explained only 5% of the variation of students' performance in Math. Therefore, if the financing is done based on students' daily attendance, the more impoverished school districts would be unfairly penalized, thus increasing the system's inequality.
Based on the idea that it would be unfair to measure the quality of the school without taking into account the socioeconomic level of students, Toutkoushian and Curtis (2005) proposed to rank schools based on the concept of value-added. The authors used information from public schools in New Hampshire (NH) to research what percentage of the school performance variation could be explained through the variables related to the district's socioeconomic status where schools are located. They measured the school district's socioeconomic status through the unemployment rate, the percentage of adults who have at least a bachelor's degree, and the percentage of students who qualify for free or reduced-price lunch. The authors found that more than 50% of the student performance variation was explained through the three socioeconomic status regressors. They constructed a value-added indicator based on the difference between the observed students' performance versus the expected one according to the socioeconomic profile.
Toutkoushian and Curtis (2005) found that approximately 40% of the academic performance variation among schools cannot be explained through socioeconomic factors; hence, they tried to identify school factors impacting it. Although they found that the curriculum and educational quality may influence the performance, these factors explained very little of that 40%. This is also in agreement with Knight and Olofson's (2018) estimates mentioned at the beginning of this section.
An aspect that has received attention in the literature is the quality of the teachers. Schmitt (2013) predicted the percentage of students in 11th grade who would approve Science and Math exams in their first attempt using as the primary independent variable the quality of educators (operationalized as the number of years of experience). Their results showed a negative relationship between educational quality and teachers with more than 30 years of experience. Furthermore, the average salary of teachers was another significant factor in predicting the quality of teaching.
Hanushek and Rivking (2010) also stressed the importance of measuring the teachers' quality based on value-added. They argued that measuring the teachers' quality pursuant to students' performance without controlling their characteristics will penalize teachers with difficult groups. They proposed that teachers' contribution be measured through the value-added method, defined as the differential between the observed and the expected performance once the school characteristics, the peers' influence, the neighborhood's effects, and the family characteristics have been controlled.
Olofson and Knight (2018) measured the value-added for junior high schools and then performed a regression to determine the factors influencing said value-added. Greater quality of teachers (measured based on the experience and scores in certification exams) and fewer classes per day would increase the school's value-added. Mansfield (2015) confirmed previous research by finding evidence suggesting that if the teachers' quality is above average, it will positively impact students' school performance. However, he observed that only 1% of the performance variation among schools was explained through the differences in teachers' quality; although, it had a more noticeable effect on the students' performance variation within the same school. On the other hand, according to Mansfield (2015), teachers' experience did not seem to contribute to school performance variation.
8
The expenditure per student is another factor related to a school that is thought to impact students' academic performance. Häkkinen, Kirjavainen, and Uusitalo (2003) used a panel data model on Finland's municipalities to examine the impact of reducing students' school expenditure during the recession period between 1990 and 1998. Since municipalities in Finland are responsible for financing schools, the independent variable used to measure school expenditure was the total school expenditure by municipality divided by the number of students. The results suggested that education expenditure per student did not affect school performance. On the other hand, the family characteristics and previous students' performance were more critical determinant factors. However, the authors admitted that the results obtained did not imply that school expenditure had no impact on the performance since schools could have been reducing expenditures in other areas and activities without affecting the quality of teaching related to the subject matter central to the compulsory test.
In opposition to this, Condron and Roscigno (2003) found evidence suggesting that financing did affect the school performance as seen through the facilities' conditions and the degree of order and consistency of the school. Flaherty (2013) also concluded that the amount of financing available positively impacted academic performance. His results suggested that the districts whose expenditures in education increased at a more accelerated rhythm obtained more significant improvements in the percentage of students passing the standardized tests in Math and English. The positive relationship between expenditure per student and academic performance was stronger when considering poor, minority, or special education students.
Another factor associated with educational quality and the students' performance was the group size or the number of students per teacher. Empirically, this variable's effect has been difficult to measure since the school selection, and the students' performance could be simultaneously influenced by other factors. On the one hand, parents who are more interested in their children's performance may choose schools with smaller groups, which would cause that students with a higher probability of success would be overrepresented in these schools. On the other hand, school policies could assign students with more severe difficulties to smaller groups causing the opposite effect. Hoxby (2000) found that class size had little to no effect on students' academic performance once the bias is corrected.
However, Krueger (2003) stated that a pondered and critical analysis of the existing literature showed that smaller classes had a positive but moderate effect on academic performance, made evident by studies that adequately controlled possible bias. Among these, he mentioned the STAR project in Tennesse that randomly assigned students and teachers to groups of 12 or 22 students. Students assigned to smaller groups during elementary school still showed higher academic achievement in secondary school.
Likewise, Angrist and Lavy (1999) confirmed a negative relationship between group size and reading and math test results for fifth-grade students and reading tests for fourth-grade students. Poa and Hao (2007) also found that a poor school environment and school size, had a negative effect on grade point averages, especially for the immigrant population. Browning and Heinesen (2007), estimated that a reduction in the group size would increase the probability of completing post-secondary studies. The effect would be larger for socioeconomically disadvantaged students and males. In addition, Fredrikson, Ӧckert, y Oosterbeek (2013), in a longitudinal study, found that 10- and 13- years-old students attending smaller classes tended to have a better academic performance at 16-years-old and higher salaries as adults.

9
The school size may also affect the quality of teaching. It is being theorized that larger schools have a superior capacity to recruit better teachers, increase the diversity of the curriculum and specialized courses offer, and provide better facilities given the economies of scale. On the other hand, smaller schools tend to have better interpersonal relations, more participation in extracurricular activities, more opportunities to develop leadership, better attendance rate, more positive social behavior, and better school environment (Borland and Howsen, 2003; Cotton, 1996; Leithwood and Jantz, 2009; Gershenson and Langbein, 2015). Similar to the case of group size, different studies have tried to measure the effect of school size on academic performance by controlling the possible bias that may arise stemming from family influence in selecting schools or public policies related to the assignment of students to smaller schools.
In her literature review, Cotton (1996) concluded that students' academic performance was the same, in many cases better, in small schools. Small schools also had higher retention rates. In a literature review from 1990 onwards, Leithwood and Jantz (2009) reported similar results. The authors stated that although some works did not find a relation between the size of elementary school and academic performance, the majority (including those using the most robust methodology) found a negative effect. It means that the larger the school, the lesser the academic performance. In secondary school, the most robust studies favored mid-size to small schools. Likewise, they found that small schools favored student retention. It must be underlined that those studies focusing on disadvantaged student populations reported that these students benefited more from small schools.
According to a recent study on the impact of primary school size on student performance, the effect was not significant for the general population once the school's history is taken into consideration. However, there was evidence of a negative and significant effect of the school size on special education students and students under the poverty level (Gershenson & Langbein, 2015). Barrow, Claessens, and Whitmore Schanzenbach (2013) evaluated the Chicago initiative that significantly increased the number of small secondary schools between 2002 and 2006. The results showed that smaller schools increased the retention and graduation rates, but not the academic testing results. In brief, the empiric evidence favored smaller schools, particularly in addressing disadvantaged populations.
Finally, Chiang (2009) showed that motivating schools to establish educational reforms can improve students' academic performance. He compared the impact of sanction threats based on students' grades and the expenditure on teaching resources. The results suggested that attending a primary school threatened by sanctions increased students' scores in the state math test up to two years after enrolling in junior high school. However, as we discussed before, the imposition of sanctions without controlling the student population's socioeconomic composition may unfairly penalize schools and broaden inequality.
Description of the study
Comparisons and rankings are continuously done on schools based on their performance; however, external factors affecting these evaluations must be taken into consideration. To create effective school policies, it is important to try to identify what factors outside the schools' control are affecting students' academic performance as well as school aspects that may increase the schools' impact on the student. This impact is called the schools' value-added.

10
The analysis is divided into three parts. The first part measured the effect of external variables on academic performance, measured according to META test results and the school dropout rate. The second stage estimated the value-added of each school. The value-added was defined as the difference between each school's academic performance indicator's observed value and the expected value according to the student population's and community characteristics. It was calculated using the statistical regression analysis described below. The third stage evaluated how school variables impact the school value-added.
Data sources
Se conformó un panel de datos que incluye información de las escuelas en operaciones para los años académicos: 2016-17, 2017-18 y 2018-19. Los datos utilizados se desglosan a continuación.
� Data from the DE's student system were used to calculate: META test performance indicators, each school's gender composition, the percentage of students in special education, and the percentage of students under the poverty level.
� DE's classification was used to determine if the school was in a rural or urban area.
� Puerto Rico Community Survey five-year samples corresponding to 2016, 2017, and 2018 were used to obtain data referring to the census tract where the school is located. It included: the distribution of educational attainment for adults 25 years and older, the percentage of female-headed households, and the percentage of households with grandparents in charge of the minors.³ The information related to the number of households by income category in each census tract was used to estimate an approximation of the Gini coefficient that measures inequality in income distribution.
� The data on Type 1 crimes from the Puerto Rico Police Department was used to calculate the census tract's crime rate.
� The DE provided the data on school dropout.4
� The DE provided data on teachers' education and performance evaluations distribution by schools for the 2018-2019 school year.
Definition of the academic performance indicators
To analyze META test' performance, three educational levels were used: elementary, junior high school, and high school. At the elementary level, the META results included students from third through fifth-grade students. The junior high school results included students from seventh and eigth grade, and high school included eleventh grade.5 This delimitation was made to maximize the data consistency among schools to compare the same grades in all schools. For this reason, sixth-grade students were excluded since it is sometimes offered in
³ There are 243 schools that do not have a geographic location; therefore, those schools were excluded from this analysis.4 For the breakdown of attrition codes that the Department of Education considered within the category of school dropout, see the annual School Dropout Report available on their website and on the Puerto Rico’s Insitute of Statistics website. https://estadisticas.pr/en/inventario-de-estadisticas/reporte-de-desercion-escolar-en-puerto-rico5 The META tests for Spanish, English and Math are taken by students from third grade through eith grade plus eleventh grade.

11
elementary schools and others in middle schools. Spanish, Math, and English were the subject matters used. Despite some preliminary analysis of the results per subject matter, the analysis introduced here included a global performance indicator (GPI) averaging the three subject matters.
META tests evaluate each student's mastering level of the corresponding subject matter. The levels used are pre-basic, basic, proficient, and advanced. For our analysis, it was necessary to transform those categories into a numeric variable. To create the global performance indicator, we started by creating an indicator per subject matter and school level, pondering the percentage of students that obtained a pre-basic, basic, proficient, or advanced score. Then, the indicators of the three subject matters were average to obtain the global performance indicator (GPI). Next, we will detail the steps for the preparation of the GPI.
Step 1: The percentage of students who received a pre-basic, basic, proficient, or advanced score in each school for each of the three subject matters and the three school levels was calculated.
Step 2: An indicator per subject matter and educational levels (for all levels offered at the school) is estimated as a weighted average of the percentage of students who received each of the four possible scores. The indicator is constructed multiplying by 4 the proportion of students that obtained an advanced score, by 3 the proportion that obtained a proficient score, by 2 the proportion that obtained a basic score, and by 1 the proportion that obtained a pre-basic score, as in the following formula:
(I) stands for the indicator per subject matter and level, the subscript n refers to the level (elementary, junior high school, high school), the subscript a refers to the subject matter (Spanish, English or Math) and the subscripts it refer to the school i in year t.
Step 3: To obtain the global performance indicator (GPI) for each school and educational level, the three subject matter indicators' arithmetic mean was calculated.6 In other words,
This indicator is used as a dependent variable in the regressions that measure external variables' effects on academic performance. Therefore, separate analyses were performed for elementary school, junior high school, and high school levels. If less than 5 students took any of the tests per school, the observation was eliminated.7 There were 743 schools with a GPI corresponding to the elementary school level, 405 for the junior high school,
𝐼𝐼!"#$ = 4 ∗ 𝑝𝑝𝑝𝑝𝑝𝑝𝑝𝑝𝑝𝑝𝑝𝑝𝑝𝑝𝑝𝑝𝑝𝑝𝑝𝑝𝑝𝑝𝑜𝑜𝑎𝑎𝑎𝑎𝑎𝑎𝑎𝑎𝑝𝑝𝑎𝑎𝑎𝑎𝑎𝑎𝑠𝑠𝑝𝑝𝑠𝑠𝑎𝑎𝑎𝑎𝑝𝑝𝑝𝑝𝑠𝑠!"#$
+3 ∗ 𝑝𝑝𝑝𝑝𝑝𝑝𝑝𝑝𝑝𝑝𝑝𝑝𝑝𝑝𝑝𝑝𝑝𝑝𝑝𝑝𝑝𝑝𝑜𝑜𝑝𝑝𝑝𝑝𝑝𝑝𝑜𝑜𝑝𝑝𝑎𝑎𝑝𝑝𝑎𝑎𝑝𝑝𝑝𝑝𝑠𝑠𝑝𝑝𝑠𝑠𝑎𝑎𝑎𝑎𝑝𝑝𝑝𝑝𝑠𝑠!"#$
+2 ∗ 𝑝𝑝𝑝𝑝𝑝𝑝𝑝𝑝𝑝𝑝𝑝𝑝𝑝𝑝𝑝𝑝𝑝𝑝𝑝𝑝𝑝𝑝𝑜𝑜𝑏𝑏𝑎𝑎𝑠𝑠𝑝𝑝𝑎𝑎𝑠𝑠𝑝𝑝𝑠𝑠𝑎𝑎𝑎𝑎𝑝𝑝𝑝𝑝𝑠𝑠!"#$
+1 ∗ 𝑝𝑝𝑝𝑝𝑝𝑝𝑝𝑝𝑝𝑝𝑝𝑝𝑝𝑝𝑝𝑝𝑝𝑝𝑝𝑝𝑝𝑝𝑜𝑜𝑝𝑝𝑝𝑝𝑎𝑎 − 𝑏𝑏𝑎𝑎𝑠𝑠𝑝𝑝𝑎𝑎𝑠𝑠𝑝𝑝𝑠𝑠𝑎𝑎𝑎𝑎𝑝𝑝𝑝𝑝𝑠𝑠!"#$
𝐼𝐼𝐼𝐼𝐼𝐼$%& =∑ 𝐼𝐼$)%&*)+,
3
6 Sample analysis were also performed using the geometric median obtaining similar results.7 As part of a sensitivity analysis, we also estimated models including all cases and limiting to schools with ten results or more. No substantial changes were observed in the results.

12
and 215 at the high school level, for at least one of the three years. This led to a total of 1,952 elementary school, 1,084 junior high school, and 604 high school observations for the three years.8
Limitations:
One of the limitations of the study relates to the capacity of measuring school performance with standardized tests such as META. However, it is the broader academic performance measure available. The data bank also contained information on grades at the school level, but they could not be compared since it included the teachers' judgment element. Besides, we did not have them available per grade.
There were also limitations related to the quality of the data. Concerning community variables, the ideal situation would have been to have information on the school community. However, the socioeconomic profile did not include information about the family composition or parents' education. When referring to the PRCS census tract, we must keep in mind that it does not necessarily reflect the school community's composition since the students' place of residence may be out of the school census tract. Likewise, near the school area, some households could have chosen to send students to private schools. Furthermore, being small geographic units, the data may have a considerable margin of error.
Likewise, the inconsistencies between the schools' socioeconomic and META tests' results databases also forced us to reduce the number of units considered to maximize the consistency of the data. Part of the discrepancies was due to the information being collected in two different moments, one at the beginning of the year and the other at the end. Besides, some schools did not specify the grade in the students' sociodemographic data file. Hurricane Maria may have also affected the data interpretation since there was a considerable student exodus from the public system, either to the private sector or outside of Puerto Rico.
The lack of schools' budgetary data limited the value-added analysis since it was still not available when this report was prepared. Furthermore, the literature review showed that the estimates based on school size and the number of students per teacher might introduce bias problems. Given the fact that most of the segregation in Puerto Rico occurs between public and private schools, it would be expected that the bias would be less when compared among public schools. Besides, the parents' selection is reduced due to the centralized system. However, a more extensive school data set would allow taking into consideration the possible existence of these biases as part of the empirical assessment.
Analysis of the effect of socioedemographic and community factors on academic performance
Figure 1 introduces the GPI calculated for each educational level for the three years included in the data. As observed, the value-added for elementary schools was consistently higher for the three years.
8 This only includes observations with information for all the independent variables. In total, there were 2,169 observations with GPI in elementary school, 1,281 with results in junior high school, and 716 in high school. However, 203 elementary school, 58 junior high school, and 716 high school observations were eliminated since their location was not available. In addition, there were 14 observations in elementary school, 139 in junior high school and 93 in high school that did not have socioeconomic information for the corresponding level of the test, since the socioeconomic data file for theses schools did not specify students’ grade.

13
4�5
3�04�14�1 3�9
6�7
0�01�02�03�04�05�06�07�08�0
2016-2017 2017-2018 2018-2019
Junior High Schools High Schools
Figure 2. Dropout rate per type of school and school year
2�73 2�74 2�66
2�21 2�20 2�152�25 2�26 2�27
0�00
0�50
1�00
1�50
2�00
2�50
3�00
2016-17 2017-18 2018-19Elementary Junior High School High School
Figure 1. GPI per education level and school year
Figure 1GPI per education level and school year
Another alternate performance measurement is the percentage of school dropouts per school that, for purposes of this work, we will call the dropout rate. This analysis focused on schools that reported META results for junior high school and high school since the dropout rates tend to be low in elementary school. The dropout behavior may vary considerably according to the school level, but the dropout data were encompassed for the entire school. Therefore, this analysis was performed for two sub-groups of schools: those that only reported META results at the junior high level and those that only reported META results for high school students. This is done to use schools that only offered junior high school or high school education. Figure 2 introduces the average dropout rate per school type and school year. A stark increase in the high school average dropout rate during the last year can be observed.
Figure 2Dropout rate per type of school and school year
This first stage's analysis's fundamental question is: How much do sociodemographic and community factors influence a school's academic performance? To measure the effect of external variables on the school environment with respect to students' performance, an econometric regression analysis was used, including the

14
% of females
% in special education
% under the poverty level
Adults with school diploma only
Female headed households
Households with grandparents and grandchildren
Crime rate
Gini coefficient
48�74
31�99
82�29
29�42
24�21
2�61
2�28
0�47
6�22
8�98
9�47
7�12
8�10
1�96
2�69
0�05
49�16
29�43
78�03
29�44
23�73
2�45
2�58
0�47
7�28
9�85
12�04
7�19
8�16
2�00
3�39
0�05
52�12
22�17
71�89
28�52
24�10
2�45
3�03
0�47
8�71
10�29
14�63
8�06
7�91
1�90
3�29
0�05
variables: AverageStandard Deviation
Standard DeviationAverage
Standard DeviationAverage
Table 1. Descriptive Statistics for Independent Variables
High schoolElementary School Junior high school
three years of data available. Including the three years in a data panel allowed us to use the variation among schools and the interannual variation to measure the effects of different independent variables on the school's academic performance.
The dependent variables are the GPI by educational level and the dropout rate by type of school. The first group of estimates included the sociodemographic variables obtained from the school profile. These were: the percentage of the student population living in households under the poverty level, the percentage of students participating in the special education program, and the proportion of female students.9 These sociodemographic variables were estimated separately, taking into account the population corresponding to the grades included in the calculation of the GPI for each level. For example, in the regressions using GPI in elementary schools, these percentages were estimated according to the student population composition between third and fifth grade. Originally, the percentage of non-Puerto Rican students was included, but this variable was not significant in any of the estimates.
The second group of estimates also included the variables corresponding to the census tract where the school is located. Some of these were: the percentage of adults' by educational attainment, the percent of female-headed households, the percentage of grandparents in charge of their grandchildren, the crime rate, and the Gini coefficient. Dichotomous variables were also included to measure the effects related to the year the data was observed.10 Appendix A include a detailed description of the analysis method. Table 1 presents the descriptive statistics for the explanatory variables used in the analysis.
9 This variable is included since the empiric evidence has shown that females tend to have a better performance, particularly in the language area, thus, a high percentage of females may increase the average performance in the school. 10 These are only reported in the regressions where the effects of the years turned out to be significant.

15
Results of the analysis related to the GPI
Tables 2-4 summarizes the regressions' results measuring the effects of sociodemographic and community variables for each level, respectively (elementary school, junior high school, high school) on the GPI.11 The first column of each table introduces the estimated model with the sociodemographic variables, and on the second column, the community variables were added. The upper part of the table shows the number of observations and the number of different schools included in each regression. The R-squared also includes measuring the percentage of the variation in the dependent variable explained by the independent variables. For each variable, the regression estimated coefficient and its p-value are included. An effect is considered significant if the p-value is underneath .05 and marginally significant if underneath 0.10. The last four regressions introduced the results obtained when schools are divided according to whether they are located in rural or urban areas.
There are various results we would like to underline. First, the sociodemographic variables seemed to be a lot more relevant for junior high school and high school students. The independent variables included explained only 5% of the GPI variation at the elementary school level; however, they explained 35% and 62% of the variation at junior high school and high school levels, respectively. Besides, these variables were more relevant in urban areas. Elementary schools and junior high schools in rural areas have significantly higher indicators than their counterparts in the urban areas, an effect estimated to be between 3% and 4% of the average value.12 The percentage of students under the poverty level has a negative effect on the GPI for all levels and all areas. An increase of one standard deviation in that variable would cause a reduction of approximately 3% on the average value of the GPI for elementary school, 7% for junior high school, and 8% for high school. Furthermore, to prove this variable's explanatory power, regressions were estimated using only the percentage of students under poverty as an independent variable. This variable explained 32% of the variation observed on the GPI in junior high school and 56% in high school. In urban areas, the effect of the percentage of students under the poverty level on the GPI in junior high schools almost doubled the effect found for the general sample. At the high school level, a positive effect due to female students' presence was also observed.
It must also be noticed that the percentage of students in special education was not an important determinant of academic performance in elementary schools. However, it had an adverse effect in junior high school and high school, showing an incremental effect as the level rose. For elementary school and high school, the year the school was observed did not have an effect on the GPI. Thus, the results introduced in the table did not include the dichotomous variable for each year. However, in the case of junior high schools, it was included since the dichotomous variable to identify observations from 2018-2019 consistently had a negative and significant effect. According to the estimates, the GPI in junior high school lost between 3 and 4% of its average value on that last year compared to 2016-2017. This was precisely the school year after Hurricane Maria hit Puerto Rico and the year when a massive school closing process was concluded. However, why that effect was not significant to explain the variations observed on the GPI in elementary school and high school has called our attention.
When adding the community variables, the effects of the sociodemographic variables remained. In general, the census variables added little to the explanatory power of the model. This may be due to the limitations on
11 The schools excluded due to lack of information on their geographic location are mostly the ones that closed before school year 2017-2018 started. On average, these had a larger academic performance than the closed schools in elementary school and junior high school. However, when included in the regressions omitting the census tract variables, the results did not suffer substantial changes.12 This effect is estimated dividing the coefficient of the variable identifying the schools located in the rural areas by the GPI average value.

16
the precision of the data discussed before or reflects that students lived in communities that were not in the school's census tract. In the elementary school GPI case, the percentage of adults with a high school diploma (HS) had a positive effect, as expected. However, it was not the case for other levels of educational attainment. In other models, the percentage of adults with an associate's degree or a bachelor's degree was also included, but it was not significant for any school levels. A possible explanation is that for public schools' communities, high school education is more relevant.13 The positive effect of the Gini coefficient on the elementary school GPI was also surprising. It is not clear how higher inequality contributes to higher performance. However, the effect could occur due to a broader diversity in the community, which could lead to more heterogeneity of the school population.14 Another possible explanation is that in elementary schools, the Gini negatively correlated with the percentage of students under poverty. This could imply that it is a more diverse school population in socioeconomic terms. It could also be explained through the positive effect of relative deprivation as stated by Pong and Hao (2007).
In rural areas, the family composition turned out to be more relevant. The percentage of households having grandparents in charge of their grandchildren had a negative and marginally significant effect on junior high school performance in rural areas. The proliferation of this type of household is a growing phenomenon. These are considered vulnerable households since they usually result from negative situations impeding parents to take care of their children; besides, they are subject to financial stress. Likewise, female-headed households had a negative effect on performance in high school in rural areas. Type 1 crimes had a negative and significant effect on performance in high schools in urban areas. This had the expected effect given that, on average, the crime rate around urban schools is more than double that around schools in rural areas. We must also add the susceptibility of high school youngsters to social factors. In conclusion, based on these results, it is imperative to address the crime problem in urban areas to facilitate youngsters' academic performance.
13 Due to the income segregation between private and public schools.14 See Luciano (2020) in this report to see the explanation of the effect of a broader heterogeneity on the school population.
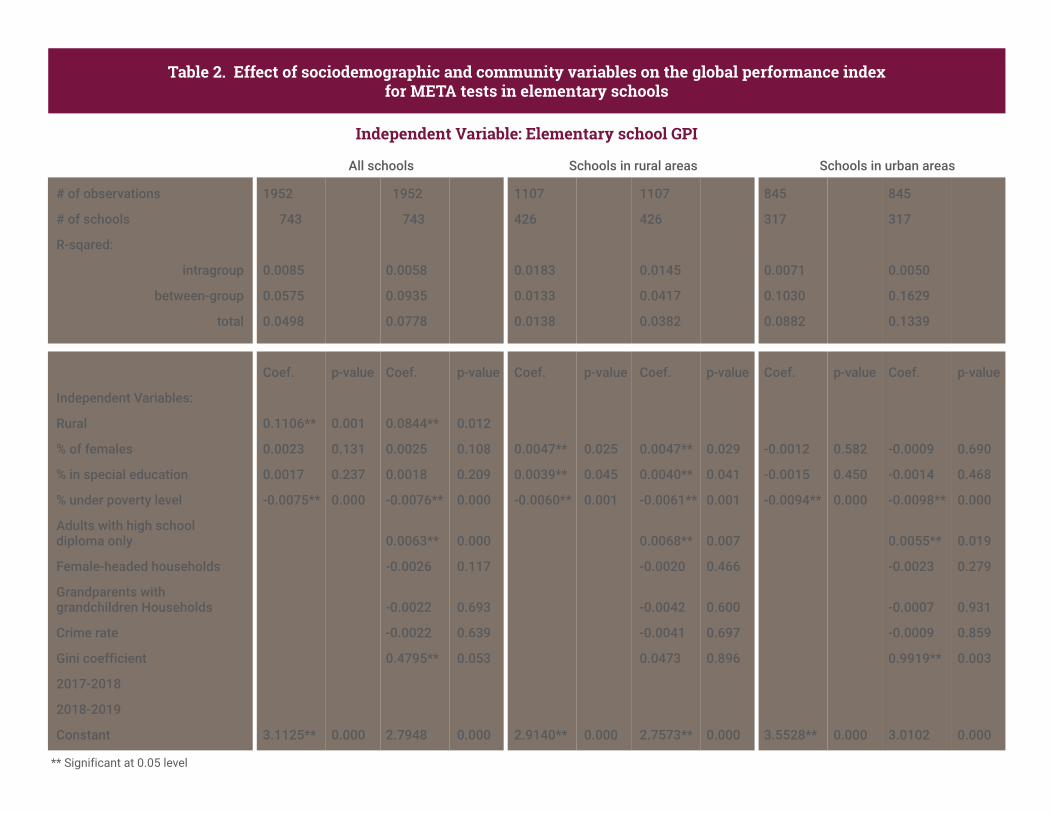
Table 2. Effect of sociodemographic and community variables on the global performance index for META tests in elementary schools
Independent Variable: Elementary school GPI
# of observations
# of schools
R-sqared:
intragroup
between-group
total
Independent Variables:
Rural
% of females
% in special education
% under poverty level
Adults with high school diploma only
Female-headed households
Grandparents with grandchildren Households
Crime rate
Gini coefficient
2017-2018
2018-2019
Constant
1952
743
0�0085
0�0575
0�0498
Coef�
0�1106**
0�0023
0�0017
-0�0075**
3�1125**
p-value
0�001
0�131
0�237
0�000
0�000
1952
743
0�0058
0�0935
0�0778
Coef�
0�0844**
0�0025
0�0018
-0�0076**
0�0063**
-0�0026
-0�0022
-0�0022
0�4795**
2�7948
p-value
0�012
0�108
0�209
0�000
0�000
0�117
0�693
0�639
0�053
0�000
1107
426
0�0183
0�0133
0�0138
Coef�
0�0047**
0�0039**
-0�0060**
2�9140**
p-value
0�025
0�045
0�001
0�000
1107
426
0�0145
0�0417
0�0382
Coef�
0�0047**
0�0040**
-0�0061**
0�0068**
-0�0020
-0�0042
-0�0041
0�0473
2�7573**
p-value
0�029
0�041
0�001
0�007
0�466
0�600
0�697
0�896
0�000
845
317
0�0071
0�1030
0�0882
Coef�
-0�0012
-0�0015
-0�0094**
3�5528**
p-value
0�582
0�450
0�000
0�000
845
317
0�0050
0�1629
0�1339
Coef�
-0�0009
-0�0014
-0�0098**
0�0055**
-0�0023
-0�0007
-0�0009
0�9919**
3�0102
p-value
0�690
0�468
0�000
0�019
0�279
0�931
0�859
0�003
0�000
** Significant at 0.05 level
All schools Schools in rural areas Schools in urban areas
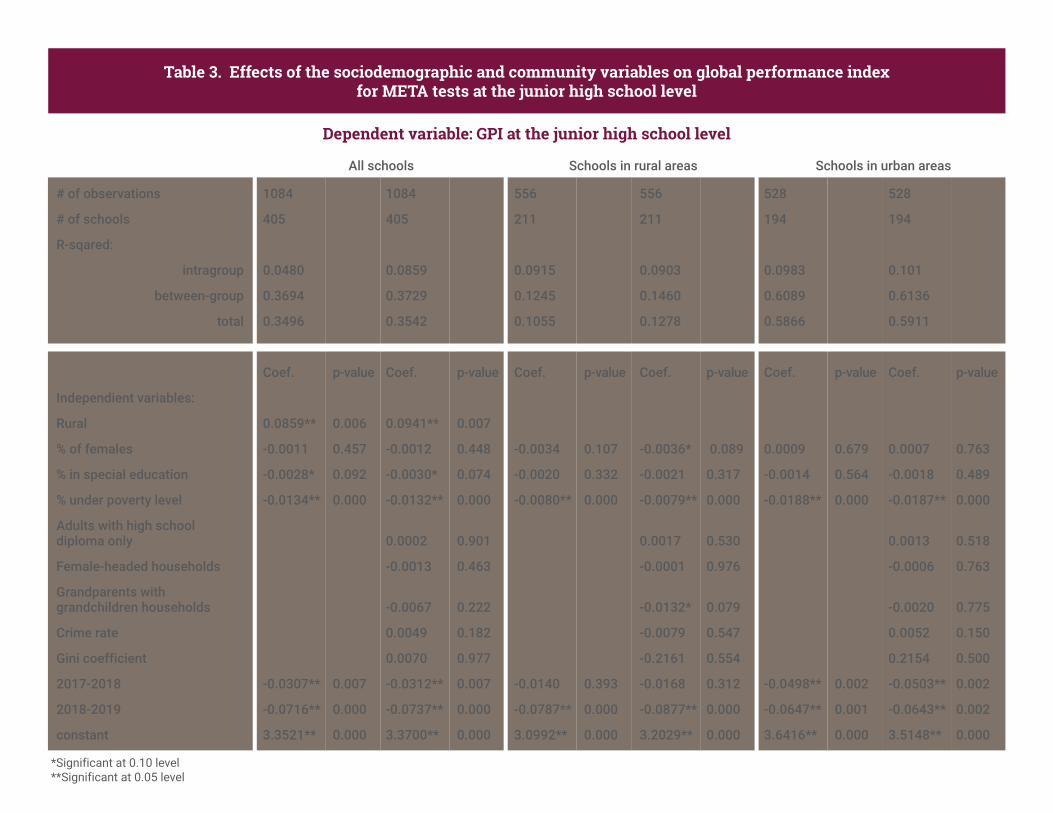
Table 3. Effects of the sociodemographic and community variables on global performance index for META tests at the junior high school level
Dependent variable: GPI at the junior high school level
# of observations
# of schools
R-sqared:
intragroup
between-group
total
Independient variables:
Rural
% of females
% in special education
% under poverty level
Adults with high schooldiploma only
Female-headed households
Grandparents withgrandchildren households
Crime rate
Gini coefficient
2017-2018
2018-2019
constant
1084
405
0�0480
0�3694
0�3496
Coef�
0�0859**
-0�0011
-0�0028*
-0�0134**
-0�0307**
-0�0716**
3�3521**
p-value
0�006
0�457
0�092
0�000
0�007
0�000
0�000
1084
405
0�0859
0�3729
0�3542
Coef�
0�0941**
-0�0012
-0�0030*
-0�0132**
0�0002
-0�0013
-0�0067
0�0049
0�0070
-0�0312**
-0�0737**
3�3700**
p-value
0�007
0�448
0�074
0�000
0�901
0�463
0�222
0�182
0�977
0�007
0�000
0�000
556
211
0�0915
0�1245
0�1055
Coef�
-0�0034
-0�0020
-0�0080**
-0�0140
-0�0787**
3�0992**
p-value
0�107
0�332
0�000
0�393
0�000
0�000
556
211
0�0903
0�1460
0�1278
Coef�
-0�0036*
-0�0021
-0�0079**
0�0017
-0�0001
-0�0132*
-0�0079
-0�2161
-0�0168
-0�0877**
3�2029**
p-value
0�089
0�317
0�000
0�530
0�976
0�079
0�547
0�554
0�312
0�000
0�000
528
194
0�0983
0�6089
0�5866
Coef�
0�0009
-0�0014
-0�0188**
-0�0498**
-0�0647**
3�6416**
p-value
0�679
0�564
0�000
0�002
0�001
0�000
528
194
0�101
0�6136
0�5911
Coef�
0�0007
-0�0018
-0�0187**
0�0013
-0�0006
-0�0020
0�0052
0�2154
-0�0503**
-0�0643**
3�5148**
p-value
0�763
0�489
0�000
0�518
0�763
0�775
0�150
0�500
0�002
0�002
0�000
*Significant at 0.10 level**Significant at 0.05 level
All schools Schools in rural areas Schools in urban areas

Table 4. Effect of the sociodemographic and community variables on the global performance index for META tests in high school
Dependent variables: GPI in high school
# of observations
# of schools
R-squared:
intragroup
between-group
total
Independent variables:
Rural
% of females
% in special education
% under poverty level
Adults with high schooldiploma only
Female-headed households
Grandparents withgrandchildren households
Crime rate
Gini coefficient
2017-2018
2018-2019
constant
604
215
0�0447
0�6862
0�6213
Coef�
-0�0284
0�0025*
-0�0091**
-0�0121**
3�2098**
p-value
0�500
0�068
0�000
0�000
0�000
604
215
0�0449
0�6958
0�6325
Coef�
-0�0499
0�0024*
-0�0091**
-0�0121**
0�0018
-0�0035
-0�0057
-0�0056
0�2017
3�1811**
p-value
0�255
0�078
0�000
0�000
0�383
0�112
0�422
0�149
0�484
0�000
155
59
0�0185
0�7028
0�5969
Coef�
0�0019
-0�0075**
-0�0096**
2�9832**
p-value
0�488
0�001
0�005
0�000
155
59
0�0302
0�6625
0�5899
Coef�
0�0017
-0�0077**
-0�0091**
0�0053
-0�0082*
-0�0128
0�0107
-0�5899
3�2816**
p-value
0�505
0�000
0�006
0�202
0�078
0�318
0�635
0�317
0�000
449
156
0�0601
0�6802
0�6333
Coef�
0�0024
-0�0101**
-0�0132**
3�3087**
p-value
0�115
0�000
0�000
0�000
449
156
0�0677
0�6814
0�6391
Coef�
0�0023
-0�0102**
-0�0131**
0�0007
-0�0016
-0�0068
-0�0068*
0�5270
3�1218**
p-value
0�139
0�000
0�000
0�768
0�547
0�423
0�079
0�113
0�000
*Significant at 0.10 level**Significant at 0.05 level
All schools Schools in rural areas Schools in urban areas

20
Summary: Effects of the sociodemographic and community variables on schools' GPI.
� The sociodemographic variables explain 5% of the GPI variation in elementary schools, 35% in junior high schools, and 62% in high schools.
� The most important variable explaining the GPI differences among schools is the percentage of students under the poverty level.
▼ An increase of one standard deviation in the poverty percentage reduced the GPI by 7% in junior high schools and 8% in high schools.
� The percentage of students participating in special education reduced the GPI in junior high schools and high schools, but not in elementary schools.
� Elementary and junior high schools in rural areas had higher performance indexes than their counterparts in urban areas.
� Community variables (from the census tract) had little explanatory power for the GPI variation among schools.
▼ In elementary schools, the percentage of adults with only a high school diploma and the Gini coefficient had a positive effect on the GPI.
▼ In rural zones, the family composition seemed more relevant to explain the GPI differences for junior high schools and high schools.
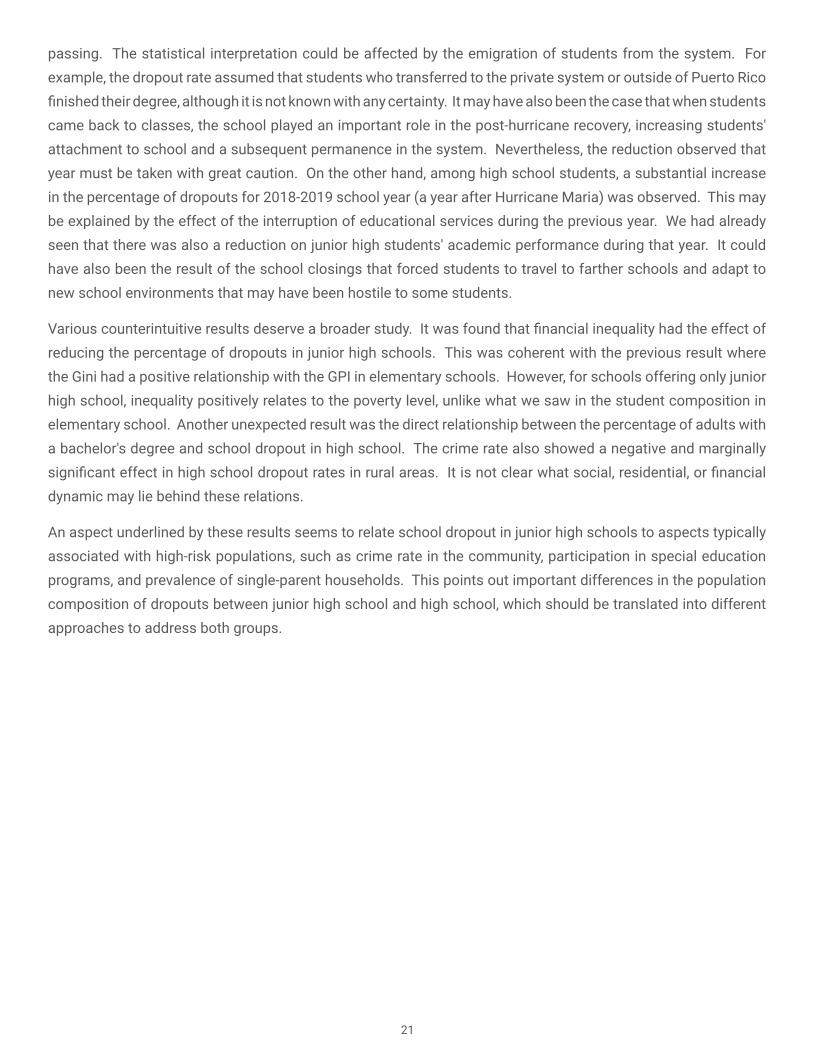
Results of the analysis relate to dropout rates.
Tables 5 and 6 introduce the regression results using as the dependent variable the dropout rate for junior high schools and high schools. Observing the R-squared, we see that the explanatory power of the sociodemographic variables with respect to the variations in the percentage of dropouts was less than the capacity they had to explain the GPI variations. The percentage of students under poverty significantly increased the high school dropout rate, especially in urban areas where a one standard deviation increase in poverty increased the dropout rate by 23%. The percentage of females was only significant in reducing the percentage of dropouts in rural areas high schools.15
The percentage of students participating in the special education program is an important determinant of school dropout in junior high school, while its effect was not significant in high schools. This shows that junior high school is a crucial point in the continuity of education for special education students. The percentage of female-headed households and the crime rate increased the dropout rate in junior high schools.
Changes through time are quite different, depending on the school level. Junior high schools showed significant reductions in the percentage of dropouts during 2017-2018 school year, which coincided with Hurricane Maria's
15 Literature tells us that the dropout rate among females is lower than among males. Cordero-Guzman’s study in this report provided evidence on this matter for the case of Puerto Rico. A larger percent of females could lead to lesser dropout, but on the other hand, a larger male dropout raises the percentage of females in school. This dual causality could explain why in most analyses the percentage of females turned out to be not significant.
21
passing. The statistical interpretation could be affected by the emigration of students from the system. For example, the dropout rate assumed that students who transferred to the private system or outside of Puerto Rico finished their degree, although it is not known with any certainty. It may have also been the case that when students came back to classes, the school played an important role in the post-hurricane recovery, increasing students' attachment to school and a subsequent permanence in the system. Nevertheless, the reduction observed that year must be taken with great caution. On the other hand, among high school students, a substantial increase in the percentage of dropouts for 2018-2019 school year (a year after Hurricane Maria) was observed. This may be explained by the effect of the interruption of educational services during the previous year. We had already seen that there was also a reduction on junior high students' academic performance during that year. It could have also been the result of the school closings that forced students to travel to farther schools and adapt to new school environments that may have been hostile to some students.
Various counterintuitive results deserve a broader study. It was found that financial inequality had the effect of reducing the percentage of dropouts in junior high schools. This was coherent with the previous result where the Gini had a positive relationship with the GPI in elementary schools. However, for schools offering only junior high school, inequality positively relates to the poverty level, unlike what we saw in the student composition in elementary school. Another unexpected result was the direct relationship between the percentage of adults with a bachelor's degree and school dropout in high school. The crime rate also showed a negative and marginally significant effect in high school dropout rates in rural areas. It is not clear what social, residential, or financial dynamic may lie behind these relations.
An aspect underlined by these results seems to relate school dropout in junior high schools to aspects typically associated with high-risk populations, such as crime rate in the community, participation in special education programs, and prevalence of single-parent households. This points out important differences in the population composition of dropouts between junior high school and high school, which should be translated into different approaches to address both groups.
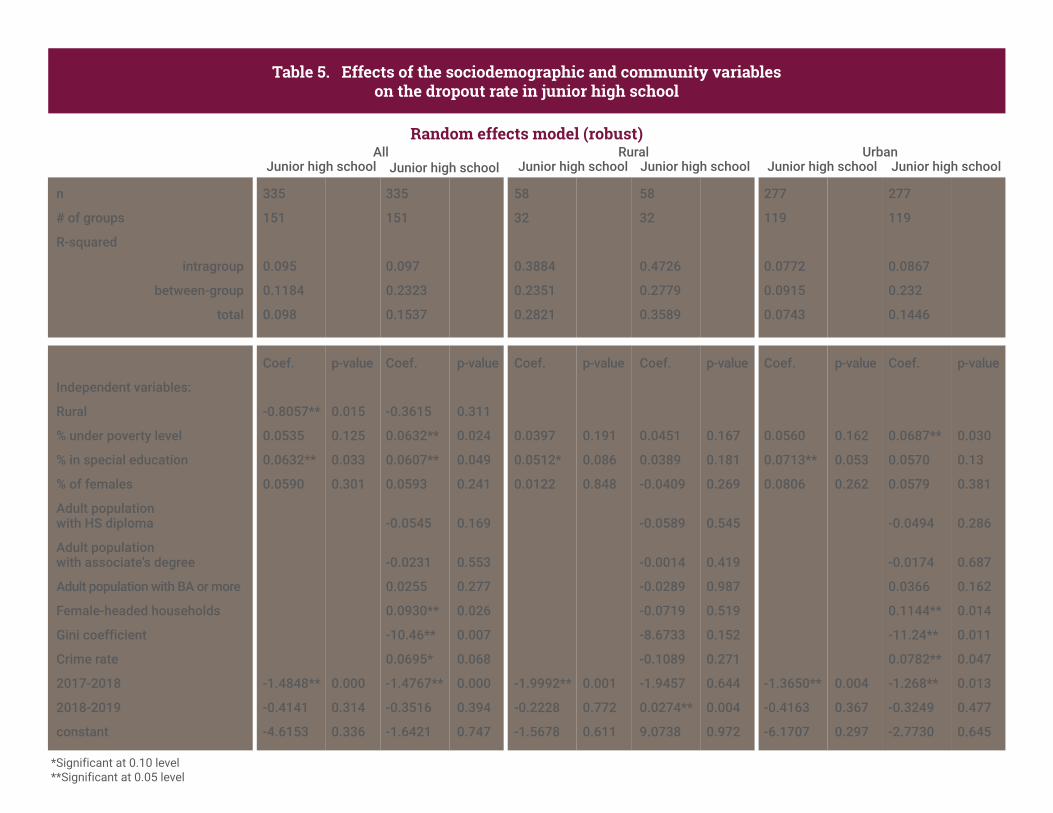
Table 5. Effects of the sociodemographic and community variableson the dropout rate in junior high school
Random effects model (robust)
n
# of groups
R-squared
intragroup
between-group
total
Independent variables:
Rural
% under poverty level
% in special education
% of females
Adult populationwith HS diploma
Adult populationwith associate's degree
Adult population with BA or more
Female-headed households
Gini coefficient
Crime rate
2017-2018
2018-2019
constant
335
151
0�095
0�1184
0�098
Coef�
-0�8057**
0�0535
0�0632**
0�0590
-1�4848**
-0�4141
-4�6153
p-value
0�015
0�125
0�033
0�301
0�000
0�314
0�336
335
151
0�097
0�2323
0�1537
Coef�
-0�3615
0�0632**
0�0607**
0�0593
-0�0545
-0�0231
0�0255
0�0930**
-10�46**
0�0695*
-1�4767**
-0�3516
-1�6421
p-value
0�311
0�024
0�049
0�241
0�169
0�553
0�277
0�026
0�007
0�068
0�000
0�394
0�747
58
32
0�3884
0�2351
0�2821
Coef�
0�0397
0�0512*
0�0122
-1�9992**
-0�2228
-1�5678
p-value
0�191
0�086
0�848
0�001
0�772
0�611
58
32
0�4726
0�2779
0�3589
Coef�
0�0451
0�0389
-0�0409
-0�0589
-0�0014
-0�0289
-0�0719
-8�6733
-0�1089
-1�9457
0�0274**
9�0738
p-value
0�167
0�181
0�269
0�545
0�419
0�987
0�519
0�152
0�271
0�644
0�004
0�972
277
119
0�0772
0�0915
0�0743
Coef�
0�0560
0�0713**
0�0806
-1�3650**
-0�4163
-6�1707
p-value
0�162
0�053
0�262
0�004
0�367
0�297
277
119
0�0867
0�232
0�1446
Coef�
0�0687**
0�0570
0�0579
-0�0494
-0�0174
0�0366
0�1144**
-11�24**
0�0782**
-1�268**
-0�3249
-2�7730
p-value
0�030
0�13
0�381
0�286
0�687
0�162
0�014
0�011
0�047
0�013
0�477
0�645
*Significant at 0.10 level**Significant at 0.05 level
AllJunior high school Junior high school Junior high school Junior high school Junior high school Junior high school
Rural Urban

Table 6. Effect of the sociodemographic and community variableson dropout rate in high schools
Random effects model (robust)
n
# of groups
R-squared
intragroup
between-group
total
Independent variables:
Rural
% under poverty level
% in special education
% of females
Adult population with HS diploma
Adult population withassociate's degree
Adult population with BA or more
Female-headed households
Gini coefficient
Crime rate
2017-2018
2018-2019
Constant
470
166
0�326
0�275
0�2856
Coef�
-1�4478**
0�0968**
0�0460
0�0167
-0�0175
2�5544**
-4�8396**
p-value
0�001
0�000
0�128
0�508
0�934
0�000
0�008
470
166
0�3225
0�3231
0�3099
Coef�
-1�1701**
0�1006**
0�0350
0�0053
0�0471
0�0312
0�0489**
0�0411
2�5796
0�0326
-0�0377
2�5186**
-9�869**
p-value
0�013
0�000
0�285
0�837
0�171
0�391
0�028
0�111
0�459
0�573
0�859
0�000
0�001
106
38
0�3341
0�0868
0�151
Coef�
0�0193
0�0638
-0�1541**
-0�7485*
1�0176**
8�399*
p-value
0�576
0�230
0�028
0�096
0�011
0�070
106
38
Coef�
0�0142
0�0575
-0�1533**
-0�0163
-0�0099
0�0196
0�0758
9�2188
-0�4421*
-1�0104**
0�9697**
3�6808
p-value
0�739
0�286
0�049
0�833
0�898
0�678
0�177
0�145
0�076
0�042
0�015
0�582
364
128
0�3533
0�2722
0�2898
Coef�
0�1242**
0�0432
0�0305
0�1449
2�9255**
-7�7117**
p-value
0�000
0�135
0�177
0�632
0�000
0�000
364
128
0�3459
0�3464
0�3263
Coef�
0�1297**
0�0332
0�0140
0�0593*
0�0415
0�0572**
0�0468*
-0�6501
0�0756
0�1515
2�9080**
-12�197**
p-value
0�000
0�364
0�577
0�101
0�297
0�026
0�089
0�876
0�207
0�526
0�000
0�000
*Significant at 0.10 level**Significant at 0.05 level
AllHigh school High school High school High school High school High school
Rural Urban
24
Summary: Effects of sociodemographic and community variables on dropout rate in junior high schools and high schools
� In junior high schools ▼ The percentage of students participating in the special education program is an important determinant of school dropout.
▼ The crime rate is associated with higher school dropout. ▼ Income inequality is associated with less school dropout.
� In high schools ▼ The dropout rate significantly increased in the 2018-2019 school year. ▼ Poverty is related to higher dropout rates, particularly in urban areas. ▼ Adults' educational attainment in the community is directly associated with school dropout, which raises questions on the students' residential dynamics.
� In both cases, the percentage of female-headed households in the community is related to higher school dropout in urban areas.
Evaluation of the value-added per school
Estimate of value-added
In this second stage, we used the result of the regressions related to the global performance index of school to calculate the value-added. It was estimated as the difference between the expected value according
to the regression and the observed value. The value-added was calculated for each observation, in other words, for each school in each one of the three periods.
where, is the expected value according to the regression.16
Table 7 introduces the average value-added per school level and their standard deviation. We observed that the standard deviation is larger for elementary schools. This was expected since we already saw that socioeconomic variables explained less of the elementary school GPI's observed variation. Thus, we expected that most of the difference in students' META performance could be attributed to the school. It must then be considered that school policies implemented in primary schools will have a larger impact. Appendix B includes the list of schools ordered according to their value-added for each educational level.
𝑉𝑉𝑉𝑉#$% = 𝐼𝐼𝐼𝐼𝐼𝐼#$% − 𝐼𝐼𝐼𝐼𝐼𝐼#+%,
donde, 𝐼𝐼𝐼𝐼𝐼𝐼)*+, e
donde, 𝐼𝐼𝐼𝐼𝐼𝐼)*+, e
16 The second regression shown in Tables 2 to 4 was used.
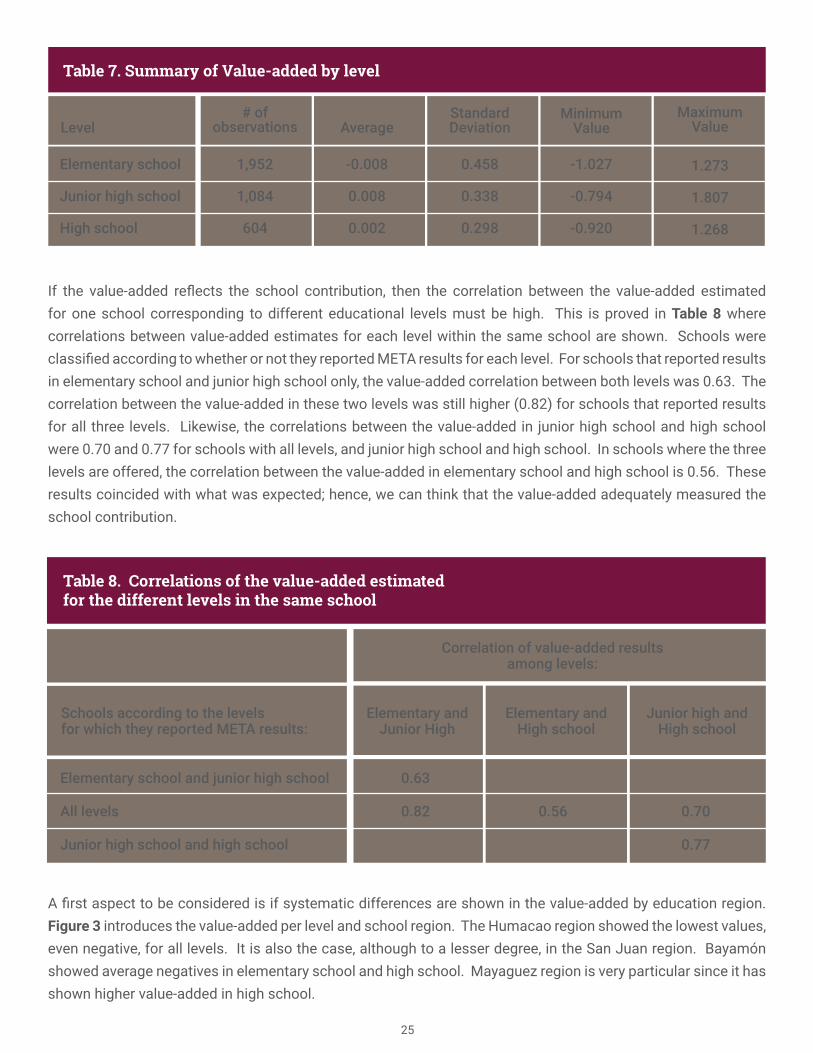
25
Correlation of value-added results among levels:
Schools according to the levelsfor which they reported META results:
Elementary school and junior high school
All levels
Junior high school and high school
0�63
0�82
0�56
0�70
0�77
Table 8. Correlations of the value-added estimatedfor the different levels in the same school
Elementary and Junior High
Elementary and High school
Junior high and High school
Elementary school
Junior high school
High school
1,952
1,084
604
-0�008
0�008
0�002
0�458
0�338
0�298
-1�027
-0�794
-0�920
1�273
1�807
1�268
# ofobservationsLevel Average
Standard Deviation
MinimumValue
MaximumValue
Table 7. Summary of Value-added by level
If the value-added reflects the school contribution, then the correlation between the value-added estimated for one school corresponding to different educational levels must be high. This is proved in Table 8 where correlations between value-added estimates for each level within the same school are shown. Schools were classified according to whether or not they reported META results for each level. For schools that reported results in elementary school and junior high school only, the value-added correlation between both levels was 0.63. The correlation between the value-added in these two levels was still higher (0.82) for schools that reported results for all three levels. Likewise, the correlations between the value-added in junior high school and high school were 0.70 and 0.77 for schools with all levels, and junior high school and high school. In schools where the three levels are offered, the correlation between the value-added in elementary school and high school is 0.56. These results coincided with what was expected; hence, we can think that the value-added adequately measured the school contribution.
A first aspect to be considered is if systematic differences are shown in the value-added by education region. Figure 3 introduces the value-added per level and school region. The Humacao region showed the lowest values, even negative, for all levels. It is also the case, although to a lesser degree, in the San Juan region. Bayamón showed average negatives in elementary school and high school. Mayaguez region is very particular since it has shown higher value-added in high school.

26
-0�25
-0�20
-0�15
-0�10
-0�05
0�00
0�05
0�10
0�15
0�20
Elementary Junior High School High School
250 or less 251 to 375 376 to 500 More than 500
Figure 4. Value-added by School Size and Level
-0�250
-0�200
-0�150
-0�100
-0�050
0�000
0�050
0�100
0�150
0�200
ARECIBO CAGUASBAYAMON HUMACAO PONCEMAYAGUEZ SAN JUAN
Elementary Junior High School High School
Figure 3. Average Value-added by Level and RegionFigure 3
Average Value-added by Level and Region
To examine the relation between school size and value-added, schools were categorized based on their total enrollment.17 Four categories were created: schools with 250 students or less, schools having between 251 and 375 students, schools having between 376 and 500 students, and schools with more than 500 students. These categories were created based on the 25, 50, and 75 percentiles of the enrollment variable. We proceeded to explore how the value-added varied at each level according to school size. Figure 4 shows the relationship between value-added and school size. A negative relation was clearly reflected between value-added and school size in elementary school. The average value-added at this level for smaller schools was 0.03, while for bigger schools it turned negative and decreased as the school size increased. In schools with 500 students or more, the average value-added in elementary school is -0.22. In junior high school, smaller schools had a 0.17 value-added, while bigger schools had a -0.02 and -0.03 value-added. In high schools, no clear pattern was seen concerning the school's size and its value-added.
Figure 4Value-added by School Size and Level
17 The number of students enrolled was taken from the school dropout report by school. We must underline that different reports published by the Department of Education varied in terms of the number of students enrolled depending on the point of the semester the count was performed.

27
-0�070
-0�060
-0�050
-0�040
-0�030
-0�020
-0�010
0�000
0�010
0�020
0�030
2016-2017 2017-2018 2018-2019
Elementary Junior High School High School
Figure 5. Value-added per School Year and Level
To assess possible changes in patterns during the three years, the value-added was averaged by level and academic year as shown in Figure 5. The change that caught our attention the most in the figure was the reduction in the value-added in elementary schools corresponding to the 2018-2019 school year. On that year, an increase in the value-added in high school was also observed.
Figure 5
Value-added per School Year and Level
Analysis of the effect of school variables on the value-added
A regression analysis was estimated using the value-added as the dependent variable to measure the effect of school variables on the school capacity to generate value-added. A separate equation is estimated for each educational level. This regression was performed with the 2018-2019 school year data since the school variables were only available for that year. The equation to be estimated is the following:
Where is a vector of school variables referring to each school.
Among the independent variables included in this analysis were: school enrollment (measures the school size), the number of students per teacher, the percentage of teachers with master’s degree or Ph.D., the percentage of teachers with an exemplary evaluation, whether the school director obtained an exemplary evaluation, and the education region where the school is located. It must be clarified that the variation with respect to the directors’ evaluation is very low. Our data set for the 2018-2019 school year included 782 schools with an estimated value-added for at least one educational level and data referring to school variables. Among these, 506 reported META test results for elementary school, 325 for junior high school, and 198 for high school.18
Table 9 introduces the independent variables’ descriptive statistics. These were broken down by educational level. The number of students enrolled by school fluctuated between 73 and 1,362. The average size was 348
𝑉𝑉𝑉𝑉#$ = 𝑎𝑎 + 𝐸𝐸$′𝛿𝛿 + 𝜀𝜀$
𝐸𝐸"
18 These three groups are not mutually exclusive since there were schools offering more than one level. For purposes of the statistical analysis, the results were evaluated separately.

28
Matrícula escolar
Estudiantes por maestro
Tasa de asistencia de maestros
% de maestros con MA
% de maestros con PhD�
% de maestros con evaluación ejemplar
Escuela con director ejemplar
Matrícula escolar
Estudiantes por maestro
Tasa de asistencia de maestros
% de maestros con MA
% de maestros con PhD�
% de maestros con evaluación ejemplar
Escuela con director ejemplar
Matrícula escolar
Estudiantes por maestro
Tasa de asistencia de maestros
% de maestros con MA
% de maestros con PhD�
% de maestros con evaluación ejemplar
Escuela con director ejemplar
506
506
506
506
506
506
491
325
325
325
325
325
325
317
198
198
198
198
198
198
194
348
11�85
0�84
0�33
0�005
84�60
0�95
408
12�60
0�83
0�32
0�007
82�95
0�96
554
14�05
0�83
0�35
0�014
82�26
0�92
150
2�08
0�02
0�11
0�014
17�15
0�22
162
2�52
0�03
0�10
0�016
18�59
0�21
232
2�81
0�03
0�10
0�020
20�01
0�28
1003
18�07
0�90
0�76
0�125
100�00
1�00
1003
18�50
0�92
0�65
0�079
100�00
1
1362
20�79
0�92
0�60
0�091
100�00
1
73
4�79
0�71
0�00
0�000
1�85
0�00
86
4�79
0�71
0�00
0�000
1�85
0
�
97
4�79
0�71
0�00
0�000
2�22
0
Variable
Variable
Variable
número de observaciones promedio
desviación estándar Max�Min�
número de observaciones promedio
desviación estándar Max�Min�
número de observaciones promedio
desviación estándar Max�Min�
Tabla 9. Estadísticas Descriptivas
Escuelas que ofrecen educación a nivel de escuela superior
Escuelas que ofrecen educación a nivel de escuela intermedia
Escuelas que ofrecen educación a nivel de escuela elemental
for schools offering elementary education and 554 for schools offering high school. The number of students per teacher was estimated by dividing the enrollment by the total number of teachers. We must point out that this does not reflect the average student per classroom. Within the number of teachers, we included teachers for elective classes such as arts and physical education, special education teachers, among other categories of teachers who do not necessarily have a homeroom. The attendance rate of teachers fluctuated between 71 and 92 percent. Although on average more than 80 percent of teachers in each school obtained an exemplary evaluation classification, a high standard deviation was observed for this variable, reflecting that there were a small number of schools with low percentages.19 Approximately a third of the teachers had a master’s degree, but the percentage with PhD was extremely low. In more than 90 percent of the schools, the director received an exemplary classification.
19 Exemplary is the highest classification of the 4 possible evaluation results.

29
Matrícula escolar
Estudiantes por maestro
Tasa de asistencia de maestros
% de maestros con MA
% de maestros con PhD�
% de maestros con evaluación ejemplar
Escuela con director ejemplar
Matrícula escolar
Estudiantes por maestro
Tasa de asistencia de maestros
% de maestros con MA
% de maestros con PhD�
% de maestros con evaluación ejemplar
Escuela con director ejemplar
Matrícula escolar
Estudiantes por maestro
Tasa de asistencia de maestros
% de maestros con MA
% de maestros con PhD�
% de maestros con evaluación ejemplar
Escuela con director ejemplar
506
506
506
506
506
506
491
325
325
325
325
325
325
317
198
198
198
198
198
198
194
348
11�85
0�84
0�33
0�005
84�60
0�95
408
12�60
0�83
0�32
0�007
82�95
0�96
554
14�05
0�83
0�35
0�014
82�26
0�92
150
2�08
0�02
0�11
0�014
17�15
0�22
162
2�52
0�03
0�10
0�016
18�59
0�21
232
2�81
0�03
0�10
0�020
20�01
0�28
1003
18�07
0�90
0�76
0�125
100�00
1�00
1003
18�50
0�92
0�65
0�079
100�00
1
1362
20�79
0�92
0�60
0�091
100�00
1
73
4�79
0�71
0�00
0�000
1�85
0�00
86
4�79
0�71
0�00
0�000
1�85
0
�
97
4�79
0�71
0�00
0�000
2�22
0
Variable
Variable
Variable
número de observaciones promedio
desviación estándar Max�Min�
número de observaciones promedio
desviación estándar Max�Min�
número de observaciones promedio
desviación estándar Max�Min�
Tabla 9. Estadísticas Descriptivas
Escuelas que ofrecen educación a nivel de escuela superior
Escuelas que ofrecen educación a nivel de escuela intermedia
Escuelas que ofrecen educación a nivel de escuela elemental
The regression results are introduced in Tables 10, 11, and 12 for the value-added in elementary school, junior high school, and high school, respectively. The school size, as well as the number of students per teacher are expected to have a direct impact on the quality of education. In our data set, the correlation between these two variables was between .53 and .56, depending on the sample used in each regression. This made it difficult to differentiate one effect from the other. For this reason, the school enrollment was included in the first regression, the second included the number of students per teacher, and the third included both variables. These first three regressions also included the percentage of teachers with a master’s degree, a Ph.D., an exemplary evaluation, and dichotomous variables to control each school region. The baseline used was the Arecibo region; therefore, the other regions' results must be interpreted relative to it.20 Arecibo showed a positive average and quite consistent values for the three levels.
In the regressions using the elementary school value-added as the dependent variable in (Table 10), the school size and the number of students per teacher had a significant and negative effect.21 However, after including both variables, the number of students per teacher lost its statistical significance. As we mentioned previously, this could be due to the high correlation between these variables. In relative terms, the enrollment effect is larger.22 An increment of 100 students in the school enrollment reduced the value-added to 0.06, representing 13% of the value-added standard deviation. However, the percentage of teachers with graduate education did not affect the value-added in elementary school. The results also showed that Caguas and Arecibo had higher value-added schools than the rest of the regions. Nevertheless, the variables included in these three first regressions only explained 12% of the dependent variable's variation.
20 When including dichotomous variables in a regression representing different levels or alternatives for the same variable, in this case the region, the dichotomous variable representing one of the categories must be excluded to avoid multicollinearity. This is the category being compared to the rest of the categories. 21 The elementary school regressions were estimated correcting for heteroscedasticity. In junior high school and hig-school regressions, Breusch-Pagan test showed that there was no heteroscedasticity. 22 The size of the effect is measured as the effect of an increase of one standard deviation on the independent variable as a percentage of the standard deviation of the dependent variable.

30
Similar results were obtained when using the junior high school value-added as the dependent variable (Table 11). In this case, although it had little effect, the number of students per teacher continued to be significant in some of the models even when the regression included school enrollment. Schools in Humacao and Ponce regions showed significantly lower value-added than the rest of the Island.

Table 10. Effect of school variables on the value-added in elementary school
n
F Statistics
R-squared
Independent variables:
School enrollment
Students per teacher
Teachers’ attendace rate
% of teachers with MA
% of teachers with Ph�D�
% of teachers with exemplary evaluation
Director with exemplary evaluation
Bayamón
Caguas
Humacao
Mayagüez
Ponce
San Juan
Poverty
Rural
Constant
Coef�
-0�0006**
1�3486*
-0�0085
0�2011
0�0033**
-0�3047**
-0�0700
-0�2864**
-0�1626**
-0�1756**
-0�2246**
-1�094*
506
6�84
0�119
p-value
0�000
0�078
0�959
0�861
0�005
0�000
0�283
0�000
0�019
0�011
0�001
0�085
Coef�
-0�0268**
1�4739*
-0�0569
0�3345
0�0036**
-0�2713**
-0�0291
-0�2237**
-0�1328*
-0�1353*
-0�1525**
-1�1299*
506
4�31
0�0927
p-value
0�004
0�055
0�735
0�780
0�002
0�000
0�666
0�002
0�069
0�055
0�030
0�075
Coef�
-0�0006**
-0�0034
1�3804*
-0�0112
0�2294
0�0033**
-0�3023**
-0�0679
-0�2813**
-0�1602**
-0�1743**
-0�2178**
-1�0896*
506
6�32
0�1191
p-value
0�000
0�757
0�074
0�947
0�842
0�005
0�000
0�300
0�000
0�021
0�011
0�001
0�087
Coef�
-0�0006**
-0�0022
1�2019
-0�0357
0�1306
0�0030**
0�2292**
-0�2993**
-0�0492
-0�2721**
-0�1595**
-0�1658**
-0�1827**
-1�1390*
491
5�9
0�1248
p-value
0�000
0�844
0�117
0�835
0�912
0�015
0�002
0�000
0�468
0�000
0�023
0�017
0�009
0�071
Coef�
-0�0006**
-0�0024
1�0921
-0�0424
-0�1690
0�0031**
0�2170**
-0�3117**
-0�0735
-0�2834**
-0�1609**
-0�1817**
-0�2131**
-0�0033
-0�0631*
-0�6916
491
5�96
0�1329
p-value
0�000
0�828
0�151
0�806
0�888
0�015
0�002
0�000
0�288
0�000
0�023
0�000
0�003
0�121
0�098
0�304
*Significant at 0.10 level**Significant at 0.05 level

Table 11. Effect of the school variables on the value-added in junior high school
n
F statistics
R-squared
Independent variables:
School enrollment
Students per teacher
Teachers’ attendance rate
% of teachers with MA
% of teachers with Ph�D�
% of teachers with exemplary evaluation
Director with exemplary evaluation
Bayamón
Caguas
Humacao
Mayagüez
Ponce
San Juan
Poverty
Rural
Constant
Coef�
-0�0004**
1�5524**
-0�1264
0�8465
0�0024**
-0�1014
0�0098
-0�2432**
-0�0590
-0�1474**
-0�1328**
-1�187**
325
4�33
0�1015
p-value
0�000
0�017
0�462
0�426
0�013
0�140
0�884
0�000
0�399
0�030
0�050
0�029
Coef�
-0�0228**
1�4196**
-0�1296
0�7078
0�0020**
-0�0619
0�0412
-0�1723**
-0�0285
-0�0929
-0�0760
-0�9529*
325
4�09
0�0948
p-value
0�001
0�029
0�453
0�507
0�046
0�369
0�539
0�013
0�688
0�163
0�268
0�086
Coef�
-0�0003**
-0�0130
1�4987**
-0�1054
0�8450
0�0021**
-0�0848
0�0194
-0�2133**
-0�0407
-0�1308*
-0�1060
-1�0253*
325
4�19
0�1055
p-value
0�030
0�122
0�021
0�540
0�426
0�030
0�222
0�774
0�003
0�565
0�056
0�128
0�064
Coef�
-0�0003**
-0�0145*
1�3496**
-0�1186
1�0079
0�0022**
0�1064
-0�0825
-0�0088
-0�2141**
-0�0499
-0�1271*
-0�0924
-0�9908*
317
3�72
0�1006
p-value
0�048
0�089
0�038
0�492
0�340
0�036
0�208
0�235
0�898
0�003
0�482
0�065
0�194
0�073
Coef�
-0�0004**
-0�0140*
1�1420*
-0�1650
0�0169
0�0023**
0�1089
-0�1094
-0�0387
-0�2501**
-0�0625
-0�1638**
-0�1526**
-0�0053**
-0�0875**
-0�2818
317
4�7
0�1494
p-value
0�007
0�103
0�078
0�326
0�987
0�019
0�185
0�107
0�567
0�000
0�366
0�015
0�032
0�001
0�015
0�627
*Significant at 0.10 level**Significant at 0.05 level

Table 12. Effect of school variables on the value-added in high school
n
F Statistics
Adjusted R-squared
Independent variables:
School enrollment
Students per teacher
Teachers’ attendance rate
% of teachers with MA
% of teachers with Ph�D�
% of teachers with exemplary evaluation
Director with exemplary evaluation
Bayamón
Caguas
Humacao
Mayagüez
Ponce
San Juan
Poverty
Rural
Constant
Coef�
-0�0001
2�8442**
0�3329
2�0090**
0�0026**
-0�1484*
0�0045
-0�2319**
0�0064
-0�0594
-0�1243*
-2�587**
198
5�48
0�2002
p-value
0�534
0�000
0�124
0�050
0�014
0�074
0�955
0�004
0�938
0�460
0�103
0�000
Coef�
-0�0042
2�8404**
0�3289
2�0414**
0�0026**
-0�1421*
0�0085
-0�2225**
0�0086
-0�0558
-0�1185
-2�5598**
198
5�47
0�1999
p-value
0�579
0�000
0�128
0�046
0�015
0�090
0�916
0�005
0�916
0�489
0�117
0�000
Coef�
0�0000
-0�0023
2�8215**
0�3379
2�0154**
0�0026**
-0�1448*
0�0052
-0�2287**
0�0079
-0�0578
-0�1228
-2�5458**
198
5�01
0�1952
p-value
0�704
0�798
0�000
0�121
0�049
0�015
0�086
0�949
0�005
0�924
0�475
0�109
0�000
Coef�
0�0000
-0�0026
2�7696**
0�3185
2�0438**
0�0028**
0�0289
-0�1468*
0�0021
-0�2361**
0�0065
-0�0507
-0�1160
-2�5348**
194
4�51
0�1912
p-value
0�772
0�776
0�001
0�152
0�049
0�018
0�721
0�086
0�979
0�005
0�938
0�538
0�145
0�000
Coef�
-0�0001
0�0120
1�4904*
0�1338
0�5803
0�0026**
0�0059
-0�2102**
-0�0804
-0�3109**
-0�0155
-0�1008
-0�1819**
-0�0097**
-0�0237
-0�7250
194
7�09
0�3213
p-value
0�191
0�177
0�054
0�515
0�554
0�015
0�936
0�008
0�297
0�000
0�841
0�186
0�014
0�000
0�600
0�306
*Significant at 0.10 level**Significant at 0.05 level

34
At the high school level, the variable with the most effect on the value-added was the teachers’ attendance rate, followed by the percentage of teachers with exemplary evaluation and the percentage of teachers with Ph.D. It must be mentioned that when excluding the dichotomous variables identifying the regions, the percentage of teachers with a Master’s degree also had a significant effect. However, its significance was reduced when controlled by region. In this case, neither the school size nor the number of students per professor turned out to be significant. Humacao and Bayamón showed significantly lower value-added than the rest of the regions. The variables mentioned accounted for 20% of the observed variation in high school value-added.
A fourth regression was added in each one of these tables that included a dichotomous variable equal to 1 if the director received an exemplary grade. This turned out to be significant in the results at the elementary school level. As we mentioned before, there is very little variation in this variable. Therefore, its lack of significance does not necessarily imply that the school management quality would not be important at other levels; instead, it may reflect that it was not adequately measured.
The fifth regression introduced the percentage of students under the poverty level and a variable identifying rural area schools. Although the expected GPI value took into account the direct effect of the socioeconomic variables on academic performance, the quality of the school could also be affected by it (Mansfield, 2015) (Condron y Roscigno, 2003) (Downey y Condron, 2016). More so, if we want the system to be proactive in reducing inequalities, it would be desirable to have higher value-added in the schools with higher poverty index. The results showed a negative relation between the value-added and the poverty percentage in junior high school and high school. This implied that schools with a higher poverty index generated less value-added, thus reducing the education system's capacity to counter inequality. This refers us back to Downey and Condron’s (2016) statement that reducing inequalities requires creating teaching environments substantially better to address the disadvantaged populations. In this respect, these results showed that there is still much to be done in the case of junior high schools and high schools in Puerto Rico. When poverty was included, teachers’ education level lost significance, revealing that one of the factors accountable for the differences in value-added among schools, according to the socioeconomic level, may be the difference in the distribution of teachers’ education level. On the other hand, schools in rural areas showed lower value-added in elementary and junior high schools.
Summary: Effects of school variables on the value-added
� Teachers’ quality measured in terms of their evaluation and attendance rate had an important effect on the value-added in all school levels.
� Meanwhile, the school size and the number of students per teacher were relevant factors at the elementary and junior high levels, but lost significance at the high school level.
� At the high school level, teachers’ educational attainment gained relevance.
� Schools in the Humacao region consistently showed significantly lower value-added than the other regions. The opposite is true for Arecibo and Caguas, which showed better elementary school results than the other regions. This means that policies at the regional level can also have an impact on school performance.
� The value-added had a negative relation with the percentage of students under poverty in junior high school and high school, reducing the education system's capacity to counter inequality.
35
This analysis shows that teachers' quality and school structure are important for the quality of educational services. However, we found a dilemma. Most of the variation in the value-added remains unexplained. This is in accordance with Toutkoushian and Curtis’ (2005) results. The lack of specificity in the data may be a reason for the low explanatory power of the variables. The variables collected information on the school and not on the grade nor the classroom. The generality of teachers’ and directors’ evaluations, where most of them received an exemplary evaluation, blurred the possible underlying differences. More so, there are intangibles such as schools' social capital, and the specific policies schools may implement to address the students’ needs.
Conclusions and recommendations:
The results hereby introduced clearly show that poverty is a crucial element in determining academic performance, particularly for junior high and high school students. The sociodemographic characteristics explained more than 60% of the variations observed in schools' academic performance at the high school level. Therefore, if the public education system wants to take transforming actions, it is essential to examine the paths through which poverty and other sociodemographic factors affect students’ performance. Absenteeism, limited support at home, stress, exposure to violence, stigma, and pessimistic expectations are some of the problems related to poverty affecting school performance. The coordination between schools and community institutions, collaboration initiatives between schools and parents, and adequate management of the socioemotional components are essential guidelines to improve the academic environment of socially disadvantaged students (Silva-Laya, D'Angelo, García, y Zúñiga, 2020).
At the elementary school level, most of the performance variation is not explained through the school’s sociodemographic characteristics or the community’s characteristics. This opens a door for policies to have a more significant impact. Strengthening the quality of elementary schools could have a positive effect on higher school levels.
Another outstanding aspect is the need to address special education with an emphasis at the junior high school level. Special education does not seem to be a limiting factor in elementary school's academic performance, but it is in junior high and high school. Besides, it is a significant risk factor for school dropout in junior high school. The junior high school level seems to be the breaking point in the special education system and must be expeditiously addressed.
During the period included in the sample, important events are affecting the school. One is the passage of Hurricane Irma and María in September 2017 that caused extended interruptions in the educational process. The other is the massive closing of schools occurring during that period. To disaggregate both events' effects is difficult; nevertheless, we see some global effects. A significant reduction in academic performance at the junior high level was observed during 2018-2019, the school year after Hurricane María, which could be showing the knowledge gaps stemming from the interruption of school services the previous year. If this is the case, then it is possible that the subject matters imparted at that level may require greater preparation. This should serve as an alert to pay particular attention to the recovery of the instruction time lost due to 2020 earthquakes and

36
the global pandemics among junior high school students. Another possibility is that junior high school students were more affected, in academic terms, by the school switches due to their ages.23 However, after examining the dropout percentage, the high school students showed a dramatic increase in school dropout rates during the last year. This increase may be due to educational lags resulting from the previous year (although it is not reflected in the high school GPI), school access limitations arising from schools' closing, and other problems associated with school relocations. An analysis with disaggregated dropout data at the student level may shed some light on this topic.
There is still the question about the positive effect of our social inequality measure in some performance indicators. Economics literature relates inequality to an increase in education of the most privileged groups. However, we know that in Puerto Rico, the most disadvantaged population is concentrated in public schools. For this reason, we would have expected the opposite result. It is not clear if unequal areas have a tendency to larger diversity within the school, and if it affects the students’ benchmark, or if the inequality indicator is collecting the effects of other aspects of the socioeconomic structure not measured on the data.
The value-added analysis revealed that having smaller schools and smaller groups in elementary schools and junior high schools has proved beneficial for disadvantaged students. Improvements in this direction could facilitate a plan to reopen some shutdown schools to have smaller schools and smaller groups. It must consider the school level being taught (with an emphasis on elementary education), the students’ poverty level, and the number of special education students.
Likewise, policies created to improve the teachers’ performance are extremely important. For example, some of them are: to assure continuous and high-quality training, to foster teachers’ health conditions to reduce absenteeism, to establish strict controls to register attendance, to strengthen the evaluation process, and to use the merit criteria in personnel promotion and retention. Opportunities must be increased, and incentives must be improved so high school teachers continue post-graduate studies, particularly teachers in low socioeconomic schools. This may be achieved through an alliance with the University of Puerto Rico and the Department of Education.
A concerning aspect that remains on the table is the negative correlation found between the value-added and the proportion of students under the poverty level in junior high school and high school. It signals that schools in the most disadvantaged areas are offering a lesser quality service. It is important to emphasize implementing measures to improve the educational quality in those schools that served the most disadvantaged students.
Finally, the value-added analysis clearly shows that many factors were not contemplated in the data that was accessible. It evinces a need to continue a more in-depth study of school policies. Case studies at the school level seem to be an essential vehicle to understand more deeply the relationship between school policies and the quality of the service they offer.
23 It is also possible that the reduction in the GPI in junior high schools in 2017-2019 is related to the reduction in the dropout rate.

37
References
Angrist, J., y Lavy, V. (1999). Using Maimonides’ Rules to Estimate the Effect of Class Size on Scholastic Achievement. The Quarterly Journal of Economics, 114(2), 533-575.
Barrow, L., Claessens, A., & Whitmore Schanzenbach, D. (2013). The Impact of Chicago’s Small High School Initiative. NBER Working Paper (18889).
Borland, V., y Howsen, R. (2003). An Examination of the Effect of Elementary School Size on Student Academic Achievement. International Review of Education, 49(5), 463-474.
Browning, M., y Heinesen, E. (2007). Class size, Teacher Hours and Educational Attainment. Scandinavian Journal of Economics, 109(2), 415-438.
Burke, P. (1989). Gender Identity, Sex and School Performance. Social Psychology Quarterly, 52(2), 159-169.
Caudillo, M. L., y Torche, F. (2014). Exposure to Local Homicides and Early Educational Achievement in Mexico. Sociology of Education, 87(2), 89–105.
CEPAL. (2015). Educación, cambio estructural y crecimiento inclusivo en América Latina. Naciones Unidas. Obtenido el 6 de junio de 2020 de https://www.cepal.org/es/publicaciones/37843-educacion-cambio-estructural-crecimiento-inclusivo-america-latina.
Chiang, H. (2009). How accountability pressure on failing schools affects student achievement. Journal of Public Economics, 93, 1045–1057.
Condron, D. J., y Roscigno, V. J. (2003). Disparities within: Unequal spending and achievement in an urban school district. Sociology of Education, 76(1), 18–36.
Costa Almeida, L. (2017). Neighboring schools, performance and unequal socioeconomic composition: Investigating school inequality. Educaçāo Unisinos, 21(2), 174-185.
Cotton, K. (1996). School Size, School Climate and Student Performance. School Improvement Research Series. Obtenido el 6 de junio de 2020 de https://educationnorthwest.org/sites/default/files/SizeClimateandPerformance.pdf
De Lange, M., y Dronkers, J. (2018). Single parenthood and children’s educational performance: Inequality among families and schools. en R. Niewenhuis, y L. C. Maldonado (Eds.), The triple bind of single-parent families: Resources, employment and policies to improve wellbeing (pp. 125-143). Bristol University Press, Policy Press.
Disdier Flores, O., y Jara Castro, A. (2017). Anuario Estadístico del Sistema Educativo: Año escolar 2014-2015. San Juan, Puerto Rico: Instituto de Estadísticas de Puerto Rico. Obtenido el 25 de mayo de 2020 de https://estadisticas.pr/files/Publicaciones/Anuario_Estadistico_Educativo_2014-2015.pdf
Downey, D., y Condron, D. (2016). Fifty Years since the Coleman Report: Rethinking the Relationship between Schools and Inequality. Sociology of Education, 89(3), 207-220.
Dustmann, C., Frattini, T., Lanzara, G., y Algan, Y. (2012). Educational achievement of second-generation immigrants: an international comparison. Economic Policy, 27(69), 143–185.

38
Flaherty, S. (2013). Does Money Matter in Pennsylvania? School District Spending and Student Proficiency Since No Child Left Behind. Eastern Economic Journal, 39(2), 145–171.
Fredrikson, P., Ӧckert, B., y Oosterbeek, H. (2013). Long-Term Effects of Class Size. The Quarterly Journal of Economics, 128(1), 249-285.
Gershenson, S., y Langbein, L. (2015). The Effect of Primary School Size on Academic Achievement. Educational Evaluation and Policy Analysis, 37(15), 1355-1855.
Guiso, L., Monte, F., Sapienza, P., y Zingales, L. (2008). Diversity, Culture, Gender and Math. Science, 320, 1164-1165.
Gujarati, Damodar. 2004. Basic Econometrics. 4th ed. New York, NY: McGraw-Hill.
Häkkinen, I., Kirjavainen, T., y Uusitalo, R. (2003). School resources and student achievement revisited: New evidence from panel dat. Economics of Education Review, 22(3), 329–335.
Hanushek, E., y Rivkin, S. (2010). Generalizations about Using Value-Added Measures of Teacher Quality. American Economic Review, Papers and Proceedings, 100, 267-271.
Harris, A. L., Jamison, K. M., y Trujillo, M. H. (2008). Disparities in the Educational Success of Immigrants: An Assessment of the Immigrant Effect for Asians and Latinos. The ANNALS of the American Academy of Political and Social Science, 620(1), 90–114.
Heuveline, P., Yang, H., y Timberlake, J. M. (2010). It Takes a Village (Perhaps a Nation): Families, States, and Educational Achievement. Journal of Marriage and Family, 72(5), 1362–1376.
Hoxby, C. (2000). The Effect of Class Size on Student Achievement: New Evidence from Population Variation. The Quarterly Journal of Economics, 115(4), 1239-1285.
Knight, D., y Olofson, M. (2018, July). Funding School Districts Based on Student Attendance: How the Use of Average Daily Attendance Harms School Finance Equity in Texas. Center for Education Research and Policy Studies Policy Brief (5).
Krueger, A. (2003). Economic Considerations and Class Size. The Economic Journal, 113(485), F34-F63.
Ladd, H., y Rivera-Batiz, F. L. (2006). Education and Economic Development. En S. M. Collins, B. P. Bosworth, y M. A. Soto-Class (Eds.), The Economy of Puerto Rico; Restoring Growth (pp. 189-254). Washington, DC: Center for the New Economy; Brookings Institution.
Legewie, J., y DiPrete, T. A. (2012). School Context and the Gender Gap in Educational Achievement. American Sociological Review, 77(3), 463–485.
Leithwood, K., y Jantz, D. (2009). A Review of Empirical Evidence about School Size Effects: A Policy Perspective. Review of Educational Research, 79(1), 464-490.
Logan, J. R., Minca, E., y Adar, S. (2012). The Geography of Inequality: Why Separate Means Unequal in American Public Schools. Sociology of Education, 85(3), 287-301.
Ma, X. (2008). Within School Gender Gaps in Reading, Mathematics and Science Literacy. Comparative Education Review, 52(3), 437-460.

39
Mansfield, R. K. (2015). Teacher Quality and Student Inequality. Journal of Labor Economics, 33(3), 751–788.
Olofson, M., y Knight, D. (2018). Does the Middle School Model Make a Difference? Education Sciences, 160(8), 1-11.
Pong, S.-l., y Hao, L. (2007). Neighborhood and School Factors in the School Performance of Immigrants Children. The International Migration Review, 41(1), 206-241.
Renewing America. (2013). Remedial Education: Federal Education Policy. Progress Report and Scorecard, Council on Foreign Relations. Obtenido el 6 de junio de 2020 de https://www.cfr.org/report/remedial-education-federal-education-policy
Roos, L. L., Hiebert, B. M., Edgerton, J., Wald, R., MacWilliam, L., y de Rocquigny, J. (2013). What is Most Important: Social Factors, Health Selection, and Adolescent Educational Achievement. Social Indicators Research, 110(1), 385–414.
Schmitt, N. (2013). The Effects of Teaching Experience on High School Education: A Statistical Model on Factors of Educational Achievement in Math and Science. American Journal of Agricultural Economics, 95(2), 531–535.
Silva-Laya, M., D’Angelo, N., García, E., y Zúñiga, L. (2020). Urban poverty and education, A systematic literature review. Educational Research Review, 29.
Stetsenko, A., Little, T. D., Gordeeva, T., Grasshof, M., y Oettingen, G. (2000). Gender Effects in Children’s Belief about School Performance: A Cross-Cultural Study. Child Development, 71(2), 517-527.
Toutkoushian, R., y Curtis, T. (2005). Effects of Socioeconomic Factors on Public High School Outcomes and Rankings. The Journal of Education Research, 98(5), 259-271.

40
The random-effect model, on the other hand, assumes that the intercept of each unit is composed of a fixed factor (α) and an error (𝑢𝑢!")normally distributed with average equal to zero:
𝑐𝑐! = 𝛼𝛼 + 𝑢𝑢!",𝑑𝑑𝑑𝑑𝑑𝑑𝑑𝑑𝑑𝑑𝑢𝑢! ~𝑁𝑁(0, 𝜎𝜎%&).
Therefore, the expected value for 𝑐𝑐! will be equal to α.
In this case, we can rewrite the model as:
𝐷𝐷'!" = 𝛼𝛼 + 𝑿𝑿(!"𝜷𝜷 +𝜸𝜸𝒊𝒊𝑷𝑷𝑷𝑷𝑷𝑷𝒏𝒏𝒊𝒊𝒏𝒏 + 𝜸𝜸𝟐𝟐𝒇𝒇𝒇𝒇𝒇𝒇𝒏𝒏𝒊𝒊𝒏𝒏 + 𝜸𝜸𝟑𝟑𝑬𝑬𝑬𝑬𝒏𝒏𝒊𝒊𝒏𝒏 + 𝒖𝒖𝒊𝒊 + 𝝐𝝐𝒊𝒊𝒏𝒏
𝐷𝐷!"# =indicator of the corresponding performance at educational level n in school i during period t. This could be the indicator 𝐼𝐼𝐷𝐷𝐼𝐼!"# or the dropouts’ percentage.
𝑋𝑋"#= a vector of community variables corresponding to school i during period t.
𝑃𝑃𝑃𝑃𝑃𝑃!"# = % of students in level n living in households under the poverty level in school i during period t.
𝑓𝑓𝑓𝑓𝑓𝑓!"# = % of female students in level n in school i during period t.
𝐸𝐸𝐸𝐸!"# = % of students participating in the special education program in level n in school i during period t.
𝝐𝝐𝒊𝒊𝒊𝒊 = error term ~𝑁𝑁(0, 𝜎𝜎&')
Appendix A: Technical Appendix
Putting the three years in a data panel allows us to use the variation among schools and the interannual variation to measure the effects of the diverse independent variables in school academic performance. The model to be estimated is expressed in the following manner:
where,
When panel data is used, the ordinary least squares regression method tends not to be adequate. The econometric analysis for panel data is typically estimated using random effect regression models or fixed-effects models. The fixed-effects model includes a dichotomous variable for each school measuring the effect of all the characteristics of that school that do not change through time and is expressed in the following manner:
This means that the fixed effects model estimates a different constant or intercept for each unit, in this case, the school. This substantially increases the number of parameters of the model.
𝐷𝐷"#$ = 𝑐𝑐 + 𝑿𝑿)#$𝜷𝜷 +𝜸𝜸𝒊𝒊𝑷𝑷𝑷𝑷𝑷𝑷𝒏𝒏𝒊𝒊𝒏𝒏 + 𝜸𝜸𝟐𝟐𝒇𝒇𝒇𝒇𝒇𝒇𝒏𝒏𝒊𝒊𝒏𝒏 + 𝜸𝜸𝟑𝟑𝑬𝑬𝑬𝑬𝒏𝒏𝒊𝒊𝒏𝒏 + 𝝐𝝐𝒊𝒊𝒏𝒏
𝐷𝐷"#$ = 𝑐𝑐# + 𝑿𝑿)#$𝜷𝜷 +𝜸𝜸𝒊𝒊𝑷𝑷𝑷𝑷𝑷𝑷𝒏𝒏𝒊𝒊𝒏𝒏 + 𝜸𝜸𝟐𝟐𝒇𝒇𝒇𝒇𝒇𝒇𝒏𝒏𝒊𝒊𝒏𝒏 + 𝜸𝜸𝟑𝟑𝑬𝑬𝑬𝑬𝒏𝒏𝒊𝒊𝒏𝒏 + 𝝐𝝐𝒊𝒊𝒏𝒏

41
Gujarati (2004) stated that if the number of units is large and the number of periods short, as is the case in this study, the fixed-effects model is recommended; if the units do not come from the sample the random effect model is recommended. The Hausman specification test can also be used to determine the model to be used. The Hausman test's null hypothesis is that, under the assumption of no correlation, the fixed effects estimators and the random-effects are consistent, but the fixed effects one is inefficient. If the null is not rejected, we proceed to use the random effect model.
In this case, we have a large number of schools and only three periods. Even if we take the universe of schools, the information problem forces us to work with a sample. This implies that the random-effect model may be preferable. The random-effect model is also preferable if the results are meant to be used to estimate the school value-added. Using the fixed effects method, the intercept of each school can collect the effect of the non-observable community variables that remain fixed through time, but it could also collect the effect of particular school policies contributing to the value-added.
By performing the corresponding tests for the GPI analysis and dropout rate, the random effect model results were confirmed to be preferable to the ordinary least squares model.24 The Hausman test also shows that the random effect model is preferable to the fixed-effects model. Furthermore, as we mentioned before, for estimating value-added on the second stage, the random effect model is also preferable. For this reason, all the results introduced here have been estimated using the random effect model.
Spatial regressions
In addition, spatial regressions were performed to verify that the results were not affected by relations between schools, given their geographical proximity. The spatial regression analysis takes into account three possible effects: relations among independent variables, relations among errors, and possible effects of the independent variables of a location on the dependent variable of another location nearby. Different models were estimated to determine if there were spatial relations. In all cases, the analyses were based on the distance between schools according to their location using their latitude and longitude. The inverse distances between schools were used to model the potential importance of one location on another. This analysis requires the use of a balanced data panel; in other words, that all the observations are repeated in all periods. For that reason, a subsample of schools open during the three years was used. The requirement that only active schools be included in these models, together with the massive closing of schools during the years of the study, limits these models' applicability to our study; however, it is used to verify the robustness of the results.
The Wald test is used to determine whether the estimated spatial model is adequate or not. In the case of the models using high school GPI as the dependent variable none of the estimated models showed any significant spatial effects.
Although the Wald tests proved the existence of spatial effects with respect to the elementary school GPI, the results did not vary significantly with respect to the non-spatial random-effects models, except in the relative level of significance. For example, in this sample, the random model finds a significant negative effect of the
24 The Breusch-Pagan Lagrange multiplier test is performed in accordance with xttest0 en STATA.

42
percentage of female-headed households on the elementary school GPI, but said effect loses significance in the spatial regression models. Likewise, the variable identifying rural schools also lose significance, which may be explained since its effect may be absorbed by spatial correlations. In junior high school, when considering the spatial effects, the results do not change significantly. The GPI models were estimated with samples having 1,464 observations in 488 elementary schools and 912 observations in 304 junior high schools.
Spatial regressions were also performed for the subsamples of junior high schools and high schools active during the three years, using the dropout rate as a dependent variable. In the case of junior high schools, only the spatial effects related to the relation among the dependent variables were significant. In this subsample, it was found that the percentage of females is positively related to school dropout, while in the broader sample, this effect was not significant.25 To consider the spatial effects does not substantially affect the results.
In high schools, only the spatial effects of independent variables were significant and only for the model that included census tract variables. After using the balanced panel, the positive effect of the proportion of adults with a BA that we observed in the general sample, loses significance, especially in the spatial regression model; although, in the spatial regression, the percentage of adults with high school diploma acquires significance. In other words, the tendency persists in showing that an increase in community educational attainment increases school dropout, which is counterintuitive. In this reduced sample, female-headed households' prevalence is not a determinant of school dropout in high school. However, it is in the non-spatial analysis that included a larger sample of schools.
25 As we mentioned in the body of the report, this could be reflecting a reverse causality.

43
Appendix B: Lists of schools rank according to the estimated value-added.
Table B-1
List of schools with estimated value-added for the elementary level
Ranking Code School Name RegionElementary School
Value-added
1 20537 SU LA LOMA (ANTONIO VAZQUEZ RAMOS) CAGUAS 1.22
2 43323 HENRY W LONGFELLOW MAYAGUEZ 0.99
3 71753 IGNACIO MIRANDA ARECIBO 0.94
4 71662 CARMEN BARROSO MORALES BAYAMON 0.94
5 12070 FELIX CORDOVA DAVILA ARECIBO 0.94
6 43307 HERMINIA C RAMIREZ MAYAGUEZ 0.92
7 20396 JOSE COLON GONZALEZ CAGUAS 0.86
8 20727 CIPRIANO MANRIQUE CAGUAS 0.85
9 10439 DR CAYETANO COLL Y TOSTE ARECIBO 0.84
10 18226 HECTOR HERNANDEZ ARANA ARECIBO 0.82
11 66167 FRAY BARTOLOME DE LAS CASAS SAN JUAN 0.80
12 50773 LUIS MUÑOZ RIVERA PONCE 0.79
13 12187 ANTONIO VELEZ ALVARADO ARECIBO 0.79
14 17707 DR EFRAIN GONZALEZ TEJERA PONCE 0.78
15 44842 MARIA LUISA ARCELAY MAYAGUEZ 0.78
16 58131 JOSE M ESPADA ZAYAS PONCE 0.77
17 62679 AMALIA MARIN SAN JUAN 0.77
18 58495 RAMON LOPEZ BERRIOS PONCE 0.76
19 69013 TULIO LARRINAGA SAN JUAN 0.75
20 11411 CARMEN NOELIA PERAZA TOLEDO ARECIBO 0.73
21 31609 QUEBRADA GRANDE HUMACAO 0.73
22 62539 JUANITA GARCIA PERAZA SAN JUAN 0.70
23 16220 JUDITH A VIVAS PONCE 0.70
24 41632 BRYAN MAYAGUEZ 0.69
25 31617 EUGENIO BRAC HUMACAO 0.67
26 50799 MARIA L MC DOUGALL PONCE 0.67
27 51334 DALILA TORRES PONCE 0.66
28 32268 RAFAEL REXACH DUEÑO HUMACAO 0.64
29 10322 SU ENRIQUE DE JESUS BORRAS ARECIBO 0.64

44
30 42572 CERRO GORDO MEDINA MAYAGUEZ 0.63
31 20305 RABANAL CAGUAS 0.63
32 40030 SU JUAN B SOTO MAYAGUEZ 0.63
33 12765 SU SANAMUERTOS BAYAMON 0.63
34 12336 RAMON TORRES RIVERA BAYAMON 0.62
35 61549 RAFAEL HERNANDEZ MARIN SAN JUAN 0.61
36 33274 BERTA ZALDUONDO HUMACAO 0.61
37 27714 ADALBERTO SANCHEZ MORALES CAGUAS 0.60
38 12229 TEODOMIRO TABOAS ARECIBO 0.58
39 52894 JOSE PADIN CAGUAS 0.57
40 35071 LUZ A CRUZ DE SANTANA HUMACAO 0.57
41 20941 PAULA MOJICA CAGUAS 0.57
42 48017 ESCUELA ELEMENTAL NUEVA MAYAGUEZ 0.56
43 52886 COQUI (INTERMEDIA) CAGUAS 0.56
44 40493 ANA M. JAVARIZ MAYAGUEZ 0.56
45 75770 SANTA ROSA III SAN JUAN 0.56
46 12633 VISITACION PAGAN BAYAMON 0.56
47 12518 SU BONIFACIO ALVARADO BAYAMON 0.56
48 60228 JESUS MANUEL SUAREZ SAN JUAN 0.55
49 50542 PURIFICACION RODRIGUEZ PONCE 0.54
50 33936 CAMILO VALLES MATIENZO HUMACAO 0.54
51 41913 INDIERA FRIA MAYAGUEZ 0.53
52 42952 SU DAVID ANTONGIORGI CORDOVA MAYAGUEZ 0.53
53 20255 RAFAEL PONT FLORES CAGUAS 0.53
54 54635 HERMINIA GARCIA PONCE 0.52
55 51482 SAN PATRICIO PONCE 0.51
56 43257 GEORGINA ALVARADO MAYAGUEZ 0.50
57 12062 FRANCISCO MENENDEZ BALBAÑE ARECIBO 0.49
58 69112 JESUS SILVA SAN JUAN 0.49
59 52985 ANA VALLDEJULY (JAUCA) PONCE 0.48
60 12740 ANGEL RAFAEL DIAZ COLON BAYAMON 0.48
61 53744 BENICIA VELEZ PONCE 0.46
62 42770 TOMAS VERA AYALA MAYAGUEZ 0.46
63 43299 MARIANO ABRIL MAYAGUEZ 0.46
64 13334 SU MARTA LAFONTAINE PONCE 0.46

45
65 32243 RAFAEL DE JESUS HUMACAO 0.45
66 52795 FELIX GARAY ORTIZ CAGUAS 0.44
67 30429 BRAULIO AYALA PEREZ HUMACAO 0.44
68 33647 ANTERA ROSADO FUENTES HUMACAO 0.43
69 44529 RAMON OLIVARES MAYAGUEZ 0.42
70 15024 ELBA LUGO CARRION ARECIBO 0.42
71 71746 RAFAEL HERNANDEZ ARECIBO 0.42
72 35360 LIDIA FIOL SCARANO HUMACAO 0.42
73 40915 JAMES GARFIELD MAYAGUEZ 0.42
74 14787 FRANCISCO PACHIN MARIN ARECIBO 0.41
75 20990 ROSA C BENITEZ CAGUAS 0.41
76 30197 GABINO SOTO HUMACAO 0.40
77 58099 PROFESORA LUIZA MONSEGUR VELEZ PONCE 0.40
78 68510 JUANA A MENDEZ SAN JUAN 0.40
79 20065 ALFONSO LOPEZ O’NEILL CAGUAS 0.39
80 17418 NUEVA JUAN S MARCHAND ARECIBO 0.38
81 13359 INOCENCIO MONTERO PONCE 0.38
82 50500 JOSE RAMON RODRIGUEZ PONCE 0.37
83 50690 ELSA E COUTO ANNONI PONCE 0.37
84 64956 MARIA TERESA SERRANO SAN JUAN 0.36
85 37507 ECOLOGICA DE CULEBRA HUMACAO 0.36
86 40121 JOSE GONZALEZ RUIZ MAYAGUEZ 0.36
87 40295 HOMERO RIVERA SOLA MAYAGUEZ 0.36
88 21063 PEPITA GARRIGA CAGUAS 0.35
89 32748 SU JESUS T SANABRIA CRUZ HUMACAO 0.35
90 55731 JUAN SERAPIO MANGUAL PONCE 0.35
91 21873 SU OSCAR PORRATA DORIA CAGUAS 0.34
92 40204 JUAN LINO SANTIAGO MAYAGUEZ 0.34
93 42911 CONRADO RODRIGUEZ MAYAGUEZ 0.34
94 71571 ERNESTINA BRACERO BAYAMON 0.33
95 61333 DR ANTONIO S PEDREIRA SAN JUAN 0.33
96 21576 EDUCACION BILINGUE LUIS MUÑOZ IGLESIAS CAGUAS 0.33
97 75747 MARIANO ABRIL ELEMENTAL SAN JUAN 0.33
98 55889 DR PEDRO ALBIZU CAMPOS PONCE 0.32
99 63107 MANUEL BOADA SAN JUAN 0.32
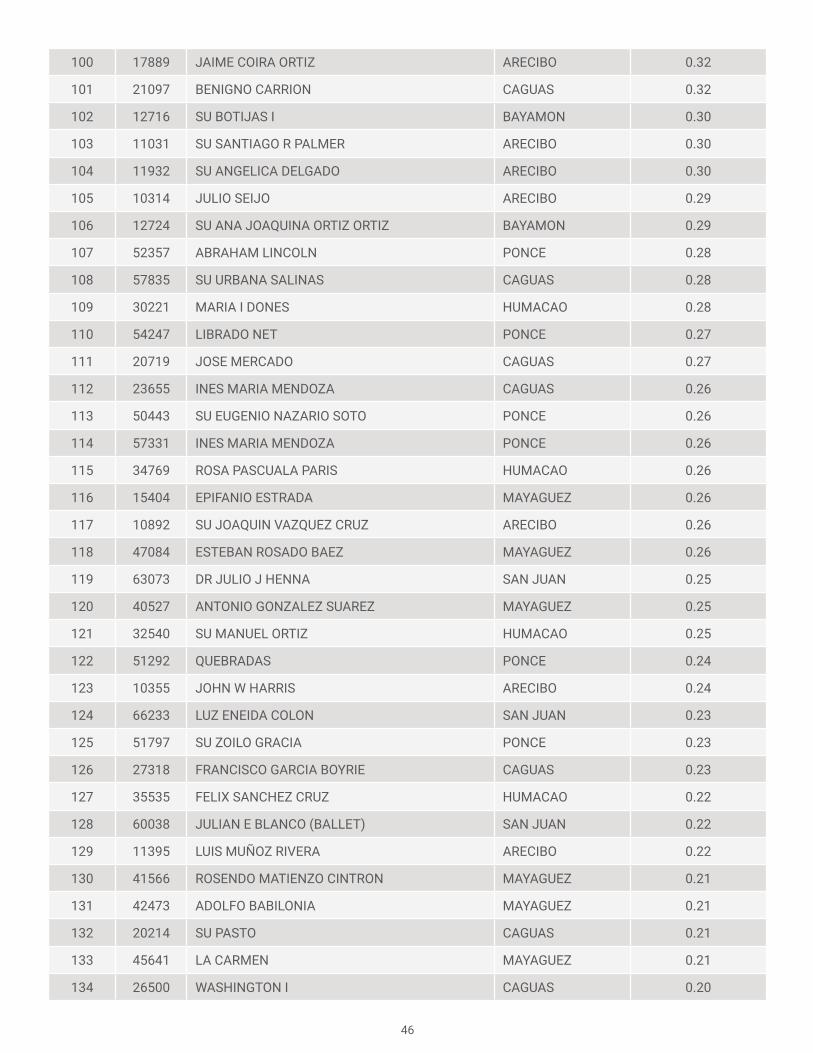
46
100 17889 JAIME COIRA ORTIZ ARECIBO 0.32
101 21097 BENIGNO CARRION CAGUAS 0.32
102 12716 SU BOTIJAS I BAYAMON 0.30
103 11031 SU SANTIAGO R PALMER ARECIBO 0.30
104 11932 SU ANGELICA DELGADO ARECIBO 0.30
105 10314 JULIO SEIJO ARECIBO 0.29
106 12724 SU ANA JOAQUINA ORTIZ ORTIZ BAYAMON 0.29
107 52357 ABRAHAM LINCOLN PONCE 0.28
108 57835 SU URBANA SALINAS CAGUAS 0.28
109 30221 MARIA I DONES HUMACAO 0.28
110 54247 LIBRADO NET PONCE 0.27
111 20719 JOSE MERCADO CAGUAS 0.27
112 23655 INES MARIA MENDOZA CAGUAS 0.26
113 50443 SU EUGENIO NAZARIO SOTO PONCE 0.26
114 57331 INES MARIA MENDOZA PONCE 0.26
115 34769 ROSA PASCUALA PARIS HUMACAO 0.26
116 15404 EPIFANIO ESTRADA MAYAGUEZ 0.26
117 10892 SU JOAQUIN VAZQUEZ CRUZ ARECIBO 0.26
118 47084 ESTEBAN ROSADO BAEZ MAYAGUEZ 0.26
119 63073 DR JULIO J HENNA SAN JUAN 0.25
120 40527 ANTONIO GONZALEZ SUAREZ MAYAGUEZ 0.25
121 32540 SU MANUEL ORTIZ HUMACAO 0.25
122 51292 QUEBRADAS PONCE 0.24
123 10355 JOHN W HARRIS ARECIBO 0.24
124 66233 LUZ ENEIDA COLON SAN JUAN 0.23
125 51797 SU ZOILO GRACIA PONCE 0.23
126 27318 FRANCISCO GARCIA BOYRIE CAGUAS 0.23
127 35535 FELIX SANCHEZ CRUZ HUMACAO 0.22
128 60038 JULIAN E BLANCO (BALLET) SAN JUAN 0.22
129 11395 LUIS MUÑOZ RIVERA ARECIBO 0.22
130 41566 ROSENDO MATIENZO CINTRON MAYAGUEZ 0.21
131 42473 ADOLFO BABILONIA MAYAGUEZ 0.21
132 20214 SU PASTO CAGUAS 0.21
133 45641 LA CARMEN MAYAGUEZ 0.21
134 26500 WASHINGTON I CAGUAS 0.20
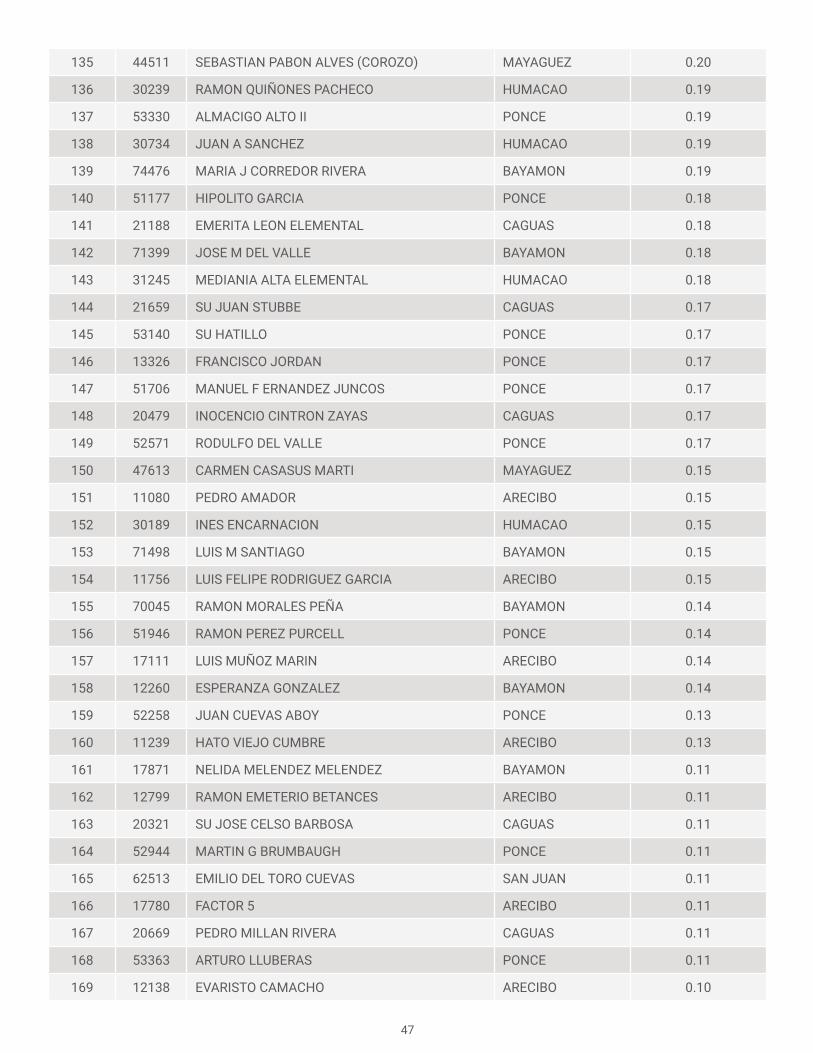
47
135 44511 SEBASTIAN PABON ALVES (COROZO) MAYAGUEZ 0.20
136 30239 RAMON QUIÑONES PACHECO HUMACAO 0.19
137 53330 ALMACIGO ALTO II PONCE 0.19
138 30734 JUAN A SANCHEZ HUMACAO 0.19
139 74476 MARIA J CORREDOR RIVERA BAYAMON 0.19
140 51177 HIPOLITO GARCIA PONCE 0.18
141 21188 EMERITA LEON ELEMENTAL CAGUAS 0.18
142 71399 JOSE M DEL VALLE BAYAMON 0.18
143 31245 MEDIANIA ALTA ELEMENTAL HUMACAO 0.18
144 21659 SU JUAN STUBBE CAGUAS 0.17
145 53140 SU HATILLO PONCE 0.17
146 13326 FRANCISCO JORDAN PONCE 0.17
147 51706 MANUEL F ERNANDEZ JUNCOS PONCE 0.17
148 20479 INOCENCIO CINTRON ZAYAS CAGUAS 0.17
149 52571 RODULFO DEL VALLE PONCE 0.17
150 47613 CARMEN CASASUS MARTI MAYAGUEZ 0.15
151 11080 PEDRO AMADOR ARECIBO 0.15
152 30189 INES ENCARNACION HUMACAO 0.15
153 71498 LUIS M SANTIAGO BAYAMON 0.15
154 11756 LUIS FELIPE RODRIGUEZ GARCIA ARECIBO 0.15
155 70045 RAMON MORALES PEÑA BAYAMON 0.14
156 51946 RAMON PEREZ PURCELL PONCE 0.14
157 17111 LUIS MUÑOZ MARIN ARECIBO 0.14
158 12260 ESPERANZA GONZALEZ BAYAMON 0.14
159 52258 JUAN CUEVAS ABOY PONCE 0.13
160 11239 HATO VIEJO CUMBRE ARECIBO 0.13
161 17871 NELIDA MELENDEZ MELENDEZ BAYAMON 0.11
162 12799 RAMON EMETERIO BETANCES ARECIBO 0.11
163 20321 SU JOSE CELSO BARBOSA CAGUAS 0.11
164 52944 MARTIN G BRUMBAUGH PONCE 0.11
165 62513 EMILIO DEL TORO CUEVAS SAN JUAN 0.11
166 17780 FACTOR 5 ARECIBO 0.11
167 20669 PEDRO MILLAN RIVERA CAGUAS 0.11
168 53363 ARTURO LLUBERAS PONCE 0.11
169 12138 EVARISTO CAMACHO ARECIBO 0.10
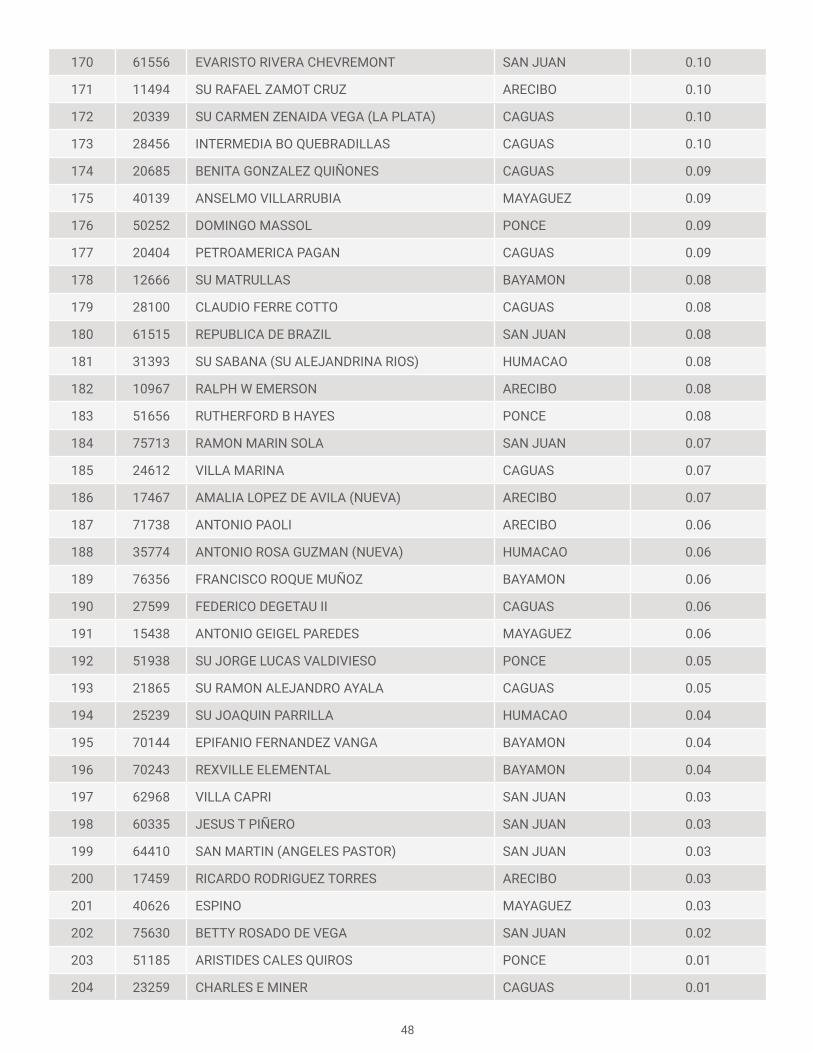
48
170 61556 EVARISTO RIVERA CHEVREMONT SAN JUAN 0.10
171 11494 SU RAFAEL ZAMOT CRUZ ARECIBO 0.10
172 20339 SU CARMEN ZENAIDA VEGA (LA PLATA) CAGUAS 0.10
173 28456 INTERMEDIA BO QUEBRADILLAS CAGUAS 0.10
174 20685 BENITA GONZALEZ QUIÑONES CAGUAS 0.09
175 40139 ANSELMO VILLARRUBIA MAYAGUEZ 0.09
176 50252 DOMINGO MASSOL PONCE 0.09
177 20404 PETROAMERICA PAGAN CAGUAS 0.09
178 12666 SU MATRULLAS BAYAMON 0.08
179 28100 CLAUDIO FERRE COTTO CAGUAS 0.08
180 61515 REPUBLICA DE BRAZIL SAN JUAN 0.08
181 31393 SU SABANA (SU ALEJANDRINA RIOS) HUMACAO 0.08
182 10967 RALPH W EMERSON ARECIBO 0.08
183 51656 RUTHERFORD B HAYES PONCE 0.08
184 75713 RAMON MARIN SOLA SAN JUAN 0.07
185 24612 VILLA MARINA CAGUAS 0.07
186 17467 AMALIA LOPEZ DE AVILA (NUEVA) ARECIBO 0.07
187 71738 ANTONIO PAOLI ARECIBO 0.06
188 35774 ANTONIO ROSA GUZMAN (NUEVA) HUMACAO 0.06
189 76356 FRANCISCO ROQUE MUÑOZ BAYAMON 0.06
190 27599 FEDERICO DEGETAU II CAGUAS 0.06
191 15438 ANTONIO GEIGEL PAREDES MAYAGUEZ 0.06
192 51938 SU JORGE LUCAS VALDIVIESO PONCE 0.05
193 21865 SU RAMON ALEJANDRO AYALA CAGUAS 0.05
194 25239 SU JOAQUIN PARRILLA HUMACAO 0.04
195 70144 EPIFANIO FERNANDEZ VANGA BAYAMON 0.04
196 70243 REXVILLE ELEMENTAL BAYAMON 0.04
197 62968 VILLA CAPRI SAN JUAN 0.03
198 60335 JESUS T PIÑERO SAN JUAN 0.03
199 64410 SAN MARTIN (ANGELES PASTOR) SAN JUAN 0.03
200 17459 RICARDO RODRIGUEZ TORRES ARECIBO 0.03
201 40626 ESPINO MAYAGUEZ 0.03
202 75630 BETTY ROSADO DE VEGA SAN JUAN 0.02
203 51185 ARISTIDES CALES QUIROS PONCE 0.01
204 23259 CHARLES E MINER CAGUAS 0.01

49
205 62182 PRISCO FUENTES SAN JUAN 0.01
206 33563 JUANA RODRIGUEZ MUNDO HUMACAO 0.01
207 58164 GLORIA MARIA BORRERO OLIVERAS PONCE 0.01
208 43752 SU CARMELO SERRANO CUBANO MAYAGUEZ 0.01
209 41814 SU LAURO GONZALEZ HIJO MAYAGUEZ 0.01
210 61416 JULIO SELLES SOLA SAN JUAN 0.00
211 45393 BLANCA MALARET MAYAGUEZ 0.00
212 20735 DIEGO VAZQUEZ CAGUAS 0.00
213 12278 JUANA G AVILES (FRANQUEZ) BAYAMON 0.00
214 71134 LUISA M VALDERRAMA (SAN ANTONIO) ARECIBO -0.01
215 70011 VIRGILIO DAVILA BAYAMON -0.01
216 42390 RAFAEL MARTINEZ NADAL MAYAGUEZ -0.01
217 21352 SU EUGENIO MARIA DE HOSTOS CAGUAS -0.01
218 18176 ELI RAMOS ROSARIO ARECIBO -0.01
219 25023 MARIA DAVILA SEMIDEY HUMACAO -0.02
220 28555 ERNESTO VICENTE CARATTINI CAGUAS -0.02
221 40378 JOSE DE DIEGO MAYAGUEZ -0.02
222 42804 JUAN DE DIOS QUIÑONES MAYAGUEZ -0.02
223 71472 MANUEL VELILLA BAYAMON -0.02
224 33308 RUFINO VIGO HUMACAO -0.02
225 42945 MANUEL GONZALEZ MELO MAYAGUEZ -0.02
226 57026 SANTA TERESITA PONCE -0.03
227 57182 CARMEN SOLA DE PEREIRA PONCE -0.03
228 43794 RAMON MARIA TORRES MAYAGUEZ -0.03
229 52621 ISMAEL MALDONADO LUGARO PONCE -0.03
230 53579 LUIS A FERRE AGUAYO PONCE -0.03
231 27383 VIRGINIA VAZQUEZ MENDOZA CAGUAS -0.04
232 70532 JOSEFITA MONSERRATE DE SELLES BAYAMON -0.04
233 21022 SU SANDALIO MARCANO CAGUAS -0.04
234 62810 LUIS MUÑOZ RIVERA SAN JUAN -0.04
235 12435 BARAHONA (ELEMENTAL) BAYAMON -0.04
236 43398 SU FRANCISCO MARIA QUIÑONES MAYAGUEZ -0.05
237 10637 ANGELICA GOMEZ DE BETANCOURT ARECIBO -0.05
238 20552 FEDERICO DEGETAU CAGUAS -0.05
239 14779 JUAN A SANCHEZ DAVILA ARECIBO -0.06

50
240 30791 CARMEN ARZUAGA DE RIVERA HUMACAO -0.06
241 17673 DANIEL VELEZ SOTO ARECIBO -0.06
242 21543 SU CERTENEJAS II CAGUAS -0.06
243 54502 JOSEFINA BOYA PONCE -0.06
244 62612 RAFAEL HERNANDEZ SAN JUAN -0.06
245 41012 SU FEDERICO DEGETAU MAYAGUEZ -0.07
246 30924 LUIS MUÑOZ RIVERA HUMACAO -0.07
247 34793 CELSO GONZALEZ VAILLANT HUMACAO -0.08
248 73890 MARIA C OSORIO BAYAMON -0.08
249 51342 ANGELICA TORO (NUEVA) PONCE -0.09
250 61622 DR FRANCISCO HERNANDEZ Y GAETAN SAN JUAN -0.09
251 62562 GASPAR VILA MAYANS SAN JUAN -0.09
252 71647 DR EFRAIN SANCHEZ HIDALGO BAYAMON -0.09
253 21006 FRANCISCO VALDES ROLA CAGUAS -0.10
254 61580 ANTONIO B CAIMARY SAN JUAN -0.10
255 64998 LCDO GUILLERMO ATILES MOREAU SAN JUAN -0.10
256 70417 RAFAEL COLON SALGADO BAYAMON -0.10
257 23515 JUSTINA VAZQUEZ MENDOZA CAGUAS -0.11
258 76349 SU FRANCISCO FELICIE MARTINEZ ARECIBO -0.11
259 42176 JOSE GAUTIER BENITEZ MAYAGUEZ -0.11
260 30874 JOSE DE DIEGO HUMACAO -0.11
261 25932 PEPITA ARENAS CAGUAS -0.12
262 32573 JOSE. F CINTRON Y ANEXO HUMACAO -0.12
263 40147 AQUILINO CABAN MAYAGUEZ -0.12
264 53702 SANTIAGO NEGRONI PONCE -0.12
265 64949 ROBERTO CLEMENTE SAN JUAN -0.12
266 70433 CARLOS ORAMA PADILLA BAYAMON -0.12
267 42283 MARIANO RIERA PALMER MAYAGUEZ -0.12
268 28548 VIOLETA REYES PEREZ CAGUAS -0.12
269 72058 RAFAEL HERNANDEZ ARECIBO -0.12
270 61689 LUIS MUÑOZ RIVERA SAN JUAN -0.13
271 52761 LAS MAREAS CAGUAS -0.13
272 20172 SU BAYAMONCITO CAGUAS -0.13
273 25049 CECILIO LEBRON RAMOS HUMACAO -0.13
274 70763 RAFAEL CORDERO BAYAMON -0.13

51
275 69021 FAIR VIEW SAN JUAN -0.13
276 20834 LUIS MUÑOZ RIVERA CAGUAS -0.14
277 34272 GULLERMINA ROSADO DE AYALA HUMACAO -0.14
278 52050 FERNANDO L MALAVE OLIVERAS PONCE -0.14
279 70409 BERNARDO HUYKE BAYAMON -0.14
280 28076 DRA CARMENDELIA COLON MARTINEZ CAGUAS -0.14
281 76562 CRISTOBAL SANTANA MELECIO (NUEVA) ARECIBO -0.14
282 62927 SAN AGUSTIN SAN JUAN -0.14
283 11320 SU FRANCISCO SERRANO ARECIBO -0.15
284 71449 ALEJANDRO JR CRUZ BAYAMON -0.15
285 25312 SIMON MADERA CAGUAS -0.15
286 71068 SU DEMETRIO RIVERA BAYAMON -0.15
287 52225 JAIME L DREW PONCE -0.15
288 79087 NUEVA ELEM BO QUEBRADA NEGRITO SAN JUAN -0.15
289 41582 SU JUAN CANCIO ORTIZ DE LA RENTA MAYAGUEZ -0.16
290 60343 JOSE SEVERO QUIÑONES SAN JUAN -0.16
291 23135 MYRNA M FUENTES CAGUAS -0.16
292 72082 MANUEL MARTINEZ DAVILA ARECIBO -0.17
293 69138 HERMINIA DIAZ APONTE SAN JUAN -0.17
294 46672 ANTONIO BADILLO HERNANDEZ MAYAGUEZ -0.17
295 15446 JOSE C ROSARIO MAYAGUEZ -0.17
296 12401 SU JOSE R BARRERAS BAYAMON -0.17
297 20412 EL FARALLON CAGUAS -0.17
298 66001 DR MODESTO RIVERA RIVERA SAN JUAN -0.17
299 27078 INES MARIA MENDOZA CAGUAS -0.18
300 53512 LUIS MUÑOZ RIVERA PONCE -0.18
301 50609 ROMAN COLON CORREA PONCE -0.18
302 10744 IMBERY ARECIBO -0.18
303 61457 LUIS MUNIZ SOUFFRONT SAN JUAN -0.18
304 56093 LLANOS DEL SUR PONCE -0.19
305 11387 LUIS MELENDEZ RODRIGUEZ ARECIBO -0.19
306 42242 LUIS MUÑOZ RIVERA MAYAGUEZ -0.19
307 61598 ABRAHAM LINCOLN SAN JUAN -0.19
308 53058 PEDRO MELENDEZ SANTIAGO PONCE -0.19
309 26153 DOLORES GONZALEZ CAGUAS -0.19

52
310 71365 VIOLANTA JIMENEZ BAYAMON -0.19
311 40469 SU CONCHITA IGUARTUA DE SUAREZ MAYAGUEZ -0.20
312 71878 SAN VICENTE ARECIBO -0.20
313 34314 EDMUNDO DEL VALLE CRUZ HUMACAO -0.20
314 70870 MANUEL BOU GALI BAYAMON -0.21
315 71530 ALTINENCIA VALLE BAYAMON -0.21
316 70755 ISAAC DEL ROSARIO BAYAMON -0.21
317 43018 JOSE R GAZTAMBIDE MAYAGUEZ -0.21
318 22053 MARGARITA RIVERA DE JANER CAGUAS -0.21
319 70292 JULIO RESSY BAYAMON -0.21
320 71639 DELIA DAVILA DE CABAN BAYAMON -0.21
321 70482 JOSE CAMPECHE BAYAMON -0.22
322 43273 BARTOLOME DE LAS CASAS MAYAGUEZ -0.22
323 71720 ELEMENTAL URBANA ARECIBO -0.22
324 18259 ELEM BO HIGUILLAR (ECOLOGICA) ARECIBO -0.22
325 70557 MAR�A E BAS DE V�ZQUEZ BAYAMON -0.22
326 74807 AGAPITO ROSARIO ROSARIO ARECIBO -0.22
327 62893 JUAN ANTONIO CORRETJER SAN JUAN -0.23
328 70177 JUAN MORELL CAMPOS BAYAMON -0.23
329 74237 COLEEN VAZQUEZ URRUTIA BAYAMON -0.23
330 32763 JAIME C RODRIGUEZ HUMACAO -0.24
331 24950 OSCAR HERNANDEZ GUEVARA CAGUAS -0.24
332 55483 ANGELA CORDERO BERNARD PONCE -0.24
333 42085 SEGUNDO RUIZ BELVIS MAYAGUEZ -0.24
334 30742 SU CLARA M ARAMBURU HUMACAO -0.24
335 24661 JOSE M MASSARI CAGUAS -0.24
336 30304 CANDIDO BERRIOS HUMACAO -0.25
337 48025 AURORA MENDEZ CHARNECO MAYAGUEZ -0.25
338 13342 ANTONIO TULLA TORRES PONCE -0.25
339 61499 RAFAEL RIVERA OTERO SAN JUAN -0.25
340 70136 DR HIRAM GONZALEZ BAYAMON -0.25
341 40477 LUIS MUÑOZ RIVERA MAYAGUEZ -0.26
342 67785 BERWIND ELEMENTAL SAN JUAN -0.26
343 20545 SU LAJITAS (RAMON T RIVERA) CAGUAS -0.26
344 36327 ROBERTO SILVA MORALES HUMACAO -0.26

53
345 61481 PEDRO CARLOS TIMOTHEE SAN JUAN -0.26
346 21212 SU GERARDO SELLES SOLA CAGUAS -0.27
347 22020 SU VIDAL SERRANO CAGUAS -0.27
348 28365 REGINO VEGA MATINEZ CAGUAS -0.28
349 43745 SU MAXIMINO A SALAS MAYAGUEZ -0.28
350 20578 ABELARDO DIAZ MORALES CAGUAS -0.28
351 70540 CARMEN GOMEZ TEJERA BAYAMON -0.28
352 70250 MARTA VELEZ DE FAJARDO BAYAMON -0.28
353 51862 WEBSTER PONCE -0.28
354 48306 SEGUNDA UNIDAD BO PUERTO REAL MAYAGUEZ -0.28
355 57018 AUREA E RIVERA COLLAZO PONCE -0.28
356 21881 SU MARIA C SANTIAGO CAGUAS -0.29
357 35923 ELEMENTAL BARRIO LAS 400 HUMACAO -0.29
358 50781 MAGUEYES II PONCE -0.29
359 75879 JUAN PONCE DE LEON SAN JUAN -0.29
360 71035 SU JULIAN MARRERO BAYAMON -0.29
361 43729 SU BERNALDO MENDEZ JIMENEZ MAYAGUEZ -0.30
362 65557 VILLA GRANADA SAN JUAN -0.30
363 58172 PEDRO COLON SANTIAGO PONCE -0.30
364 55475 JULIO ALVARADO PONCE -0.30
365 77289 ELEMENTAL NUEVA SAN JUAN -0.30
366 10710 JUANITA RAMIREZ GONZALEZ ARECIBO -0.30
367 41004 SU CARMEN VIGNALS ROSARIO MAYAGUEZ -0.31
368 32375 ADRIANNE SERRANO HUMACAO -0.31
369 70425 CRISTOBAL COLON BAYAMON -0.31
370 72090 SU ALMIRANTE NORTE ARECIBO -0.31
371 15453 SU JOSE A VARGAS MAYAGUEZ -0.31
372 11403 EUGENIO MARIA DE HOSTOS ARECIBO -0.32
373 71308 ROSA LUZ ZAYAS BAYAMON -0.32
374 11940 JOSEFINA LINARES ARECIBO -0.32
375 12922 SU LUIS MUÑOZ RIVERA ARECIBO -0.32
376 52365 LUCY GRILLASCA PONCE -0.32
377 10546 SU FEDERICO DEGETAU ARECIBO -0.33
378 20594 NICOLAS AGUAYO ALDEA CAGUAS -0.33
379 62422 ANTONIO SARRIERA EGOZCUE SAN JUAN -0.33

54
380 21493 CLEMENCIA MELENDEZ CAGUAS -0.33
381 71522 JOSE ROBLES OTERO BAYAMON -0.34
382 70367 MARIA VAZQUEZ DE UMPIERRE BAYAMON -0.34
383 26765 SU JOSEFINA SITIRICHE CAGUAS -0.34
384 18291 NUEVA URBANA DE CIALES ARECIBO -0.34
385 35014 SU SILVERIO GARCIA HUMACAO -0.34
386 60418 PEDRO MOCZO BANIET SAN JUAN -0.34
387 31583 LUTGARDA RIVERA REYES HUMACAO -0.35
388 51441 SU ANTONIO ROMERO MUÑIZ PONCE -0.35
389 15396 MATEO HERNANDEZ MAYAGUEZ -0.35
390 54940 ANDRES GRILLASCA SALAS PONCE -0.35
391 32524 MARTA SANCHEZ HUMACAO -0.35
392 63172 ALEJANDRO TAPIA Y RIVERA SAN JUAN -0.35
393 25783 LUIS MUÑOZ MARIN CAGUAS -0.35
394 42812 CUCHILLAS MAYAGUEZ -0.36
395 56077 NORMA I TORRES COLON PONCE -0.36
396 31427 SU HIGINIO FIGUEROA VILLEGAS HUMACAO -0.36
397 52084 DR JOSE C BARBOSA PONCE -0.36
398 22327 LUIS MUÑOZ RIVERA HUMACAO -0.36
399 36350 FERMIN DELGADO DIAZ HUMACAO -0.36
400 71548 JOSE NEVAREZ LOPEZ BAYAMON -0.36
401 60095 EL CONQUISTADOR SAN JUAN -0.37
402 32714 CRISTOBAL DEL CAMPO HUMACAO -0.37
403 63024 MANUEL ELZABURU Y VIZCARRONDO SAN JUAN -0.37
404 46813 LYDIA MELENDEZ MAYAGUEZ -0.37
405 50120 ELEMENTAL URBANA NUEVA MAYAGUEZ -0.37
406 18267 JOSE PAGAN DE JESUS ARECIBO -0.38
407 71076 JACINTO LOPEZ MARTINEZ ARECIBO -0.38
408 62521 FELIPE GUTIERREZ SAN JUAN -0.38
409 12369 JORGE L MARRERO PADILLA BAYAMON -0.38
410 63081 LUIS LLORENS TORRES SAN JUAN -0.39
411 50757 JOSE RODRIGUEZ SOTO PONCE -0.39
412 51458 SU ANTONIA SERRANO GONZALEZ PONCE -0.39
413 13912 NUEVA BRIGIDA ALVAREZ RODRIGUEZ ARECIBO -0.39
414 32458 SU ROGELIO ROSADO HUMACAO -0.39
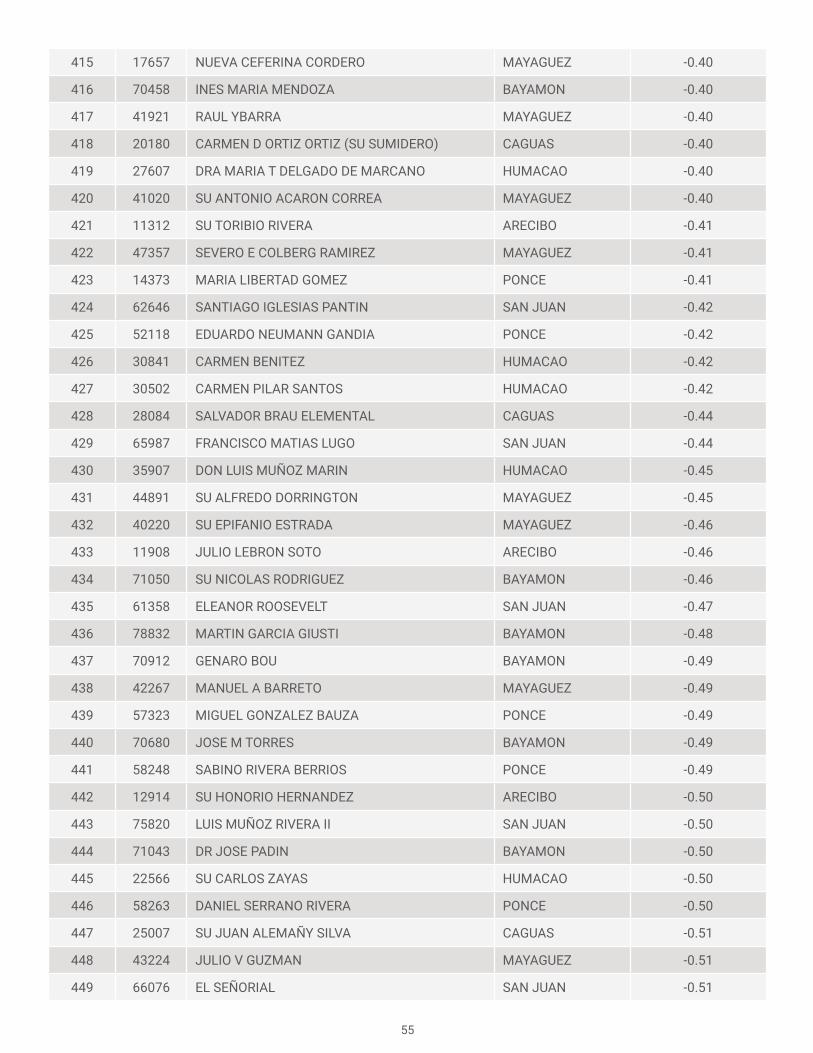
55
415 17657 NUEVA CEFERINA CORDERO MAYAGUEZ -0.40
416 70458 INES MARIA MENDOZA BAYAMON -0.40
417 41921 RAUL YBARRA MAYAGUEZ -0.40
418 20180 CARMEN D ORTIZ ORTIZ (SU SUMIDERO) CAGUAS -0.40
419 27607 DRA MARIA T DELGADO DE MARCANO HUMACAO -0.40
420 41020 SU ANTONIO ACARON CORREA MAYAGUEZ -0.40
421 11312 SU TORIBIO RIVERA ARECIBO -0.41
422 47357 SEVERO E COLBERG RAMIREZ MAYAGUEZ -0.41
423 14373 MARIA LIBERTAD GOMEZ PONCE -0.41
424 62646 SANTIAGO IGLESIAS PANTIN SAN JUAN -0.42
425 52118 EDUARDO NEUMANN GANDIA PONCE -0.42
426 30841 CARMEN BENITEZ HUMACAO -0.42
427 30502 CARMEN PILAR SANTOS HUMACAO -0.42
428 28084 SALVADOR BRAU ELEMENTAL CAGUAS -0.44
429 65987 FRANCISCO MATIAS LUGO SAN JUAN -0.44
430 35907 DON LUIS MUÑOZ MARIN HUMACAO -0.45
431 44891 SU ALFREDO DORRINGTON MAYAGUEZ -0.45
432 40220 SU EPIFANIO ESTRADA MAYAGUEZ -0.46
433 11908 JULIO LEBRON SOTO ARECIBO -0.46
434 71050 SU NICOLAS RODRIGUEZ BAYAMON -0.46
435 61358 ELEANOR ROOSEVELT SAN JUAN -0.47
436 78832 MARTIN GARCIA GIUSTI BAYAMON -0.48
437 70912 GENARO BOU BAYAMON -0.49
438 42267 MANUEL A BARRETO MAYAGUEZ -0.49
439 57323 MIGUEL GONZALEZ BAUZA PONCE -0.49
440 70680 JOSE M TORRES BAYAMON -0.49
441 58248 SABINO RIVERA BERRIOS PONCE -0.49
442 12914 SU HONORIO HERNANDEZ ARECIBO -0.50
443 75820 LUIS MUÑOZ RIVERA II SAN JUAN -0.50
444 71043 DR JOSE PADIN BAYAMON -0.50
445 22566 SU CARLOS ZAYAS HUMACAO -0.50
446 58263 DANIEL SERRANO RIVERA PONCE -0.50
447 25007 SU JUAN ALEMAÑY SILVA CAGUAS -0.51
448 43224 JULIO V GUZMAN MAYAGUEZ -0.51
449 66076 EL SEÑORIAL SAN JUAN -0.51

56
450 58081 DOMINGO PIETRI RUIZ PONCE -0.52
451 43505 AUREA FUENTES MENDEZ MAYAGUEZ -0.52
452 35899 WILFREDO LAFUENTE ORTIZ HUMACAO -0.52
453 61408 JUAN B HUYKE SAN JUAN -0.53
454 64279 INSTITUTO LOAIZA CORDERO SAN JUAN -0.53
455 41699 DR SILVERIO MEDINA GAUD MAYAGUEZ -0.53
456 58255 FRANCISCO PRADO PICART PONCE -0.53
457 70599 FAUSTINO SANTIAGO BAYAMON -0.53
458 24760 VICENTE PALES ANES CAGUAS -0.54
459 10272 EUGENIO MARIA DE HOSTOS ARECIBO -0.54
460 54866 DR ALFREDO M AGUAYO PONCE -0.54
461 23143 CONCEPCION MENDEZ CANO CAGUAS -0.55
462 42259 OLGA MAS RAMIREZ MAYAGUEZ -0.55
463 60400 PASCASIO P SANCERRIT SAN JUAN -0.56
464 30759 SU PEDRO RIVERA MOLINA HUMACAO -0.56
465 70664 HERMINIA RIVERA FERNANDEZ BAYAMON -0.56
466 62661 AMALIA MARIN SAN JUAN -0.57
467 75234 SILVESTRE MARTINEZ BAYAMON -0.58
468 10512 SU MANUEL RUIZ GANDIA ARECIBO -0.59
469 76257 NUEVA ESCUELA SU ANTONIO RIVERA BAYAMON -0.59
470 35048 GEORGINA BAQUERO HUMACAO -0.59
471 24927 RAFAEL ANTONIO DELGADO MATEO CAGUAS -0.60
472 25197 GUILLERMO RIEFKHOL HUMACAO -0.60
473 46052 RAMON E RODRIGUEZ DIAZ MAYAGUEZ -0.61
474 52704 JULIO COLLAZO SILVA PONCE -0.61
475 62604 MANUEL A PEREZ SAN JUAN -0.62
476 47571 RIO CAÑAS ABAJO MAYAGUEZ -0.62
477 70334 SU CACIQUE MAJAGUA BAYAMON -0.62
478 31534 MANUEL ORTIZ SUYA HUMACAO -0.63
479 54288 ERNESTO RAMOS ANTONINI PONCE -0.64
480 35972 JORGE ROSARIO DEL VALLE HUMACAO -0.64
481 64527 GUSTAVO A BECQUER SAN JUAN -0.64
482 78956 FRANCISCO LOPEZ CRUZ BAYAMON -0.64
483 71704 FRANCISCA DAVILA SEMPRIT BAYAMON -0.65
484 51433 SU NEMESIO R CANALES PONCE -0.65

57
485 20784 JESUS T PIÑERO CAGUAS -0.65
486 17749 SU BARRIO SABANA HOYOS (NUEVA) ARECIBO -0.65
487 22459 SU JAGUAL ADENTRO HUMACAO -0.65
488 71340 SU ADOLFO GARCIA BAYAMON -0.66
489 70904 FIDEL LOPEZ COLON BAYAMON -0.66
490 32433 SU ASUNCION LUGO HUMACAO -0.66
491 34199 SU AGAPITO LOPEZ FLORES HUMACAO -0.66
492 51375 MIGUEL A SASTRE OLIVER PONCE -0.66
493 61432 LAS AMERICAS SAN JUAN -0.68
494 31054 ANTONIO R BARCELO HUMACAO -0.68
495 47977 EUGENIO MARIA DE HOSTOS (INTERMEDIA) MAYAGUEZ -0.68
496 30643 PEDRO BOSCH HUMACAO -0.68
497 13391 BERNARDO GONZALEZ COLON PONCE -0.72
498 45955 ELPIDIO H RIVERA MAYAGUEZ -0.73
499 31286 DR PEDRO ALBIZU CAMPOS HUMACAO -0.73
500 62943 SU DR ARTURO MORALES CARRION SAN JUAN -0.73
501 34777 JOSE A LOPEZ CASTRO HUMACAO -0.74
502 50229 HECTOR I RIVERA PONCE -0.76
503 31070 JOSE CALZADA FERRER HUMACAO -0.76
504 32680 SU ANDRES SANDIN HUMACAO -0.77
505 31252 JOBOS HUMACAO -0.78
506 69054 JOSE F DIAZ SAN JUAN -0.79
507 65078 JESUS MARIA SANROMA SAN JUAN -0.79
508 62901 INES MARIA MENDOZA SAN JUAN -0.79
509 65946 NEMESIO R CANALES I SAN JUAN -0.80
510 63099 LUIS RODRIGUEZ CABRERO SAN JUAN -0.80
511 66225 CARMEN GOMEZ TEJERA SAN JUAN -0.81
512 44545 MARIA DOLORES FARIA MAYAGUEZ -0.81
513 71290 BERNARDA ROBLES DE HEVIA BAYAMON -0.82
514 35840 MARIA M SIMMONS DE RIVERA HUMACAO -0.83
515 71357 SU PEDRO FERNANDEZ BAYAMON -0.85
516 53686 SU JAIME CASTAÑER PONCE -0.88
517 32367 PLAYA GRANDE HUMACAO -0.93
518 70672 ANDRES C GONZALEZ BAYAMON -0.97

58
Table B-2
List of schools with estimated value-added for the junior high level
Ranking Code School Name RegionJunior High Value-added
1 20537 SU LA LOMA (ANTONIO VAZQUEZ RAMOS) CAGUAS 1.81
2 12336 RAMON TORRES RIVERA BAYAMON 1.48
3 20735 DIEGO VAZQUEZ CAGUAS 1.37
4 12740 ANGEL RAFAEL DIAZ COLON BAYAMON 1.28
5 10439 DR CAYETANO COLL Y TOSTE ARECIBO 1.05
6 21873 SU OSCAR PORRATA DORIA CAGUAS 1.05
7 11031 SU SANTIAGO R PALMER ARECIBO 0.88
8 17871 NELIDA MELENDEZ MELENDEZ BAYAMON 0.83
9 61556 EVARISTO RIVERA CHEVREMONT SAN JUAN 0.82
10 60038 JULIAN E BLANCO (BALLET) SAN JUAN 0.74
11 21550 JESUS T PIÑERO CAGUAS 0.73
12 20719 JOSE MERCADO CAGUAS 0.66
13 32540 SU MANUEL ORTIZ HUMACAO 0.64
14 71068 SU DEMETRIO RIVERA BAYAMON 0.59
15 12724 SU ANA JOAQUINA ORTIZ ORTIZ BAYAMON 0.58
16 21576 EDUCACION BILINGUE LUIS MUÑOZ IGLESIAS CAGUAS 0.57
17 53470 ERNESTO RAMOS ANTONINI PONCE 0.56
18 28456 INTERMEDIA BO QUEBRADILLAS CAGUAS 0.54
19 24786 GENARO CAUTIÑO CAGUAS 0.50
20 10637 ANGELICA GOMEZ DE BETANCOURT ARECIBO 0.50
21 25023 MARIA DAVILA SEMIDEY HUMACAO 0.50
22 55350 FLORENCIO SANTIAGO PONCE 0.49
23 12518 SU BONIFACIO ALVARADO BAYAMON 0.46
24 77552 PAPA JUAN XXIII BAYAMON 0.45
25 20404 PETROAMERICA PAGAN CAGUAS 0.44
26 17889 JAIME COIRA ORTIZ ARECIBO 0.44
27 12716 SU BOTIJAS I BAYAMON 0.43
28 13912 NUEVA BRIGIDA ALVAREZ RODRIGUEZ ARECIBO 0.43
29 40030 SU JUAN B SOTO MAYAGUEZ 0.43
30 70250 MARTA VELEZ DE FAJARDO BAYAMON 0.42
31 41814 SU LAURO GONZALEZ HIJO MAYAGUEZ 0.41

59
32 43745 SU MAXIMINO A SALAS MAYAGUEZ 0.40
33 40519 ESCUELA ESPECIALIZADA ALCIDES FIGUEROA MAYAGUEZ 0.40
34 40667 ISABEL SUAREZ MAYAGUEZ 0.39
35 40469 SU CONCHITA IGUARTUA DE SUAREZ MAYAGUEZ 0.38
36 33225 FIDELINA MELENDEZ MONSANTO HUMACAO 0.38
37 25239 SU JOAQUIN PARRILLA HUMACAO 0.37
38 66316 SOTERO FIGUEROA SAN JUAN 0.36
39 34348 JOSEFINA FERRERO HUMACAO 0.35
40 60343 JOSE SEVERO QUIÑONES SAN JUAN 0.34
41 62893 JUAN ANTONIO CORRETJER SAN JUAN 0.34
42 20255 RAFAEL PONT FLORES CAGUAS 0.33
43 11312 SU TORIBIO RIVERA ARECIBO 0.33
44 10322 SU ENRIQUE DE JESUS BORRAS ARECIBO 0.33
45 71472 MANUEL VELILLA BAYAMON 0.33
46 13318 JOSE VIZCARRONDO PONCE 0.32
47 21493 CLEMENCIA MELENDEZ CAGUAS 0.32
48 23598 GERARDO SELLES SOLA CAGUAS 0.31
49 51458 SU ANTONIA SERRANO GONZALEZ PONCE 0.31
50 60301 EDUARDO J SALDAÑA SAN JUAN 0.31
51 56101 MANUEL GONZALEZ PATO PONCE 0.30
52 42945 MANUEL GONZALEZ MELO MAYAGUEZ 0.30
53 58099 PROFESORA LUIZA MONSEGUR VELEZ PONCE 0.30
54 25312 SIMON MADERA CAGUAS 0.28
55 61671 JOSE JULIAN ACOSTA (TEATRO) SAN JUAN 0.26
56 43752 SU CARMELO SERRANO CUBANO MAYAGUEZ 0.26
57 52142 HEMETERIO COLON PONCE 0.24
58 18184 NUEVA INTERMEDIA ARECIBO 0.23
59 51870 RAFAEL IRIZARRY RIVERA PONCE 0.23
60 64998 LCDO GUILLERMO ATILES MOREAU SAN JUAN 0.22
61 20339 SU CARMEN ZENAIDA VEGA (LA PLATA) CAGUAS 0.22
62 42952 SU DAVID ANTONGIORGI CORDOVA MAYAGUEZ 0.22
63 17186 ANGEL G. QUINTERO BAYAMON 0.22
64 45393 BLANCA MALARET MAYAGUEZ 0.22
65 21352 SU EUGENIO MARIA DE HOSTOS CAGUAS 0.19
66 28548 VIOLETA REYES PEREZ CAGUAS 0.19

60
67 40220 SU EPIFANIO ESTRADA MAYAGUEZ 0.18
68 12666 SU MATRULLAS BAYAMON 0.18
69 51797 SU ZOILO GRACIA PONCE 0.18
70 40980 PEDRO NELSON COLBERG MAYAGUEZ 0.18
71 58172 PEDRO COLON SANTIAGO PONCE 0.18
72 47951 PROFESORA JUANA ROSARIO CARRERO MAYAGUEZ 0.17
73 52050 FERNANDO L MALAVE OLIVERAS PONCE 0.17
74 41541 LUIS MUÑOZ RIVERA MAYAGUEZ 0.16
75 41012 SU FEDERICO DEGETAU MAYAGUEZ 0.16
76 17749 SU BARRIO SABANA HOYOS (NUEVA) ARECIBO 0.16
77 20776 ANTONIO S PEDREIRA (PRE-TEC) CAGUAS 0.15
78 26005 LUIS MUÑOZ MARIN CAGUAS 0.15
79 12922 SU LUIS MUÑOZ RIVERA ARECIBO 0.15
80 17111 LUIS MUÑOZ MARIN ARECIBO 0.15
81 13342 ANTONIO TULLA TORRES PONCE 0.15
82 53686 SU JAIME CASTAÑER PONCE 0.15
83 42267 MANUEL A BARRETO MAYAGUEZ 0.15
84 47084 ESTEBAN ROSADO BAEZ MAYAGUEZ 0.14
85 75879 JUAN PONCE DE LEON SAN JUAN 0.14
86 27540 DR PEDRO ALBIZU CAMPOS CAGUAS 0.14
87 52621 ISMAEL MALDONADO LUGARO PONCE 0.14
88 17764 LEONARDO VALENTIN TIRADO ARECIBO 0.13
89 62968 VILLA CAPRI SAN JUAN 0.12
90 71530 ALTINENCIA VALLE BAYAMON 0.11
91 37507 ECOLOGICA DE CULEBRA HUMACAO 0.11
92 21659 SU JUAN STUBBE CAGUAS 0.11
93 51946 RAMON PEREZ PURCELL PONCE 0.10
94 57877 DR MAXIMO DONOSO SANCHEZ PONCE 0.10
95 22020 SU VIDAL SERRANO CAGUAS 0.09
96 25619 FELIPE RIVERA CENTENO CAGUAS 0.09
97 61747 PADRE RUFO (BILINGÜE) SAN JUAN 0.09
98 20321 SU JOSE CELSO BARBOSA CAGUAS 0.09
99 52522 DR RAFAEL PUJALS PONCE 0.09
100 15453 SU JOSE A VARGAS MAYAGUEZ 0.09
101 11502 TIMOTEO DELGADO ARECIBO 0.08

61
102 13391 BERNARDO GONZALEZ COLON PONCE 0.08
103 10512 SU MANUEL RUIZ GANDIA ARECIBO 0.07
104 13334 SU MARTA LAFONTAINE PONCE 0.07
105 41020 SU ANTONIO ACARON CORREA MAYAGUEZ 0.07
106 15917 RAMON DE JESUS SIERRA ARECIBO 0.07
107 11023 ANTONIO REYES ARECIBO 0.07
108 63032 FEDERICO ASENJO (PRE-TECNICA) SAN JUAN 0.06
109 76349 SU FRANCISCO FELICIE MARTINEZ ARECIBO 0.06
110 22772 ESPECIALIZADA DE BELLAS ARTES CAGUAS 0.06
111 27607 DRA MARIA T DELGADO DE MARCANO HUMACAO 0.06
112 51433 SU NEMESIO R CANALES PONCE 0.06
113 61572 CENTRAL ARTES VISUALES SAN JUAN 0.05
114 52118 EDUARDO NEUMANN GANDIA PONCE 0.05
115 41004 SU CARMEN VIGNALS ROSARIO MAYAGUEZ 0.04
116 43406 LAURA MERCADO MAYAGUEZ 0.04
117 58164 GLORIA MARIA BORRERO OLIVERAS PONCE 0.04
118 47977 EUGENIO MARIA DE HOSTOS (INTERMEDIA) MAYAGUEZ 0.03
119 50492 BENJAMIN FRANKLIN PONCE 0.03
120 11387 LUIS MELENDEZ RODRIGUEZ ARECIBO 0.03
121 33704 JUAN PONCE DE LEON HUMACAO 0.03
122 11756 LUIS FELIPE RODRIGUEZ GARCIA ARECIBO 0.03
123 11593 GABRIELA MISTRAL ARECIBO 0.03
124 12245 FRANCISCO RIVERA CLAUDIO BAYAMON 0.03
125 47571 RIO CAÑAS ABAJO MAYAGUEZ 0.03
126 50443 SU EUGENIO NAZARIO SOTO PONCE 0.03
127 74864 ABELARDO DIAZ ALFARO BAYAMON 0.02
128 10272 EUGENIO MARIA DE HOSTOS ARECIBO 0.02
129 75804 JUAN E MIRANDA SAN JUAN 0.02
130 57000 JOSE ONOFRE TORRES PONCE 0.02
131 21022 SU SANDALIO MARCANO CAGUAS 0.01
132 32227 LIBERATA IRALDO (NUEVA) HUMACAO 0.01
133 25007 SU JUAN ALEMAÑY SILVA CAGUAS 0.01
134 76562 CRISTOBAL SANTANA MELECIO (NUEVA) ARECIBO 0.01
135 13151 FRANCISCO RAMOS SANCHEZ PONCE 0.01
136 67934 BERWIND INTERMEDIA SAN JUAN 0.00
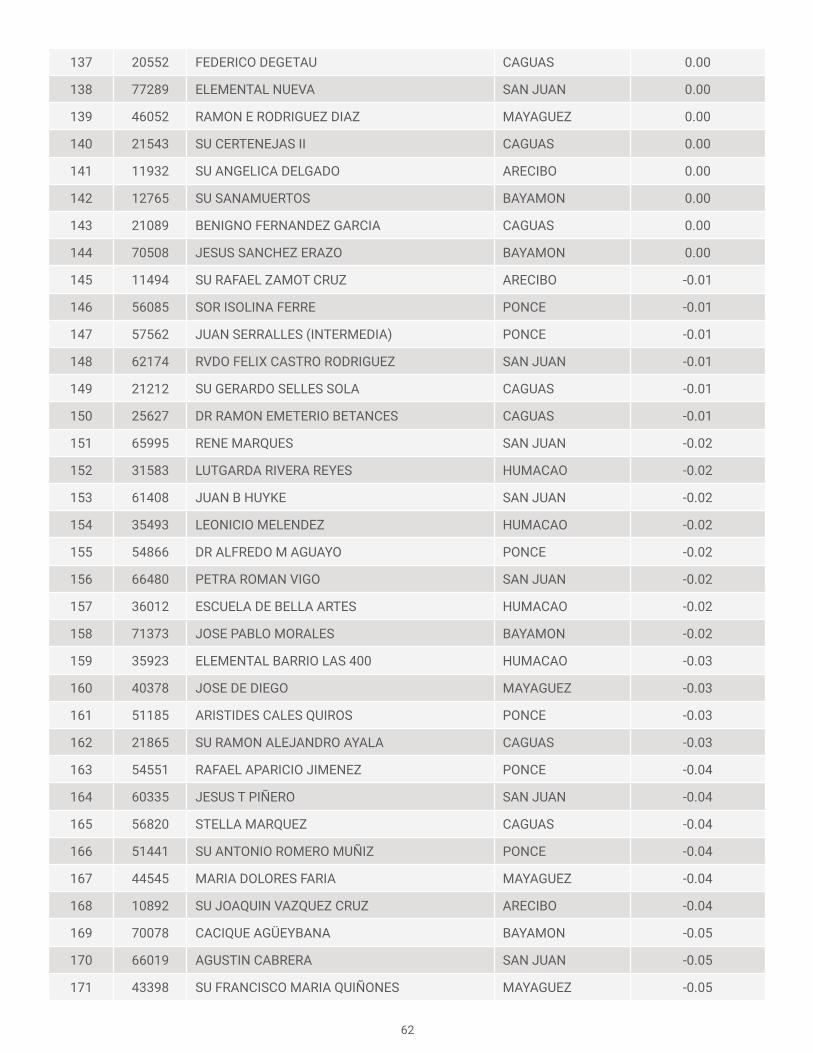
62
137 20552 FEDERICO DEGETAU CAGUAS 0.00
138 77289 ELEMENTAL NUEVA SAN JUAN 0.00
139 46052 RAMON E RODRIGUEZ DIAZ MAYAGUEZ 0.00
140 21543 SU CERTENEJAS II CAGUAS 0.00
141 11932 SU ANGELICA DELGADO ARECIBO 0.00
142 12765 SU SANAMUERTOS BAYAMON 0.00
143 21089 BENIGNO FERNANDEZ GARCIA CAGUAS 0.00
144 70508 JESUS SANCHEZ ERAZO BAYAMON 0.00
145 11494 SU RAFAEL ZAMOT CRUZ ARECIBO -0.01
146 56085 SOR ISOLINA FERRE PONCE -0.01
147 57562 JUAN SERRALLES (INTERMEDIA) PONCE -0.01
148 62174 RVDO FELIX CASTRO RODRIGUEZ SAN JUAN -0.01
149 21212 SU GERARDO SELLES SOLA CAGUAS -0.01
150 25627 DR RAMON EMETERIO BETANCES CAGUAS -0.01
151 65995 RENE MARQUES SAN JUAN -0.02
152 31583 LUTGARDA RIVERA REYES HUMACAO -0.02
153 61408 JUAN B HUYKE SAN JUAN -0.02
154 35493 LEONICIO MELENDEZ HUMACAO -0.02
155 54866 DR ALFREDO M AGUAYO PONCE -0.02
156 66480 PETRA ROMAN VIGO SAN JUAN -0.02
157 36012 ESCUELA DE BELLA ARTES HUMACAO -0.02
158 71373 JOSE PABLO MORALES BAYAMON -0.02
159 35923 ELEMENTAL BARRIO LAS 400 HUMACAO -0.03
160 40378 JOSE DE DIEGO MAYAGUEZ -0.03
161 51185 ARISTIDES CALES QUIROS PONCE -0.03
162 21865 SU RAMON ALEJANDRO AYALA CAGUAS -0.03
163 54551 RAFAEL APARICIO JIMENEZ PONCE -0.04
164 60335 JESUS T PIÑERO SAN JUAN -0.04
165 56820 STELLA MARQUEZ CAGUAS -0.04
166 51441 SU ANTONIO ROMERO MUÑIZ PONCE -0.04
167 44545 MARIA DOLORES FARIA MAYAGUEZ -0.04
168 10892 SU JOAQUIN VAZQUEZ CRUZ ARECIBO -0.04
169 70078 CACIQUE AGÜEYBANA BAYAMON -0.05
170 66019 AGUSTIN CABRERA SAN JUAN -0.05
171 43398 SU FRANCISCO MARIA QUIÑONES MAYAGUEZ -0.05
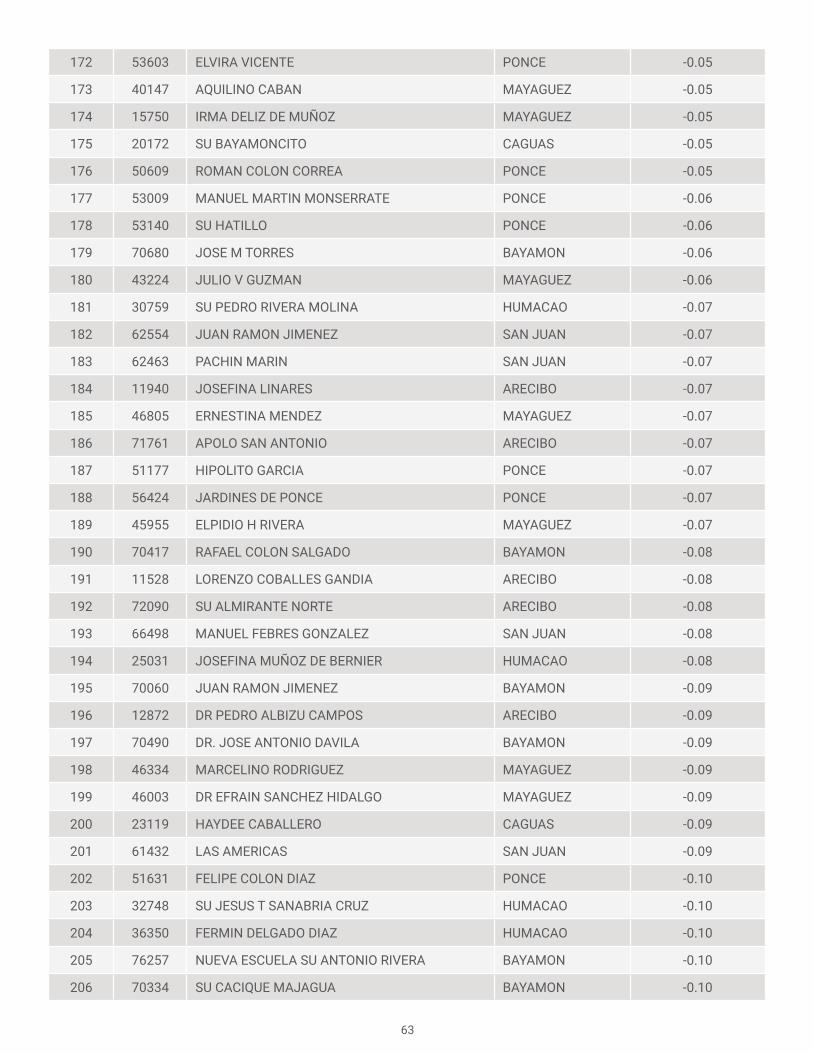
63
172 53603 ELVIRA VICENTE PONCE -0.05
173 40147 AQUILINO CABAN MAYAGUEZ -0.05
174 15750 IRMA DELIZ DE MUÑOZ MAYAGUEZ -0.05
175 20172 SU BAYAMONCITO CAGUAS -0.05
176 50609 ROMAN COLON CORREA PONCE -0.05
177 53009 MANUEL MARTIN MONSERRATE PONCE -0.06
178 53140 SU HATILLO PONCE -0.06
179 70680 JOSE M TORRES BAYAMON -0.06
180 43224 JULIO V GUZMAN MAYAGUEZ -0.06
181 30759 SU PEDRO RIVERA MOLINA HUMACAO -0.07
182 62554 JUAN RAMON JIMENEZ SAN JUAN -0.07
183 62463 PACHIN MARIN SAN JUAN -0.07
184 11940 JOSEFINA LINARES ARECIBO -0.07
185 46805 ERNESTINA MENDEZ MAYAGUEZ -0.07
186 71761 APOLO SAN ANTONIO ARECIBO -0.07
187 51177 HIPOLITO GARCIA PONCE -0.07
188 56424 JARDINES DE PONCE PONCE -0.07
189 45955 ELPIDIO H RIVERA MAYAGUEZ -0.07
190 70417 RAFAEL COLON SALGADO BAYAMON -0.08
191 11528 LORENZO COBALLES GANDIA ARECIBO -0.08
192 72090 SU ALMIRANTE NORTE ARECIBO -0.08
193 66498 MANUEL FEBRES GONZALEZ SAN JUAN -0.08
194 25031 JOSEFINA MUÑOZ DE BERNIER HUMACAO -0.08
195 70060 JUAN RAMON JIMENEZ BAYAMON -0.09
196 12872 DR PEDRO ALBIZU CAMPOS ARECIBO -0.09
197 70490 DR. JOSE ANTONIO DAVILA BAYAMON -0.09
198 46334 MARCELINO RODRIGUEZ MAYAGUEZ -0.09
199 46003 DR EFRAIN SANCHEZ HIDALGO MAYAGUEZ -0.09
200 23119 HAYDEE CABALLERO CAGUAS -0.09
201 61432 LAS AMERICAS SAN JUAN -0.09
202 51631 FELIPE COLON DIAZ PONCE -0.10
203 32748 SU JESUS T SANABRIA CRUZ HUMACAO -0.10
204 36350 FERMIN DELGADO DIAZ HUMACAO -0.10
205 76257 NUEVA ESCUELA SU ANTONIO RIVERA BAYAMON -0.10
206 70334 SU CACIQUE MAJAGUA BAYAMON -0.10

64
207 12401 SU JOSE R BARRERAS BAYAMON -0.10
208 70201 PABLO CASALS BAYAMON -0.10
209 71217 MERCEDES ROSADO BAYAMON -0.11
210 14241 TRINA PADILLA DE SANZ ARECIBO -0.11
211 32532 ROSA COSTA VALDIVIESO HUMACAO -0.12
212 41921 RAUL YBARRA MAYAGUEZ -0.12
213 34462 INTERMEDIA NUEVA HUMACAO -0.12
214 50757 JOSE RODRIGUEZ SOTO PONCE -0.12
215 58248 SABINO RIVERA BERRIOS PONCE -0.12
216 70573 MARIANO FELIU BALSEIRO BAYAMON -0.13
217 20909 LUIS RAMOS GONZALEZ CAGUAS -0.13
218 62646 SANTIAGO IGLESIAS PANTIN SAN JUAN -0.13
219 50740 AGRIPINA SEDA PONCE -0.13
220 64402 ERNESTO RAMOS ANTONINI (MUSICA) SAN JUAN -0.14
221 62943 SU DR ARTURO MORALES CARRION SAN JUAN -0.14
222 43729 SU BERNALDO MENDEZ JIMENEZ MAYAGUEZ -0.14
223 65557 VILLA GRANADA SAN JUAN -0.14
224 56440 EUGENIO LE COMPTE BENITEZ PONCE -0.14
225 69039 ANDRES VALCARCEL SAN JUAN -0.15
226 27318 FRANCISCO GARCIA BOYRIE CAGUAS -0.15
227 58123 SU SABANA LLANA CAGUAS -0.15
228 26336 ADELA BRENES TEXIDOR CAGUAS -0.15
229 17418 NUEVA JUAN S MARCHAND ARECIBO -0.15
230 71340 SU ADOLFO GARCIA BAYAMON -0.15
231 20180 CARMEN D ORTIZ ORTIZ (SU SUMIDERO) CAGUAS -0.15
232 44891 SU ALFREDO DORRINGTON MAYAGUEZ -0.15
233 30148 ANTONIO VALERO BERNABE HUMACAO -0.15
234 31054 ANTONIO R BARCELO HUMACAO -0.16
235 71886 ANGEL SANDIN MARTINEZ ARECIBO -0.16
236 70870 MANUEL BOU GALI BAYAMON -0.16
237 10546 SU FEDERICO DEGETAU ARECIBO -0.16
238 26492 ANTONIO DOMINGUEZ NIEVES CAGUAS -0.17
239 12914 SU HONORIO HERNANDEZ ARECIBO -0.17
240 71357 SU PEDRO FERNANDEZ BAYAMON -0.17
241 50229 HECTOR I RIVERA PONCE -0.17

65
242 73668 MERCEDES GARCIA DE COLORADO BAYAMON -0.17
243 58255 FRANCISCO PRADO PICART PONCE -0.17
244 53058 PEDRO MELENDEZ SANTIAGO PONCE -0.18
245 32979 ALFONSO DIAZ LEBRON HUMACAO -0.18
246 31302 RAFAEL N COCA HUMACAO -0.18
247 22012 MATIAS GONZALEZ GARCIA CAGUAS -0.19
248 34272 GULLERMINA ROSADO DE AYALA HUMACAO -0.19
249 46664 ESTER FELICIANO MENDOZA MAYAGUEZ -0.19
250 70284 FRANCISCO MANRIQUE CABRERA BAYAMON -0.19
251 18259 ELEM BO HIGUILLAR (ECOLOGICA) ARECIBO -0.19
252 71043 DR JOSE PADIN BAYAMON -0.19
253 22566 SU CARLOS ZAYAS HUMACAO -0.19
254 30643 PEDRO BOSCH HUMACAO -0.19
255 23309 GENEROSO MORALES MUÑOZ HUMACAO -0.20
256 51938 SU JORGE LUCAS VALDIVIESO PONCE -0.21
257 42176 JOSE GAUTIER BENITEZ MAYAGUEZ -0.21
258 35899 WILFREDO LAFUENTE ORTIZ HUMACAO -0.21
259 35972 JORGE ROSARIO DEL VALLE HUMACAO -0.21
260 61705 RAFAEL MARIA DE LABRA SAN JUAN -0.21
261 20594 NICOLAS AGUAYO ALDEA CAGUAS -0.21
262 35964 CARMEN FELICIANO CARRERA HUMACAO -0.21
263 21881 SU MARIA C SANTIAGO CAGUAS -0.21
264 35295 20 DE SEPTIEMBRE DE 1988 HUMACAO -0.22
265 24810 DR RAFAEL LOPEZ LANDRON CAGUAS -0.22
266 74237 COLEEN VAZQUEZ URRUTIA BAYAMON -0.22
267 70805 ONOFRE CARBALLEIRA BAYAMON -0.22
268 71654 BASILIO MILAN HERNANDEZ BAYAMON -0.22
269 61564 WILLIAM D BOYCE SAN JUAN -0.22
270 61663 DR JOSE CELSO BARBOSA SAN JUAN -0.22
271 69054 JOSE F DIAZ SAN JUAN -0.22
272 73650 PEDRO P CASABLANCA BAYAMON -0.22
273 62901 INES MARIA MENDOZA SAN JUAN -0.23
274 51763 LUIS MUÑOZ MARIN PONCE -0.23
275 62422 ANTONIO SARRIERA EGOZCUE SAN JUAN -0.24
276 54429 INTERMEDIA TALLABOA ALTA PONCE -0.24
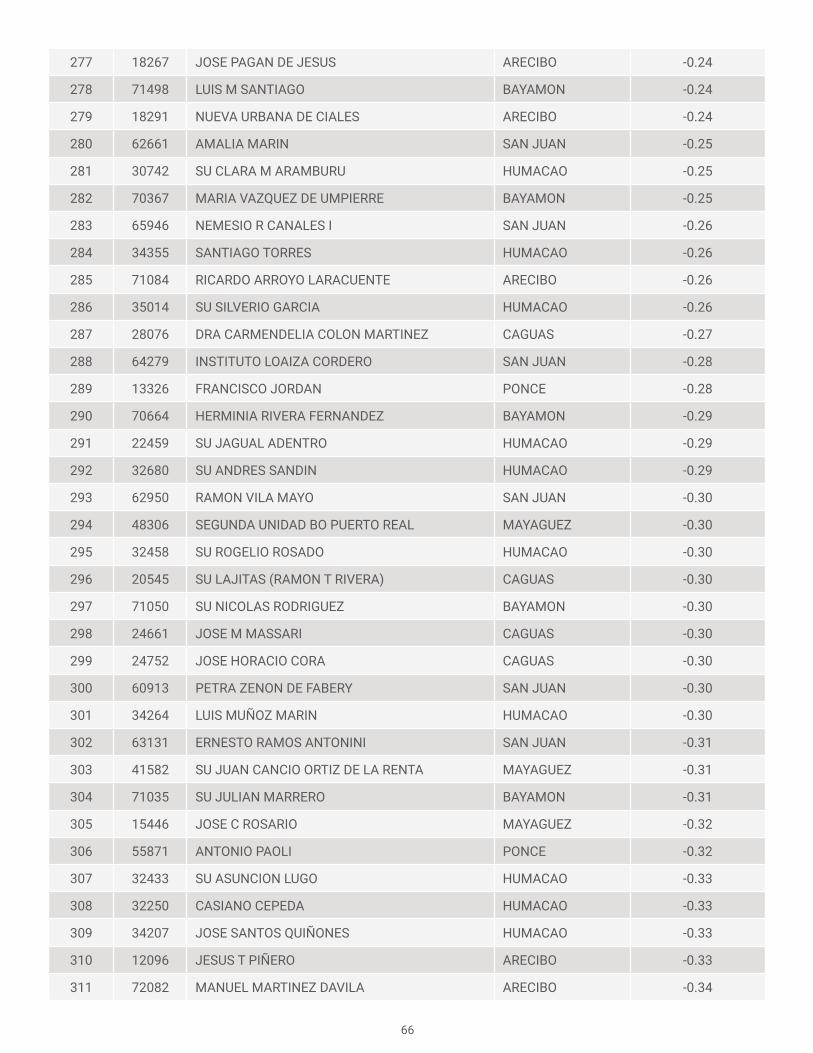
66
277 18267 JOSE PAGAN DE JESUS ARECIBO -0.24
278 71498 LUIS M SANTIAGO BAYAMON -0.24
279 18291 NUEVA URBANA DE CIALES ARECIBO -0.24
280 62661 AMALIA MARIN SAN JUAN -0.25
281 30742 SU CLARA M ARAMBURU HUMACAO -0.25
282 70367 MARIA VAZQUEZ DE UMPIERRE BAYAMON -0.25
283 65946 NEMESIO R CANALES I SAN JUAN -0.26
284 34355 SANTIAGO TORRES HUMACAO -0.26
285 71084 RICARDO ARROYO LARACUENTE ARECIBO -0.26
286 35014 SU SILVERIO GARCIA HUMACAO -0.26
287 28076 DRA CARMENDELIA COLON MARTINEZ CAGUAS -0.27
288 64279 INSTITUTO LOAIZA CORDERO SAN JUAN -0.28
289 13326 FRANCISCO JORDAN PONCE -0.28
290 70664 HERMINIA RIVERA FERNANDEZ BAYAMON -0.29
291 22459 SU JAGUAL ADENTRO HUMACAO -0.29
292 32680 SU ANDRES SANDIN HUMACAO -0.29
293 62950 RAMON VILA MAYO SAN JUAN -0.30
294 48306 SEGUNDA UNIDAD BO PUERTO REAL MAYAGUEZ -0.30
295 32458 SU ROGELIO ROSADO HUMACAO -0.30
296 20545 SU LAJITAS (RAMON T RIVERA) CAGUAS -0.30
297 71050 SU NICOLAS RODRIGUEZ BAYAMON -0.30
298 24661 JOSE M MASSARI CAGUAS -0.30
299 24752 JOSE HORACIO CORA CAGUAS -0.30
300 60913 PETRA ZENON DE FABERY SAN JUAN -0.30
301 34264 LUIS MUÑOZ MARIN HUMACAO -0.30
302 63131 ERNESTO RAMOS ANTONINI SAN JUAN -0.31
303 41582 SU JUAN CANCIO ORTIZ DE LA RENTA MAYAGUEZ -0.31
304 71035 SU JULIAN MARRERO BAYAMON -0.31
305 15446 JOSE C ROSARIO MAYAGUEZ -0.32
306 55871 ANTONIO PAOLI PONCE -0.32
307 32433 SU ASUNCION LUGO HUMACAO -0.33
308 32250 CASIANO CEPEDA HUMACAO -0.33
309 34207 JOSE SANTOS QUIÑONES HUMACAO -0.33
310 12096 JESUS T PIÑERO ARECIBO -0.33
311 72082 MANUEL MARTINEZ DAVILA ARECIBO -0.34

67
312 75739 ROSALINA C MARTINEZ SAN JUAN -0.35
313 13359 INOCENCIO MONTERO PONCE -0.35
314 31427 SU HIGINIO FIGUEROA VILLEGAS HUMACAO -0.35
315 33662 CARLOS RIVERA UFRET HUMACAO -0.36
316 20214 SU PASTO CAGUAS -0.36
317 78832 MARTIN GARCIA GIUSTI BAYAMON -0.37
318 71704 FRANCISCA DAVILA SEMPRIT BAYAMON -0.38
319 36046 SU NUEVA BO MEDIANIA HUMACAO -0.38
320 46672 ANTONIO BADILLO HERNANDEZ MAYAGUEZ -0.38
321 61655 DR FACUNDO BUESO SAN JUAN -0.38
322 54288 ERNESTO RAMOS ANTONINI PONCE -0.38
323 34199 SU AGAPITO LOPEZ FLORES HUMACAO -0.38
324 75705 RAFAEL MARTINEZ NADAL SAN JUAN -0.40
325 32375 ADRIANNE SERRANO HUMACAO -0.40
326 31070 JOSE CALZADA FERRER HUMACAO -0.42
327 70672 ANDRES C GONZALEZ BAYAMON -0.43
328 11320 SU FRANCISCO SERRANO ARECIBO -0.44
329 70581 LUIS PALES MATOS BAYAMON -0.44
330 60442 SALVADOR BRAU SAN JUAN -0.45
331 53256 FRANCISCO ZAYAS SANTANA PONCE -0.45
332 63149 REPUBLICA DEL PERU SAN JUAN -0.46
333 61853 ANGEL P MILLAN ROHENA SAN JUAN -0.47
334 57281 EUGENIO GUERRA CRUZ CAGUAS -0.52
335 35048 GEORGINA BAQUERO HUMACAO -0.59

68
Table B-3
List of schools with estimated value-added for the high school level
Ranking Code School Name RegionHigh School Value-added
1 21550 JESUS T PIÑERO CAGUAS 1.27
2 21576 EDUCACION BILINGUE LUIS MUÑOZ IGLESIAS CAGUAS 1.13
3 40022 DR CARLOS GONZALEZ MAYAGUEZ 1.05
4 54862 (CROEV)ESPECIALIZADA EN CIENCIAS Y
MATEMATICAS
PONCE 1.02
5 13912 NUEVA BRIGIDA ALVAREZ RODRIGUEZ ARECIBO 0.93
6 53470 ERNESTO RAMOS ANTONINI PONCE 0.93
7 17350 PETRA CORRETJER DE O’NEILL ARECIBO 0.82
8 57299 DR PEDRO ALBIZU CAMPOS PONCE 0.82
9 61531 UNIVERSITY GARDENS SAN JUAN 0.79
10 46219 EVA Y PATRIA CUSTODIO MAYAGUEZ 0.72
11 20255 RAFAEL PONT FLORES CAGUAS 0.62
12 40519 ESCUELA ESPECIALIZADA ALCIDES FIGUEROA MAYAGUEZ 0.59
13 44560 CROEM MAYAGUEZ 0.58
14 14357 JOSE ROJAS CORTES BAYAMON 0.58
15 63123 RAMON POWER Y GIRALT SAN JUAN 0.50
16 26021 LUIS MUÑOZ MARIN CAGUAS 0.48
17 24786 GENARO CAUTIÑO CAGUAS 0.44
18 10827 JUAN PONCE DE LEON II ARECIBO 0.44
19 60038 JULIAN E BLANCO (BALLET) SAN JUAN 0.40
20 47126 PATRIA LATORRE MAYAGUEZ 0.37
21 77552 PAPA JUAN XXIII BAYAMON 0.35
22 61572 CENTRAL ARTES VISUALES SAN JUAN 0.34
23 75879 JUAN PONCE DE LEON SAN JUAN 0.34
24 61853 ANGEL P MILLAN ROHENA SAN JUAN 0.34
25 15784 ABELARDO MARTINEZ OTERO ARECIBO 0.33
26 27565 BONIFACIO SANCHEZ JIMENEZ CAGUAS 0.32
27 20560 PABLO COLON BERDECIA CAGUAS 0.31
28 20982 REPUBLICA DE COSTA RICA CAGUAS 0.30
29 14241 TRINA PADILLA DE SANZ ARECIBO 0.30
30 60301 EDUARDO J SALDAÑA SAN JUAN 0.28
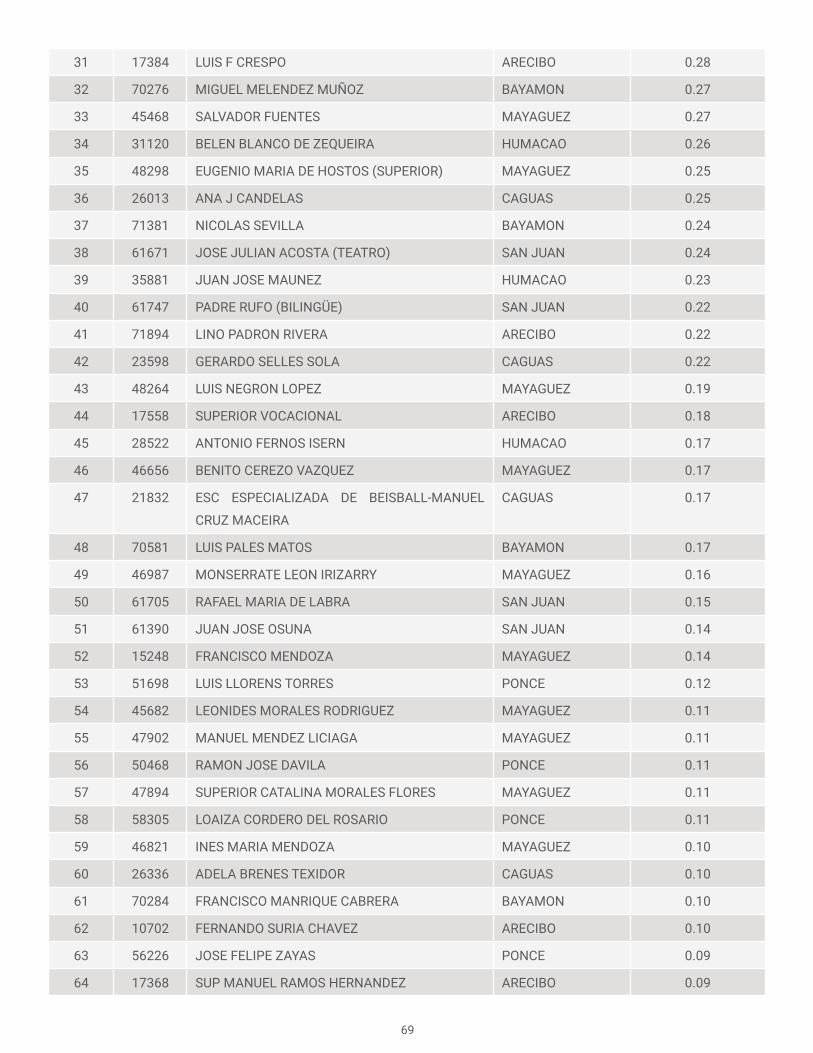
69
31 17384 LUIS F CRESPO ARECIBO 0.28
32 70276 MIGUEL MELENDEZ MUÑOZ BAYAMON 0.27
33 45468 SALVADOR FUENTES MAYAGUEZ 0.27
34 31120 BELEN BLANCO DE ZEQUEIRA HUMACAO 0.26
35 48298 EUGENIO MARIA DE HOSTOS (SUPERIOR) MAYAGUEZ 0.25
36 26013 ANA J CANDELAS CAGUAS 0.25
37 71381 NICOLAS SEVILLA BAYAMON 0.24
38 61671 JOSE JULIAN ACOSTA (TEATRO) SAN JUAN 0.24
39 35881 JUAN JOSE MAUNEZ HUMACAO 0.23
40 61747 PADRE RUFO (BILINGÜE) SAN JUAN 0.22
41 71894 LINO PADRON RIVERA ARECIBO 0.22
42 23598 GERARDO SELLES SOLA CAGUAS 0.22
43 48264 LUIS NEGRON LOPEZ MAYAGUEZ 0.19
44 17558 SUPERIOR VOCACIONAL ARECIBO 0.18
45 28522 ANTONIO FERNOS ISERN HUMACAO 0.17
46 46656 BENITO CEREZO VAZQUEZ MAYAGUEZ 0.17
47 21832 ESC ESPECIALIZADA DE BEISBALL-MANUEL
CRUZ MACEIRA
CAGUAS 0.17
48 70581 LUIS PALES MATOS BAYAMON 0.17
49 46987 MONSERRATE LEON IRIZARRY MAYAGUEZ 0.16
50 61705 RAFAEL MARIA DE LABRA SAN JUAN 0.15
51 61390 JUAN JOSE OSUNA SAN JUAN 0.14
52 15248 FRANCISCO MENDOZA MAYAGUEZ 0.14
53 51698 LUIS LLORENS TORRES PONCE 0.12
54 45682 LEONIDES MORALES RODRIGUEZ MAYAGUEZ 0.11
55 47902 MANUEL MENDEZ LICIAGA MAYAGUEZ 0.11
56 50468 RAMON JOSE DAVILA PONCE 0.11
57 47894 SUPERIOR CATALINA MORALES FLORES MAYAGUEZ 0.11
58 58305 LOAIZA CORDERO DEL ROSARIO PONCE 0.11
59 46821 INES MARIA MENDOZA MAYAGUEZ 0.10
60 26336 ADELA BRENES TEXIDOR CAGUAS 0.10
61 70284 FRANCISCO MANRIQUE CABRERA BAYAMON 0.10
62 10702 FERNANDO SURIA CHAVEZ ARECIBO 0.10
63 56226 JOSE FELIPE ZAYAS PONCE 0.09
64 17368 SUP MANUEL RAMOS HERNANDEZ ARECIBO 0.09

70
65 12930 JUAN ALEJO ARIZMENDI ARECIBO 0.09
66 46086 ELADIO TIRADO LOPEZ MAYAGUEZ 0.09
67 50294 JOSE EMILIO LUGO PONCE 0.08
68 78857 RUBEN RODRIGUEZ FIGUEROA BAYAMON 0.07
69 28530 SUPERIOR VOCACIONAL NUEVA CAGUAS 0.07
70 36012 ESCUELA DE BELLA ARTES HUMACAO 0.07
71 17319 JUAN A CORRETJER ARECIBO 0.07
72 70078 CACIQUE AGÜEYBANA BAYAMON 0.06
73 47639 SUPERIOR NUEVA MAYAGUEZ 0.06
74 43406 LAURA MERCADO MAYAGUEZ 0.06
75 23531 MIGUEL MELENDEZ MUÑOZ CAGUAS 0.05
76 13425 LUIS MUÑOZ RIVERA PONCE 0.05
77 58503 CRISTINA (AMADA) MARTINEZ MARTINEZ PONCE 0.04
78 56069 BETHZAIDA VELAZQUEZ SUPERIOR PONCE 0.04
79 17327 SUPERIOR MIGUEL F SANTIAGO ECHEGARAY ARECIBO 0.04
80 34785 JOSE COLLAZO COLON HUMACAO 0.03
81 57877 DR MAXIMO DONOSO SANCHEZ PONCE 0.03
82 52274 JUAN SERRALLES (SUPERIOR) PONCE 0.03
83 42077 DR PEDRO PEREA FAJARDO MAYAGUEZ 0.03
84 52514 PONCE HIGH SCHOOL PONCE 0.03
85 61440 TRINA PADILLA DE SANZ SAN JUAN 0.02
86 17772 ANIBAL REYES BELEN ARECIBO 0.01
87 55244 SUPERIOR OCUPACIONAL Y TECNICA DE YAUCO PONCE 0.01
88 12088 FERNANDO CALLEJO ARECIBO 0.01
89 20362 DR JOSE N GANDARA CAGUAS 0.01
90 57620 AUREA QUILES CLAUDIO PONCE 0.01
91 34884 PETRA MERCADO BOUGART HUMACAO 0.01
92 62166 VENUS GARDENS SAN JUAN 0.00
93 61382 GABRIELA MISTRAL SAN JUAN 0.00
94 47662 MANUEL GARCIA PEREZ (NUEVA) MAYAGUEZ -0.01
95 11940 JOSEFINA LINARES ARECIBO -0.01
96 56432 SUPERIOR JARDINES DE PONCE PONCE -0.01
97 47647 JUAN SUAREZ PELEGRINA (NUEVA) MAYAGUEZ -0.02
98 79038 ILEANA DE GRACIA (SUPERIOR NUEVA) ARECIBO -0.02
99 57919 JOSEFA VELEZ BAUZA (SUPERIOR URBANA) PONCE -0.03

71
100 57125 ASUNCION RODRIGUEZ DE SALA PONCE -0.03
101 11643 DOMINGO APONTE COLLAZO ARECIBO -0.03
102 78931 ADELA ROLON FUENTES BAYAMON -0.04
103 28373 SUPERIOR URBANA CAGUAS -0.04
104 22772 ESPECIALIZADA DE BELLAS ARTES CAGUAS -0.04
105 36384 VOC WILLIAM RIVERA BETANCOURT HUMACAO -0.05
106 35766 ANA DELIA FLORES SANTANA VOC HUMACAO -0.06
107 52688 DR PILA PONCE -0.06
108 75838 MARGARITA JANER PALACIOS SAN JUAN -0.06
109 14340 ALBERTO MELENDEZ BAYAMON -0.06
110 71514 ADOLFINA IRIZARRY DE PUIG BAYAMON -0.07
111 70615 MIGUEL DE CERVANTES SAAVEDRA BAYAMON -0.07
112 74039 MARIA TERESA PIÑEIRO BAYAMON -0.07
113 20800 JOSE GAUTIER BENITEZ CAGUAS -0.07
114 70201 PABLO CASALS BAYAMON -0.07
115 62398 MIGUEL SUCH SAN JUAN -0.08
116 27557 RUTH EVELYN CRUZ SANTOS CAGUAS -0.08
117 51763 LUIS MUÑOZ MARIN PONCE -0.08
118 78733 FRANCISCO GAZTAMBIDE VEGA BAYAMON -0.08
119 67942 BERWIND SUPERIOR SAN JUAN -0.08
120 58511 LILA MARIA MERCEDES MAYORAL PONCE -0.08
121 28571 SUPERIOR URBANA CAGUAS -0.08
122 17863 SUPERIOR VOCACIONAL PONCE -0.08
123 60913 PETRA ZENON DE FABERY SAN JUAN -0.09
124 71225 FRANCISCO MORALES BAYAMON -0.10
125 21758 JUANA COLON CAGUAS -0.10
126 35048 GEORGINA BAQUERO HUMACAO -0.10
127 35972 JORGE ROSARIO DEL VALLE HUMACAO -0.10
128 56119 CARMEN BELEN VEIGA PONCE -0.10
129 66209 LUZ AMERICA CALDERON SAN JUAN -0.10
130 71043 DR JOSE PADIN BAYAMON -0.11
131 58180 LYSANDER BORRERO TERRY PONCE -0.11
132 30247 DR SANTIAGO VEVE CALZADA HUMACAO -0.11
133 21055 MANUELA TORO MORICE CAGUAS -0.11
134 34264 LUIS MUÑOZ MARIN HUMACAO -0.11

72
135 15792 DR HERIBERTO DOMENECH MAYAGUEZ -0.11
136 18192 MARIA CADILLA DE MARTINEZ ARECIBO -0.12
137 65003 DR JOSE M LAZARO SAN JUAN -0.12
138 56820 STELLA MARQUEZ CAGUAS -0.12
139 21105 BENJAMIN HARRISON CAGUAS -0.13
140 26773 DRA CONCHITA CUEVAS CAGUAS -0.13
141 41061 SEGUNDO RUIZ BELVIS MAYAGUEZ -0.14
142 71092 JOSE SANTOS ALEGRIA ARECIBO -0.14
143 52696 BERNARDINO CORDERO BERNARD PONCE -0.14
144 35816 RAFALINA E LEBRON FLORES HUMACAO -0.14
145 43315 LOLA RODRIGUEZ DE TIO MAYAGUEZ -0.14
146 33233 PEDRO FALU ORELLANO HUMACAO -0.14
147 30098 SANTIAGO IGLESIAS PANTIN HUMACAO -0.14
148 77651 TOMAS MASO RIVERA MORALES BAYAMON -0.15
149 11593 GABRIELA MISTRAL ARECIBO -0.16
150 64402 ERNESTO RAMOS ANTONINI (MUSICA) SAN JUAN -0.16
151 61762 RAFAEL CORDERO SAN JUAN -0.16
152 70516 DR. AGUSTIN STAHL BAYAMON -0.16
153 60442 SALVADOR BRAU SAN JUAN -0.17
154 34926 EDUARDO GARCIA CARRILLO HUMACAO -0.17
155 35782 RAMON QUIÑONES MEDINA HUMACAO -0.17
156 30973 RAMON POWER Y GIRALT HUMACAO -0.18
157 70623 TOMAS C ONGAY BAYAMON -0.19
158 70813 FRANCISCO OLLER BAYAMON -0.20
159 75267 JUAN QUIRINDONGO MORELL ARECIBO -0.20
160 13318 JOSE VIZCARRONDO PONCE -0.21
161 62901 INES MARIA MENDOZA SAN JUAN -0.21
162 25601 ELOISA PASCUAL CAGUAS -0.21
163 62984 ALBERT EINSTEIN SAN JUAN -0.21
164 20818 DR JUAN JOSE OSUNA CAGUAS -0.21
165 22582 JOSE CAMPECHE HUMACAO -0.21
166 71779 LADISLAO MARTINEZ ARECIBO -0.21
167 35618 SUPERIOR ISIDRO A SANCHEZ HUMACAO -0.22
168 32755 TEODORO AGUILAR MORA HUMACAO -0.22
169 54619 JOSEFINA LEON ZAYAS PONCE -0.22

73
170 24810 DR RAFAEL LOPEZ LANDRON CAGUAS -0.23
171 71670 DR PEDRO ALBIZU CAMPOS BAYAMON -0.23
172 57703 ELVIRA M COLON PONCE -0.23
173 46995 LUIS MUÑOZ MARIN MAYAGUEZ -0.24
174 62950 RAMON VILA MAYO SAN JUAN -0.25
175 26492 ANTONIO DOMINGUEZ NIEVES CAGUAS -0.25
176 64998 LCDO GUILLERMO ATILES MOREAU SAN JUAN -0.26
177 61663 DR JOSE CELSO BARBOSA SAN JUAN -0.27
178 35501 SUP VOC MANUEL MEDIAVILLA HUMACAO -0.27
179 62893 JUAN ANTONIO CORRETJER SAN JUAN -0.27
180 12377 JAIME A COLLAZO DEL RIO BAYAMON -0.28
181 69047 MEDARDO CARAZO SAN JUAN -0.29
182 62547 JUAN PONCE DE LEON SAN JUAN -0.29
183 32250 CASIANO CEPEDA HUMACAO -0.30
184 34363 ISABEL FLORES HUMACAO -0.30
185 60905 LORENZO VIZCARRONDO SAN JUAN -0.32
186 11528 LORENZO COBALLES GANDIA ARECIBO -0.32
187 61655 DR FACUNDO BUESO SAN JUAN -0.34
188 70888 EMILIO R DELGADO BAYAMON -0.34
189 35592 FLORENCIA GARCIA HUMACAO -0.35
190 69930 GILBERTO CONCEPCION DE GRACIA SAN JUAN -0.35
191 33043 GERMAN RIECKEHOFF HUMACAO -0.35
192 31542 ALFONSO CASTA MARTINEZ HUMACAO -0.37
193 57281 EUGENIO GUERRA CRUZ CAGUAS -0.39
194 75812 JOSEFINA BARCELO SAN JUAN -0.40
195 30270 ANA ROQUE DE DUPREY HUMACAO -0.41
196 36335 NUEVA SUPERIOR DE LOIZA HUMACAO -0.41
197 75739 ROSALINA C MARTINEZ SAN JUAN -0.42
198 62877 REPUBLICA DE COLOMBIA SAN JUAN -0.42
199 37507 ECOLOGICA DE CULEBRA HUMACAO -0.44
200 33340 LUIS HERNAIZ VERONNE HUMACAO -0.46
201 73650 PEDRO P CASABLANCA BAYAMON -0.50
202 36053 SUPERIOR URBANA NUEVA CAGUAS -0.54
203 32375 ADRIANNE SERRANO HUMACAO -0.92