Embed Size (px)
Citation preview

SPECIAL COLLECTION • “[TITLE]”• MIT SLOAN MANAGEMENT REVIEW i
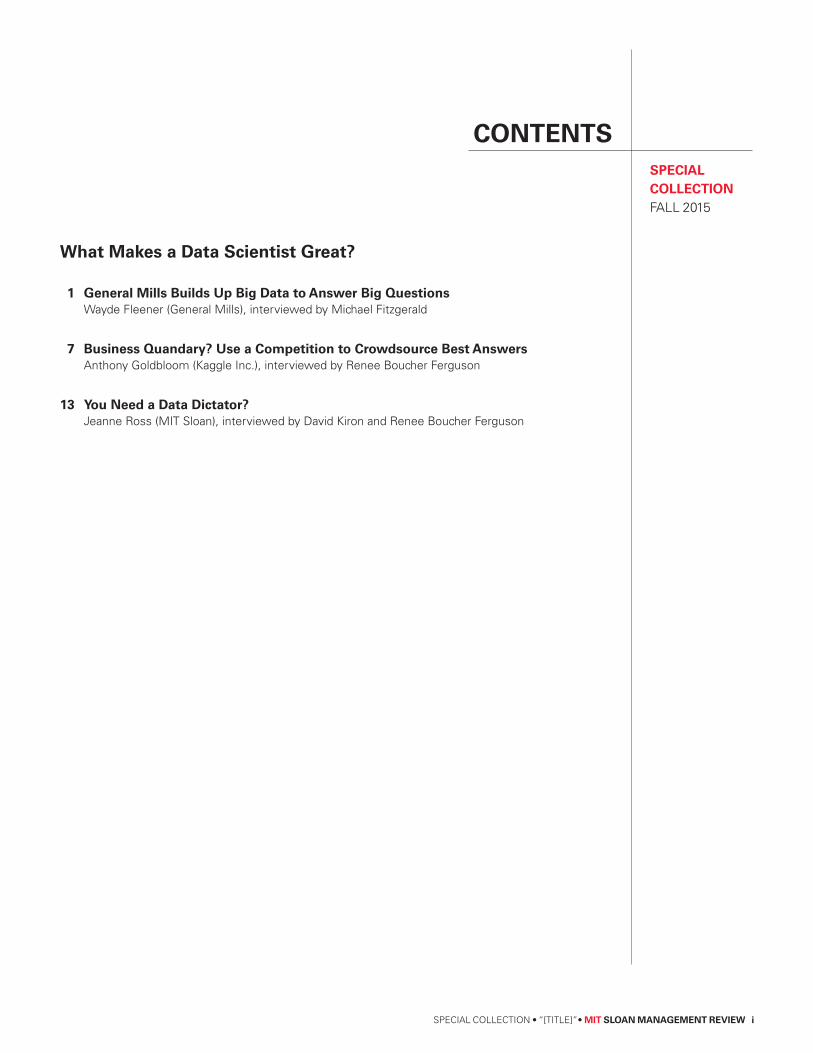
CONTENTSSPECIALCOLLECTIONFALL 2015
What Makes a Data Scientist Great?
1 General Mills Builds Up Big Data to Answer Big Questions Wayde Fleener (General Mills), interviewed by Michael Fitzgerald
7 Business Quandary? Use a Competition to Crowdsource Best Answers Anthony Goldbloom (Kaggle Inc.), interviewed by Renee Boucher Ferguson
13 You Need a Data Dictator? Jeanne Ross (MIT Sloan), interviewed by David Kiron and Renee Boucher Ferguson

General Mills Builds Up Big Data to Answer BigQuestionsWAYDE FLEENER (GENERAL MILLS), INTERVIEWED BY MICHAEL FITZGERALD
Enhancing intuition with analytics at General Mills.
At General Mills, a big data team within the Consumer Insights group
uses data visualization to help share their insights. "Now the divisions
can actually tangibly understand what they’re doing from a data
perspective," says Wayde Fleener, a data scientist and Senior Manager in
the Global Consumer Insights group.
Wayde Fleener likes solving real-world problems, which
led him into what we now call Big Data analytics. He
started out on a different path, studying chemical
engineering at the University of Minnesota. But he
realized he didn’t want to go on for a PhD because it
would mean a career in research, and he wanted to do
applied work. After a stint in investment banking in Asia,
Fleener went to a loyalty marketing agency.
Fleener, 36, still remembers the day when a colleague
came to him and said a name, “big data,” had been coined
for what they were doing. “We called it decision science,”
he says. After working on programs for the consumer
packaged goods industry, he found himself intrigued by
the challenges they face, as companies indirectly
connected to their consumers. He came to General Mills
in mid-2013, becoming a senior manager/data scientist in
its 200+-person Consumer Insights group, a unit of
marketing comprised largely of researchers. He spoke
with MIT Sloan Management Review contributing editor
Michael Fitzgerald.
What did General Mills want in a datascientist for its marketing group?
The leader for consumer insights, Jeanine Bassett [vice
president of Global Consumer Insights at General Mills]
was concerned about how much of our decision making
was based on outside research. She wanted more decision
making based on our intuition and utilizing the data we
had in-house. She wanted us to become less reliant on
research. During the whole interview process, they said,
MITMIT SLSLOOAN MANAAN MANAGEMENGEMENT REVIEWT REVIEW
DDAATTA & ANALA & ANALYTICSYTICS
Copyright © Massachusetts Institute of Technology, 2015. All rights reserved. Reprint #56424 http://mitsmr.com/1G7LlKXSPECIAL COLLECTION • “[TITLE]”• MIT SLOAN MANAGEMENT REVIEW 1

“We need someone to really help us to answer these
questions, about what we think we know.” So I came in to
get after the data that we had internally and how we could
benefit from it. And they gave me a lot of leeway.
Did they also give you a sense of urgency, ofneeding to get things done quickly?
Yes. They wanted everything as quickly as possible but
not at the sacrifice of accuracy.
How did you get started?
Coming in as an outsider, my first couple of months were
focused on figuring out what we really do at General
Mills. The very first thing I had to do was sit down and do
a catalog of all the different data we commonly use and
what we use it for. I started asking around, “Does
anybody have a data diagram that tells me the data you
have and where it’s being used?” No one had it. So I
started doing diagrams to say where the data was
connected, where are they not, and asking, where should
they be? Where are the various data being used in
analyses? Where should they be?
How did you find the data?
I had to do a bunch of interviews. I found the group that
does our marketing mix, and sat down with them for
quite a while. I went to our relationship marketing group,
and asked them what data they were using. I’d sit down
with all these specialized functions inside Consumer
Insights and ask a lot of questions.
Then I’d get really tactical, get access to the data sources
themselves, and literally go in and look at tables — there
are no data dictionaries. I had to figure out what [did] the
columns inside the tables mean. A lot of times, I had to
work my way through the IT organization, because the
only person who had the answer was the person who
developed that database. Sometimes there were names for
columns and I couldn’t interpret what they meant.
After that, I had to figure out where the data was coming
from upstream. And I realized there was data coming to
us that we weren’t capturing that we should be capturing.
We would just delete it.
What kind of data was not being captured?
For example, we may bring it into our system at an
aggregated market level, but the data is actually coming to
us at a disaggregated level [by individual locales].
What was the most difficult thing at thebeginning?
General Mills is a huge ship, and it’s very difficult to
move. People felt threatened because I was coming into
their role and questioning them. So there was a lot of
resistance, and “Are you trying to take over what I’m
doing?” I had to keep saying, “No, I’m just trying to help
you do things better.” I sit in the business, but my role
goes into IT a lot. So the very first couple of months, there
was tension between me and IT, because they were afraid
they were going to be told they had been doing things
wrong. I resolved it through weekly meetings, showing
them what we’re doing; not calling people.
Did you do this all yourself, or did uppermanagement need to get involved?
There were a couple of instances where we hit roadblocks
and there had to be a senior management talks. It took six
months before we really turned a corner. One of the
director-level leaders in IT started one of the meetings
saying, “Hey, listen,” — and this was directed to some of
their own folks — “Consumer Insights has some really
interesting things that I believe we’re going to benefit
from as a company.” And then the leader left the room.
MITMIT SLSLOOAN MANAAN MANAGEMENGEMENT REVIEWT REVIEW
DDAATTA & ANALA & ANALYTICSYTICS
Copyright © Massachusetts Institute of Technology, 2015. All rights reserved. Reprint #56424 http://mitsmr.com/1G7LlKXSPECIAL COLLECTION • “[TITLE]”• MIT SLOAN MANAGEMENT REVIEW 2

When that meeting happened, I knew the tide had
changed.
Were you working with anyone else?
I started off as a one-man team. As people started
approaching me, my VP saw the traction and invested a
little more, and we were able to show value, and it just
kept on growing. Once we had a sizeable amount of our
data connected, there was a sense of urgency to show the
value of that. That is why we jumped into visuals so the
organization could tangibly touch something that we did.
Data visualization really accelerated things. We were
sorting out a lot of data, and behind the scenes the data
was coming together, but a lot of the Consumer Insights
folks couldn’t tangibly touch it yet. We sat down with
some of our division folks and identified the things they
wished they could do but couldn’t because they couldn’t
access the data. I found a data-visualization company that
could take the data sets we were bringing together and
produce some valuable visuals. Now the divisions can
actually tangibly understand what they’re doing from a
data perspective.
That just grew to more requests and more people who
wanted visualizations. We’re now the Big Data team
within Consumer Insights. Our mix after a little more
than a year is myself, four data stewards, their manager,
four data visualizers, and two data scientists. We need two
more data scientists, something I’m actively working on
now.
Was data visualization a new role for GeneralMills?
When I got here, General Mills already had in place a
data visualization tool. But it was not used at all in
Consumer Insights. My researchers, who are not
programmers, live in Excel, but my datasets are hundreds
of millions of rows. [Editor’s note: At the time, Microsoft
did not have a version of Excel that could handle such
large numbers of rows. General Mills has since become a
beta tester of a version that does.] With our visualization
tool, we can do a lot of stuff out of the box without having
to program, but if you’re trying to do specialized stuff
then you need to bring in programming languages. I
started looking for some developers that knew our tool
and could do the more advanced stuff. We outsourced
that data visualization to another company.
Data visualization technology is now a commodity. But,
the idea of what you need to visualize is not. That’s what
we data scientists do. We come up with “it’d be really cool
if we could do this” ideas. When we’re ready to productize
it, the programming is the commodity piece.
What are the pros and cons of looking outsidefor talent versus staying inside?
Outside, you get the advantage of individuals that have
developed across industries and other companies. You
may create a blueprint and hand it to them, and they
come back and say we developed something similar. Here
are some ideas that might enhance your visualization.
Internally, it always comes down to cost: can you bring it
in-house and do it cheaper? Some of our outsourcing is
through India, and it can be almost like having 24-hour
development.
You’ve talked about how to make analyticspart of everyday operations, not havinganalytics be a series of one-off projects. Howhard is that process to develop?
It’s very difficult. People are living in an Excel world. They
think, “I gotta grab this data and this data and every time
MITMIT SLSLOOAN MANAAN MANAGEMENGEMENT REVIEWT REVIEW
DDAATTA & ANALA & ANALYTICSYTICS
Copyright © Massachusetts Institute of Technology, 2015. All rights reserved. Reprint #56424 http://mitsmr.com/1G7LlKXSPECIAL COLLECTION • “[TITLE]”• MIT SLOAN MANAGEMENT REVIEW 3

I want to refresh.” Versus, we’re going all the way back to
the data source in everything that we’re doing, so we don’t
have to touch that whole data update.
If analytics traditionally works in a rinse-and-repeat mode, where you ask a question,gather data, run the data, ask anotherquestion, gather new data, run it, and so on,how do you break away from that?
Every division thinks it has this unique way it should
view the data. Yes, they all face their own unique
situation, but in reality, they really look at the data the
exact same way. If I have to create a unique way for you to
view data across seven divisions, I have to maintain seven
unique versions of the data. I can’t get scale that way.
Does that help you avoid what you’ve calledthe “Go Fish” problem of Big Data, where youask people if they have the data, and they sayno?
When I first got here, no one had a view of all the data we
had across everything. Everybody had a specific role and
they cared about the data they used in that role. If
someone had a new use-case they developed, you would
have to go around and say, do we even have that data?
How do I get the data, how do I manipulate the data, how
do I combine it with my other data sets? When I mash up
my data sets, do I know I have yellow-box Cheerios
named consistently across the two data sets?
How did you fix that problem?
That’s where the data stewards, a new role within
Consumer Insights, come into play. We’ve been
systematically going through every single core data asset.
We’ve got hundreds of products. One data source may
spell “Cheerios” all the way out, and another may spell it
“chrs.” We’ll prepare a summarized data set and give that
to our data stewards. We have about six data stewards that
map connections between data sets. For every data
refresh cycle, we created what we call an exception report,
where we identify what’s new. The data stewards go
through and map what’s new.
Were the data stewards there before you gotto General Mills, perhaps doing somethingelse?
It’s grown three-fold. We had an individual solely focused
on Nielsen scanner data, a very important data set in any
consumer packaged goods company, making sure that
whatever we get from Nielsen will work the way
marketing needs it. The job had a different title. But now
they’re data stewards, and we’re taking those roles and
instead of making them solely an expert in one data
source, we’re making them an expert across data sources.
They reported to different lines when I got here, but as of
January they report to me. Data stewards don’t require all
the technical and programming skills of a data scientist.
For some of their tasks, a two-year technical degree can
be enough.
When and how did you add your next datascientist?
After six months, the business was asking for more
analytics, especially with a predictive component. The
amount of stuff that they were asking for was exceeding
my capacity. We’ve got a good recruiting office, so I built
out the profile I was looking for, and they started looking
at various academic programs locally. I think they found
him on LinkedIn, because his profile said he was studying
Big Data at The University of St. Thomas. I had told HR
that I was fine with an individual that was mid-school,
because that was probably what I could afford. He had a
MITMIT SLSLOOAN MANAAN MANAGEMENGEMENT REVIEWT REVIEW
DDAATTA & ANALA & ANALYTICSYTICS
Copyright © Massachusetts Institute of Technology, 2015. All rights reserved. Reprint #56424 http://mitsmr.com/1G7LlKXSPECIAL COLLECTION • “[TITLE]”• MIT SLOAN MANAGEMENT REVIEW 4

day job already, and I had to do a big selling job to get
him. They’re tough to acquire. The big sell was, “We’re
starting something here at General Mills, you could be
part of it.” That’s appealing to certain individuals.
Your unit also has an analytics group withstatisticians. How are they different?
They don’t contain the data scientists. The data science
group is more technically savvy at getting and
manipulating the data, and can engineer the systems to
operationalize the analytics. The statisticians/analytics
group focuses on answering particular questions, but for
example, they do not have the skillset to take a model and
deploy it. Both groups report to Vidyotham Reddi, who is
director of Global Enablers. He reports to Jeanine Bassett.
How you can tell the company is successfullyoperationalizing analytics?
For us, it’s how many people are using our stuff and
asking for more stuff. Ultimately, a company is successful
if it can say decisions made by analytics led to
incremental profit.
What lessons do you have for othercompanies?
Start with an understanding of the data you have, how it’s
organized. Have the end in mind — what you want to
accomplish — and then develop that plan through the
process. Build the right relationships. I identified who
would be my champions and built relationships with
them.
You’ve got to make sure you have the right IT folks along
for the ride. I’m technical, but I hit a point where I don’t
understand Linux servers, and so I need an expert.
Having a breadth of relationships across the company is
the only reason why we have been successful.
MITMIT SLSLOOAN MANAAN MANAGEMENGEMENT REVIEWT REVIEW
DDAATTA & ANALA & ANALYTICSYTICS
Copyright © Massachusetts Institute of Technology, 2015. All rights reserved. Reprint #56424 http://mitsmr.com/1G7LlKXSPECIAL COLLECTION • “[TITLE]”• MIT SLOAN MANAGEMENT REVIEW 5

About the Author
Michael Fitzgerald is a contributingeditor at MIT Sloan ManagementReview.
MITMIT SLSLOOAN MANAAN MANAGEMENGEMENT REVIEWT REVIEW
DDAATTA & ANALA & ANALYTICSYTICS
Copyright © Massachusetts Institute of Technology, 2015. All rights reserved. Reprint #56424 http://mitsmr.com/1G7LlKXSPECIAL COLLECTION • “[TITLE]”• MIT SLOAN MANAGEMENT REVIEW 6

Business Quandary? Use a Competition toCrowdsource Best AnswersANTHONY GOLDBLOOM (KAGGLE INC.), INTERVIEWED BY RENEE BOUCHER FERGUSON
Top data scientists often share three characteristics: they are creative, they are
curious and they are competitive. Anthony Goldbloom, CEO of Kaggle, a company
that hosts data prediction competitions, has figured out how to tap all three of these
characteristics to help companies crowdsource their analytics problems.
Anthony Goldbloom, CEO of Kaggle
During a 2008 internship at the Economist, economist-
turned-journalist Anthony Goldbloom made an
important discovery: many organizations that want to use
predictive analytics don’t have the skills to do it well, if at
all. In response, he came up with an interesting business
idea: create a company that allows anyone anywhere to
compete to solve other business’s analytics problems.
Today, hundreds of organizations, both public and
private, have submitted their datasets and business
problems to Goldbloom’s company, Kaggle Inc. Sixty five
thousand data scientists from around the globe have
signed up with Kaggle to compete to develop the best
algorithm for a given problem, from predicting click-
through rates on ads to predicting who will be admitted
to a hospital within the next year (a current competition
with a $3 million purse). Ongoing results are displayed in
real time on a virtual leaderboard.
The leading data scientists are a motley crew. They
include a French born actuary, a computational
neuroscientist from Harvard, an Oxford physicist and a
Russian cybernetics professor.
In a conversation with MIT Sloan Management Reviewdata & analytics contributing editor Renee Boucher
Ferguson, Kaggle founder and CEO Goldbloom talks
about the motivation behind Kaggle and the outcomes of
its data science competitions.
SSo wo whherere did te did thhe idee idea coa comme fe frroom tm to mo maakke de daatta sa scienciencece
inintto a so a sppoorrts cots commppetetiittioion?n?
I used to be an econometric modeler at the Australia
Treasury, and after that at the Reserve Bank of Australia.
Then in early 2008, I won an essay competition. The prize
was a three-month internship at the Economist magazine,
writing for the finance and economic section.
I pitched a piece on predictive analytics and it turned out
to be a fabulous way to do market research. Pretty senior
people were saying, “yes, predictive modeling, I know we
need to be doing more of this.” And my frustration was
MITMIT SLSLOOAN MANAAN MANAGEMENGEMENT REVIEWT REVIEW
DDAATTA & ANALA & ANALYTICSYTICS
Copyright © Massachusetts Institute of Technology, 2012. All rights reserved. Reprint #54222 http://mitsmr.com/1k6rQoYSPECIAL COLLECTION • “[TITLE]”• MIT SLOAN MANAGEMENT REVIEW 7

that I was talking through some really interesting
problems with reasonably senior people from companies,
and always in the back of my mind was, “wow, I do a bit
of programming. I can understand business problems and
also like playing with data and statistics. I could do a
really good job on these problems.” But I realized if in a
different context I applied for a job to tackle some of
these issues, I wouldn't get one. They'd look at me and
say, “you're an economist, what do you know about
predictive modeling?”
That was the emotional rationale behind wanting to build
a meritocratic labor market for data science and
predictive models. Because I figured there would be more
people like me who thought they could solve some of
these problems, but they weren't being given the chance.
There was also an intellectual, or commercial, reason why
I thought it was a good idea. The quality of the data
scientist is crucial in determining the quality of a data
science solution. Data science is extremely high leverage,
so a data set and an algorithm in the hands of a great data
scientist can generate a $100 million return on
investment, while the same data in the hands of
somebody inexperienced can be extremely costly.
HHoow do Kw do Kaagggglele’’s bs big dig daatta coa commppetetiittioionns ws woorrk?k?
We basically back-test people's algorithms on what we
call a holdout data set.
So let's say you're a bank and you want to predict who's
going to default on a loan and you've got 20 years' worth
of data on how loan applicants have behaved, who have
paid back their loans and who hasn't. What we do is we
take that historical data, split it in two, give data scientists
in our competition access to half of that data set with the
answers, like “John Smith, age 62, with an income of X,
defaulted.” For the other half of the customers, we give
information on their characteristics — “Jack Smith, age
61, with income X” — but we withhold the information
on whether or not he defaulted.
What participants do is train their algorithms on the first
set, and then apply those algorithms to the second set,
and we score them against the actual answers to see who's
getting the lowest error rate or the highest number of loan
applicants correct. That's what's very neat about data
science and predictive modeling algorithms. You can
actually objectively score who is good and who isn't.
WWhho ao arre te thhe de daatta sa sciencienttiissts tts thhaat pt paarrtticiicippaatte in ye in yoour pur puubbliclic
cocommppetetiittioionns as annd hd hoow cw caan yn yoou tu teelll wl whho doo does ges gooood wd woorrkk
aannd wd whho doo doesnesn’’t?t?
We have 65,000 data scientists signed up to Kaggle, and
just like with golf tournaments, we have them all ranked
from 1 to 65,000. And the top data scientists come from a
whole lot of backgrounds. Number one is a French-born
actuary named Xavier Conort who runs his own
consulting firm. Number two is an Oxford PhD in physics
called Jason Tigg. He runs his own hedge fund. As an
intellectual challenge, he competes in Kaggle
competitions at night. Number three is a professor of
cybernetics from Moscow State University called
Alexander D'yakonov. Number four, Sergey Yurgenson, is
a professor of computational neuroscience at Harvard
Medical School.
The background of these top data scientists is all over the
map, but they have a handful of characteristics in
common. They are all creative and curious. In order to
build a really good data science algorithm, it's actually
much less about the complex mathematics. You have to
MITMIT SLSLOOAN MANAAN MANAGEMENGEMENT REVIEWT REVIEW
DDAATTA & ANALA & ANALYTICSYTICS
Copyright © Massachusetts Institute of Technology, 2012. All rights reserved. Reprint #54222 http://mitsmr.com/1k6rQoYSPECIAL COLLECTION • “[TITLE]”• MIT SLOAN MANAGEMENT REVIEW 8

be really good at math, but the complexity of the
mathematics doesn't very well correlate with how good a
data science algorithm is. It's more about the kind of
features you're able to find in the data.
ThThaatt’’s rs reeaalllly iny inttereresesttiningg. C. Caan yn yoou gu giivve ae an exan exammpple?le?
Sure. We ran a competition for a big chain of used car
dealers. They sell used cars all over the country. They'll go
to auctions of secondhand cars, purchase cars and sell
them throughout the dealer network. Because they offer a
warranty on any car they sell — and they don’t want to
sell lemons — they wanted to predict which cars were
good buys and which cars were likely to be lemons.
It turned out that the auction catalogues have all these
things, like the make of the car, the model of the car, the
number of miles, how many owners. Do you want to
hazard a guess as to what the most predictive feature was?
HHmmm, I dommm, I don't hn't haavve a ce a cllue — tue — thhe coe cololor or of tf thhe ce caar?r?
Funnily enough, you're 100 percent right! It was the color
of the car. It turns out that if you group car color into
usual color and unusual color, the unusual color cars were
much more likely to be reliable than usual color cars. The
intuition there is that if you're the first buyer of an orange
car — orange was the most reliable car, incidentally —
you probably were an enthusiast because that's kind of an
odd color car and you would have had to go out of your
way to find an orange-color car. Therefore, you probably
looked after it better, so by the time it goes up for sale in a
secondhand auction, it's in much better condition than a
standard color car that somebody didn't particularly care
that much about.
In order to find that in the data you've got to use some
mathematics to discover that correlation, but really it's all
about having clever creative ideas and then testing those
ideas against the data and seeing whether they hold true
or not. That's one of the characteristics that make a great
data scientist.
WWhhaat at arre se soomme oe otthher cer chhaaracracttereriissttics yics yoouu’’vve fe foounund td thhaatt
mmaakke a ge a grreeaat dt daatta sa sciencienttiisst?t?
You have to be able to use good coding practices or
programming practices. If you set up a framework at the
beginning of a predictive modeling problem that allows
you to iterate very quickly and try lots of ideas, you'll be
able to try more ideas than somebody else that you're
competing against, and so you'll be able to discover more
in the data.
Also being tenacious. Typically in a competition, if you're
on top of the leader board and then you log in the next
day and somebody's ahead of you, you have to be
tenacious and determined enough to keep going until you
get ahead of them. And then they leapfrog you and you
have to keep working till you leapfrog them.
WWhhen a coen a commppaanny hy hososts a cots a commppetetiittioion, an, arre te thheey loy loookkiningg
ffoor jr juusst tt thhosose te toop fip fivve de daatta sa sciencienttiissts? Dts? Dooes aes annyybbooddy ey evverer
wawannt tt to uo uttiilize tlize thhosose de daatta sa sciencienttiissts tts thhaat rat rannk lok lowwer?er?
We used to think that one of the reasons that we got really
great results is because you get a lot of these offbeat ideas.
We ran a problem for NASA, and somebody in glaciology
made the first breakthrough. Now, we would not typically
turn to a glaciologist to solve a problem for NASA. What
we found, perhaps a little bit unromantically, is that the
same people keep winning or performing well again and
again and again, so there is this kind of core data science
MITMIT SLSLOOAN MANAAN MANAGEMENGEMENT REVIEWT REVIEW
DDAATTA & ANALA & ANALYTICSYTICS
Copyright © Massachusetts Institute of Technology, 2012. All rights reserved. Reprint #54222 http://mitsmr.com/1k6rQoYSPECIAL COLLECTION • “[TITLE]”• MIT SLOAN MANAGEMENT REVIEW 9

skill that allows somebody to do well, irrespective of the
precise nature of the problem.
Kaggle's business model is basically that once we discover
who these top talents are, we put them to work on
commercial problems. We do this in one of two ways. The
first is through a private competition, so you might be a
bank, you want to build an algorithm but you can't
release PII data, data that identifies individual people. So
we can host a private competition where we'll invite five
to ten of our very best data scientists, and they compete
behind the scenes on your problem, under NDA. That
way, the sensitivity of your data is not revealed.
The other thing we do is for problems that are less well
specified, we have a partnership with EMC Greenplum
whereby any Greenplum customer can come into Kaggle
and rent one of our top data scientists for a month, for
instance, to build them a predictive modeling algorithm.
HHoow ow offtten in ten in thhe coe commppetetiittioion in is IP [ins IP [intteellleleccttuuaal pl prroopperertty]y]
ppuut int intto po prroodducucttioion?n?
It really depends. Typically, when we work with startups,
for example, or early-stage companies, the algorithms get
put into production very quickly. Often when we're
working in regulated industries, it takes a lot longer. For
example with Allstate, the first model we built for them is
a claims prediction model. Any new claims model has to
go through regulators, so there's a very long lead time
between an algorithm being developed and it being put
into production.
The way a lot of companies are set up at the moment is
you'll have one group that's responsible for data and
handling the data warehouse, and then you'll have
analysis group that's responsible for building these
algorithms, and then you'll have a third group, an IT
group, that's responsible for putting those algorithm into
production. It's sometimes challenging for the IT group
to put sophisticated algorithms into production, and so
have a service where we will host winning algorithms on
behalf of companies.
WWhhen sen shhoouuld ald an on orrgaganizanizattioion tn thinhink ak abboouut ht hososttining ag a
cocommppetetiittioion? Dn? Dooes ies it nt neeeed td to ho haavve be big dig daattaassets oets or br bigig
ccaassh? Ah? Annd wd whhaat st soorrts ots of pf prroobblemlems as arre be besest st suiuitteed fd foorr
cocommppetetiittioion?n?
I would say there are two situations where a company
should be looking at a competition as opposed to a single
data scientist. The first one is when the problem is very
valuable.
What we find with a competition is that, because we're
showing people in real time how they're performing
against others on a leaderboard, what ends up happening
is you might make an entry that you're really happy with
and, if you were working inside a company or by yourself
in isolation, you would have stopped there. But then
somebody else gets ahead of you on the leaderboard and
you keep working until you get ahead of him or her. And
they keep working until they get ahead of you.
This leapfrogging continues until the point where you
reach what we call the limit of what's possible given the
information and the dataset. Each dataset only contains
so much information and, when you put people together
in a competition and you give them feedback on a live
leaderboard, they'll drive each other to the point where
they've literally extracted everything there is to get out of
the dataset. Having a live leaderboard in front of people
means you get all the value there is to get out of a dataset.
MITMIT SLSLOOAN MANAAN MANAGEMENGEMENT REVIEWT REVIEW
DDAATTA & ANALA & ANALYTICSYTICS
Copyright © Massachusetts Institute of Technology, 2012. All rights reserved. Reprint #54222 http://mitsmr.com/1k6rQoYSPECIAL COLLECTION • “[TITLE]”• MIT SLOAN MANAGEMENT REVIEW 10

If you're building an extremely valuable algorithm, you
want to squeeze all the juice out of it, because there could
be half a billion dollars worth of ROI in your dataset, you
want to make sure you get every little bit of it.
The second scenario to host a competition is when you
have a very challenging problem. You might be dealing
with unstructured data, such as text. Or you might be
dealing with high dimensional data or sparse data with
lots of missing values. Or social graph data. In situations
where the dataset is very difficult, we've noticed that the
difference between what a company can do themselves
and what they'll get out of our data scientists is much
bigger.
At the bottom end, competitions will give you a ten
percent lift over what you're already doing. At the top
end, it'll be in the order of three to four hundred percent.
We've noticed that generally the more complex the data,
the more challenging the data, the greater the lift.
MITMIT SLSLOOAN MANAAN MANAGEMENGEMENT REVIEWT REVIEW
DDAATTA & ANALA & ANALYTICSYTICS
Copyright © Massachusetts Institute of Technology, 2012. All rights reserved. Reprint #54222 http://mitsmr.com/1k6rQoYSPECIAL COLLECTION • “[TITLE]”• MIT SLOAN MANAGEMENT REVIEW 11

About the Author
Renee Boucher Ferguson is aresearcher and editor at MIT SloanManagement Review.
MITMIT SLSLOOAN MANAAN MANAGEMENGEMENT REVIEWT REVIEW
DDAATTA & ANALA & ANALYTICSYTICS
Copyright © Massachusetts Institute of Technology, 2012. All rights reserved. Reprint #54222 http://mitsmr.com/1k6rQoYSPECIAL COLLECTION • “[TITLE]”• MIT SLOAN MANAGEMENT REVIEW 12

Do You Need a Data Dictator?JEANNE ROSS (MIT SLOAN), INTERVIEWED BY DAVID KIRON AND RENEE BOUCHER FERGUSON
Many companies are suddenly dealing with petabytes of information instead of
terabytes. Keeping track of all that data and creating value from it, says Jeanne
Ross, director of the MIT Sloan Center for Information Systems Research, may
require more than technology — it may just require a data dictator.
Jeanne Ross, director of the MIT Sloan Center for Information Systems
Research
Open a newspaper or magazine, click on a news story or
case study and there it is, writ large: The promise of big
data. What has brought about this sudden interest in data
analytics?
Jeanne Ross, the director and principal research scientist
at the MIT Sloan Center for Information Systems
Research (CISR), says it is a confluence of events:
companies are getting better at the processes that create
their data, new technologies are creating new ways to
access and analyze that data and business leaders are
being bombarded with stories of others' success with
analytics.
Ross has been at MIT Sloan School of Management for
the past 19 years. For the last four years she's been the
director of CISR, which focuses on how companies get
value from information technology and on the
digitization of processes and effective use of information.
CISR has 85 corporate sponsors that fund the Center's
research, provide feedback and participate in events.
For her part, Ross examines the organizational and
performance implications related to enterprise
architecture, IT governance, business processes,
disruptive technologies and business agility in an
increasingly global, information-intensive world. She also
leads executive education courses on IT management,
working with such corporations as PepsiCo, McKinsey,
MITMIT SLSLOOAN MANAAN MANAGEMENGEMENT REVIEWT REVIEW
DDAATTA & ANALA & ANALYTICSYTICS
Copyright © Massachusetts Institute of Technology, 2012. All rights reserved. Reprint #54123 http://mitsmr.com/1oLuwZASPECIAL COLLECTION • “[TITLE]”• MIT SLOAN MANAGEMENT REVIEW 13

General Electric, TRW, Cisco, Commonwealth Bank of
Australia, IBM and Credit Suisse.
In a conversation with David Kiron, executive editor of
MIT Sloan Management Review Innovation Hubs, and
Renee Boucher Ferguson, a contributing editor at MITSloan Management Review, Ross discussed the issues
facing companies today as they explore the potential of
data analytics for their organizations.
HHoow do yw do yoou finu find td thhe vae vallue in yue in yoour dur daatta?a?
First of all, you have to know what is going to make you
great. If you want to run yourself as a company that is
data savvy, information savvy, analytics savvy, you need
great data about your business.
That means somebody is dictating. There is somebody
who says, "This is how we will define sales, this is how we
will define returns, this is when we will register revenue,
and we are all living by this rule. Until we do that, we
don't have data that's useful for most kinds of analytics.
We can still go out and buy demographic data and
probably learn something quite useful. But if we want to
know how to avoid stock-outs in our stores or what
products are of greatest interest to a particular customer
segment, we're going to need the data cleaned up." And
that's a major commitment. A lot of companies can't get
that done.
There are a lot of companies right now that are saying,
"Why don't we do something cool with analytics?" when
they have sloppy business processes and equally sloppy
data. And you know, they're just never going to get there.
WWhhaat it is as an exan exammpple ole of a cof a commppaanny ty thhaat ht haas ts thhe re rigighhtt
aapppprrooacach th to do daatta?a?
Aetna is a good example. In 2002, Ron Williams is
president, and he says, "Okay, we lost about $270 million
last year. Let's figure out what went wrong." He brings in
all of his senior execs, and he says, "Tell me about your
part of the business." And he said that every single line of
business showed data showing they were making a profit.
So, here's the dilemma: Everybody says their data is
showing that they made a profit, but the company is
losing a ton of money. Something's wrong.
Ron said, "The first thing I figured out is that I was going
to be the single source of truth. I was going to dictate
every piece of data, and you are going to use my
definition of data." What he got from that was totally
consistent reports, and then he knew how to guide people
through the process.
This wasn't to beat up on people. This was to get the truth
about the business so he knew what to fix. Because after
his first set of meetings, he had no idea what was broken.
It didn't look like anything was broken. This is what I
think the great leaders get right: they dictate a single
source of truth.
ThThaat's st's sucuch a gh a grreeaat exat exammpplele. B. Buut in tt in thhaat exat exammpplele, t, thherere ie iss
a cra criisisis. Is. In lieu on lieu of a crf a criisisis, ws, whhaat ct caan hn heellp tp to go get leet leaderaders ts too
rreecogcognize tnize thhaat tt thherere ne neeeedds ts to bo be a se a shifhift in tt in thhe wae way ty thheeyy
vavallue due daatta?a?
My best cases are all about a moment of truth where a
company just said well, we are going to change or we are
going to go under. A lot of them do create false crises.
We've worked a lot with Commonwealth Bank of
Australia. They didn't have a real crisis. In fact, they were,
by some measures, the largest bank in Australia. But
management defined a crisis, which was to say, "Our
operating costs are high and our customers' satisfaction
MITMIT SLSLOOAN MANAAN MANAGEMENGEMENT REVIEWT REVIEW
DDAATTA & ANALA & ANALYTICSYTICS
Copyright © Massachusetts Institute of Technology, 2012. All rights reserved. Reprint #54123 http://mitsmr.com/1oLuwZASPECIAL COLLECTION • “[TITLE]”• MIT SLOAN MANAGEMENT REVIEW 14

ratings are low. What this means is greatness is not
sustainable."
So they set two goals, one for operating costs and one for
customer satisfaction. Then, they looked at structurally
what was broken. And they started fixing the organization
— the processes, the technology and the data — in a
phased approach where they said, "We're just going to
keep getting better at certain things." And sure enough,
five years later, they are looking like an incredible
powerhouse.
You do have to have a burning platform. You have to have
this message that you're either under siege by competitors
or the world is changing and if you don't get on this train,
it's just going to leave you at the station.
ThThaat ct caalllls ts to mino mind td twwo po poottenenttiiaalllly coy conflicnflicttining ideg ideaas. Ons. Onee
iis ts thhe idee idea ta thhaat it it's rt's reeaalllly hy haarrd td to go get tet to bo be ne numumbber oer onnee,,
bbuut et evven hen haarrder tder to so sttaay ay at nt numumbber oer onnee. Th. The oe otthher ier is: if is: if itt
aain't bin't brrookkee, do, don't fix in't fix it. Ht. Hoow do yw do yoou cru creeaatte a be a bururninningg
ppllaattffoorrm, wm, whhen ten thherere ie is a ts a tenensiosion bn betetwweeen ten thhosose dife difffererenentt
minminddssets?ets?
That's a great contrast. Exactly right. How do you do that?
P&G was very much in this position in 2000. Results were
good but trends, particularly cost trends, were bad. They
had grown to 4 billion consumers. But the growth
markets were in developing countries. Those markets
really challenged their business model. In Turkey,
consumers often want to buy one diaper at a time. In
India, many consumers buy little, single-use shampoo
bottles. And suddenly, P&G is saying, "Wow, we want to
keep growing and our investors expect us to keep
growing, but we are really hitting some limits to our
standard processes."
That's their dilemma right now. Wall Street is saying,
"Guys, you need to grow." And yet, if you look at what
they are capable of doing, you think, "Man, a lot of
companies would kill to get there."
It's not clear how they get to the next level. What do you
do about that if you're P&G? That's really hard. Except
that you know two things. All the analysts are telling you
that Colgate and Unilever are not having the problem
you're having. That's a very interesting problem.
CCoouuld yld yoou expu expllaain tin thhe idee idea oa of sf sacracreed dd daatta ta thhaat yt yoou tu taallkkeedd
aabboouut in yt in yoour rur reecencentt e-Ce-Chhaat wt wiitthh AAlllAlAnnaallytytics.coics.comm??
First, I should tell you I learned this term from Tom
Nealon, the former CIO at Southwest Airlines [now a
board director there], and he got it from Charlie Feld,
who was the CIO at Frito-Lay and a variety of other
places. But the idea is simply that your data is not all
equal, and if you treat it as if it is all equal, you're never
going to get anywhere. So figure out first of all, what's the
single most important thing.
Tom said that at J.C. Penney's, which is where he went
after he was at Southwest, the purchases were the single
most important thing. You needed to know product,
basically. At Southwest, it had been the customer
reservation, because that runs through the entire system.
At UPS, it's the package data. By the way, UPS is brilliant
at analytics.
There are other things that matter. But you have to let the
others go until you've got the single most important data
fixed. Some of these fixes will not be as elegant as you
would like. What you'd love to do is just rip out all the
legacy that touches the customer record itself and start
from scratch, but you can only do that if you're willing to
MITMIT SLSLOOAN MANAAN MANAGEMENGEMENT REVIEWT REVIEW
DDAATTA & ANALA & ANALYTICSYTICS
Copyright © Massachusetts Institute of Technology, 2012. All rights reserved. Reprint #54123 http://mitsmr.com/1oLuwZASPECIAL COLLECTION • “[TITLE]”• MIT SLOAN MANAGEMENT REVIEW 15

turn it all off. Can you turn off all your systems for a year,
rebuild it? You can't.
We started learning this in the '90s. I think we were
surprised how hard it was. It was kind of like, "Yes, let me
fix my platform. Quick, put in SAP." And when that didn't
work, there was this depression on top of major financial
catastrophes. It's like, "What do we do now?" The
inclination is to say, "Well, ripping out the legacy and
replacing it with an ERP doesn't work, so we're not going
to do that." But if anybody's answering with "Oh, well,
then why don't we do data analytics instead," they are in
for a shock because they're really not going to have the
data to do the analytics — and they won't have the
discipline to implement any new processes required to
take advantage of the learning from analytics.
If your core data is bad, you can do analytics around the
edges, but you're never going to figure out how to avoid
stock-outs or better serve customers. You're not going to
figure it out because you don't have the data. There is just
some data that, as messy as the process is, you've got to
get right, and if you don't give that data all the attention it
needs, you're not going to get there.
WWhhaat do yt do yoou tu thinhink ik is rs resesppoonnsisibble fle foor tr thhe ne neew waw wavve oe off
ininttereresest in dt in daatta aa annd ad annaallytytics?ics?
Companies are starting to get better and better at storing
data and finding easy ways to get to it. So the technology
has made things possible that weren't possible before.
And companies have learned how to use that technology.
There is much more of a readiness than there was years
ago, when we learned that Capital One was doing these
incredible analytics that was making it possible for it to
customize credit cards to very small demographic
segments. Now it's like, "Wait a minute, shouldn't we all
be doing that?"
So I think there has been an announcement that analytics
has real potential at a moment when companies are
saying, "Wow, we have data that we never used to have,
and we have access to that data in ways we never dreamed
of. And then, there's all this external data that we can go
out and get. So yeah, let's analyze it. Let's get smart. Let's
do something our competitors can't do."
It feels like the moment for analytics, though it's still
much more about the promise than about the reality.
Some of the things we learn about our customers or
products or more general demographic trends have the
potential to stimulate some creative opportunities, but if a
company doesn't have a vision for how it will succeed,
these isolated findings will tend to distract rather than
drive business success. Businesses need core
competencies and they need digitized platforms if they
want to succeed in a digital economy and address the
learning from data analytics. That's the hard part of
analytics. Anyone can hire a quant jock to analyze some
data. Putting it into action requires enterprise capabilities.
WWhhen wen woouuld yld yoou su saay ty thihis ns neew waw wavve oe of inf inttereresest in dt in daatta aa anndd
aannaallytytics rics reeaalllly by begaegan?n?
The real excitement has been the last couple of years. It's
the "big data" thing. It's that suddenly we have petabytes.
What's interesting is that organizations go from terabytes
to petabytes, and both of them are unimaginable, right?
[A petabyte of data is a million times bigger than a
gigabyte and a thousand times bigger than a terabyte.]
And suddenly organizations find, "We're in petabytes.
And oh my goodness, we'd better get value from it." So
part of it is the hype. Part of it is that it's really possible to
MITMIT SLSLOOAN MANAAN MANAGEMENGEMENT REVIEWT REVIEW
DDAATTA & ANALA & ANALYTICSYTICS
Copyright © Massachusetts Institute of Technology, 2012. All rights reserved. Reprint #54123 http://mitsmr.com/1oLuwZASPECIAL COLLECTION • “[TITLE]”• MIT SLOAN MANAGEMENT REVIEW 16

enable our people to work smarter and to make strategic
decisions.
The hard part for a manager right now is focus. We just
don't know how much or how big or what next turn we
should take. And the sense is, "I shouldn't just sit around
and watch because other companies are getting smarter
and I'm watching." That feels like a bad formula.
MITMIT SLSLOOAN MANAAN MANAGEMENGEMENT REVIEWT REVIEW
DDAATTA & ANALA & ANALYTICSYTICS
Copyright © Massachusetts Institute of Technology, 2012. All rights reserved. Reprint #54123 http://mitsmr.com/1oLuwZASPECIAL COLLECTION • “[TITLE]”• MIT SLOAN MANAGEMENT REVIEW 17

About the Authors
David Kiron is executive editor ofMIT Sloan Management Review‘s
Big Ideas initiative. Renee BoucherFerguson is contributing editor ofthe Data and Analytics Innovation
Hub at MIT Sloan ManagementReview.
MITMIT SLSLOOAN MANAAN MANAGEMENGEMENT REVIEWT REVIEW
DDAATTA & ANALA & ANALYTICSYTICS
Copyright © Massachusetts Institute of Technology, 2012. All rights reserved. Reprint #54123 http://mitsmr.com/1oLuwZASPECIAL COLLECTION • “[TITLE]”• MIT SLOAN MANAGEMENT REVIEW 18

PDFs Reprints Permission to Copy Back Issues
Articles published in MIT Sloan Management Review are copyrighted by theMassachusetts Institute of Technology unless otherwise specified at the end of anarticle.
MIT Sloan Management Review articles, permissions, and back issues can bepurchased on our Web site: sloanreview.mit.edu or you may order through ourBusiness Service Center (9 a.m.-5 p.m. ET) at the phone numbers listed below.Paper reprints are available in quantities of 250 or more.
To reproduce or transmit one or more MIT Sloan Management Review articles byelectronic or mechanical means (including photocopying or archiving in anyinformation storage or retrieval system) requires written permission.
To request permission, use our Web site: sloanreview.mit.eduorE-mail: [email protected] (US and International):617-253-7170 Fax: 617-258-9739
Posting of full-text SMR articles on publicly accessible Internet sites isprohibited. To obtain permission to post articles on secure and/or password-protected intranet sites, e-mail your request to [email protected].
MITMIT SLSLOOAN MANAAN MANAGEMENGEMENT REVIEWT REVIEW
SAS and all other SAS Institute Inc. product or service names are registered trademarks or trademarks of SAS Institute Inc. in the USA and other countries. ® indicates USA registration. Other brand and product names are trademarks of their respective companies. 107969_S146054.1015