Embed Size (px)
Citation preview
What makes an Airline attractive to Insurers?
Olivier Marre, SVP Aviation Insurance
RAASI Conference
Moscow December 9th 2009
A member of the Max Capital Group B E R M U D A I R E L A N D U N I T E D S T A T E S
2
Insurers are not passengers
Main passenger attraction factors are not key to risk assessment
Price of the tickets Flight schedules In flight services
Some other factors are more informative
Flight cancellations On time performance
3
Insurers are not investors
Investors key ratios are not as critical to insurers
Cost structure Cash available Profitability
Some other elements represent more valuable information but could have different reading
Growth plans Fleet development

4
What insurers want ?
Insurers want to be able to ascertain the probability and magnitude of claims under the forthcoming insurance policy and compare it with the offered
premium

5
How do insurers compute probable future claims ?
By studying the past : claims history
Through exposure based predictive actuarial models
6
The relative importance of claims history
Overall Loss Ratio or “Credit Balance” are not as important as the Insured may think
Because of the catastrophic nature of the cover offered In terms of frequency In terms of severity
Because a single cat loss does not necessarily help to predict the future
Claims frequency and attritions are often far more important information
7
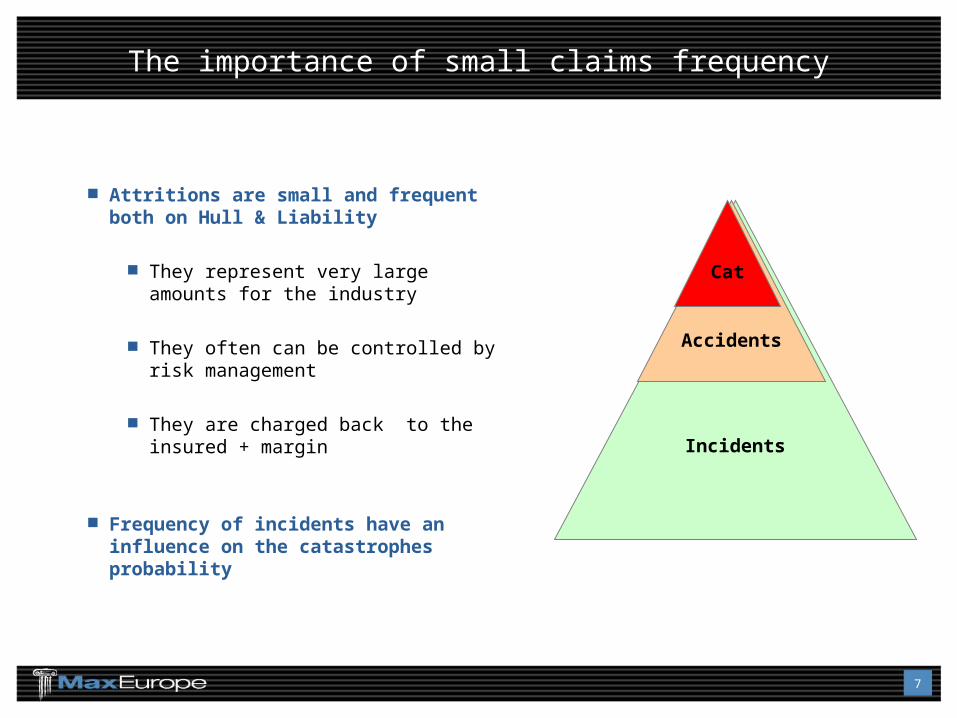
The importance of small claims frequency
Attritions are small and frequent both on Hull & Liability
They represent very large amounts for the industry
They often can be controlled by risk management
They are charged back to the insured + margin
Frequency of incidents have an influence on the catastrophes probability
Incidents
Accidents
Cat

8
Predictive models are what set the premium level
Predictive models analyze
The probable frequency of losses The probable severity of losses
Simulate a given year a very large number of times
Compute a premium taking into consideration
The expected loss level The volatility of expected losses
9
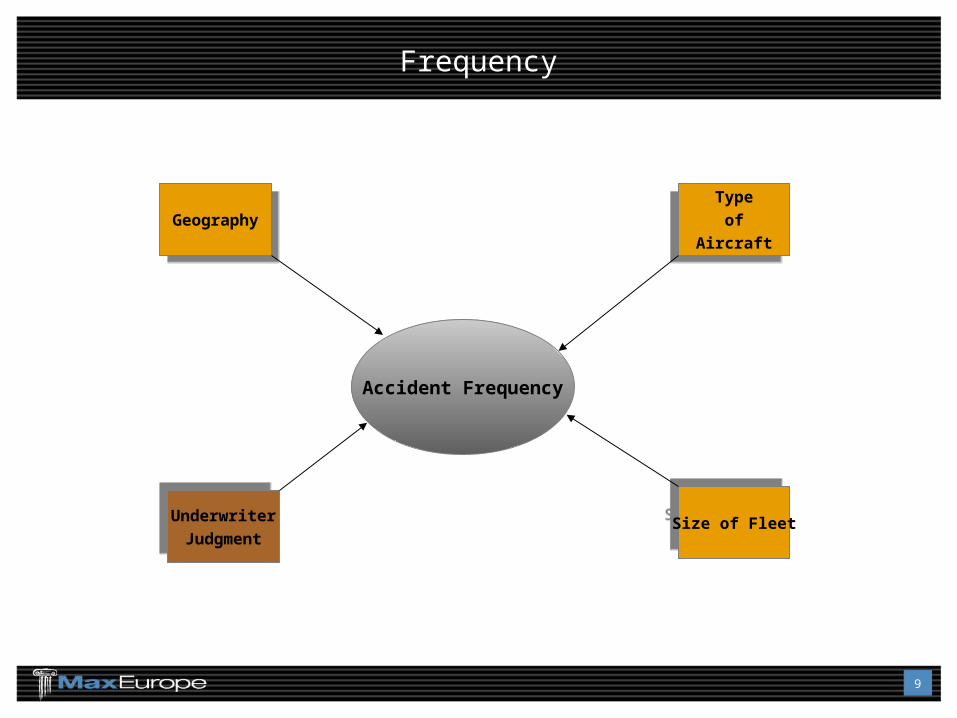
Frequency
Accident Frequency
Size of FleetSize of Fleet
Type
of
Aircraft
Type
of
AircraftGeographyGeography
Underwriter
JudgmentUnderwriter
Judgment
10
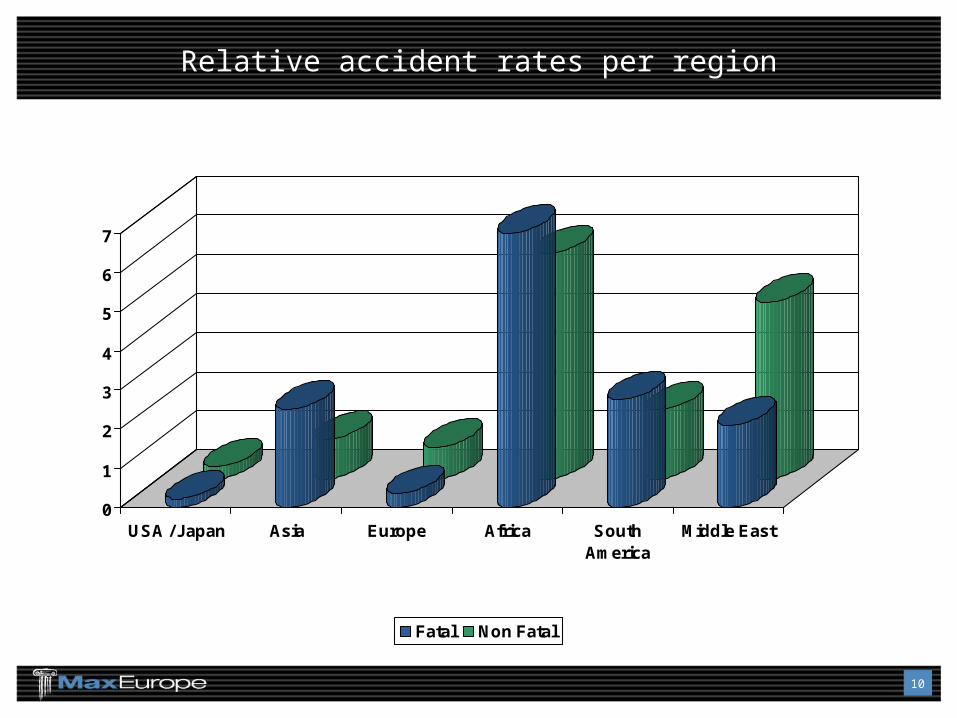
Relative accident rates per region
0
1
2
3
4
5
6
7
USA / Japan Asia Europe Africa SouthAmerica
Middle East
Fatal Non Fatal
11
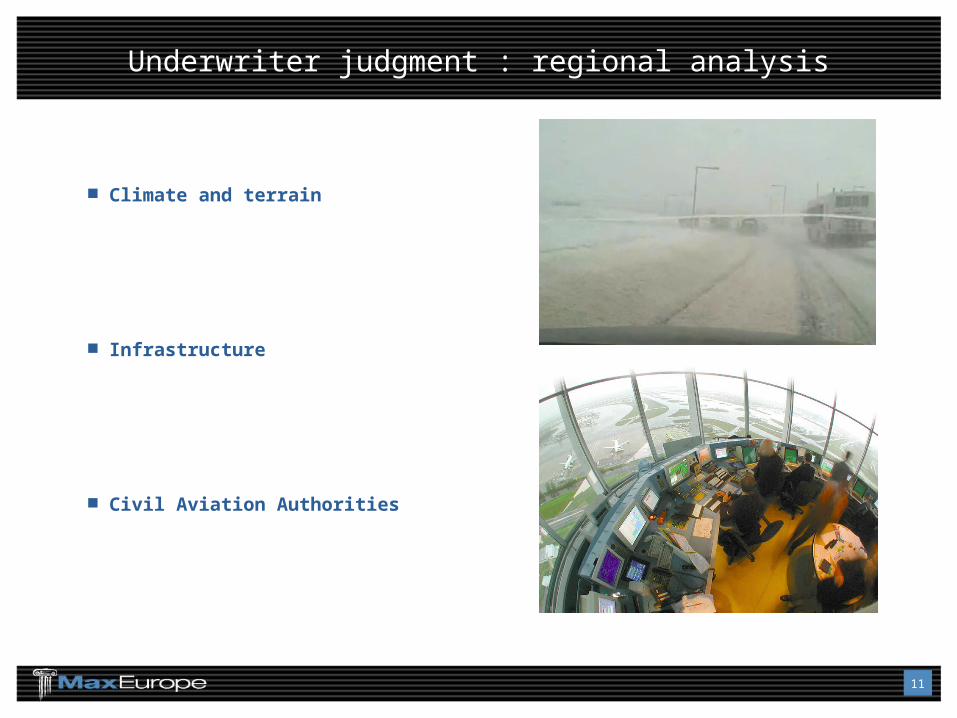
Underwriter judgment : regional analysis
Climate and terrain
Infrastructure
Civil Aviation Authorities
12
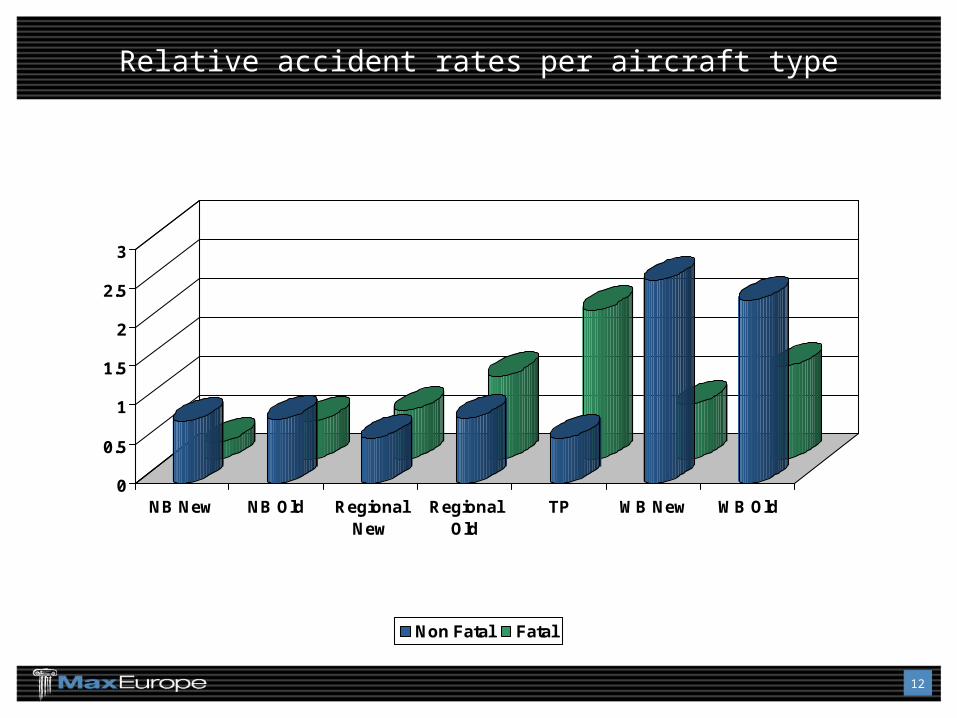
Relative accident rates per aircraft type
0
0.5
1
1.5
2
2.5
3
NB New NB Old RegionalNew
RegionalOld
TP WB New WB Old
Non Fatal Fatal
13
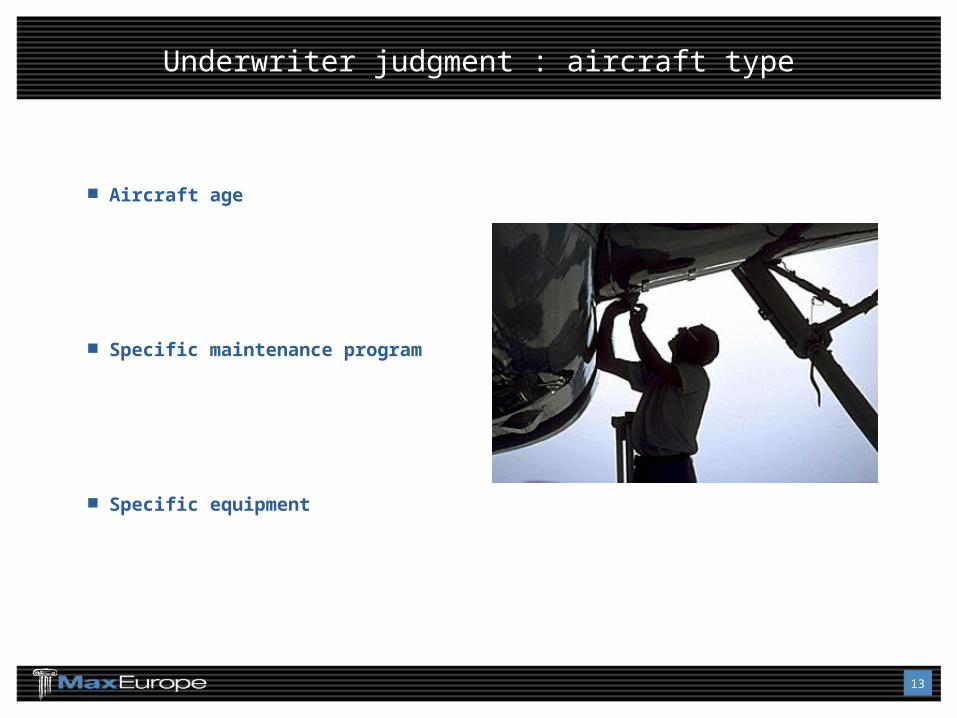
Underwriter judgment : aircraft type
Aircraft age
Specific maintenance program
Specific equipment
14
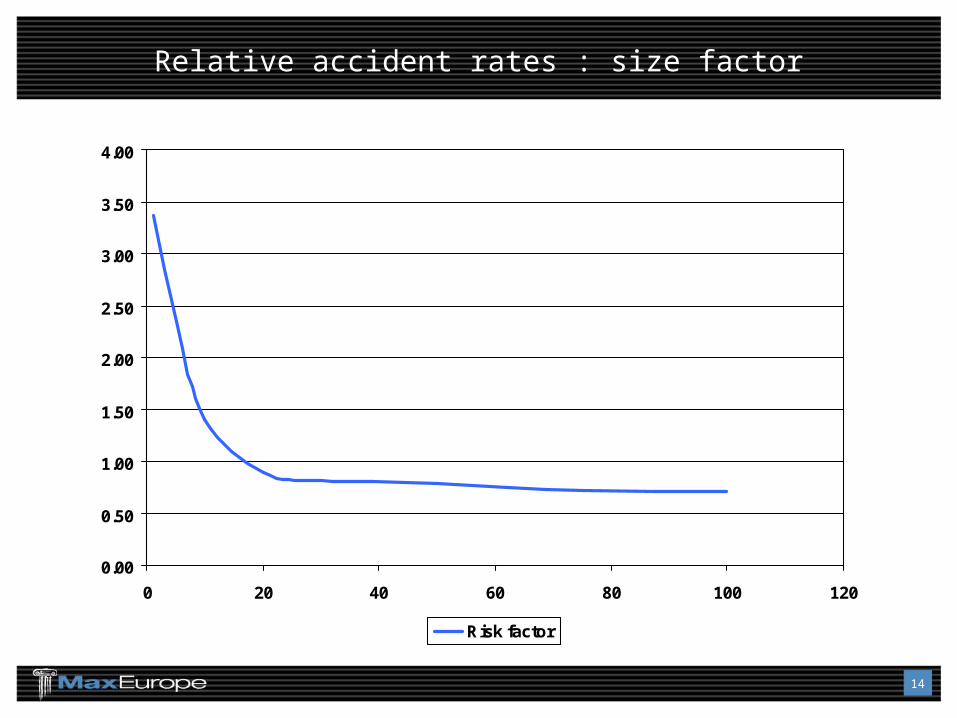
Relative accident rates : size factor
0.00
0.50
1.00
1.50
2.00
2.50
3.00
3.50
4.00
0 20 40 60 80 100 120
Risk factor
15
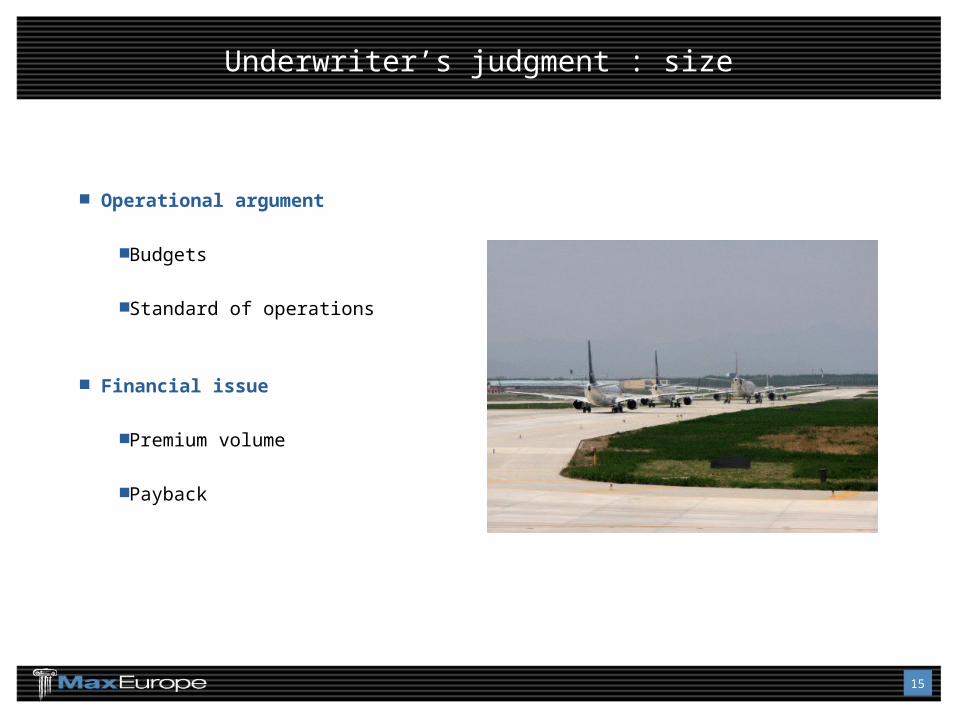
Underwriter’s judgment : size
Operational argument
Budgets
Standard of operations
Financial issue
Premium volume
Payback
16
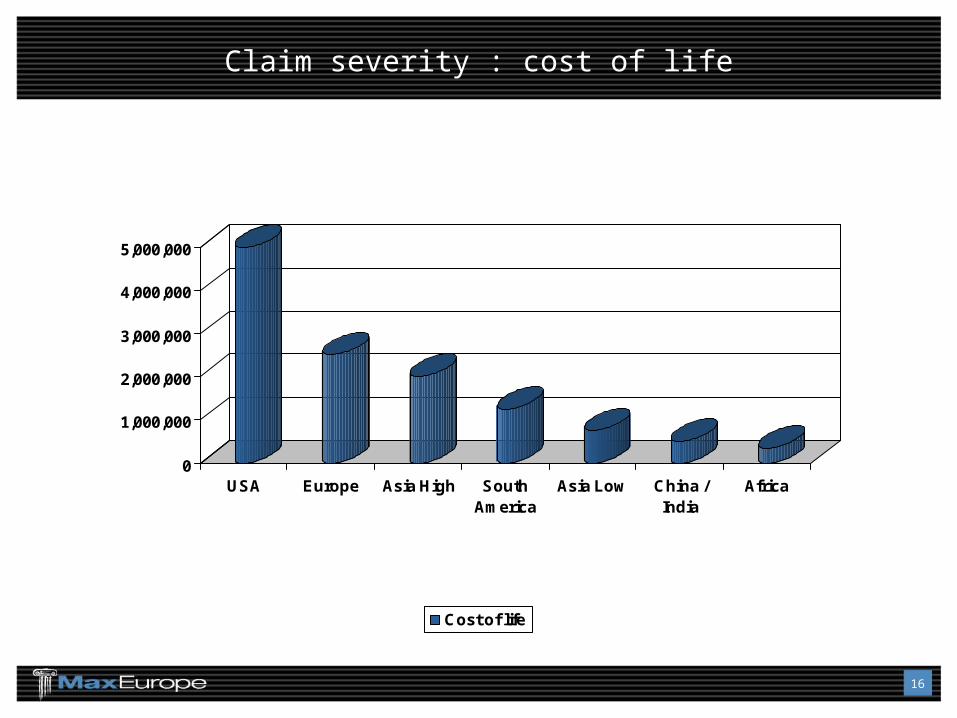
Claim severity : cost of life
0
1,000,000
2,000,000
3,000,000
4,000,000
5,000,000
USA Europe Asia High SouthAmerica
Asia Low China /India
Africa
Cost of life

17
Underwriter judgment : cost of life
Passenger nationality
Passenger profile
Specific legislation
18
Underwriter judgment : Relationship
Transparency
Risk visits
Updates
Continuity
An attractive airline is an airline you can justify having insured
the day after it had a major loss