Embed Size (px)
Citation preview
What makes an image memorable?
Phillip Isola Jianxiong Xiao Antonio Torralba Aude Oliva{phillipi, jxiao, torralba, oliva}@mit.edu
Massachusetts Institute of Technology
Abstract
When glancing at a magazine, or browsing the Internet,we are continuously being exposed to photographs. De-spite of this overflow of visual information, humans are ex-tremely good at remembering thousands of pictures alongwith some of their visual details. But not all images areequal in memory. Some stitch to our minds, and other areforgotten. In this paper we focus on the problem of pre-dicting how memorable an image will be. We show thatmemorability is a stable property of an image that is sharedacross different viewers. We introduce a database for whichwe have measured the probability that each picture will beremembered after a single view. We analyze image featuresand labels that contribute to making an image memorable,and we train a predictor based on global image descriptors.We find that predicting image memorability is a task thatcan be addressed with current computer vision techniques.Whereas making memorable images is a challenging task invisualization and photography, this work is a first attempt toquantify this useful quality of images.
1. Introduction
People have a remarkable ability to remember particularimages in long-term memory, even those depicting everyday scenes and events [23], or the shapes of arbitrary forms[19]. We do not just remember the gist of a picture, but weare able to recognize which precise image we saw and someof its details [1, 19]. In addition to remembering particularimages as icons, we also have the intuition that not all im-ages are remembered equally. Some pictures stick in ourminds whereas others fade away. The reasons why someimages are remembered are varied; some pictures mightcontain friends, a fun event involving family members, ora particular moment during a trip. Other images might notcontain any recognizable monuments or people and yet alsobe highly memorable [1, 12, 11, 19]. In this paper we areinterested in this latter group of pictures: what are the in-trinsic image features that may make an image memorable?
Whereas most studies on human memory have been de-
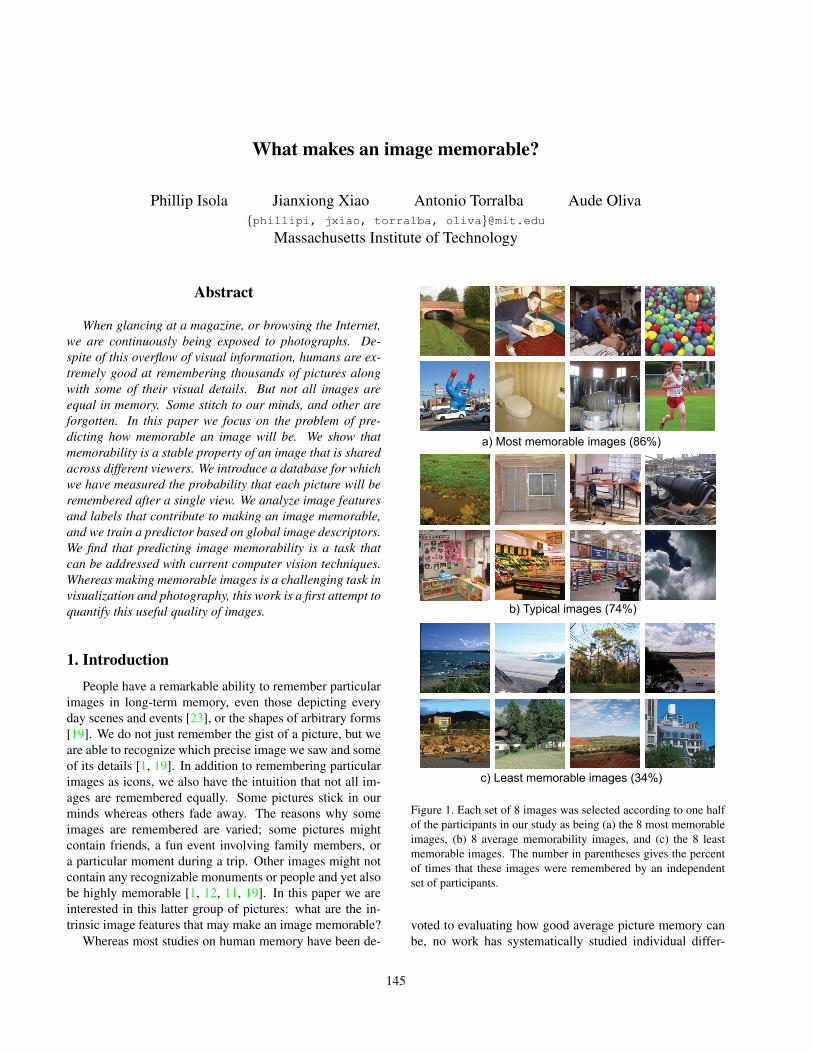
a) Most memorable images (86%)
b) Typical images (74%)
c) Least memorable images (34%)
Figure 1. Each set of 8 images was selected according to one halfof the participants in our study as being (a) the 8 most memorableimages, (b) 8 average memorability images, and (c) the 8 leastmemorable images. The number in parentheses gives the percentof times that these images were remembered by an independentset of participants.
voted to evaluating how good average picture memory canbe, no work has systematically studied individual differ-
145
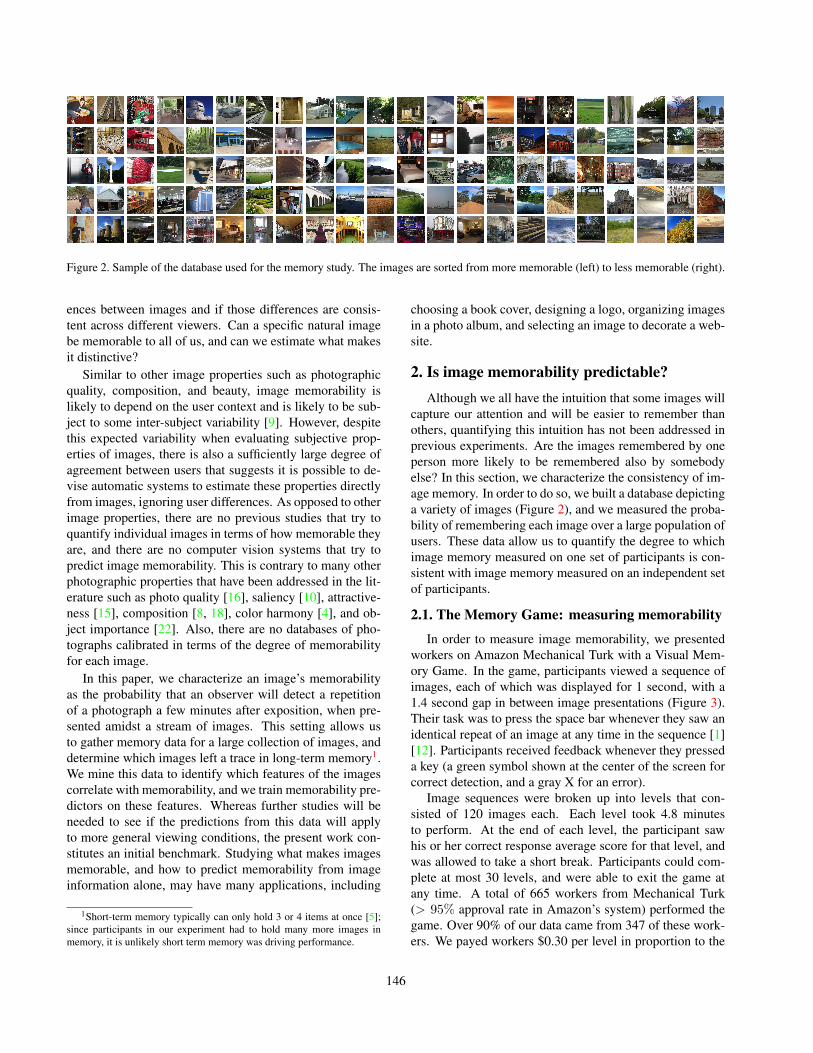
Figure 2. Sample of the database used for the memory study. The images are sorted from more memorable (left) to less memorable (right).
ences between images and if those differences are consis-tent across different viewers. Can a specific natural imagebe memorable to all of us, and can we estimate what makesit distinctive?
Similar to other image properties such as photographicquality, composition, and beauty, image memorability islikely to depend on the user context and is likely to be sub-ject to some inter-subject variability [9]. However, despitethis expected variability when evaluating subjective prop-erties of images, there is also a sufficiently large degree ofagreement between users that suggests it is possible to de-vise automatic systems to estimate these properties directlyfrom images, ignoring user differences. As opposed to otherimage properties, there are no previous studies that try toquantify individual images in terms of how memorable theyare, and there are no computer vision systems that try topredict image memorability. This is contrary to many otherphotographic properties that have been addressed in the lit-erature such as photo quality [16], saliency [10], attractive-ness [15], composition [8, 18], color harmony [4], and ob-ject importance [22]. Also, there are no databases of pho-tographs calibrated in terms of the degree of memorabilityfor each image.
In this paper, we characterize an image’s memorabilityas the probability that an observer will detect a repetitionof a photograph a few minutes after exposition, when pre-sented amidst a stream of images. This setting allows usto gather memory data for a large collection of images, anddetermine which images left a trace in long-term memory1.We mine this data to identify which features of the imagescorrelate with memorability, and we train memorability pre-dictors on these features. Whereas further studies will beneeded to see if the predictions from this data will applyto more general viewing conditions, the present work con-stitutes an initial benchmark. Studying what makes imagesmemorable, and how to predict memorability from imageinformation alone, may have many applications, including
1Short-term memory typically can only hold 3 or 4 items at once [5];since participants in our experiment had to hold many more images inmemory, it is unlikely short term memory was driving performance.
choosing a book cover, designing a logo, organizing imagesin a photo album, and selecting an image to decorate a web-site.
2. Is image memorability predictable?
Although we all have the intuition that some images willcapture our attention and will be easier to remember thanothers, quantifying this intuition has not been addressed inprevious experiments. Are the images remembered by oneperson more likely to be remembered also by somebodyelse? In this section, we characterize the consistency of im-age memory. In order to do so, we built a database depictinga variety of images (Figure 2), and we measured the proba-bility of remembering each image over a large population ofusers. These data allow us to quantify the degree to whichimage memory measured on one set of participants is con-sistent with image memory measured on an independent setof participants.
2.1. The Memory Game: measuring memorability
In order to measure image memorability, we presentedworkers on Amazon Mechanical Turk with a Visual Mem-ory Game. In the game, participants viewed a sequence ofimages, each of which was displayed for 1 second, with a1.4 second gap in between image presentations (Figure 3).Their task was to press the space bar whenever they saw anidentical repeat of an image at any time in the sequence [1][12]. Participants received feedback whenever they presseda key (a green symbol shown at the center of the screen forcorrect detection, and a gray X for an error).
Image sequences were broken up into levels that con-sisted of 120 images each. Each level took 4.8 minutesto perform. At the end of each level, the participant sawhis or her correct response average score for that level, andwas allowed to take a short break. Participants could com-plete at most 30 levels, and were able to exit the game atany time. A total of 665 workers from Mechanical Turk(> 95% approval rate in Amazon’s system) performed thegame. Over 90% of our data came from 347 of these work-ers. We payed workers $0.30 per level in proportion to the
146
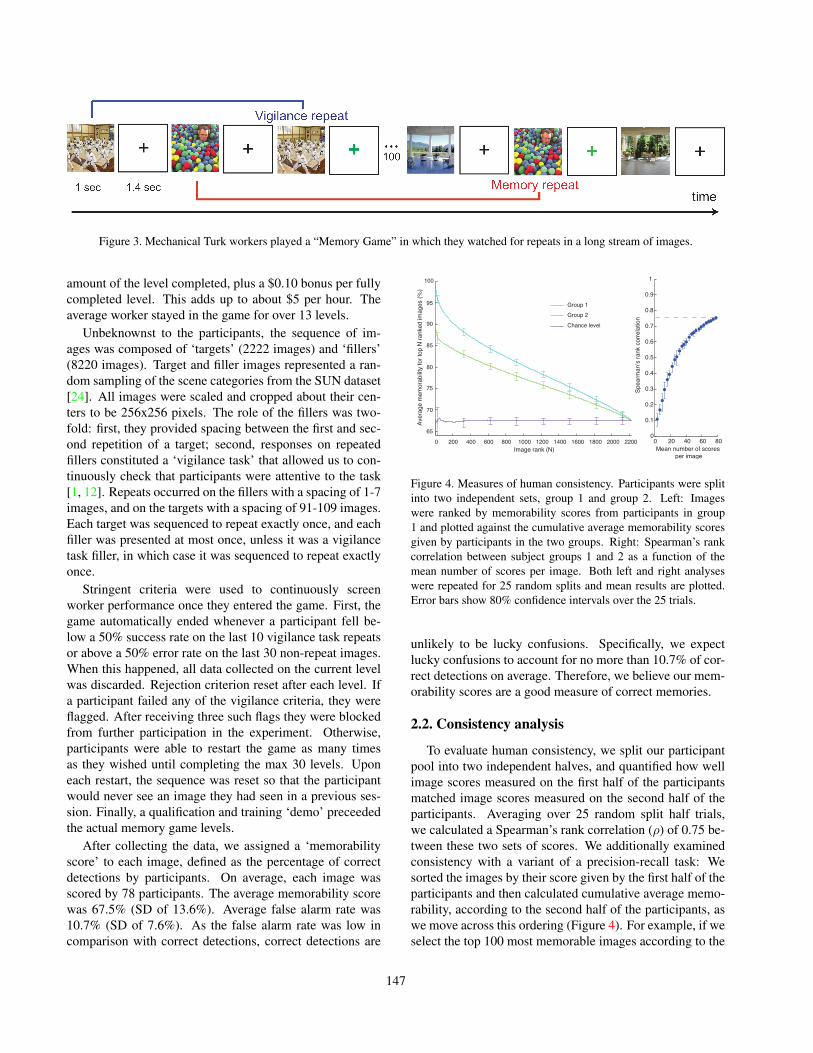
Figure 3. Mechanical Turk workers played a “Memory Game” in which they watched for repeats in a long stream of images.
amount of the level completed, plus a $0.10 bonus per fullycompleted level. This adds up to about $5 per hour. Theaverage worker stayed in the game for over 13 levels.
Unbeknownst to the participants, the sequence of im-ages was composed of ‘targets’ (2222 images) and ‘fillers’(8220 images). Target and filler images represented a ran-dom sampling of the scene categories from the SUN dataset[24]. All images were scaled and cropped about their cen-ters to be 256x256 pixels. The role of the fillers was two-fold: first, they provided spacing between the first and sec-ond repetition of a target; second, responses on repeatedfillers constituted a ‘vigilance task’ that allowed us to con-tinuously check that participants were attentive to the task[1, 12]. Repeats occurred on the fillers with a spacing of 1-7images, and on the targets with a spacing of 91-109 images.Each target was sequenced to repeat exactly once, and eachfiller was presented at most once, unless it was a vigilancetask filler, in which case it was sequenced to repeat exactlyonce.
Stringent criteria were used to continuously screenworker performance once they entered the game. First, thegame automatically ended whenever a participant fell be-low a 50% success rate on the last 10 vigilance task repeatsor above a 50% error rate on the last 30 non-repeat images.When this happened, all data collected on the current levelwas discarded. Rejection criterion reset after each level. Ifa participant failed any of the vigilance criteria, they wereflagged. After receiving three such flags they were blockedfrom further participation in the experiment. Otherwise,participants were able to restart the game as many timesas they wished until completing the max 30 levels. Uponeach restart, the sequence was reset so that the participantwould never see an image they had seen in a previous ses-sion. Finally, a qualification and training ‘demo’ preceededthe actual memory game levels.
After collecting the data, we assigned a ‘memorabilityscore’ to each image, defined as the percentage of correctdetections by participants. On average, each image wasscored by 78 participants. The average memorability scorewas 67.5% (SD of 13.6%). Average false alarm rate was10.7% (SD of 7.6%). As the false alarm rate was low incomparison with correct detections, correct detections are
200 400 600 800 1000 1200 1400 1600 1800 2000 2200
65
75
85
90
95
100
Group 1
Group 2
Chance level
80
70
Image rank (N)
Aver
age
mem
orab
ility
for t
op N
rank
ed im
ages
(%)
0 0 20 40 60 800
0.1
0.2
0.3
0.4
0.5
0.6
0.7
0.8
0.9
1
Mean number of scores per image
Spea
rman’s
rank
cor
rela
tion
Figure 4. Measures of human consistency. Participants were splitinto two independent sets, group 1 and group 2. Left: Imageswere ranked by memorability scores from participants in group1 and plotted against the cumulative average memorability scoresgiven by participants in the two groups. Right: Spearman’s rankcorrelation between subject groups 1 and 2 as a function of themean number of scores per image. Both left and right analyseswere repeated for 25 random splits and mean results are plotted.Error bars show 80% confidence intervals over the 25 trials.
unlikely to be lucky confusions. Specifically, we expectlucky confusions to account for no more than 10.7% of cor-rect detections on average. Therefore, we believe our mem-orability scores are a good measure of correct memories.
2.2. Consistency analysis
To evaluate human consistency, we split our participantpool into two independent halves, and quantified how wellimage scores measured on the first half of the participantsmatched image scores measured on the second half of theparticipants. Averaging over 25 random split half trials,we calculated a Spearman’s rank correlation (ρ) of 0.75 be-tween these two sets of scores. We additionally examinedconsistency with a variant of a precision-recall task: Wesorted the images by their score given by the first half of theparticipants and then calculated cumulative average memo-rability, according to the second half of the participants, aswe move across this ordering (Figure 4). For example, if weselect the top 100 most memorable images according to the
147
first half of the participants (whose average memorabilityfor this set is 93%), the second half of the participants willgive an average memorability of 85% for that set. Figure1 shows sample image sets selected and measured in thisfashion. This analysis shows how high human-to-humanmemorability consistency can be.
Thus, our data has enough consistency that it should bepossible to predict image memorability. Individual differ-ences and random variability in the context each participantsaw add noise to the estimation; nonetheless, this level ofconsistency suggests that information intrinsic to the im-ages might be used by different people to remember them.In the next section, we search for this image information.
3. What makes an image memorable?
Among the many reasons why an image might be re-membered by a viewer, we investigate first the followingfactors: color, simple image features, object statistics, ob-ject semantics, and scene semantics.
3.1. Color and simple image features
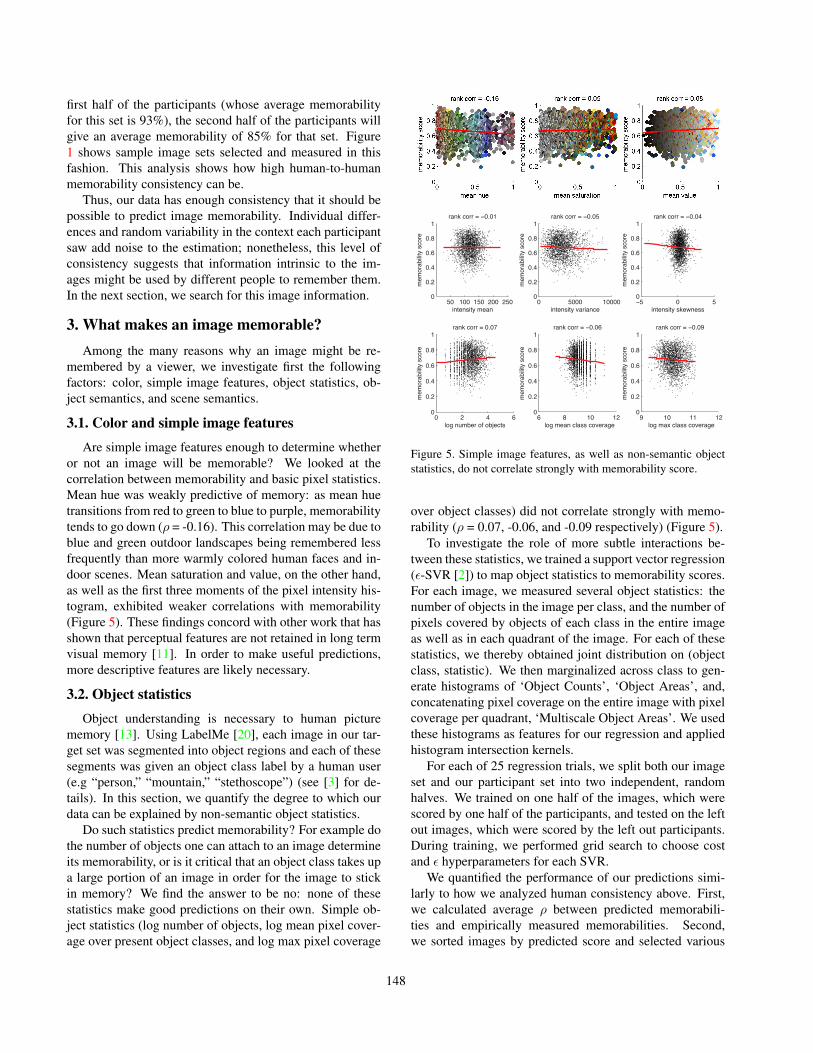
Are simple image features enough to determine whetheror not an image will be memorable? We looked at thecorrelation between memorability and basic pixel statistics.Mean hue was weakly predictive of memory: as mean huetransitions from red to green to blue to purple, memorabilitytends to go down (ρ = -0.16). This correlation may be due toblue and green outdoor landscapes being remembered lessfrequently than more warmly colored human faces and in-door scenes. Mean saturation and value, on the other hand,as well as the first three moments of the pixel intensity his-togram, exhibited weaker correlations with memorability(Figure 5). These findings concord with other work that hasshown that perceptual features are not retained in long termvisual memory [11]. In order to make useful predictions,more descriptive features are likely necessary.
3.2. Object statistics
Object understanding is necessary to human picturememory [13]. Using LabelMe [20], each image in our tar-get set was segmented into object regions and each of thesesegments was given an object class label by a human user(e.g “person,” “mountain,” “stethoscope”) (see [3] for de-tails). In this section, we quantify the degree to which ourdata can be explained by non-semantic object statistics.
Do such statistics predict memorability? For example dothe number of objects one can attach to an image determineits memorability, or is it critical that an object class takes upa large portion of an image in order for the image to stickin memory? We find the answer to be no: none of thesestatistics make good predictions on their own. Simple ob-ject statistics (log number of objects, log mean pixel cover-age over present object classes, and log max pixel coverage
0 2 4 60
0.2
0.4
0.6
0.8
1
log number of objectsm
emor
abilit
y sc
ore
rank corr = 0.07
6 8 10 120
0.2
0.4
0.6
0.8
1
log mean class coverage
mem
orab
ility
scor
e
9 10 11 120
0.2
0.4
0.6
0.8
1
log max class coverage
mem
orab
ility
scor
e
50 100 150 200 2500
0.2
0.4
0.6
0.8
1
intensity mean
mem
orab
ility
scor
e
0 5000 100000
0.2
0.4
0.6
0.8
1
intensity variance
mem
orab
ility
scor
e
0 50
0.2
0.4
0.6
0.8
1
intensity skewness
mem
orab
ility
scor
e
Figure 5. Simple image features, as well as non-semantic objectstatistics, do not correlate strongly with memorability score.
over object classes) did not correlate strongly with memo-rability (ρ = 0.07, -0.06, and -0.09 respectively) (Figure 5).
To investigate the role of more subtle interactions be-tween these statistics, we trained a support vector regression(�-SVR [2]) to map object statistics to memorability scores.For each image, we measured several object statistics: thenumber of objects in the image per class, and the number ofpixels covered by objects of each class in the entire imageas well as in each quadrant of the image. For each of thesestatistics, we thereby obtained joint distribution on (objectclass, statistic). We then marginalized across class to gen-erate histograms of ‘Object Counts’, ‘Object Areas’, and,concatenating pixel coverage on the entire image with pixelcoverage per quadrant, ‘Multiscale Object Areas’. We usedthese histograms as features for our regression and appliedhistogram intersection kernels.
For each of 25 regression trials, we split both our imageset and our participant set into two independent, randomhalves. We trained on one half of the images, which werescored by one half of the participants, and tested on the leftout images, which were scored by the left out participants.During training, we performed grid search to choose costand � hyperparameters for each SVR.
We quantified the performance of our predictions simi-larly to how we analyzed human consistency above. First,we calculated average ρ between predicted memorabili-ties and empirically measured memorabilities. Second,we sorted images by predicted score and selected various
148
Object Object Multiscale Object Labeled Labeled Labeled Scene Objects OtherCounts Areas Object Label Object Object Multiscale Category and Humans
Areas Presences Counts Areas Object Areas ScenesTop 20 68% 67% 73% 84% 82% 84% 84% 81% 85% 86%Top 100 68% 68% 73% 79% 79% 82% 82% 78% 82% 84%
Bottom 100 67% 64% 64% 57% 57% 56% 56% 57% 55% 47%Bottom 20 67% 63% 65% 55% 54% 53% 52% 55% 53% 40%
ρ 0.05 0.05 0.20 0.43 0.44 0.47 0.48 0.37 0.50 0.75
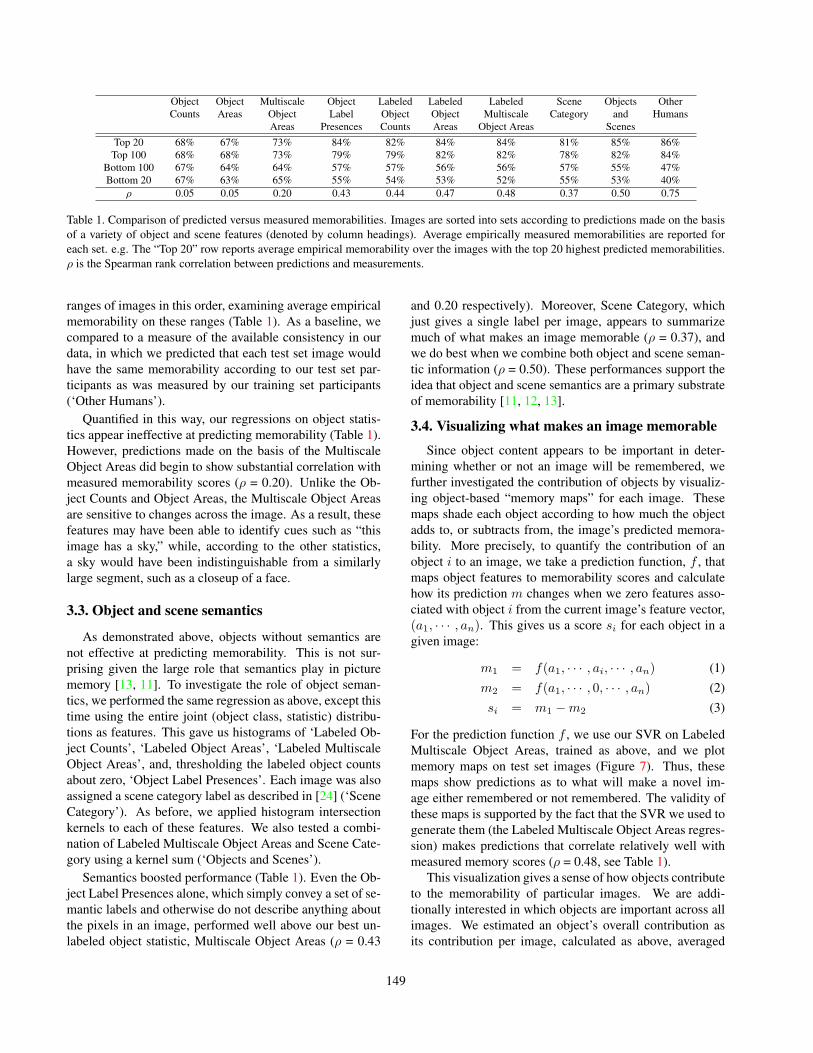
Table 1. Comparison of predicted versus measured memorabilities. Images are sorted into sets according to predictions made on the basisof a variety of object and scene features (denoted by column headings). Average empirically measured memorabilities are reported foreach set. e.g. The “Top 20” row reports average empirical memorability over the images with the top 20 highest predicted memorabilities.ρ is the Spearman rank correlation between predictions and measurements.
ranges of images in this order, examining average empiricalmemorability on these ranges (Table 1). As a baseline, wecompared to a measure of the available consistency in ourdata, in which we predicted that each test set image wouldhave the same memorability according to our test set par-ticipants as was measured by our training set participants(‘Other Humans’).
Quantified in this way, our regressions on object statis-tics appear ineffective at predicting memorability (Table 1).However, predictions made on the basis of the MultiscaleObject Areas did begin to show substantial correlation withmeasured memorability scores (ρ = 0.20). Unlike the Ob-ject Counts and Object Areas, the Multiscale Object Areasare sensitive to changes across the image. As a result, thesefeatures may have been able to identify cues such as “thisimage has a sky,” while, according to the other statistics,a sky would have been indistinguishable from a similarlylarge segment, such as a closeup of a face.
3.3. Object and scene semantics
As demonstrated above, objects without semantics arenot effective at predicting memorability. This is not sur-prising given the large role that semantics play in picturememory [13, 11]. To investigate the role of object seman-tics, we performed the same regression as above, except thistime using the entire joint (object class, statistic) distribu-tions as features. This gave us histograms of ‘Labeled Ob-ject Counts’, ‘Labeled Object Areas’, ‘Labeled MultiscaleObject Areas’, and, thresholding the labeled object countsabout zero, ‘Object Label Presences’. Each image was alsoassigned a scene category label as described in [24] (‘SceneCategory’). As before, we applied histogram intersectionkernels to each of these features. We also tested a combi-nation of Labeled Multiscale Object Areas and Scene Cate-gory using a kernel sum (‘Objects and Scenes’).
Semantics boosted performance (Table 1). Even the Ob-ject Label Presences alone, which simply convey a set of se-mantic labels and otherwise do not describe anything aboutthe pixels in an image, performed well above our best un-labeled object statistic, Multiscale Object Areas (ρ = 0.43
and 0.20 respectively). Moreover, Scene Category, whichjust gives a single label per image, appears to summarizemuch of what makes an image memorable (ρ = 0.37), andwe do best when we combine both object and scene seman-tic information (ρ = 0.50). These performances support theidea that object and scene semantics are a primary substrateof memorability [11, 12, 13].
3.4. Visualizing what makes an image memorable
Since object content appears to be important in deter-mining whether or not an image will be remembered, wefurther investigated the contribution of objects by visualiz-ing object-based “memory maps” for each image. Thesemaps shade each object according to how much the objectadds to, or subtracts from, the image’s predicted memora-bility. More precisely, to quantify the contribution of anobject i to an image, we take a prediction function, f , thatmaps object features to memorability scores and calculatehow its prediction m changes when we zero features asso-ciated with object i from the current image’s feature vector,(a1, · · · , an). This gives us a score si for each object in agiven image:
m1 = f(a1, · · · , ai, · · · , an) (1)m2 = f(a1, · · · , 0, · · · , an) (2)si = m1 −m2 (3)
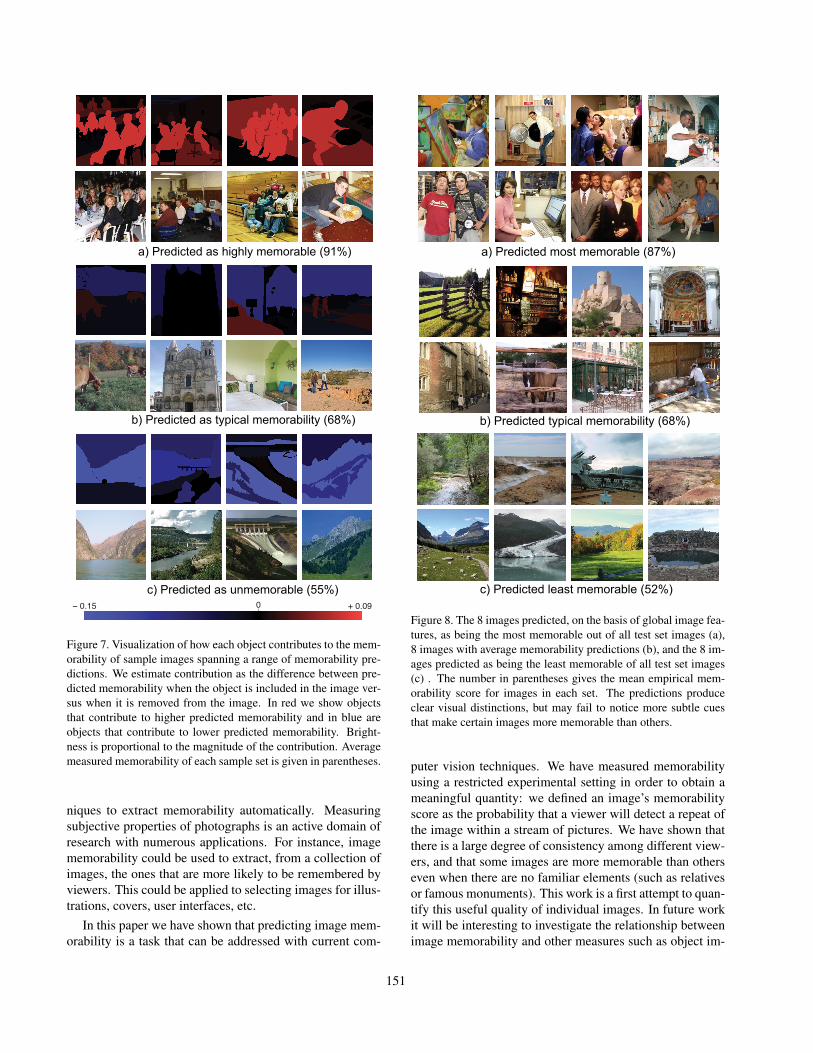
For the prediction function f , we use our SVR on LabeledMultiscale Object Areas, trained as above, and we plotmemory maps on test set images (Figure 7). Thus, thesemaps show predictions as to what will make a novel im-age either remembered or not remembered. The validity ofthese maps is supported by the fact that the SVR we used togenerate them (the Labeled Multiscale Object Areas regres-sion) makes predictions that correlate relatively well withmeasured memory scores (ρ = 0.48, see Table 1).
This visualization gives a sense of how objects contributeto the memorability of particular images. We are addi-tionally interested in which objects are important across allimages. We estimated an object’s overall contribution asits contribution per image, calculated as above, averaged
149
person sitting (+0.053)person (+0.061) floor (+0.027) seats (+0.023) car (+0.020)
buildingceiling treesky ( mountain
Top objects
Bottomobjects
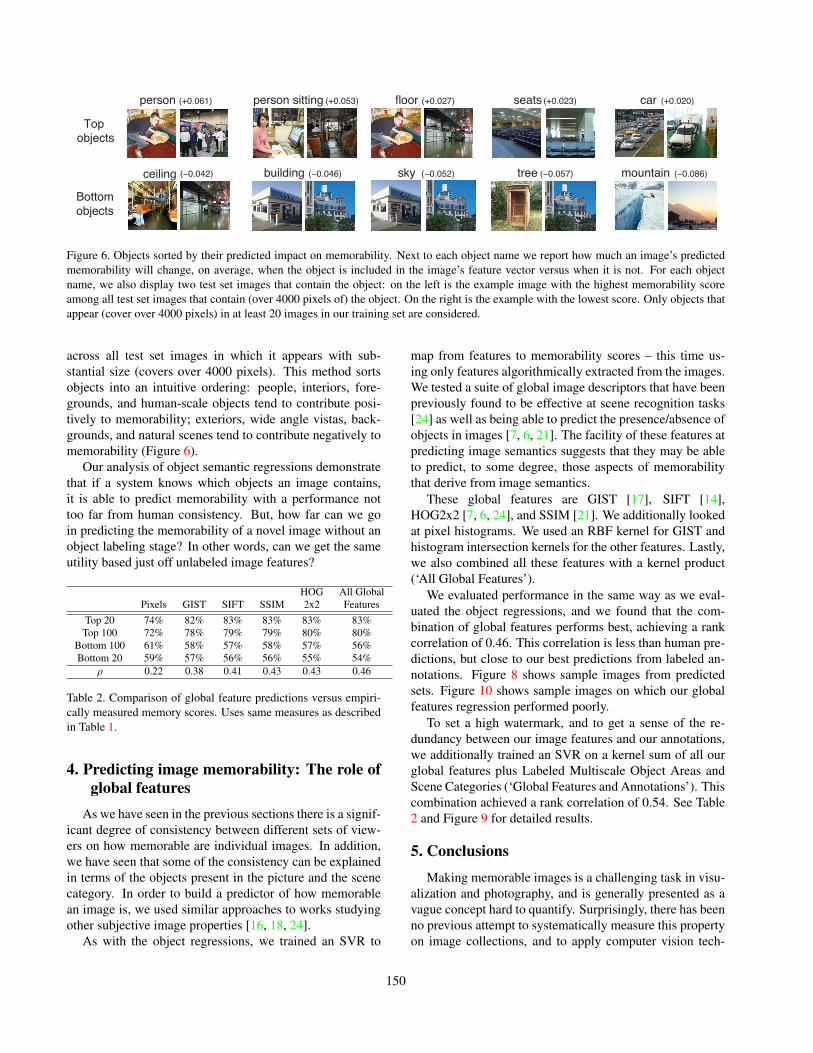
Figure 6. Objects sorted by their predicted impact on memorability. Next to each object name we report how much an image’s predictedmemorability will change, on average, when the object is included in the image’s feature vector versus when it is not. For each objectname, we also display two test set images that contain the object: on the left is the example image with the highest memorability scoreamong all test set images that contain (over 4000 pixels of) the object. On the right is the example with the lowest score. Only objects thatappear (cover over 4000 pixels) in at least 20 images in our training set are considered.
across all test set images in which it appears with sub-stantial size (covers over 4000 pixels). This method sortsobjects into an intuitive ordering: people, interiors, fore-grounds, and human-scale objects tend to contribute posi-tively to memorability; exteriors, wide angle vistas, back-grounds, and natural scenes tend to contribute negatively tomemorability (Figure 6).
Our analysis of object semantic regressions demonstratethat if a system knows which objects an image contains,it is able to predict memorability with a performance nottoo far from human consistency. But, how far can we goin predicting the memorability of a novel image without anobject labeling stage? In other words, can we get the sameutility based just off unlabeled image features?
HOG All GlobalPixels GIST SIFT SSIM 2x2 Features
Top 20 74% 82% 83% 83% 83% 83%Top 100 72% 78% 79% 79% 80% 80%
Bottom 100 61% 58% 57% 58% 57% 56%Bottom 20 59% 57% 56% 56% 55% 54%
ρ 0.22 0.38 0.41 0.43 0.43 0.46
Table 2. Comparison of global feature predictions versus empiri-cally measured memory scores. Uses same measures as describedin Table 1.
4. Predicting image memorability: The role of
global features
As we have seen in the previous sections there is a signif-icant degree of consistency between different sets of view-ers on how memorable are individual images. In addition,we have seen that some of the consistency can be explainedin terms of the objects present in the picture and the scenecategory. In order to build a predictor of how memorablean image is, we used similar approaches to works studyingother subjective image properties [16, 18, 24].
As with the object regressions, we trained an SVR to
map from features to memorability scores – this time us-ing only features algorithmically extracted from the images.We tested a suite of global image descriptors that have beenpreviously found to be effective at scene recognition tasks[24] as well as being able to predict the presence/absence ofobjects in images [7, 6, 21]. The facility of these features atpredicting image semantics suggests that they may be ableto predict, to some degree, those aspects of memorabilitythat derive from image semantics.
These global features are GIST [17], SIFT [14],HOG2x2 [7, 6, 24], and SSIM [21]. We additionally lookedat pixel histograms. We used an RBF kernel for GIST andhistogram intersection kernels for the other features. Lastly,we also combined all these features with a kernel product(‘All Global Features’).
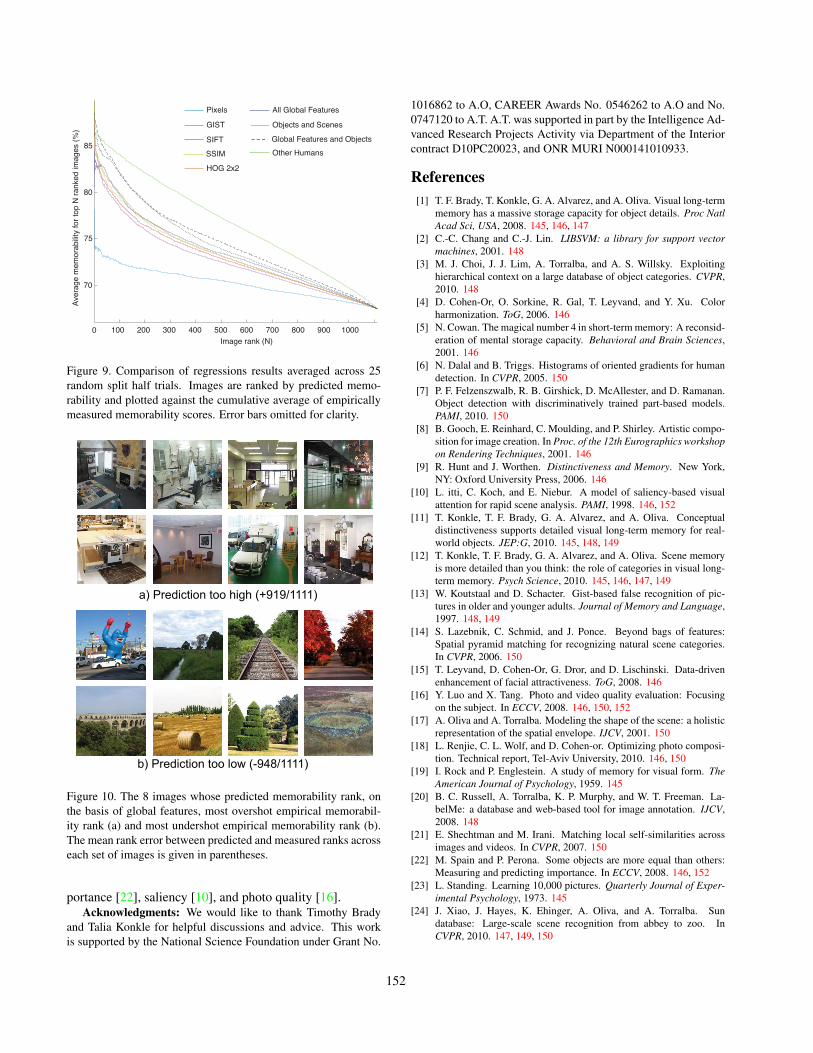
We evaluated performance in the same way as we eval-uated the object regressions, and we found that the com-bination of global features performs best, achieving a rankcorrelation of 0.46. This correlation is less than human pre-dictions, but close to our best predictions from labeled an-notations. Figure 8 shows sample images from predictedsets. Figure 10 shows sample images on which our globalfeatures regression performed poorly.
To set a high watermark, and to get a sense of the re-dundancy between our image features and our annotations,we additionally trained an SVR on a kernel sum of all ourglobal features plus Labeled Multiscale Object Areas andScene Categories (‘Global Features and Annotations’). Thiscombination achieved a rank correlation of 0.54. See Table2 and Figure 9 for detailed results.
5. Conclusions
Making memorable images is a challenging task in visu-alization and photography, and is generally presented as avague concept hard to quantify. Surprisingly, there has beenno previous attempt to systematically measure this propertyon image collections, and to apply computer vision tech-
150
a) Predicted as highly memorable (91%)
b) Predicted as typical memorability (68%)
c) Predicted as unmemorable (55%)
Figure 7. Visualization of how each object contributes to the mem-orability of sample images spanning a range of memorability pre-dictions. We estimate contribution as the difference between pre-dicted memorability when the object is included in the image ver-sus when it is removed from the image. In red we show objectsthat contribute to higher predicted memorability and in blue areobjects that contribute to lower predicted memorability. Bright-ness is proportional to the magnitude of the contribution. Averagemeasured memorability of each sample set is given in parentheses.
niques to extract memorability automatically. Measuringsubjective properties of photographs is an active domain ofresearch with numerous applications. For instance, imagememorability could be used to extract, from a collection ofimages, the ones that are more likely to be remembered byviewers. This could be applied to selecting images for illus-trations, covers, user interfaces, etc.
In this paper we have shown that predicting image mem-orability is a task that can be addressed with current com-
a) Predicted most memorable (87%)
b) Predicted typical memorability (68%)
c) Predicted least memorable (52%)
Figure 8. The 8 images predicted, on the basis of global image fea-tures, as being the most memorable out of all test set images (a),8 images with average memorability predictions (b), and the 8 im-ages predicted as being the least memorable of all test set images(c) . The number in parentheses gives the mean empirical mem-orability score for images in each set. The predictions produceclear visual distinctions, but may fail to notice more subtle cuesthat make certain images more memorable than others.
puter vision techniques. We have measured memorabilityusing a restricted experimental setting in order to obtain ameaningful quantity: we defined an image’s memorabilityscore as the probability that a viewer will detect a repeat ofthe image within a stream of pictures. We have shown thatthere is a large degree of consistency among different view-ers, and that some images are more memorable than otherseven when there are no familiar elements (such as relativesor famous monuments). This work is a first attempt to quan-tify this useful quality of individual images. In future workit will be interesting to investigate the relationship betweenimage memorability and other measures such as object im-
151
Aver
age
mem
orab
ility
for t
op N
rank
ed im
ages
(%)
Image rank (N)
75
80
85
70
100 200 300 400 500 600 700 800 900 10000
Pixels
GIST
SIFT
HOG 2x2
All Global Features
Objects and Scenes
Other HumansGlobal Features and Objects
SSIM
Figure 9. Comparison of regressions results averaged across 25random split half trials. Images are ranked by predicted memo-rability and plotted against the cumulative average of empiricallymeasured memorability scores. Error bars omitted for clarity.
a) Prediction too high (+919/1111)
b) Prediction too low (-948/1111)
Figure 10. The 8 images whose predicted memorability rank, onthe basis of global features, most overshot empirical memorabil-ity rank (a) and most undershot empirical memorability rank (b).The mean rank error between predicted and measured ranks acrosseach set of images is given in parentheses.
portance [22], saliency [10], and photo quality [16].Acknowledgments: We would like to thank Timothy Brady
and Talia Konkle for helpful discussions and advice. This workis supported by the National Science Foundation under Grant No.
1016862 to A.O, CAREER Awards No. 0546262 to A.O and No.0747120 to A.T. A.T. was supported in part by the Intelligence Ad-vanced Research Projects Activity via Department of the Interiorcontract D10PC20023, and ONR MURI N000141010933.
References
[1] T. F. Brady, T. Konkle, G. A. Alvarez, and A. Oliva. Visual long-termmemory has a massive storage capacity for object details. Proc NatlAcad Sci, USA, 2008. 145, 146, 147
[2] C.-C. Chang and C.-J. Lin. LIBSVM: a library for support vectormachines, 2001. 148
[3] M. J. Choi, J. J. Lim, A. Torralba, and A. S. Willsky. Exploitinghierarchical context on a large database of object categories. CVPR,2010. 148
[4] D. Cohen-Or, O. Sorkine, R. Gal, T. Leyvand, and Y. Xu. Colorharmonization. ToG, 2006. 146
[5] N. Cowan. The magical number 4 in short-term memory: A reconsid-eration of mental storage capacity. Behavioral and Brain Sciences,2001. 146
[6] N. Dalal and B. Triggs. Histograms of oriented gradients for humandetection. In CVPR, 2005. 150
[7] P. F. Felzenszwalb, R. B. Girshick, D. McAllester, and D. Ramanan.Object detection with discriminatively trained part-based models.PAMI, 2010. 150
[8] B. Gooch, E. Reinhard, C. Moulding, and P. Shirley. Artistic compo-sition for image creation. In Proc. of the 12th Eurographics workshopon Rendering Techniques, 2001. 146
[9] R. Hunt and J. Worthen. Distinctiveness and Memory. New York,NY: Oxford University Press, 2006. 146
[10] L. itti, C. Koch, and E. Niebur. A model of saliency-based visualattention for rapid scene analysis. PAMI, 1998. 146, 152
[11] T. Konkle, T. F. Brady, G. A. Alvarez, and A. Oliva. Conceptualdistinctiveness supports detailed visual long-term memory for real-world objects. JEP:G, 2010. 145, 148, 149
[12] T. Konkle, T. F. Brady, G. A. Alvarez, and A. Oliva. Scene memoryis more detailed than you think: the role of categories in visual long-term memory. Psych Science, 2010. 145, 146, 147, 149
[13] W. Koutstaal and D. Schacter. Gist-based false recognition of pic-tures in older and younger adults. Journal of Memory and Language,1997. 148, 149
[14] S. Lazebnik, C. Schmid, and J. Ponce. Beyond bags of features:Spatial pyramid matching for recognizing natural scene categories.In CVPR, 2006. 150
[15] T. Leyvand, D. Cohen-Or, G. Dror, and D. Lischinski. Data-drivenenhancement of facial attractiveness. ToG, 2008. 146
[16] Y. Luo and X. Tang. Photo and video quality evaluation: Focusingon the subject. In ECCV, 2008. 146, 150, 152
[17] A. Oliva and A. Torralba. Modeling the shape of the scene: a holisticrepresentation of the spatial envelope. IJCV, 2001. 150
[18] L. Renjie, C. L. Wolf, and D. Cohen-or. Optimizing photo composi-tion. Technical report, Tel-Aviv University, 2010. 146, 150
[19] I. Rock and P. Englestein. A study of memory for visual form. TheAmerican Journal of Psychology, 1959. 145
[20] B. C. Russell, A. Torralba, K. P. Murphy, and W. T. Freeman. La-belMe: a database and web-based tool for image annotation. IJCV,2008. 148
[21] E. Shechtman and M. Irani. Matching local self-similarities acrossimages and videos. In CVPR, 2007. 150
[22] M. Spain and P. Perona. Some objects are more equal than others:Measuring and predicting importance. In ECCV, 2008. 146, 152
[23] L. Standing. Learning 10,000 pictures. Quarterly Journal of Exper-imental Psychology, 1973. 145
[24] J. Xiao, J. Hayes, K. Ehinger, A. Oliva, and A. Torralba. Sundatabase: Large-scale scene recognition from abbey to zoo. InCVPR, 2010. 147, 149, 150
152