Embed Size (px)
Citation preview

What triggers stock market jumps?
Scott R. Baker (Kellogg School, Northwestern) Nick Bloom (Stanford, CEP & NBER)
Steven J. Davis (Chicago Booth & NBER)
American Economic Association Session on “Shocks and Disasters”
ASSA Meetings, Boston, 4 January 2015
Abstract Drawing on next-‐day newspaper accounts, we develop new evidence about the forces that trigger large daily jumps in na=onal stock and bond markets. We read and code next-‐day interpreta=ons of 200 or more daily jumps per country in recent decades, yielding five main results. First, the Global Financial Crisis (GFC) of 2008-‐09 exhibits very high counts of daily equity market jumps around the world. Looking back to 1885 for the U.S., the Great Depression is the only period with equal or greater jump frequency. Second, U.S. developments trigger equity market jumps across the globe, especially during the GFC. Jumps sourced to the U.S. are hugely more important than jumps sourced to Europe except for European countries, where the counts are similar. Third, policy news triggers about 20-‐25% of equity market jumps in most advanced economies and a larger share in other countries (e.g., China=33%, and India=46%). Fourth, news about the macroeconomic performance and outlook accounts for 23-‐38% of equity market jumps in advanced economies, and less in other countries. FiZh, for U.S. government bond yields, news about the macroeconomy triggers 65% of the jumps; adding news about monetary policy as well accounts for 93% of the jumps. We also find sharply different jump pa]erns for bonds versus equi=es in 1980-‐82 as compared to 2008-‐12. These differences suggest that shocks to risk premia and expected returns predominated in 2008-‐12, whereas shocks to nominal risk-‐free rates predominated in the 1980-‐82 period. 1

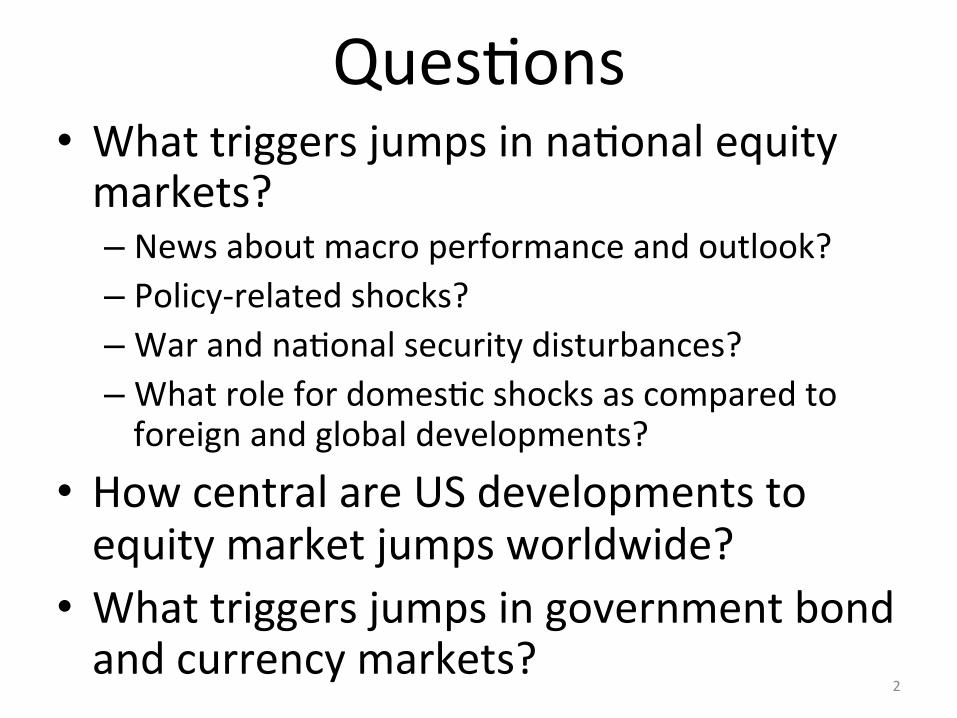
Ques=ons • What triggers jumps in na=onal equity markets? – News about macro performance and outlook? – Policy-‐related shocks? – War and na=onal security disturbances? – What role for domes=c shocks as compared to foreign and global developments?
• How central are US developments to equity market jumps worldwide?
• What triggers jumps in government bond and currency markets?
2

Overview of Empirical Method Use next-‐day newspaper accounts to develop evidence about the reasons for jumps • Choose jump threshold to get daily market moves big enough to a]ract a]en=on of newspapers
• Codify explana=ons for jumps offered in next-‐day ar=cles
• Apply to na=onal equity markets in recent decades for 20-‐25 countries (13 to date)
• Extend back to the 1930s or earlier in U.S. and U.K. to provide historical perspec=ve
• Compare to government bond and currency markets for the U.S. and U.K. 3

Preview of Main Findings 1. The Global Financial Crisis (GFC) of
2008-‐09 exhibits very high counts of daily equity market jumps around the world
– Looking back to 1885 for U.S., the Great Depression is the only period with equal or greater jump frequency
2. US developments trigger equity market jumps across the globe
– Especially so during the GFC – Vast majority of na=onal market jumps triggered by developments in own region/country or in US
– Jumps sourced to US are hugely more frequent than jumps sourced to Europe except for European countries, where the counts are similar. 4

Preview of Main Findings 3. Policy news triggers 20-‐25% of jumps in
most advanced economies and a larger share in other countries (e.g., China=33% and India=46%)
4. News about Macroeconomic Performance and Outlook accounts for 23-‐38% of jumps in advanced economies and less in other countries.
5. Macro news is the main trigger for bond market jumps in the US (65%). Macro + Monetary Policy News accounts for 93%.
– UK bond markets show a muted version of the same pa]ern: Macro = 43%, + Monetary = 67%
3. 5

How We Characterize Equity Market Jumps
1. Set daily jump threshold 2. Pull dates with market moves > threshold 3. Use newspaper ar=cles to characterize jumps
A. Go to online newspaper archive B. Enter newspaper, date range (next day) and search
criteria (e.g., “stock market”) C. Select ar=cle
4. Read ar=cle. 5. Record the reason for the jump, its geographic
source, confidence of reporter in explana=on, ease of coding for the reader, etc.
6

Selec=ng and Coding the Ar=cles
We develop a spreadsheet template and and an extensive Data Construc=on Guide for our RAs. The Guide: • Explains how to find and select newspaper ar=cles • How to read the ar=cles • How to code explana=ons for equity market jumps offered in next-‐day newspaper accounts
• Defines categories for jumps by reason, and gives examples for each category
• Includes FAQs that arose as we and RAs worked through the news accounts of equity market jumps
7

Jumps by Reason Template
8
Policy Categories Non-‐Policy Categories Government spending Macroeconomic news & outlook Taxes Corporate earnings & profits Monetary policy & central banking Commodi=es Trade & exchange rate policy Unknown/no explana=on Regula=on (other than above) Foreign Stock Markets Sovereign military & security ac=ons
Terrorist a]acks & large-‐scale violence by non-‐state actors
Other policy (specify) Other non-‐policy (specify)

Selected Category Defini=ons and Examples from the Data Construc=on Guide
9
The examples on the next several slides give an indica4on of how we provide guidance to the RAs for coding the newspaper ar4cles.

Government Spending
News reports, forecasts, or concerns about government spending and its consequences, including spending matters related to stimulus programs, publicly funded pensions, social security, health care, etc.
10

Government Spending 1
This article is coded as government spending because the first reason listed for the stock market plunge is the rejection of the government’s bailout plan. The bailout plan itself involves the government spending money to help the economy, and even though it is a rejection of the plan, it is still coded as government spending.
11

Taxes
News reports, concerns or events related to current, planned, or potential tax changes (e.g., income tax hikes, payroll tax cuts, corporate tax reform, sales tax change, etc.) and their consequences.
12

Taxes 2
This article is coded as Taxes because it claims directly that if anything could be cited as a reason it would be the tax bill that was passed. The confidence would be medium to high because the article spends some time discussing the tax bill and claims that the bill was almost certainly the reason, saying if any one reason could be cited it would be that one.
13

Monetary Policy and Central Banking
Actions, possible actions, and concerns related to the conduct and policies of the central bank or other chief monetary authority. Such actions and policies pertain to interest rate changes and monetary policy announcements, inflation control, liquidity injections by the monetary authority, changes in reserve requirements or other bank regulations used by the monetary authority to exercise control over monetary conditions, lender-of-last resort actions, and extraordinary actions by the monetary authority in response to bank runs, systemic financial crisis and threats to the payments system.
14

Monetary Policy and Central Banking 2
This article is coded as Monetary Policy because it cites the reason for the market rally as a statement from the Fed that they will pay less attention to weekly swings in the monetary supply, a change in their policy. The confidence and ease of coding would also be high because the article clearly claims the Fed statement is the reason for the jump.
15

Elections and Political Transitions
News, events and concerns related to elections, election outcomes, assassinations of political leaders, coups, revolutions, and other political leadership transitions.
16
Elections and Political Transitions 1
This article is coded as Elections and Political Transitions because it cites Obama’s election as the reason for the market movement. It receives a low confidence ranking, because it claims that only “some commentators” came to this conclusion, rather than declaring the reason with greater assurance. 17

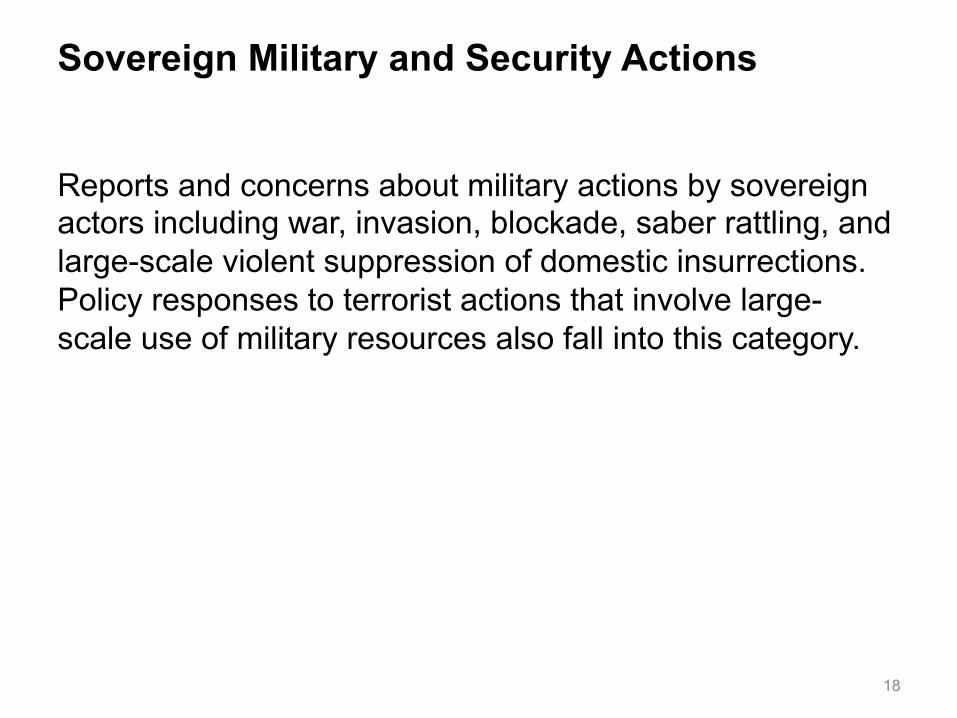
Sovereign Military and Security Actions
Reports and concerns about military actions by sovereign actors including war, invasion, blockade, saber rattling, and large-scale violent suppression of domestic insurrections. Policy responses to terrorist actions that involve large-scale use of military resources also fall into this category.
18

Sovereign Military and Security Actions 2
This article would be coded as Sovereign Action because it claims that stocks plunged due to the military setbacks in Iraq. Since these are military actions sanctioned by the US government, it is Sovereign Action rather than Non-Sovereign. It would receive a 2 or 3 confidence because it declares that the stocks plunged after the setbacks and correlates projected falls to future losses, but it merely states that the stocks plunged after the actions, not because of them.
19

Macroeconomic News and Outlook
News relating to macroeconomic forecasts or reports such as inflation, housing prices, unemployment or employment, personal income, industrial production, manufacturing activity, etc. Also included in this category: • News about financial crisis developments that does not
fall into another category such as Monetary Policy and Central Banking.
• Trade and exchange rate news NOT attributed to policy (e.g., news about trade deficits or currency movements)
20

Macroeconomic News and Outlook 3
This article claims that the reason for the market move was a fear of a double-dip recession, a change in the Macroeconomic Outlook. Therefore the article would be coded as Macroeconomic News and Outlook. The confidence would be high because the article clearly declares that the fear of recession was the cause for the movement.
21

Distinguishing Monetary Policy & Central Banking from Macroeconomic News & Outlook 1
Some news articles that discuss market reactions to macro developments also discuss the Fed’s normal response to the macro development. Generally, we code an article as Macro News & Outlook if it attributes the market move to news about the macro economy. We code it as Monetary Policy & Central Banking if the article attributes the market move to (a) news about how the Fed responds to a given macro development or (b) news about unexpected consequences of Fed actions. It is helpful to approach this classification issue from a Taylor Rule perspective. Consider the following cases:
22

Distinguishing Monetary Policy & Central Banking from Macroeconomic News & Outlook 2
1. Macro news: The market moves because it anticipates or speculates (or sees) that the Fed will respond in its usual manner to news about the macro economy. That is, the market anticipates or speculates that the Fed will respond to macro developments according to a Taylor Rule or other well-defined, well-understood description of the Fed's interest-rate setting behavior.
2. Monetary policy: The market moves because of a surprise change in the policy interest rate -- i.e., a surprise conditional on the state of the macro economy. From a Taylor Rule perspective, we can think of this change as a new value for the innovation term in the Taylor rule.
23

Distinguishing Monetary Policy & Central Banking from Macroeconomic News & Outlook 3
3. Monetary policy: The market moves because of an actual or potential change in the Fed’s policy rule. From a Taylor Rule perspective, this event corresponds to an actual or potential change in the form of the Taylor Rule or a change in specific parameter values. A concrete example would be a big market response to proposals to increase the target interest rate.
4. Monetary policy: The market moves because of news that leads to a revised views or concerns about the consequences of the Fed's actual or anticipated actions.
Articles in category 1 get coded as Macro News & Outlook. Articles in categories 2, 3 and 4 get coded as Monetary Policy & Central Banking
24

Countries, Time Periods & Sources
Country Period Sources United States 1885-2011 New York Times, WSJ United Kingdom 1930-2011 Financial Times (UK Edition) Australia 1985-2012 Australian Financial Times Canada 1980-2012 The Globe and Mail
China (Hong Kong) 1988-2012 South China Morning Post
China (Shanghai) 1990-2013 Shanghai Securities Journal + Germany 1985-2012 Handelsblat, FAZ India 197902013 Times of India Ireland 1987-2012 The Irish Times Japan 1981-2013 Yomiuri and Asahi Saudi Arabia 1994-2013 Al Riyadh South Africa 1986-2013 Business Day South Korea 1980-2013 Chosun Ilbo

Great Depression
Global Financial Crisis

Medium-‐tone shading

Yearly Count of Daily Stock Market Jumps Per Country, 1987-‐2012, 13 Countries
Australia, Canada, China (HK), China (Shanghai) from 1990, Germany, India, Ireland, Japan, Saudi Arabia from 1994, South Africa, South Korea, UK and USA
-‐40
-‐30
-‐20
-‐10
0
10
20
30
1990 1995 2000 2005 2010
GFC in 2008-09
Dark shading reports jumps triggered by policy according to next-‐day newspaper ar=cles. Medium-‐tone shading indicates jumps for which we find no next-‐day newspaper accounts.

Jumps Per Year Attributions by Geographic Source
Time Period
Source Region
Country of Equity Market Jump USA UK Germany Australia Canada Ireland
1985-89 to 2007
USA 4.8 2.0 6.1 0.9 3.7 2.9 Europe <0.1 2.3 8.8 0.5 0.2 3.5
Asia 0.1 0.1 1.3 0.3 0.3 0.2
1997-2001, 1997-2002 for US, UK, Ireland, Canada
USA 11.3 6.2 9.6 1.6 10.6 3.9
Europe None 5.3 9.2 None 0.6 3.7
Asia 0.3 0.5 3.4 0.2 0.3 0.2
2008 to 2009 USA 40.0 12.0 13.5 26.0 25.5 24.3 Europe 0.3 21.5 24.0 0.5 0.8 34.5 Asia 0.3 1.0 2.5 1.5 1.3 0.8
2010 to 2011 USA 11.5 1.0 4.0 2.5 5.3 5.3
Europe 5.8 13.0 21.5 3.0 5.5 14.5 Asia 0.5 None 2.0 None None 0.5

Jumps Per Year Attributions by Geographic Source Time Period
Source Region
Country of Equity Market Jump China (HK)
China (Shanghai)
India Japan Saudi Arabia
South Africa
South Korea
1985-1994 to 2007
USA 3.5 0.2 1.0 2.6 0.1 2.9 3.3
Europe 0.4 None None 0.6 None 0.6 0.2
Asia 4.8 10.9 10.7 6.2 None 0.7 8.7
1997-2002, 1997-2001 for China (HK)
USA 3.0 None 2.4 5.9 0.2 6.2 9.9 Europe 0.2 None None 0.5 None 1.6 0.4 Asia 12.0 7.5 10.6 10.3 None 1.8 25.4
2008 to 2009 USA 13.5 3.8 9.8 18.5 4.8 24.5 7.3 Europe 1.0 None 0.3 1.3 0.3 3.8 0.3 Asia 10.5 18.8 13.8 14.8 None 2.8 5.8
2010 to 2011 USA 1.5 0.5 0.5 1.0 0.5 4.3 3.3 Europe 2.0 None None 1.8 0.5 3.3 2.5 Asia 0.5 2.0 0.8 2.5 0.8 0.8 None

Jumps by Reason: Country Summaries
31

Jumps by Reason: Country Summaries
32

Jumps by Reason in 3 Financial Crises
33

Jumps by Reason in 3 Financial Crises
34
Policy news plays a greater role during 2010-‐11 (Eurozone Crisis and ongoing US policy uncertainty) than during the GFC of 2008-‐09 or the Asian FC of 1997-‐98.

Jumps by Reason in 3 Financial Crises
35

10-‐Year U.S. Government Bonds, Jumps Per Year, 1970-‐2013, Jump threshold: |relaHve yield change| > 0.04 OR |yield change| > 0.2
36
-‐30
-‐20
-‐10
0
10
20
30
Policy-‐Triggered Increases Other Increases
No Ar=cle Found, Increases Policy-‐Triggered Decreases
Other Decreases No Ar=cle Found, Decreases

10-‐Year U.K. Government Bonds, Jumps Per Years, 1979-‐2013, Jump threshold: |relaHve yield change| > 0.04 OR |yield change| > 0.2
37
-‐20
-‐15
-‐10
-‐5
0
5
10
15
20
Policy-‐Triggered Increases Other Increases
No Ar=cle Found, Increases Policy-‐Triggered Decreases
Other Decreases No Ar=cle Found, Decreases

0 50 100 150 200frequency
UnknownTrade and Exchange Rate Policy
TaxesSovereign Action - Military Conflict/Terror
Other Policy - SpecifyOther - Specify
No Article FoundMonetary Policy and Central Banking
Macroeconomic NewsGovernment Spending
Elections and Political TransitionsCorporate Earnings/Profit
Commodities
Jump criteria: relative changes greater than 0.04 or absolute changes greater than 0.2
US Bond (count of type)

0 20 40 60 80 100frequency
UnknownTrade and Exchange Rate Policy
TaxesSovereign Action - Military Conflict/Terror
Other Policy - SpecifyOther - Specify
Non-Sovereign Action - Military Conflict/TerrorNo Article Found
Monetary Policy and Central BankingMacroeconomic NewsGovernment SpendingForeign Stock Market
Elections and Political TransitionsCorporate Earnings/Profit
Commodities
Jump criteria: relative changes greater than 0.04 or absolute changes greater than 0.2
UK Bond (count of type)

Bonds versus Equi=es Jumps in U.S. Bond markets occur more oZen in 1980-‐82 than in 2008-‐12. The pa]ern is very much the reverse for U.S. equi=es.
à Shocks to risk premia and expected returns predominated from 2008-‐12, while shocks to (nominal) risk-‐free rates were less important.
à Shocks to nominal risk-‐free rates predominated in the 1980-‐82 period, but shocks to risk premia and expected returns were not so important.
This interpreta=on aligns with the view that uncertainty about infla=on rates was a major factor in the early 1980s but not in the 2008-‐12 period.
40

U.S. Trade-‐Weighted Exchange Rate, Jumps per Year, 1973-‐2013, Jump threshold: |relaHve change| > 0.015
41
-‐10
-‐5
0
5
10
15
Policy-‐Triggered Apprecia=on Other Apprecia=on
No Ar=cle Found, Apprecia=on Policy-‐Triggered Deprecia=on
Other Deprecia=on No Ar=cle Found, Deprecia=on
Dollar Apprecia4on
Dollar Deprecia4on

USD-‐GBP Exchange Rate, Jumps per Year, 1972-‐2013, Jump threshold: |relaHve change| > 0.015
42
-‐25
-‐20
-‐15
-‐10
-‐5
0
5
10
15
20
Policy-‐Triggered Apprecia=on Other Apprecia=on
No Ar=cle Found, Apprecia=on Policy-‐Triggered Deprecia=on
Other Deprecia=on No Ar=cle Found, Deprecia=on
Dollar Apprecia4on
Dollar Deprecia4on

0 10 20 30 40 50frequency
UnknownTrade and Exchange Rate Policy
TaxesSovereign Action - Military Conflict/Terror
RegulationOther Policy - Specify
Other - SpecifyNon-Sovereign Action - Military Conflict/Terror
No Article FoundMonetary Policy and Central Banking
Macroeconomic NewsGovernment SpendingForeign Stock Market
Elections and Political TransitionsCommodities
Jump criteria: relative changes greater than 0.015
US Trade Weighted Exchange Rate (count of type)

0 50 100 150frequency
UnknownTrade and Exchange Rate Policy
TaxesSovereign Action - Military Conflict/Terror
Other Policy - SpecifyOther - Specify
Non-Sovereign Action - Military Conflict/TerrorNo Article Found
Monetary Policy and Central BankingMacroeconomic NewsGovernment SpendingForeign Stock Market
Elections and Political TransitionsCommodities
Jump criteria: relative changes greater than 0.015
USD-GBP Exchange Rate (count of type)

Next Steps
• Construct data for additional countries • Characterize chief empirical patterns
and their implications for the sources of financial market volatility (at daily frequencies)
• Link to theories of asset pricing

Additional Slides

U.S. Equity Market Jumps Per Year,1900-‐1955
Financial Panic of 1
907
Fede
ral Reserve Act of 1
913
Outbreak of W
WI (July and
August 1
914)
US De
clares W
ar (A
pril 1917),
Send
s Troop
s to Eu
rope
Armis=
ce Agreemen
t End
ing WWI (1918)
Stock Market Crash of October 1929
Smoot-‐Hawley Tariff Act (June 1930)
FDR's "Hundred Days" (March-‐June 1933)
Supreme Court Invalidates Na=onal Industrial Recovery Act; FDR signs Na=onal Labor Rela=ons and Social Security
Acts (1935)
FDR Tries to Pack Sup
reme Co
urt (1937)
Germ
any and Soviet Union
Invade
Po
land
(Sep
tembe
r 1939)
Pearl Harbor A]ack, US Declares War on Germany and Japan (December 1941)
D-‐Day Invasion (June 1944), Bre]on Woods, Crea=on of IMF and World Bank (July)
Germany (April 1945) and Japan (September)
Surrender
Outbreak of Korean War (Jun
e 1950)
Fed-‐Treasury Accord (M
arch 1951)
Korean W
ar Ceasefire (Ju
ly 1953)
-‐65
-‐45
-‐25
-‐5
15
35
55
1898
1900
1902
1904
1906
1908
1910
1912
1914
1916
1918
1920
1922
1924
1926
1928
1930
1932
1934
1936
1938
1940
1942
1944
1946
1948
1950
1952
1954
1956
Total Increases
Policy-‐Driven Increases
Total Decreases
Policy-‐Driven Decreases
47

U.S. Equity Market Jumps Per Year, 1956-‐2011
Cuban Missile Crisis (August-‐Octob
er 1962)
Tet O
ffensive (Ja
nuary-‐February1968)
Wage and Price Freeze (A
ugust
1971), En
d of Gold Co
nver=b
ility
Last US Troops Withdraw from Viet Nam (March 1973); Arab
Oil Embargo Begins (November)
Oil Em
bargo Co
n=nu
es,
Stock Market C
rash (1
974)
Iranian Revolu=on; Volcker Becomes Fed Chairman
(August 1979)
Stock Market C
rash of O
ctob
er 1987
Fall of B
erlin W
all (Novem
ber 1
989)
Iraq Invade
s Kuw
ait (Au
gust 1990)
Allies Expel Iraq from
Kuw
ait (February 1991)
9-‐11-‐2001 Terrorist A
]ack
US Invade
s Iraq (M
arch 2003)
Global Financial Crisis (2008-‐2009)
First U
S Co
mbat T
roop
s in Viet Nam
(March 1965);
Crea=o
n of M
edicare and Med
icaid
-‐65
-‐45
-‐25
-‐5
15
35
55
1956
1958
1960
1962
1964
1966
1968
1970
1972
1974
1976
1978
1980
1982
1984
1986
1988
1990
1992
1994
1996
1998
2000
2002
2004
2006
2008
2010
2012
Total Increases
Policy-‐Driven Increases
Total Decreases
Policy-‐Driven Decreases

medium
Yearly Count of Daily Stock Market Jumps Canada, 1980-‐2012, Jump Threshold 2.0%
Dark shading reports jumps triggered by policy-‐related developments according to next-‐day ar=cles in The Globe and Mail.

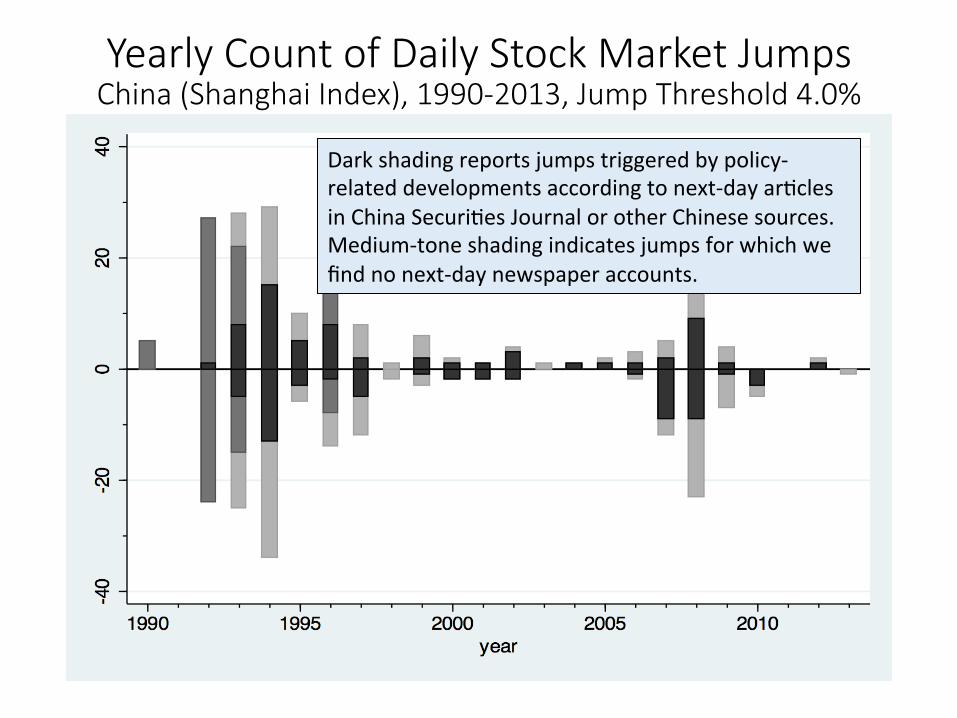
Yearly Count of Daily Stock Market Jumps China (Shanghai Index), 1990-‐2013, Jump Threshold 4.0%
Dark shading reports jumps triggered by policy-‐related developments according to next-‐day ar=cles in China Securi=es Journal or other Chinese sources. Medium-‐tone shading indicates jumps for which we find no next-‐day newspaper accounts.

medium

medium shaded

Yearly Count of Daily Stock Market Jumps India, 1979-‐2013, Jump Threshold 3.5%
-‐30
-‐20
-‐10
0
10
20
30
1980 1985 1990 1995 2000 2005 2010
Dark shading reports jumps triggered by policy according to next-‐day ar=cles from the Times of India. Medium-‐tone shading indicates jumps for which we find no next-‐day newspaper accounts.

Yearly Count of Daily Stock Market Jumps Ireland, 1987-‐2012, Jump Threshold 2.5%
Dark shading reports jumps triggered by policy-‐related developments according to next-‐day ar=cles in the Irish Times.

Yearly Count of Daily Stock Market Jumps Japan, 1981-‐2013, Jump Threshold 3.0%
Dark shading reports jumps triggered by policy-‐related developments according to next-‐day ar=cles in Yomiuri and Asahi.

Yearly Count of Daily Stock Market Jumps South Africa, 1986-‐2013, Jump Threshold 2.5%
Dark shading reports jumps triggered by policy according to next-‐day ar=cles in Business Day among others. Medium-‐tone shading indicates jumps for which we find no next-‐day newspaper accounts.

Yearly Count of Daily Stock Market Jumps Saudi Arabia, 1994-‐2013, Jump Threshold 2.5%
Dark shading reports jumps triggered by policy according to next-‐day ar=cles in Al Riyadh. Medium-‐tone shading indicates jumps for which we find no next-‐day newspaper accounts.

Yearly Count of Daily Stock Market Jumps South Korea, 1980-‐2011, Jump Threshold 3.5%
Dark shading reports jumps triggered by policy-‐related developments according to next-‐day ar=cles in Chosun Ilbo. Medium-‐tone shading area indicates jumps for which we find no next-‐day newspaper accounts.

Robustness to Newspapers and Coders • Two potential concerns about the method:
– Results for a given jump may depend heavily on which newspaper we consult
– Different readers may code the same jump differently, even when reviewing the same newspaper
• To evaluate these concerns: – Consult 5 newspapers (Boston Globe, LA Times, NY
Times, WSJ, Washington Post) for each jump that occurred in the United States from 1980 to 2011.
– Assign 2 readers to each newspaper for each jump – Yields (up to) 10 reads per jump event – Quantify extent of agreement across newspapers and
readers for 280 jumps
60

High Rates of Agreement about Jump Reason across Newspapers and Readers: United States,1980-2011
Notes: The chart plots average rates of agreement about the reason for daily equity market jumps across 5 newspapers, with two readers per paper per jump. Thus, we have a maximum of 10 (5 times 2) readings for each of 280 jumps of greater than +/-2.5% in the S&P 500 Index. In practice, the average number of readings per jump is 8.8, because we do not always find a next-day news article about the jump in every newspaper. The newspapers are the Boston Globe, Los Angeles Times, New York Times. Wall Street Journal and the Washington Post. For the 16 individual categories, we report the fraction of readings attributed to the most commonly attributed reason for the jump event. The plots interpolate across years with no jumps.
Sha
re o
f arti
cles
in m
ost c
omm
on c
ateg
ory
Policy/non-policy
14 categories
Jump threshold: +/-2.5% in S&P 500 # of Equity Market Jumps: 280 # of Newspapers: 5 # of Readers per Newspaper per Jump: 2 à10 “reads” per jump, 8.8 reads per jump in practice

Number'of'Daily'Stock'Market'Jumps'Per'Year,'Germany,'1989'to'2012'Jump%Threshold%%=%+/12.5%! 1989A'
2007'1989A'1996'
1997A'2001'
2002A'2003'
2008A'2009'
2010A'2011'
1989'2012'
Total%Jumps% 211' 18' 86' 93' 72' 48' 341'1.'Jump'Frequency'(Per'Year)' 11.1' 2.3' 17.2' 46.5' 36' 24' 14.2'
Of#Which:###############################''
A.'Down'Jumps' 54%' 50%' 53%' 53%' 53%' 48%' 51%'B.'PolicyATriggered' 21%' 28%' 21%' 22%' 21%' 29%' 22%'C.'No'Article'Found' 2%' 11%' 0%' 0%' 4%' 0%' 2%'
Jumps%by%Reason%(Per%Year)' ' ' ' ' ' ' '2.'Government'Spending' ' ' ' ' 2.5' 2.0' 0.4'3.'Taxes' 0.1' ' 0.2' 0.5' ' ' 0.1'4.'Monetary'Policy'&'Central'Banking' 0.9' 0.1' 1.8' 3.0' 3.5' 4.5' 1.5'5.'Trade'&'Exchange'Rate'Policy' 0.2' 0.3' ' 0.5' ' ' 0.1'6.'Elections'&'Political'Transitions' 0.5' 0.1' 1.2' 1.0' 1.0' ' 0.5'7.'Regulations' ' ' ' ' ' 0.5' <0.1'8.'Military'Conflict''&'Terrorism'
A.'State'Actors' 0.6' 0.1' 0.4' 4.5' ' ' 0.5'B.'NonAState'Actors' 0.4' ' 0.2' 3.0' ' ' 0.3'
9.'Other'Government'Policy'Matters' 0.1' ' ' 0.5' 0.5' ' 0.1'10.'Macroeconomic'News' 3.9' 0.6' 6.2' 16.5' 15.0' 11.5' 5.5'11.'Corporate'Earnings'' 1.1' ' 1.0' 6.5' 4.0' 1.0' 1.3'12.'Commodities' 0.3' 0.1' ' 1.0' 1.0' ' 0.3'13.'Foreign'Stock'Markets' 1.9' 0.3' 4.6' 5.0' 3.0' 0.5' 1.8'14.'Other'NonAPolicy'Matters' 0.1' ' ' 1.0' 1.5' 2.0' 0.4'15.'Unknown'or'Not'Stated'' 0.9' 0.4' 1.6' 3.5' 2.5' 2.0' 1.2'Jumps%by%Geographic%Source%(Per%Year)' ' ' ' ' ' ' '16.'United'States' 5.8' 0.5' 9.6' 24.5' 13.5' 4.0' 6.1'17.'Europe' 5.8' 1.4' 9.2' 24.5' 24.0' 21.5' 8.8'18.'Asia' 1.1' ' 3.4' 1.0' 2.5' 2.0' 1.3'19.'Other' 2.3' 0.3' 4.4' 9.0' 3.5' 0.5' 2.2'20.'Not'Specified' 0.2' 0.3' ' ' 1.5' ' 0.3'Notes:'Row'1.B'computed'as'the'sum'of'Rows'2A7,'8.A'and'9,'divided'by'the'Total'Jumps.'Jumps'by'Reason'and'Geographic'Source'assigned'based'on'nextAday'news'articles'in''''''''''''''''''''''''''''''''''''''''''''''''''''''''''''''''''''''''''''''''''''''Die#Frankfurter#Allgemeine#Zeitung#and'Handelsblat.#'

Jumps Per Year Attributions by Geographic Source
Time Period
Source Region
Financial Market and Country of Jump US Bonds
UK Bonds
US Trade-Weighted
Exchange Rate
USD-GBP Exchange
Rate 1973-2013, 1979-2013 for UK Bonds
US 8.4 0.7 3.1 3.0 Europe 0.2 4.1 0.7 3.1 Asia <0.1 <0.1 0.2 0.1
1980-1982 US 44.7 2.7 7.3 4.7 Europe None 10.7 1.0 3.3
Asia None None None None 2008 to 2009 US 35.5 1.0 9.5 7.0
Europe 0.5 5.5 3.5 12.5 Asia 0.5 None 0.5 None
2010 to 2011 US 21.5 1.0 2.0 1.0 Europe 2.5 2.5 2.0 1.5 Asia 0.5 None 0.5 None

Jumps Per Year Attributions by Geographic Source
Time Period
Source Region
Country of Equity Market Jump USA UK Germany Australia Canada Ireland
1985-89 to 2007
USA 70.9% 35.3% 54.7% 36.7% 46.7% 37.0% Europe 1.0% 40.1% 79.0% 20.4% 2.2% 44.1%
Asia 1.5% 1.8% 11.7% 12.2% 3.9% 1.9%
1997-2001, 1997-2002 for US, UK, Ireland, Canada
USA 77.9% 55.5% 55.8% 80.0% 48.8% 41.3%
Europe None 47.5% 53.5% None 1.0% 35.5%
Asia 2.1% 4.5% 19.8% 10.0% 4.2% 2.2%
2008 to 2009 USA 93.0% 36.4% 37.5% 85.2% 38.9% 34.8% Europe 1.0% 65.2% 66.7% 1.6% 1.1% 48.9% Asia 1.0% 3.0% 6.9% 4.9% 1.9% 1.8%
2010 to 2011 USA 65.7% 6.7% 16.7% 33.3% 35.0% 21.9%
Europe 33.1% 86.7% 89.6% 40.0% 36.7% 59.4% Asia 2.9% None 8.3% None None 2.1%

Jumps Per Year Attributions by Geographic Source Time Period
Source Region
Country of Equity Market Jump China (HK)
China (Shanghai)
India Japan Saudi Arabia
South Africa
South Korea
1985-1994 to 2007
USA 49.1% 1.0% 8.1% 25.5% 1.1% 30.9% 24.4%
Europe 5.6% None None 6.1% None 6.8% 1.7%
Asia 67.3% 67.6% 84.5% 60.5% None 7.0% 63.3%
1997-2002, 1997-2001 for China (HK)
USA 16.9% None 17.1% 35.1% 8.3% 42.5% 25.5% Europe 1.1% None None 3.0% None 10.9% 1.1% Asia 67.4% 100% 74.7% 60.9% None 12.1% 65.%
2008 to 2009
USA 49.1% 15.6% 28.2% 50.0% 11.9% 55.1% 37.2% Europe 3.6% None 1.0% 3.4% 1.0% 8.4% 1.3% Asia 38.2% 78.1% 39.9% 39.9% None 6.2% 29.5%
2010 to 2011
USA 27.2% 20.0% 33.3% 18.2% 5.9% 50.0% 43.3% Europe 36.4% None None 31.8% 5.9% 38.2% 33.3% Asia 9.1% 80.0% 50.0% 45.5% 8.8% 8.8% None

Our Work on Policy Uncertainty
In “Measuring Economic Policy Uncertainty,” we 1. Show that policy-related uncertainty varies a lot over time
and, in the U.S., reached historically high levels during the 1930s Great Depression and from 2008 to 2012.
2. Provide evidence that high levels of policy uncertainty (a) drive high option-implied stock return volatility, and (b) lead businesses and households to cut back on spending, investment and hiring.
– Larger effects for firms with greater exposure to government policy
• This paper: Quantify the frequency of national equity market jumps triggered by policy news – Higher economic policy uncertainty à greater
frequency of policy-driven equity market jumps 66


![Hydraulic Jumps[1]1](https://img.pdfslide.net/doc/110x75/56d6bfac1a28ab301697316c/hydraulic-jumps11.jpg)