Embed Size (px)
Citation preview
What Was Done in California and How?
Dr. Alan Lloyd, President EmeritusInternational Council on Clean Transportation
Former Chair, California Air Resources BoardFormer Secretary, California Environmental Protection Agency
We regulate emissionsAuthorities
Motor vehicles and fuels(under federal Clean Air Act exemption)
Air toxics, consumer products, greenhouse gases(under California law)
Oversight over Local ResponsibilitiesStationary and area sources
Transportation planning targets
Rulemaking ProcessPublic hearing of Governing Board
Public workshops and stakeholder meetingsPublic and legislative support 2
Our national impactFederal Clean Air Act Exemption
for California vehicle emission standardsTo meet “compelling and extraordinary” conditions
Must meet or exceed federal regulationsCan be adopted by other states
(15 including Northeast States, Oregon, Washington)
California FirstsLead-free gasoline
Low-sulfur fuelsThree-way catalytic converter
Stringent NOX control 3
Our policy instrumentsPerformance-based Emission Standards
Aftertreatment effective but turnover slowRetrofits and repowering also beneficial
Fuel improvements provide immediate benefits
Incentive Funding$150M per year for diesel engines$1B for port trucks and equipment
Market-based ProgramsCarbon emission trading for large sources
Enforcement and Monitoring Programs4
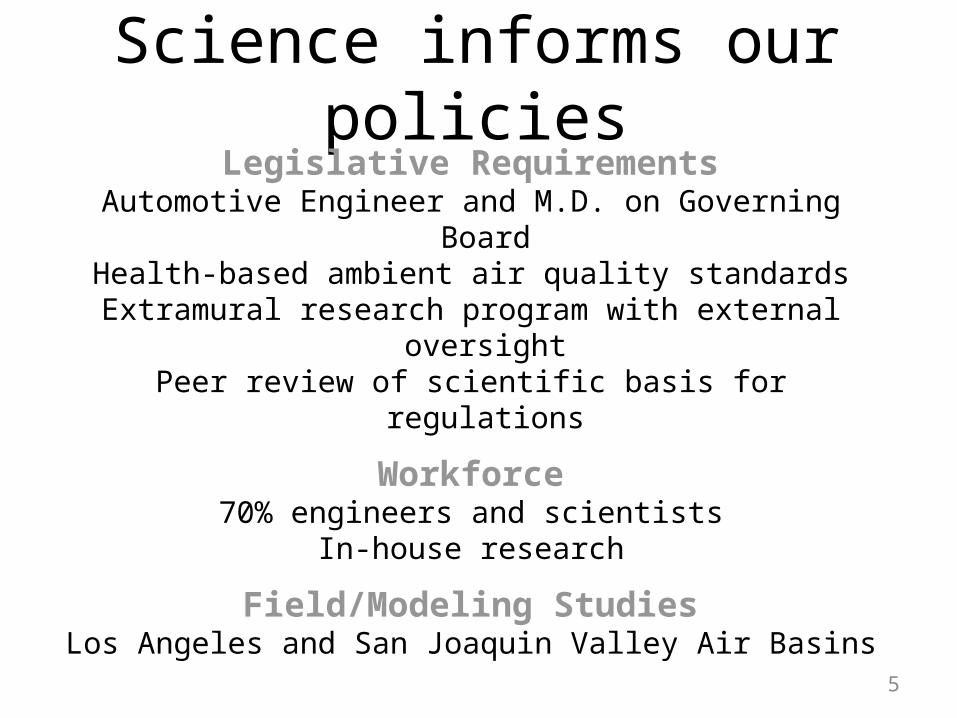
Science informs our policiesLegislative Requirements
Automotive Engineer and M.D. on Governing BoardHealth-based ambient air quality standards
Extramural research program with external oversightPeer review of scientific basis for regulations
Workforce70% engineers and scientists
In-house research
Field/Modeling StudiesLos Angeles and San Joaquin Valley Air Basins
5
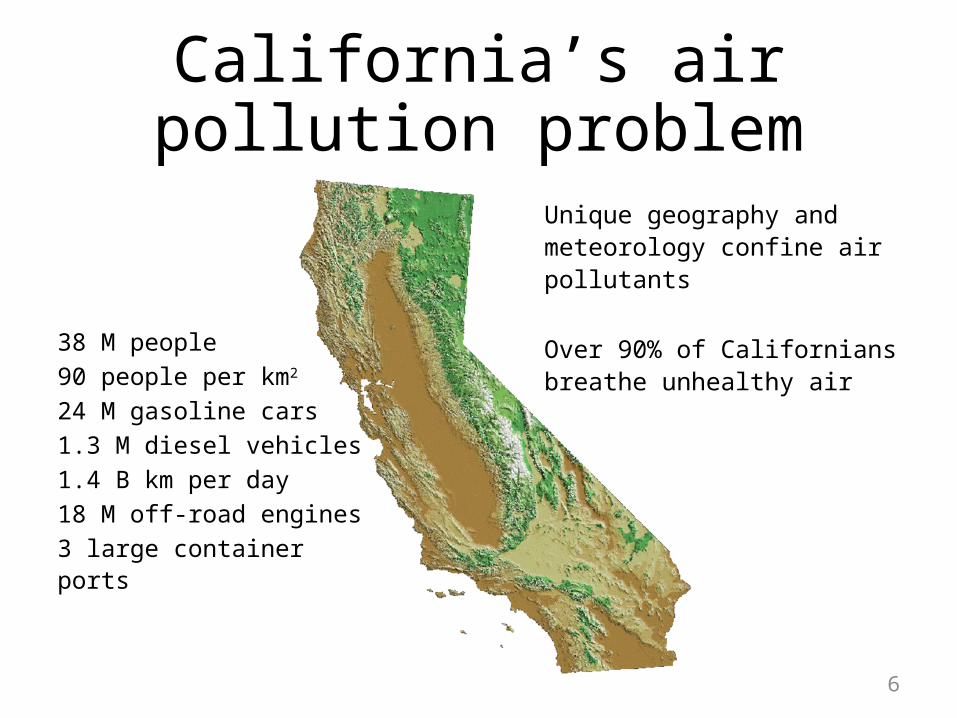
California’s air pollution problem
Unique geography and meteorology confine air pollutants
Over 90% of Californians breathe unhealthy air
6
38 M people90 people per km2
24 M gasoline cars1.3 M diesel vehicles1.4 B km per day18 M off-road engines3 large container ports
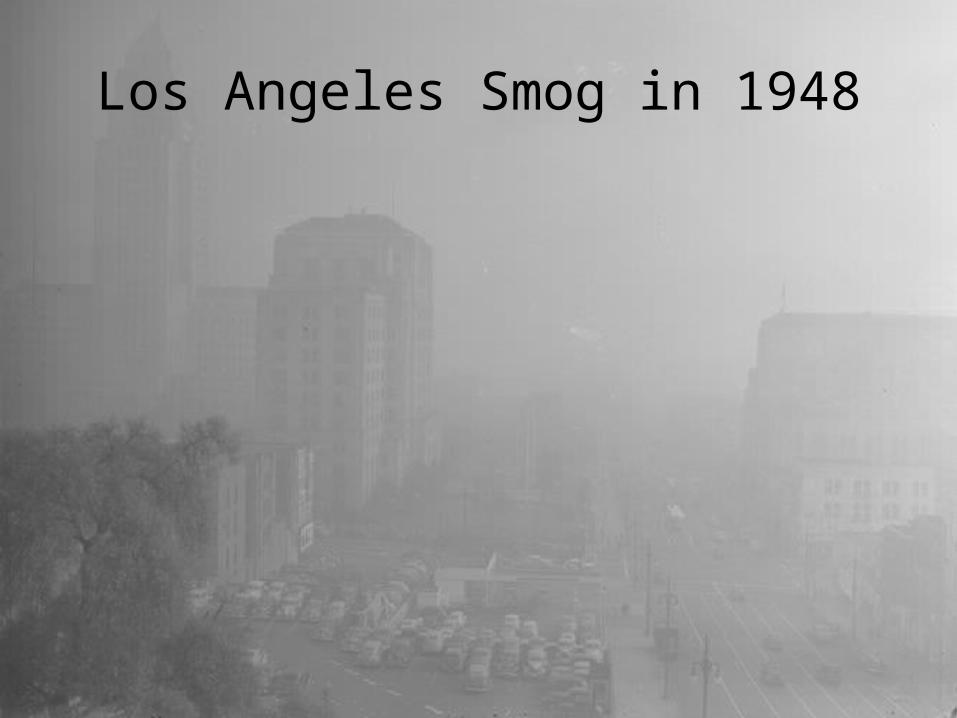
Los Angeles Smog in 1948
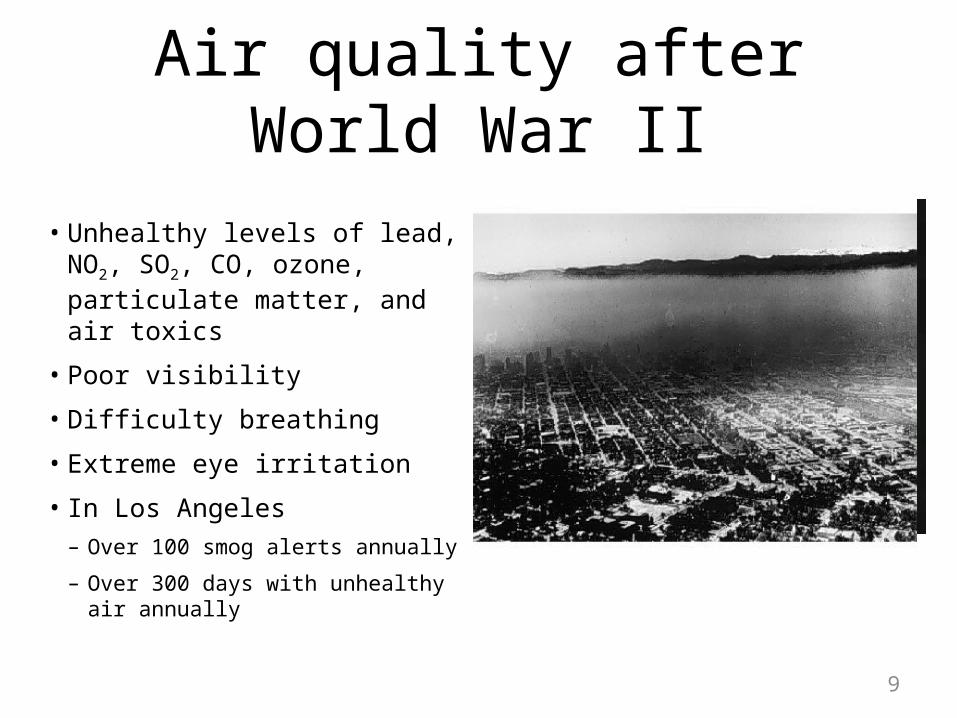
Air quality after World War II
• Unhealthy levels of lead, NO2, SO2, CO, ozone, particulate matter, and air toxics
• Poor visibility
• Difficulty breathing
• Extreme eye irritation
• In Los Angeles– Over 100 smog alerts annually
– Over 300 days with unhealthy air annually
9
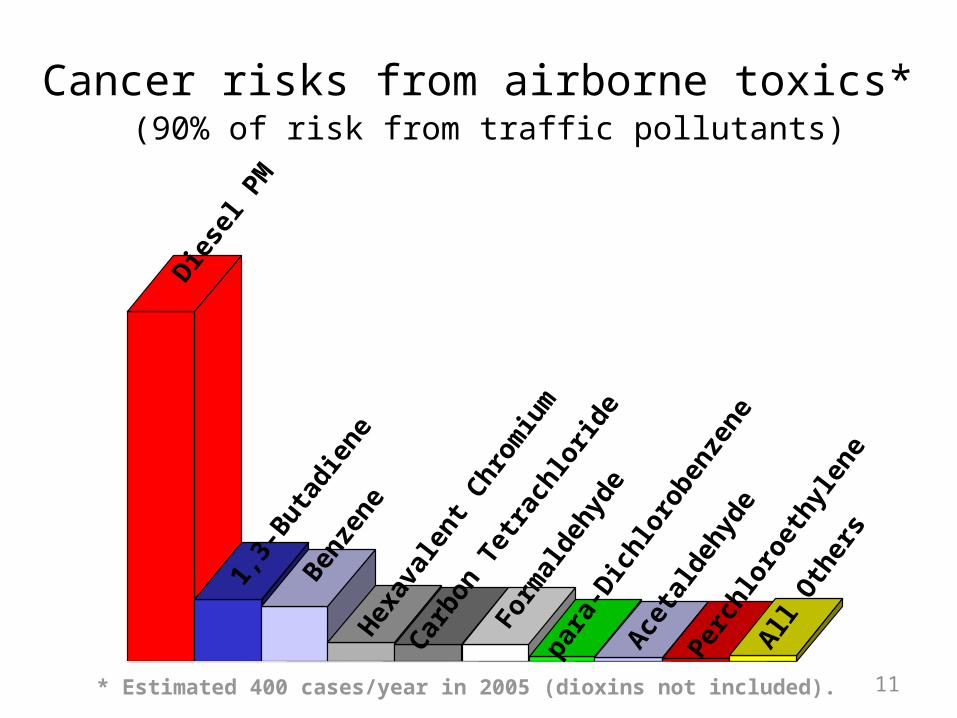
Cancer risks from airborne toxics* (90% of risk from traffic pollutants)
Ben
zene
1,3-
But
adie
neH
exav
alen
t Chr
omiu
m
Car
bon
Tetr
achl
orid
e
Form
alde
hyde
para
-Dic
hlor
oben
zene
Perc
hlor
oeth
ylen
e
Ace
tald
ehyd
e
All
Oth
ers
Die
sel P
M
* Estimated 400 cases/year in 2005 (dioxins not included). 11
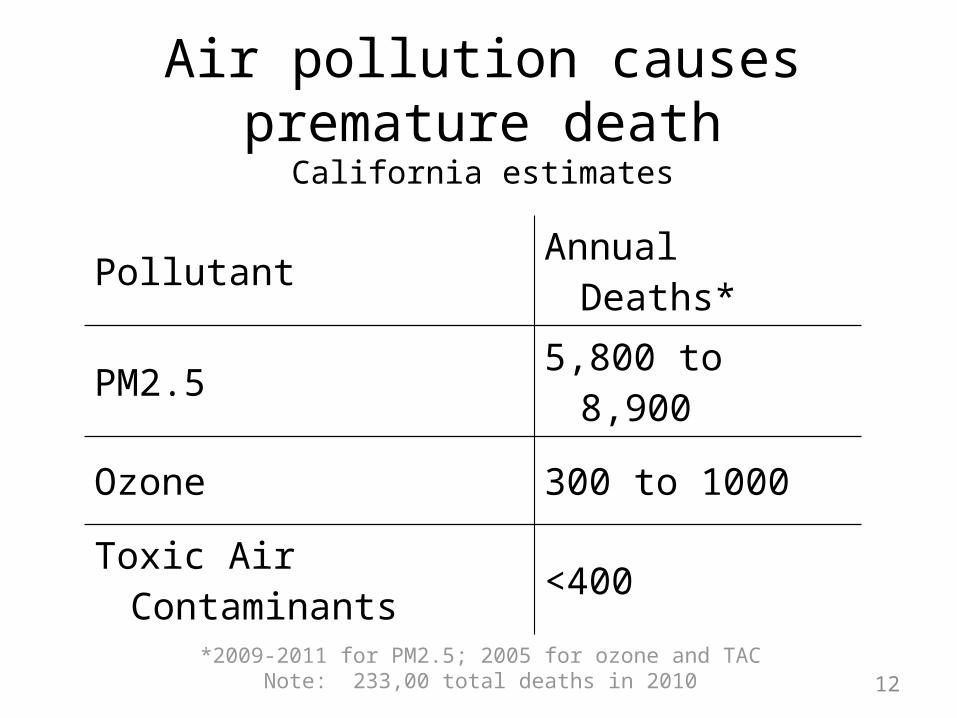
Air pollution causes premature deathCalifornia estimates
Pollutant Annual Deaths*
PM2.5 5,800 to 8,900
Ozone 300 to 1000
Toxic Air Contaminants <400
*2009-2011 for PM2.5; 2005 for ozone and TACNote: 233,00 total deaths in 2010 12
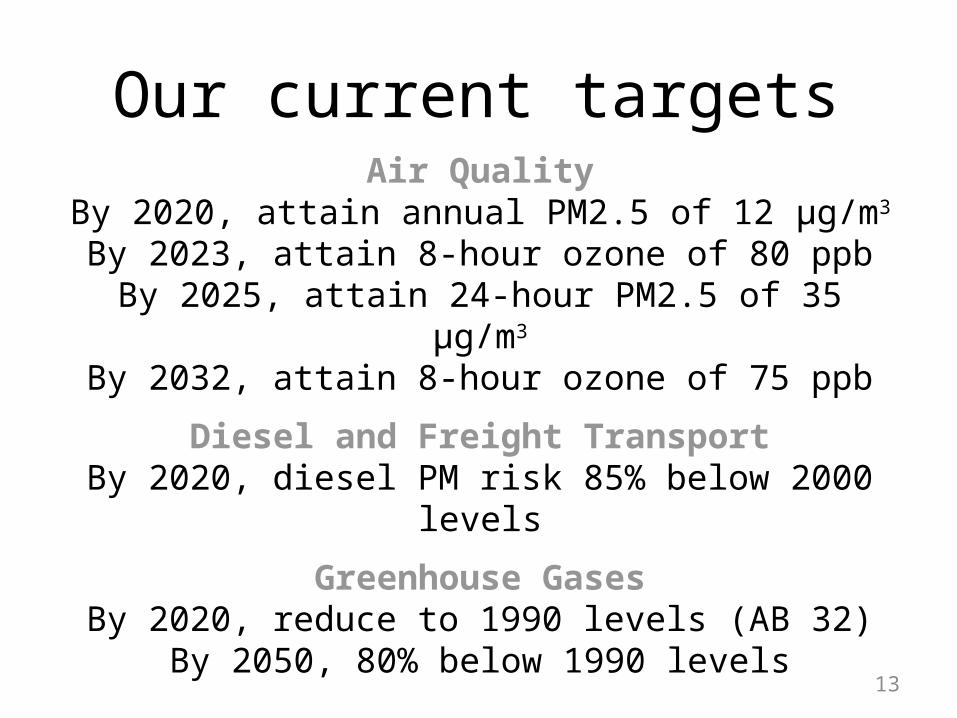
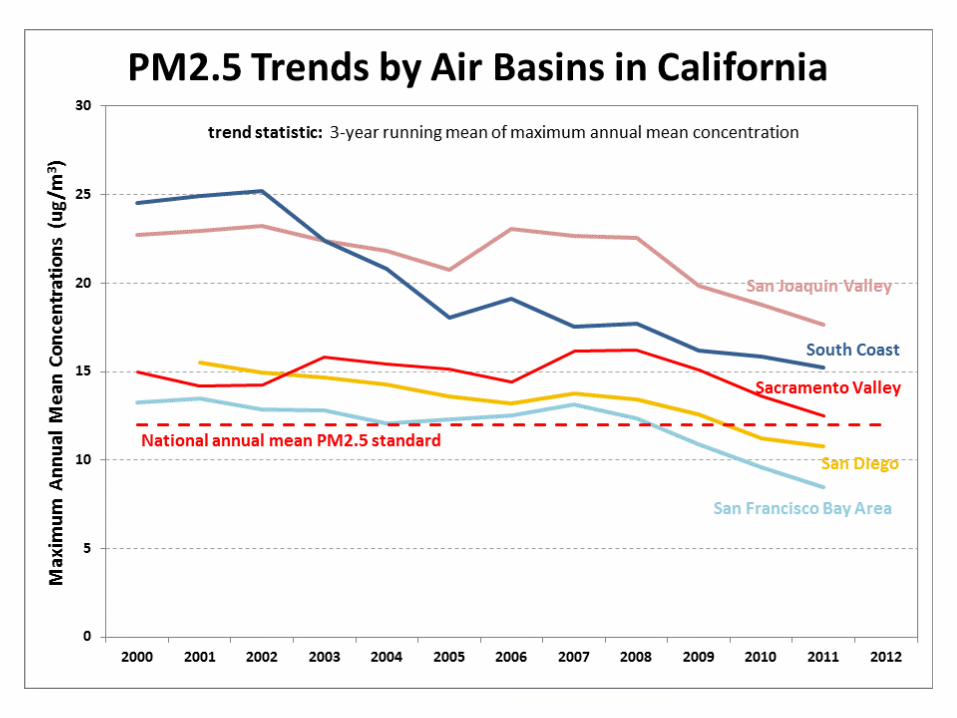
Our current targetsAir Quality
By 2020, attain annual PM2.5 of 12 µg/m3
By 2023, attain 8-hour ozone of 80 ppbBy 2025, attain 24-hour PM2.5 of 35 µg/m3
By 2032, attain 8-hour ozone of 75 ppb
Diesel and Freight TransportBy 2020, diesel PM risk 85% below 2000 levels
Greenhouse GasesBy 2020, reduce to 1990 levels (AB 32)
By 2050, 80% below 1990 levels 13
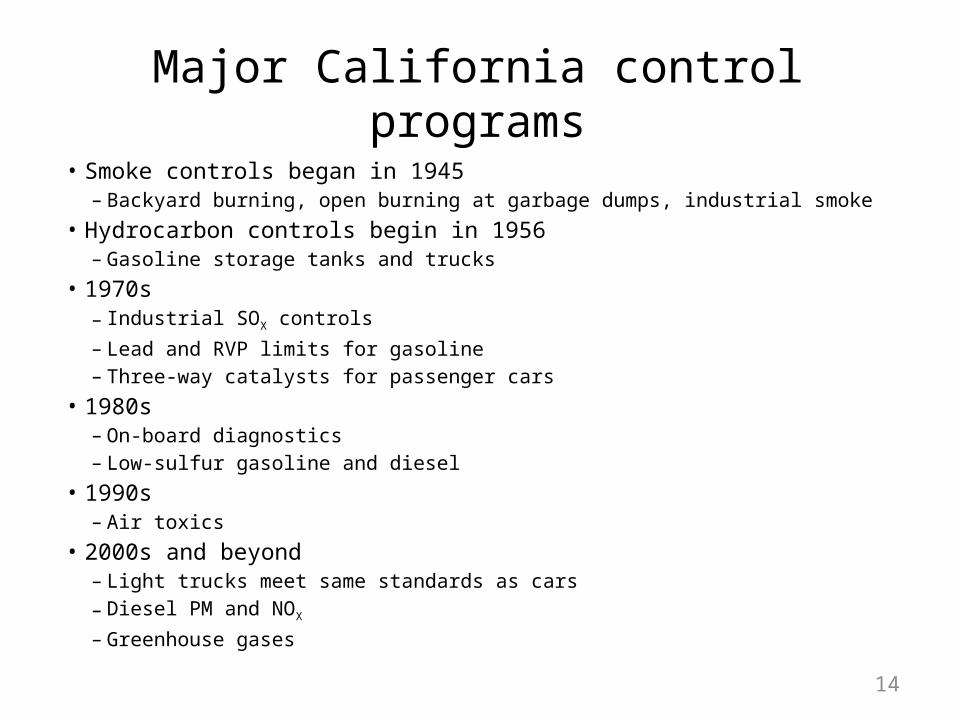
Major California control programs• Smoke controls began in 1945
– Backyard burning, open burning at garbage dumps, industrial smoke• Hydrocarbon controls begin in 1956
– Gasoline storage tanks and trucks• 1970s
– Industrial SOX controls– Lead and RVP limits for gasoline– Three-way catalysts for passenger cars
• 1980s– On-board diagnostics– Low-sulfur gasoline and diesel
• 1990s– Air toxics
• 2000s and beyond– Light trucks meet same standards as cars– Diesel PM and NOX
– Greenhouse gases14
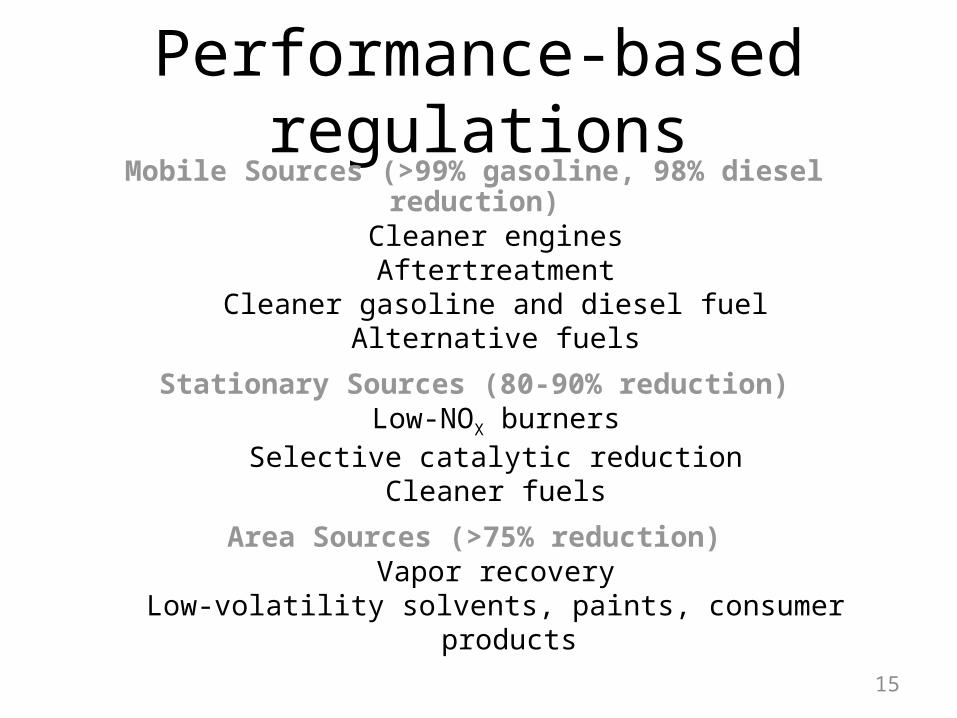
Performance-based regulationsMobile Sources (>99% gasoline, 98% diesel reduction)
Cleaner enginesAftertreatment
Cleaner gasoline and diesel fuelAlternative fuels
Stationary Sources (80-90% reduction)Low-NOX burners
Selective catalytic reductionCleaner fuels
Area Sources (>75% reduction)Vapor recovery
Low-volatility solvents, paints, consumer products
15
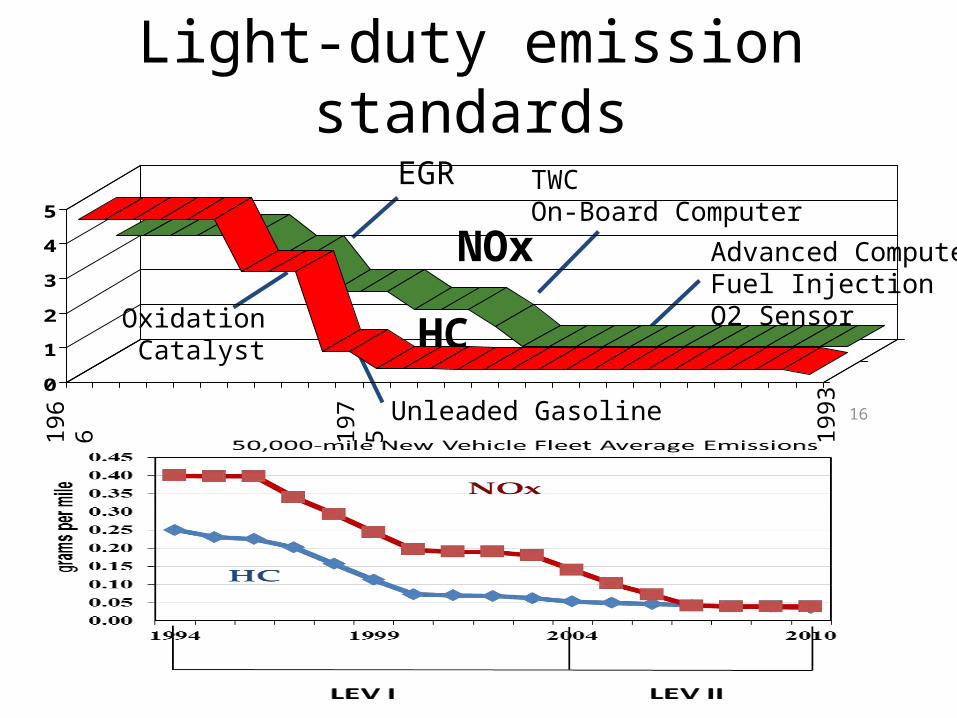
Light-duty emission standards
16
0
1
2
3
4
5
Oxidation Catalyst
EGR TWCOn-Board Computer
Advanced ComputerFuel InjectionO2 SensorHC
NOx
1966
1975
1993Unleaded Gasoline
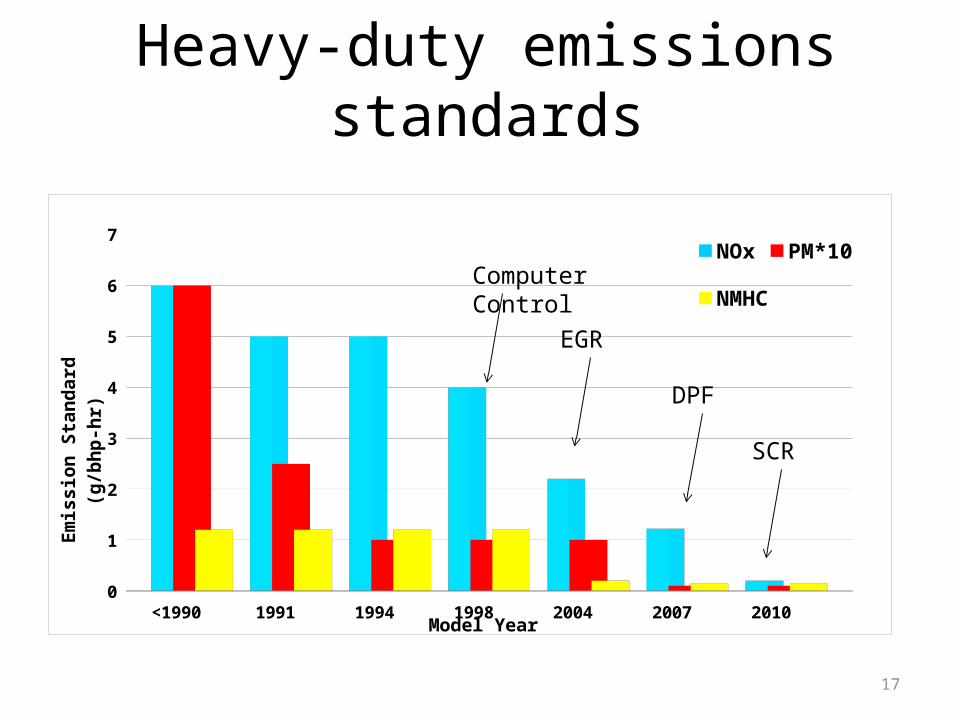
Heavy-duty emissions standards
<1990 1991 1994 1998 2004 2007 20100
1
2
3
4
5
6
7NOx PM*10
NMHC
Model Year
Emis
sion
Sta
ndar
d(g
/bhp
-hr)
17
Computer Control
EGR
DPF
SCR
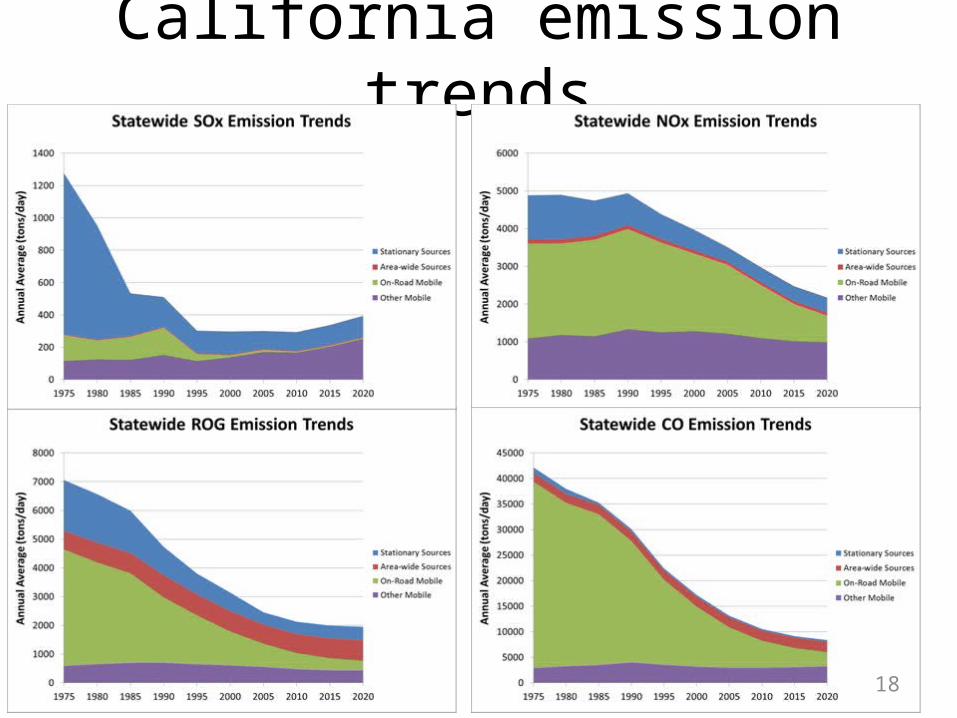
California emission trends
18
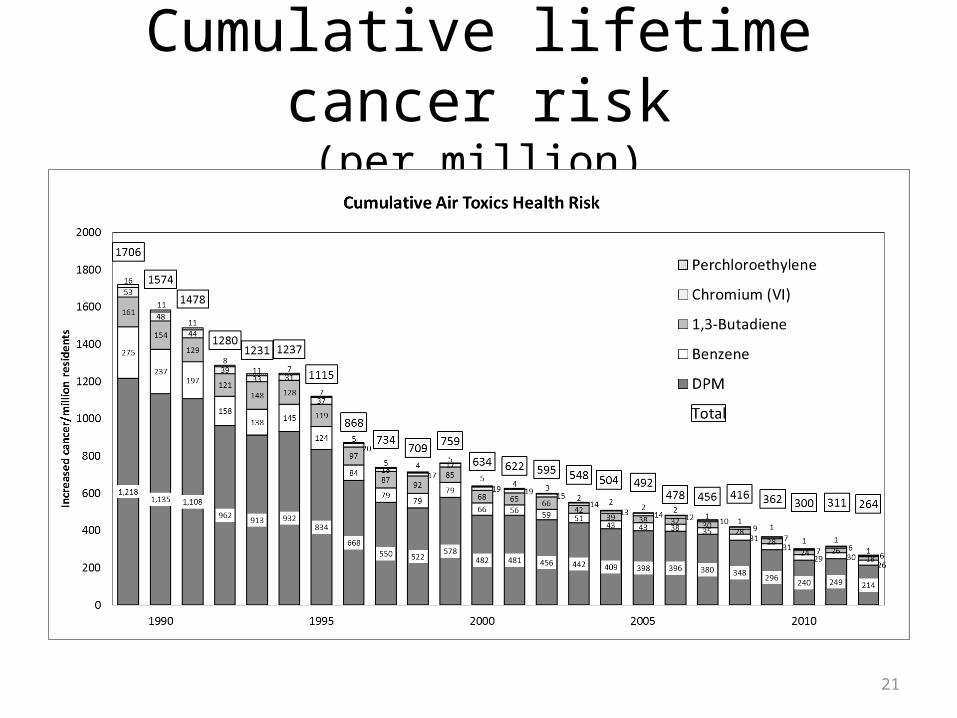
Cumulative lifetime cancer risk(per million)
21
22
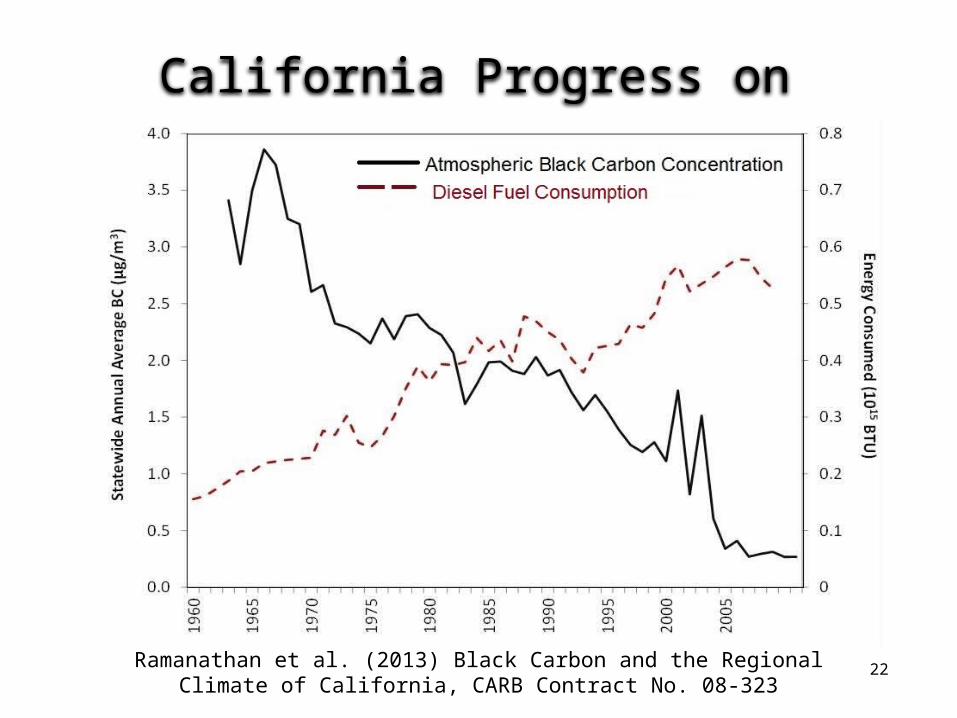
California Progress on Black Carbon
Ramanathan et al. (2013) Black Carbon and the Regional Climate of California, CARB Contract No. 08-323
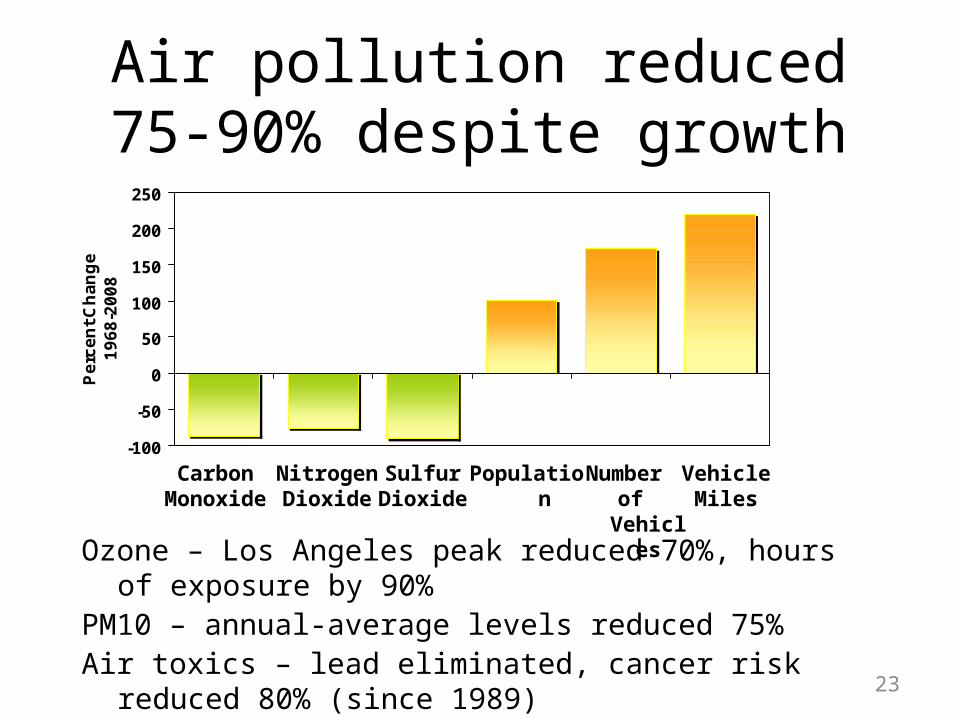
Air pollution reduced 75-90% despite growth
-100
-50
0
50
100
150
200
250
Pe
rce
nt
Ch
an
ge
19
68
-20
08
CarbonMonoxide
NitrogenDioxide
SulfurDioxide
Population Number of Vehicles
VehicleMiles
23
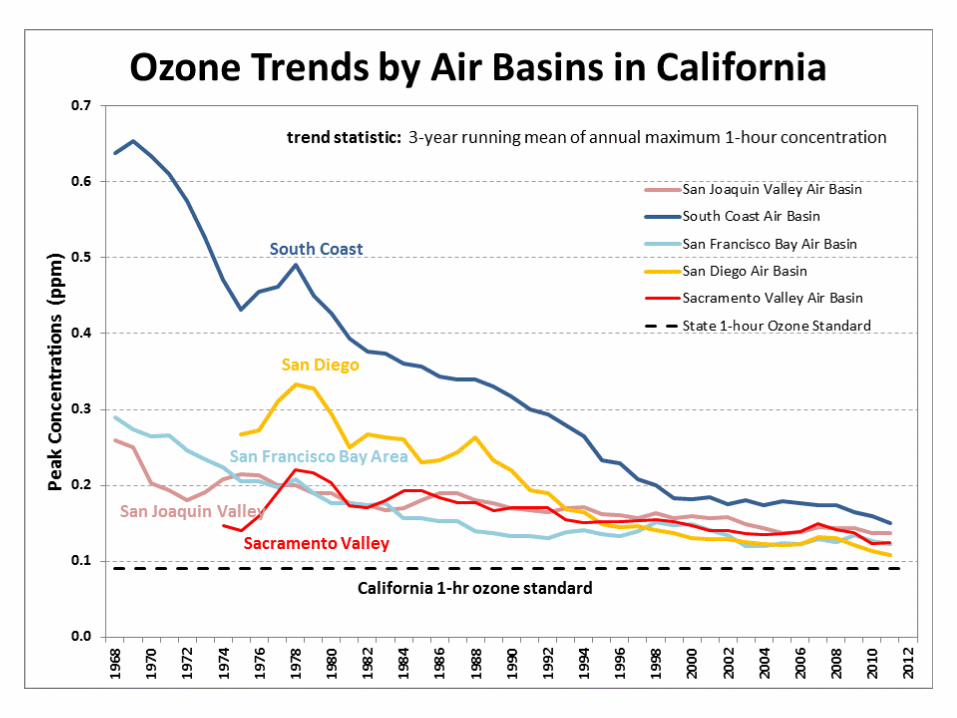
Ozone – Los Angeles peak reduced 70%, hours of exposure by 90%PM10 – annual-average levels reduced 75% Air toxics – lead eliminated, cancer risk reduced 80% (since 1989)Black carbon – reduced 90% (95% by 2020)
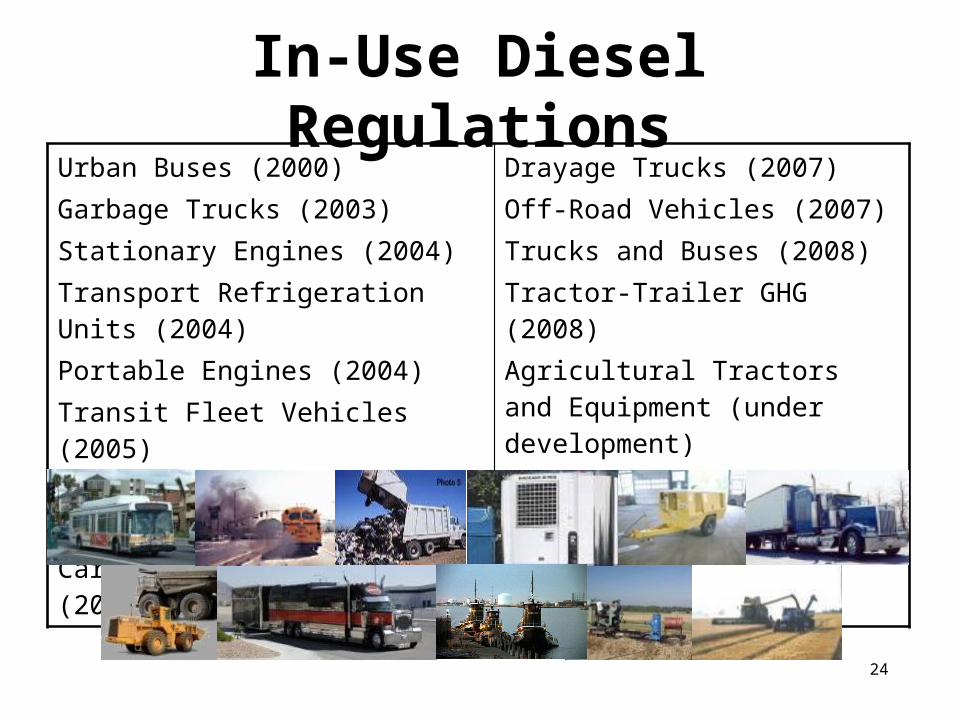
Urban Buses (2000)Garbage Trucks (2003)Stationary Engines (2004)Transport Refrigeration Units (2004)Portable Engines (2004)Transit Fleet Vehicles (2005)Public Fleets & Utilities (2005)Cargo Handling Equipment (2005)
Drayage Trucks (2007)Off-Road Vehicles (2007)Trucks and Buses (2008)Tractor-Trailer GHG (2008)Agricultural Tractors and Equipment (under development)
In-Use Diesel Regulations
24
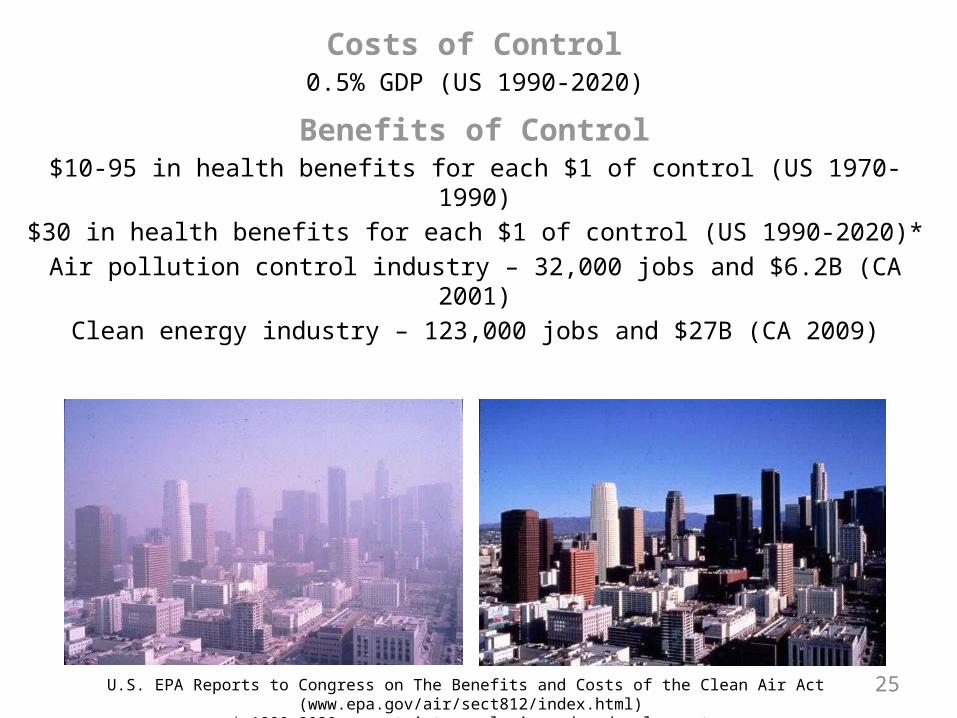
Costs of Control0.5% GDP (US 1990-2020)
Benefits of Control$10-95 in health benefits for each $1 of control (US 1970-1990)$30 in health benefits for each $1 of control (US 1990-2020)*
Air pollution control industry – 32,000 jobs and $6.2B (CA 2001)Clean energy industry – 123,000 jobs and $27B (CA 2009)
25U.S. EPA Reports to Congress on The Benefits and Costs of the Clean Air Act (www.epa.gov/air/sect812/index.html)* 1990-2020 uncertainty analysis under development
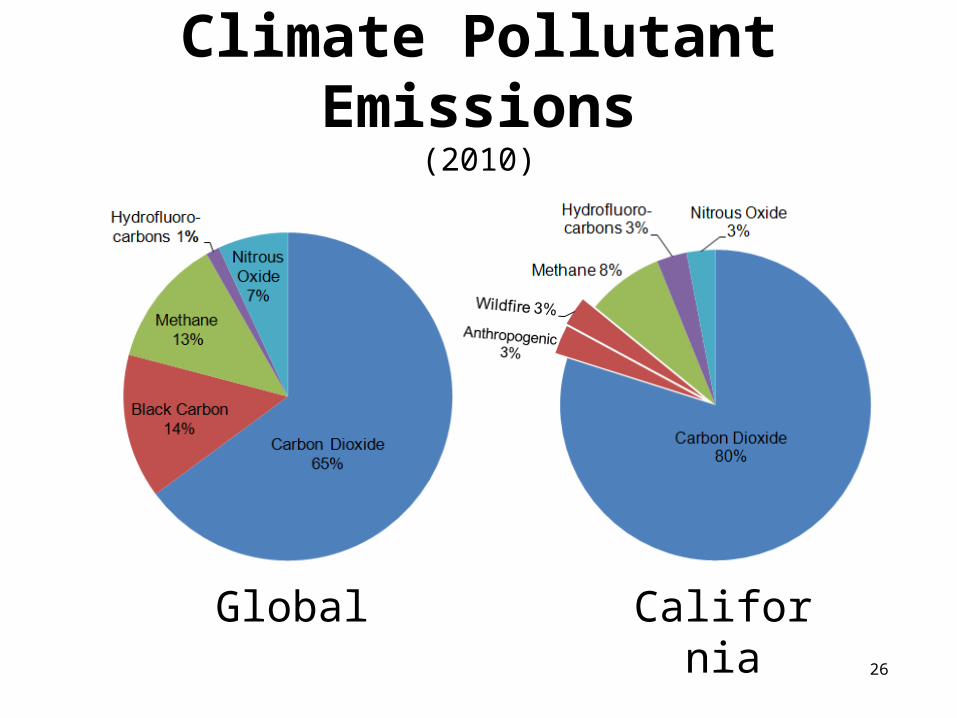
Climate Pollutant Emissions(2010)
Global California26
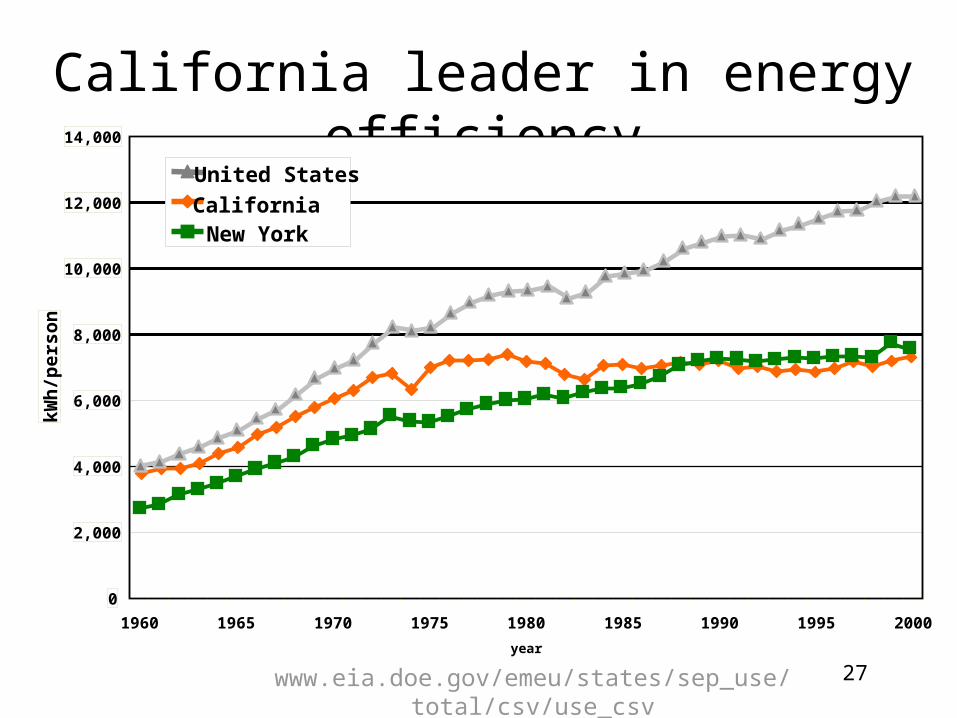
California leader in energy efficiency
0
2,000
4,000
6,000
8,000
10,000
12,000
14,000
1960 1965 1970 1975 1980 1985 1990 1995 2000
year
kWh
/per
son
United States
CaliforniaNew York
www.eia.doe.gov/emeu/states/sep_use/total/csv/use_csv 27
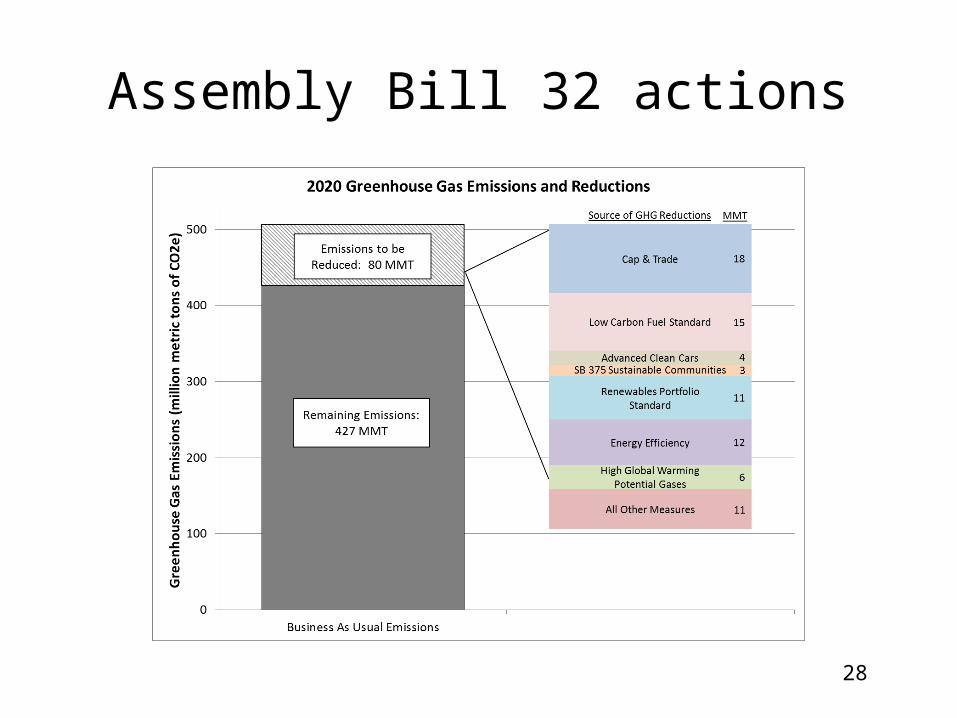
Assembly Bill 32 actions
28
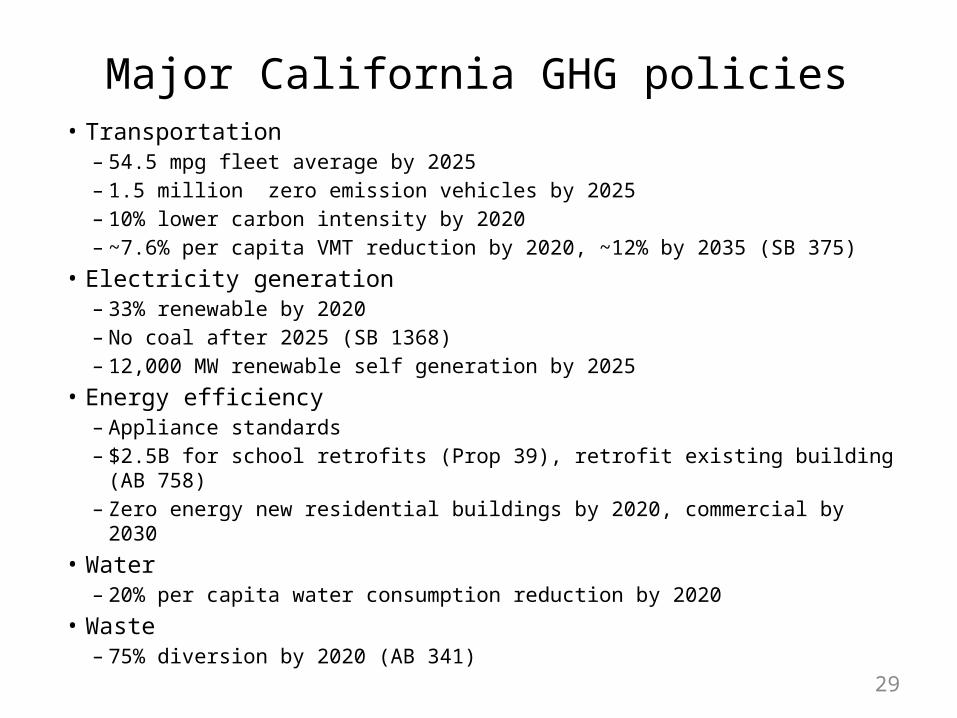
Major California GHG policies• Transportation
– 54.5 mpg fleet average by 2025– 1.5 million zero emission vehicles by 2025– 10% lower carbon intensity by 2020– ~7.6% per capita VMT reduction by 2020, ~12% by 2035 (SB 375)
• Electricity generation– 33% renewable by 2020– No coal after 2025 (SB 1368)– 12,000 MW renewable self generation by 2025
• Energy efficiency– Appliance standards– $2.5B for school retrofits (Prop 39), retrofit existing building (AB 758)– Zero energy new residential buildings by 2020, commercial by 2030
• Water– 20% per capita water consumption reduction by 2020
• Waste– 75% diversion by 2020 (AB 341) 29
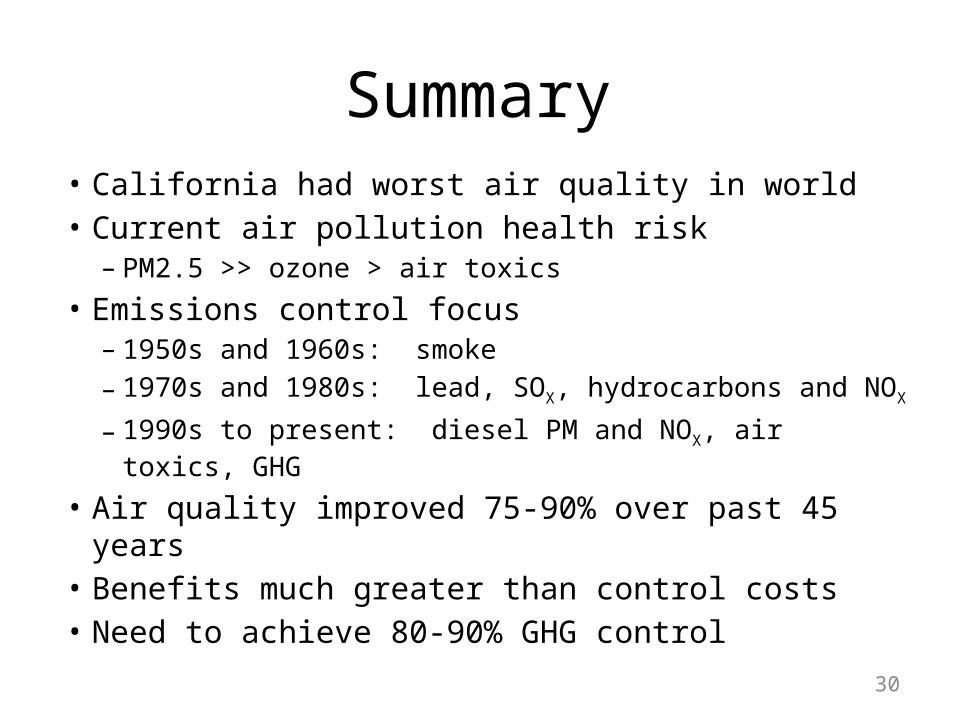
Summary• California had worst air quality in world• Current air pollution health risk
– PM2.5 >> ozone > air toxics• Emissions control focus
– 1950s and 1960s: smoke– 1970s and 1980s: lead, SOX, hydrocarbons and NOX
– 1990s to present: diesel PM and NOX, air toxics, GHG
• Air quality improved 75-90% over past 45 years• Benefits much greater than control costs• Need to achieve 80-90% GHG control
30