Embed Size (px)
Citation preview

What we learned from GDS2016
An overview of our key findings
Dr Adam R Winstock, Dr Monica Barrett, Dr Jason Ferris & Dr Larissa Maier
The GDS Core Research Team
• GDS 2012: 15,500
• GDS 2013: 22,000
• GDS 2014: 77,000
• GDS 2015: 100,000
• GDS 2016: 100,000
• GDS2017: target 250K
If you want to join e-mail us at
WE RUN THE BIGGEST DRUGSURVEY IN THE WORLD
www.globaldrugsurvey.com

GDS FREE APPS AND ADVICE
Global Drug Survey (GDS) runs the world’s biggest annual drug survey.
A total of 101,313* people from over 50 countries participated in GDS2016
*Data analysis was conducted on out on 97,000 for these preliminary analyses.
About
GDS is an independent global drug use dataexchange hub that conducts universityethics approved, anonymous on-linesurveys. We collaborate with global mediapartners who act as hubs to promote ourwork.
GDS is comprised of experts from the fields of medicine, toxicology, public health, psychology, chemistry, public policy, criminology, sociology, harm reduction and addiction. We research key issues of relevance and importance to both people who use drugs and those who craft public health and drug policy.
Mission
We aim to make drug use safer regardless of the legal status of the drug by sharing information in a credible and meaningful way.
Our last 3 surveys, run at the end of 2013, 2014 & 2015 received almost 300,000 responses.
Over the last decade GDS has successfully supported the widespread dissemination of essential information both to people who use drugs through our media partners and to the medical profession through academic papers presentation at international conferences and, expert advisory meetings
Using and reporting the data
In all copy related to the data provided the studyshould be referred to as Global Drug Survey 2016 (GDS2016)
Global Drug Survey GDS2016 © Not to be reproduced without authors permission
www.youtube.com/user/GlobalDrugSurveywww.globaldrugsurvey.comwww.drinksmeter.comwww.drugsmeter.comwww.saferuselimits.comwww.onetoomany.comwww.globaldrugsurvey.com/brand/the-highway-code/
We estimate that over the duration of the study (Nov 15 – Jan 16) over 100,000 people spent in excess of
3.5 million minutes OR
58,000 hours OR
2400 days OR
350 weeks OR
6.5 years sharing their drug use experiences with us. So a HUGE thanks to you all. GDS does not exist without you.
GDS is the world’s biggest annual drug survey. Our last survey, GDS2016, ran for 6 weeks at the end of 2015, was
translated into 10 languages and received > 100,000 responses from around the world. Over the last 3 years we have
obtained data from almost 300,000 people. By the end of 2016 we estimate our global database will be in excess of
600,000.
GDS has expanded this year, with an increasing number of countries, groups and individuals joining our network. We
acknowledge the overwhelming support and encouragement we continue to receive from our global media partners,
academic network and many harm reduction groups around world.
Thank you to everyone who took part
Global Drug Survey GDS2016 © Not to be reproduced without authors permission
Just how generous people were with their time?

Before reading our findings please understand our method and its limitations
It is important to understand what GDS can and cannot do when interpreting our findings. Don’t look to GDS for national estimates of
drug use. GDS is designed to answer comparison questions that are not dependent on probability samples. GDS acknowledges that
when compared with traditional epidemiological criteria for a good public health surveillance system, our approach has significant
limitations. GDS utilizes non-random, opportunistic sampling methods to recruit very large numbers of people who use drugs. The
recruitment window is brief with the survey active for only 6 weeks. In 2016, there was an exception to this due to the saddening
events in Paris, France that coincided with the recruitment period of GDS. The sample representativeness is limited by response bias,
meaning there will be inherent differences between those who participate and those who do not. This survey is only available on-line
and will therefore tend to miss those without easy online access and those with lower levels of literacy.
Throughout this report we provide some comparisons on some key areas that may be of interest to readers of your publications.
Because the samples we have obtained from different countries vary considerably in size, demographics and other characteristics,
such comparisons have to be treated with caution. The limitations in cross country comparisons will be more marked for some results
than others, particularly in countries with small numbers.
The GDS database is massive but its non-probability sample means analyses are suited to highlight differences among user
populations. GDS is thus best suited to answer comparison questions that are not dependent on probability samples. The GDS sample
allows you to effectively compare population segments - young, old, males, females, gay, straight, clubbers, thin people, obese people,
vegetarians, those with a current psychiatric symptoms and diagnoses, students, northerners, southerners……... GDS also explores the
experience of particular drugs on users, such as seeking medical attention and/or the desire to change consumption patterns.
GDS can help add numbers and depth to the findings of more rigorous, though less detailed and smaller, survey findings. GDS reaches
hidden, sentinel and hard to reach populations. GDS puts you on top of emerging drug trends in your country and major cities
Now you know what GDS cannot do, here’s what we can do! 3
Global Drug Survey GDS2016 © Not to be reproduced without authors permission

Global Drug Survey GDS2016 © Not to be reproduced without authors permission
WHAT GDS WON’T DO FOR YOU
• Don’t look to GDS for national estimates of drug use prevalence .
• GDS is designed to answer comparison questions that are not dependent on probability samples.
• GDS database is huge but its non-probability sample means analyses are suited to highlight differences among user populations.
WHAT GDS WILL DO FOR YOU• GDS is an efficient approach to gain
content rich data that explores diverse health outcomes associated with the use of drugs and alcohol across the population of your country.
• GDS recruits younger, more involved drug using populations.
• We spot emerging drug trends before they enter into the general population
• Our data is < 6 months old• GDS helps you better understand the
quantitative dynamics of personal decision-making about drug use, detects regional differences in patterns of drug use and related harm and informs novel interventions.
• Provides current data on the patterns of use, harms, health and well-being experienced by the full spectrum of users.

Germany 31% (29,866)
Switzerland 8.5% (8,174)
New Zealand 8% (7,633)
United Kingdom 6% (6,015)
United States 5.5% (5,367)
Netherlands 5.2% (5,058)
Australia 5% (4,931)
France 4% (3,858)
Italy 3% (3,189)
Hungary 3% (3,071)
Spain 3% (2,520)
Colombia 2% (2,095)
Austria 2% (2,055)
Global Drug Survey GDS2016 © Not to be reproduced without authors permission
Norway 1.5% (1,461)
Canada 1.5% (1,297)
Mexico 1% (1,203)
Belgium 1% (1,027)
Brazil 1% (1,012)
Portugal 1% (1,008)
Sweden 1% (706)
Scotland 1% (647)
Republic of Ireland 1% (707)
Denmark 0.5% (296)
WHERE IN THE WORLD

Global Drug Survey GDS2016 © Not to be reproduced without authors permission
GDS2016.5 A mini 5 minute launch survey
Following our global media report release on June 14th 2016 we will be running a 5 minute survey exploring 4 areas in depth as part of GDS2017. These are: 1) How have psychedelics changed your life?2) What drugs have you ever ‘vaped’?3) Would you use drug checking facilities if you had them available?4) What do you do when your mate collapses/passes out?5) Please promote this using your networks and we’ll share the results with you in November 2016. 6) The link will go live on June 14th 2016 at www.globaldrugsurvey.com/GDS2016.5
GDS2017 areas of focus – launching November 2016
GDS has invested heavily this year in new design and technology. GDS2017 can be easily completed on phones and tablets; it will also allow continuous data submission. We will have a short core survey that will take 20 minutes to complete plus 4 specialist areas that people can opt into if they chose. GDS2017 will focus on 4 areas: 1) How psychedelics change people and are used by people for different functions from micro-dosing LSD to the commercialization of Ayahausca.2) While vape technology may be a common way to use nicotine and increasingly cannabis, the interaction between this technology and drugs is only just beginning. GDS2017 will explore how ‘vaping’ changes the drug experience and what other drugs people are choosing to use this way3) How people use MDMA to maximize pleasure and minimize the risk of problems and how this once archetypal dance drug has left the dance floor for people’s living rooms and dinner parties4) Drug tourism – people travel the world to take drugs – but does their consumption and risk vary when they leave their own backyard? GDS2017 will tell the real story of drug use abroad.

The GDS academic network publishes in the best academic journals : recent peer reviewed papers derived from GDS data
2016Barratt, M.J., Ferris, J.A. and Winstock, A.R., 2016. Safer scoring? Cryptomarkets, social supply and drug market violence. International Journal of Drug Policy. Barratt, M.J., Ferris, J.A. and Winstock, A.R., 2016. Safer scoring? Cryptomarkets, social supply and drug market violence. International Journal of Drug Policy.
Kaar, S.J., Ferris, J., Waldron, J., Devaney, M., Ramsey, J. and Winstock, A.R., 2016. Up: The rise of nitrous oxide abuse. An international survey of contemporary nitrous oxide use. Journal of Psychopharmacology, 30(4), pp.395-401. http://jop.sagepub.com/content/30/4/395.short
Hindocha, C., Freeman, T.P., Winstock, A.R. and Lynskey, M.T., 2016. Vaping cannabis (marijuana) has the potential to reduce tobacco smoking in cannabis users. Addiction, 111(2), pp.375-375. http://onlinelibrary.wiley.com/doi/10.1111/add.13190/abstract
2015Bellis, M.A., Quigg, Z., Hughes, K., Ashton, K., Ferris, J. and Winstock, A., 2015. Harms from other people's drinking: an international survey of their occurrence, impacts on feeling safe and legislation relating to their control. BMJ open, 5(12), p.e010112. http://bmjopen.bmj.com/content/5/12/e010112.full
Winstock, A., Lynskey, M., Borschmann, R. and Waldron, J., 2015. Risk of emergency medical treatment following consumption of cannabis or synthetic cannabinoids in a large global sample. Journal of Psychopharmacology, 29(6), pp.698-703. http://jop.sagepub.com/content/29/6/698.short
Morley, K.I., Lynskey, M.T., Moran, P., Borschmann, R. and Winstock, A.R., 2015. Polysubstance use, mental health and high‐risk behaviours: Results from the 2012 Global Drug Survey. Drug and alcohol review, 34(4), pp.427-437. http://onlinelibrary.wiley.com/doi/10.1111/dar.12263/abstract;jsessionid=26703382FC120FE8E46B14946950E57C.f04t04?userIsAuthenticated=false&deniedAccessCustomisedMessage=
Winstock, A., 2015. New health promotion for chemsex and γ-hydroxybutyrate (GHB). BMJ, 351, p.h6281. http://www.bmj.com/content/351/bmj.h6281.abstract
Uosukainen, H., Tacke, U. and Winstock, A.R., 2015. Self-reported prevalence of dependence of MDMA compared to cocaine, mephedrone and ketamine among a sample of recreational poly-drug users. International Journal of Drug Policy, 26(1), pp.78-83. http://www.sciencedirect.com/science/article/pii/S0955395914001728
Stevens, A., Barratt, M., Lenton, S., Ridout, M. and Winstock, A., 2015. Social Bias in the Policing of Illicit Drug Users in the UK and Australia: Findings from a Self-Report Study. Available at SSRN 2618393.http://papers.ssrn.com/sol3/papers.cfm?abstract_id=2618393
Garnett, C., Crane, D., West, R., Michie, S., Brown, J. and Winstock, A., 2015. Normative misperceptions about alcohol use in the general population of drinkers: A cross-sectional survey. Addictive behaviors, 42, pp.203-206. http://www.sciencedirect.com/science/article/pii/S0306460314003827
Shiner, M. and Winstock, A., 2015. Drug use and social control: The negotiation of moral ambivalence. Social Science & Medicine, 138, pp.248-256.Shiner, M. and Winstock, A., 2015. Drug use and social control: The negotiation of moral ambivalence. Social Science & Medicine, 138, pp.248-256.
Freeman, T.P. and Winstock, A.R., 2015. Examining the profile of high-potency cannabis and its association with severity of cannabis dependence. Psychological medicine, 45(15), pp.3181-3189 .http://journals.cambridge.org/download.php?file=%2FPSM%2FPSM45_15%2FS0033291715001178a.pdf&code=ae3a71a70fa59432968140bc4db80943
Winstock, A.R., Lawn, W., Deluca, P. and Borschmann, R., 2015. Methoxetamine: An early report on the motivations for use, effect profile and prevalence of use in a UK clubbing sample. Drug and alcohol review.http://onlinelibrary.wiley.com/doi/10.1111/dar.12259/full Global Drug Survey GDS2016 © Not to be reproduced without authors permission

Global Drug Survey GDS2016 © Not to be reproduced without authors permission
If you want to get a full downloadable copy of our report please send an e mail request to [email protected]
As a taster of the please see the next few slides

Global Drug Survey GDS2016 © Not to be reproduced without authors permission
Key findings from the Global Drug Survey2016 (data collected Nov 15-Jan 16)
More people shopping on the dark net, more people using MDMA & experiencing harm, synthetic cannabinoids the most dangerous drugs in the world.
Novel Psychoactive Substances (NPS) Trends in the UK – most people buy NPS on-line
UK has highest rate of last year NPS purchase of any GDS country (11.6% of UK sample) GDS2016 reports increase in UK last year purchase of NPS after falling rates over last 4 yearsDecline in high street NPS purchases from 46.3% in GDS2014 to 34.6% in GDS2016. 58% of those reporting buying NPS last year did so on-line. 3 times more likely end up seeking emergency medical treatment with NPS than traditional drugs
Synthetic Cannabinoids (SCs) and A&E
Synthetic cannabinoids more likely to lead to emergency medical treatment than any other drug1 in 8 of those using weekly or more often reported seeking emergency medical treatment (3.5% of all users) Overall risk of seeking emergency medical treatment when using SCs is 30 times greater than skunkOver half of those using more than 50 times in last year who tried to stop reported withdrawal symptoms

Global Drug Survey GDS2016 © Not to be reproduced without authors permission
The dark-net rising• Globally almost in 1 in 10 participants (9.3%) reported ever buying drugs off the dark-net
with those reporting last year dark-net purchase rising from 4.5% to 6.7%. o MDMA, cannabis, new or novel substances (including 2C-B and DMT) and LSD are the
drugs most commonly boughto 5% of respondents stated that they did not consume drugs prior to accessing them
through dark-net markets
The worst time to be using MDMA in a generation• Increase in use of both MDMA and cocaine over the last 3 years. o Concerns over high dose MDMA pills leading to increased risk of acute harmo 4-fold increase in British female clubbers seeking emergency medical treatment in last 3
years. Women 2-3 more likely to seek emergency treatment than meno UK users take more MDMA in a night than anyone else (almost half a gram)o Most people use less than 10 times per year
Global Drug Survey GDS2016 © Not to be reproduced without authors permission
No Laughing MatterBiggest study of nitrous oxide use everIncreasing rates of use in the UK and globally nitrous oxide is now ranked the 7th most popular drug in the world.10% of users worried about impact of mental / physical health4% reporting symptoms of nerve damage due to vitamin B12 deficiency
DrinkersOne third of drinkers would like to drink less in the coming year yet only 10% on average would like help to do so. www.drinksmeter.com and www.onetoomany.co might help people drink less.Spirits best avoided on night out

DEMOGRAPHICS
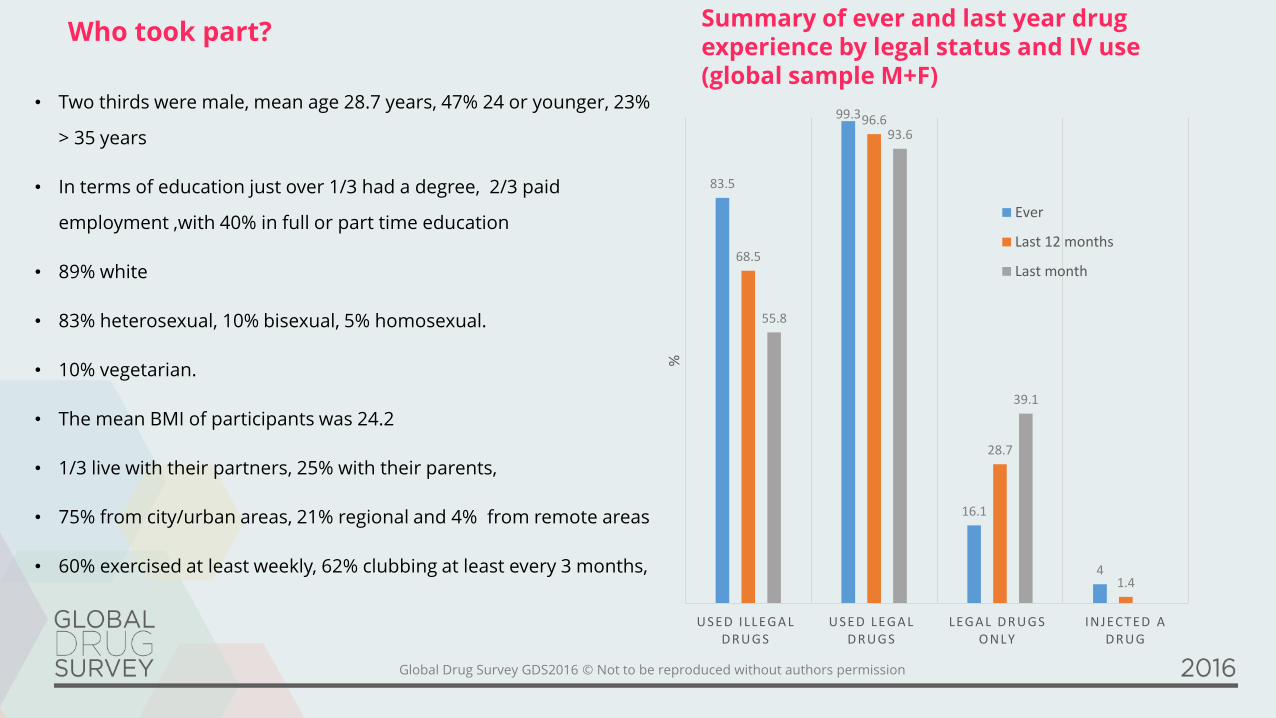
• Two thirds were male, mean age 28.7 years, 47% 24 or younger, 23%
> 35 years
• In terms of education just over 1/3 had a degree, 2/3 paid
employment ,with 40% in full or part time education
• 89% white
• 83% heterosexual, 10% bisexual, 5% homosexual.
• 10% vegetarian.
• The mean BMI of participants was 24.2
• 1/3 live with their partners, 25% with their parents,
• 75% from city/urban areas, 21% regional and 4% from remote areas
• 60% exercised at least weekly, 62% clubbing at least every 3 months,
Global Drug Survey GDS2016 © Not to be reproduced without authors permission
Who took part? Summary of ever and last year drug experience by legal status and IV use (global sample M+F)
83.5
99.3
16.1
4
68.5
96.6
28.7
1.4
55.8
93.6
39.1
USED ILLEGA L D RUGS
USED LEGA L D RUGS
LEGA L D RUGS ONLY
INJECTED A D RUG
%
Ever
Last 12 months
Last month

DRUG USE PREVALENCE
Global Drug Survey GDS2016 © Not to be reproduced without authors permission
92.69
63.14
59.79
54.5
30.49
20.66
18.19
18.05
14.15
12.89
11.75
10.42
8.78
7.51
6.72
6.48
5.72
4.56
4.56
4.33
4.07
3.82
2.43
2.42
2.39
2.24
1.7
1.66
0 10 20 30 40 50 60 70 80 90 100
alcohol
cannabisal l
tobacco
caffeinatedenergydrinks
mdmaall
cocaine
tobaccoshisha
electroniccigarettes
amphetamineall
lsd
magicmushrooms
opioidsall
nitrous
caffeinetablets
ketamine
truffles
poppers
benzodiazepines
tobaccosnus
tramadol
rital in
2cb
dexamphetamine
zdrug
viagra
dmt
kratom
modafini l
% last year prevalence
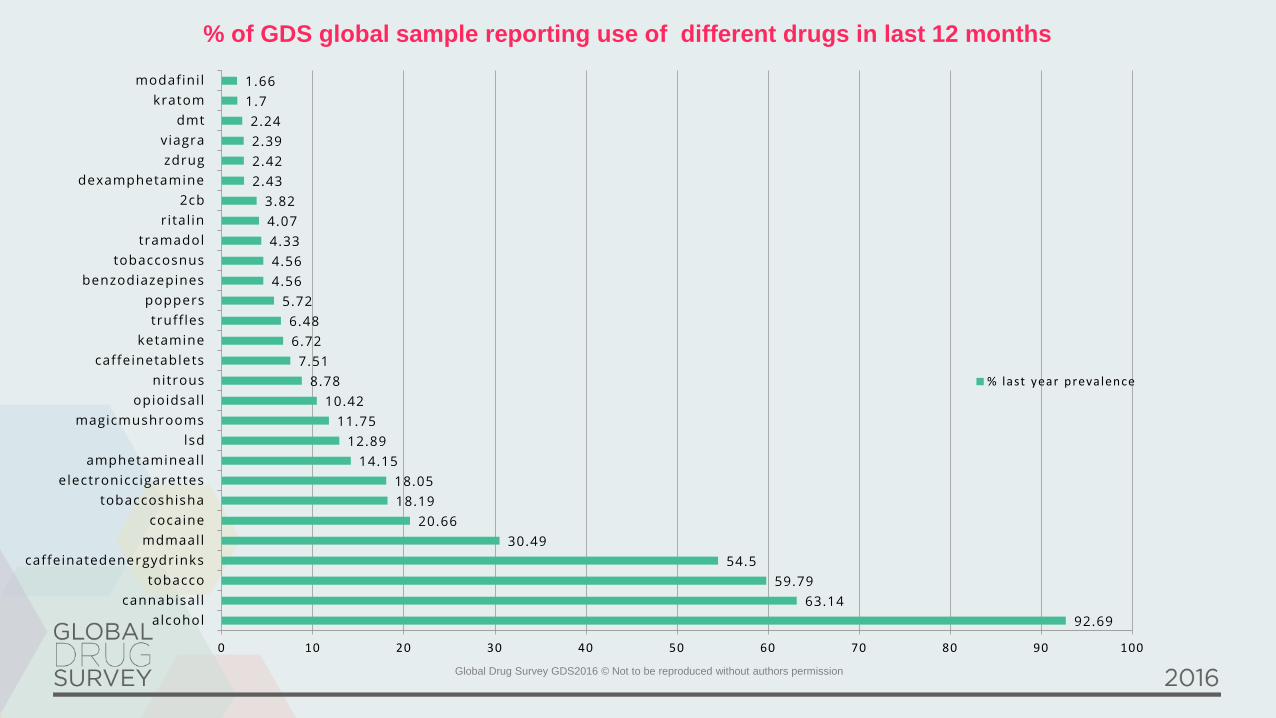
% of GDS global sample reporting use of different drugs in last 12 months
ALCOHOL
Global Drug Survey GDS2016 © Not to be reproduced without authors permission
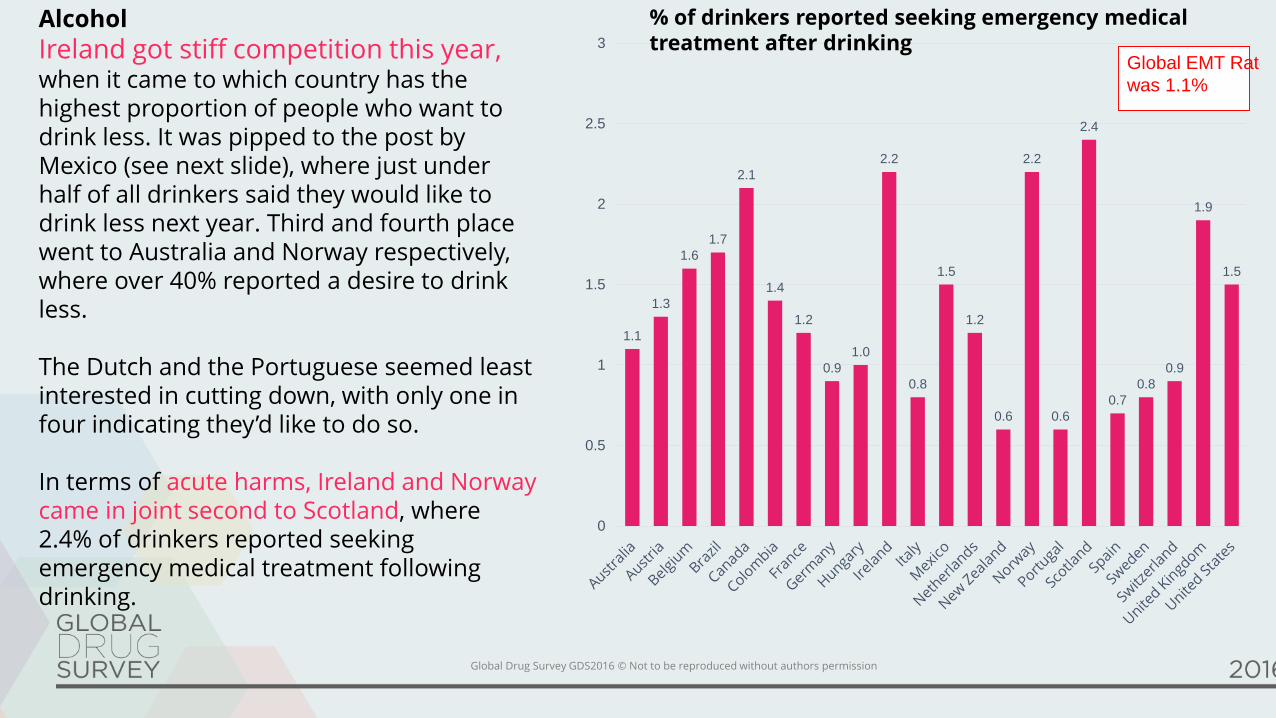
Alcohol
Ireland got stiff competition this year, when it came to which country has the highest proportion of people who want to drink less. It was pipped to the post by Mexico (see next slide), where just under half of all drinkers said they would like to drink less next year. Third and fourth place went to Australia and Norway respectively, where over 40% reported a desire to drink less.
The Dutch and the Portuguese seemed least interested in cutting down, with only one in four indicating they’d like to do so.
In terms of acute harms, Ireland and Norway came in joint second to Scotland, where 2.4% of drinkers reported seeking emergency medical treatment following drinking.
1.1
1.3
1.6
1.7
2.1
1.4
1.2
0.9
1.0
2.2
0.8
1.5
1.2
0.6
2.2
0.6
2.4
0.7
0.8
0.9
1.9
1.5
0
0.5
1
1.5
2
2.5
3
Global EMT Rate
was 1.1%
% of drinkers reported seeking emergency medical treatment after drinking

Global Drug Survey GDS2016 © Not to be reproduced without authors permission
Are all alcoholic beverages the same?
Many countries have beverage mythologies right at their cultural core. These myths have little basis in scientific
fact. From a chemist’s perspective alcohol is a naturally occurring group of organic compounds, predominantly in the form of ethyl alcohol or ethanol. Ethanol increases the influence of a chemical transmitter in the brain called GABA that slows or quietens brain activity, hence we call alcohol a depressant. While alcohol also has a host of other subtle effects on the brain, the active ingredient is always ethyl alcohol. So no matter how you make your alcohol, it its always ethyl alcohol that gets you drunk. While the choice of source product and the difference
between fermentation and distillation determine whether you make beer, cider, wine or spirits, the variation in
taste and smell is largely due to the contribution of various congeners - chemicals which include acetone, acetaldehyde, esters, fusel alcohols and aldehydes.
These congeners may contribute to the difference in possible effects. Acetaldehyde is a breakdown product of
alcohol that contributes to hangovers. Darker beverages such as red wine, scotch and brandy contain a higher percentage of congeners. Studies are inconsistent, but many report that the darker the drink, the worse the hangover.
GDS2016 aimed to find out whether different drinks affect people differently in a consistent manner around the world. Before we take a look at the results let’s quickly review the possible scientific explanations for what we might find.
• It might be that certain drinks tend to get drunk in different ways, meaning that it’s easier to drink more alcohol in some forms than others.
• It might be that some drinks are more likely to be drunk in certain environments or on different occasions
• It might be that some people drink certain drinks when they are feeling in particular moods
• It might be that certain drinks are more likely be drunk by certain people
• It might be that some drinks are drunk with certain mixers that alter mood or behavior (e.g. energy drinks)
• It might be that people try to make sense of what has happened after the event (known as ‘effort after
meaning) For example ‘I ended up with that turd in my pocket because of the brandy, you know what it does
to me...), i.e. its an excuse that people can pull out that might avoid them admitting they just drunk too much
• It might be all be nonsense
.

Global Drug Survey GDS2016 © Not to be reproduced without authors permission
Type of drink that gives the worst hangover (%) (GLOBAL)
Spirits, 48
Red wine, 15
Beer, 10
White wine, 7
Other, 4
Cider, 2 None of them, 15
With a third of all drinkers on average saying they
would like to think less and others who probably
need to, GDS is pleased to remind you of our
fabulous Drinks Meter app, free on the app stores
or at www.drinksmeter.com. V3 is out this summer
and we are now offering health region and local
service versions to deliver IBA on tablets and on-
line in multiple languages .
Free on the app stores and at www.drinksmeter.com

Beverage type
Despite some considerable national variation, it seems that
spirits are the type of alcohol most commonly drunk when away from
home and also rated most likely to make you feel energised,
confident and sexy. Inconsistently, spirits were also rated as most
likely to make you feel restless, tearful and ill (including most likely to
give you a hangover). Beer was voted as most likely to make you feel
relaxed and red wine topped the list for making you Feel sleepy. The
polarizing effects of spirits are most likely to be a consequence of
dose. Low levels of alcohol can cause disinhibition and reduce mild
anxiety making people feel more confident and outgoing. Low levels
of alcohol might also be felt as stimulating by some users, though in
other cases the stimulation will come from the caffeinated mixers
commonly used to dilute spirits (colas and energy drinks). Higher
doses of alcohol can result in nausea, dizziness, excessive sweating,
emotional dysregulation people become inexplicably angry, sad,
hostile, tearful etc.) and of course the more you drink the worse your
hangover.
So a lot of the problems caused by sprits might come down to the fact
that they are more difficult to titrate (drinking to a level that gets the
effect you want without over shooting it) than beer or wine.
Titration with spirits is difficult for three main reasons. Firstly, since they
are the most potent form of alcohol, you can consume more alcohol
more quickly when drinking spirits that other types of beverage. It’s easy
to get drunk too quickly on spirits and once you’re drunk making smart
decisions about everything becomes difficult. Secondly, spirits with
alcohol content above 20% ABV are difficult to absorb and at 40%
ABV your stomach stops emptying. What this means is that despite
having drunk as much as you need to, you might not yet feel the full
effects of what you have drunk. People then carry on drinking thinking
‘I’m fine’, until ‘boom’ the alcohol that has been sitting in your stomach
gets absorbed and you end up way more drunk that you planned. The
third reason that spirits are difficult to titrate is because of the wide
variation in serving size from shots, to doubles in mixers to cocktails. It
can be almost impossible to keep track of how much you have had.
You can end up cool and sexy or pathetic and passed out on any form
of alcohol. If all the above is true, there appear to be advantages to
avoiding spirits. This is not because of the ‘alcohol’ necessarily having
different effects, but because spirits are highly concentrated, hard to
titrate and keep track of, and they can fool your body into thinking you
have not yet drunk ‘enough’, all of which GDS would consider good
reasons to avoid spirits.
Global Drug Survey GDS2016 © Not to be reproduced without authors permission
CANNABIS

Global Drug Survey GDS2016 © Not to be reproduced without authors permission
Global comparison of preferred cannabis preparations around the world
0
10
20
30
40
50
60
70
80
90High potency herbal Resin Normal weed BHO Other
%
We think things are changing, possibly for the better in some respects. First, GDS data seem to suggest that high
potency herbal cannabis is no longer the default or preferred preparation around the world.
We remain surprised at just many last year
cannabis users reported seeking emergency medical
treatment in the previous 12 months, with 1.2% of
over 45,000 cannabis users who took part in
GDS2016 reporting such an episode. Now although
seeking emergency medical treatment is not the
same as having a bad time on a drug or even
needing serious medical intervention, it does give
idea of the nature and rate of people experiencing
acute problems from using cannabis. The rates
varied widely users between countries and it was
surprising that Portugal where resin predominates
and Colombia and Brazil where natural weed is
most common reported such high rates. GDS will be
looking at just who was most at risk of seeking
acute treatment in the coming months (e.g. less
experienced users, heavier users, those with mental
illness etc.)0 0.5 1 1.5 2 2.5 3
Denmark
Columbia
Brazil
Canada
Italy
Belgium
Ireland
Portugal
Spain
Austria
France
Switzerland
Germany
United States
Australia
Netherlands
United Kingdom
Hungary
New Zealand
Scotland
% Last year users
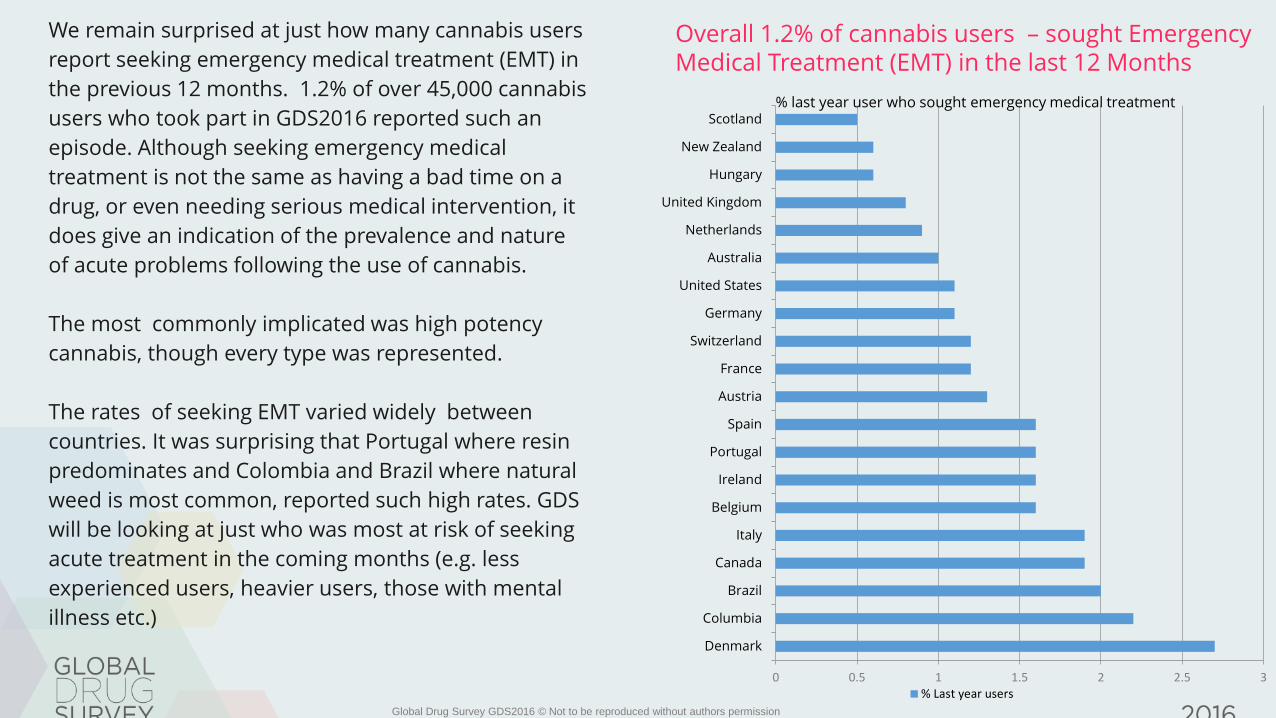
Overall 1.2% of cannabis users – sought Emergency Medical Treatment (EMT) in the last 12 Months
0 0.5 1 1.5 2 2.5 3
Denmark
Columbia
Brazil
Canada
Italy
Belgium
Ireland
Portugal
Spain
Austria
France
Switzerland
Germany
United States
Australia
Netherlands
United Kingdom
Hungary
New Zealand
Scotland% last year user who sought emergency medical treatment
% Last year users
We remain surprised at just how many cannabis users
report seeking emergency medical treatment (EMT) in
the previous 12 months. 1.2% of over 45,000 cannabis
users who took part in GDS2016 reported such an
episode. Although seeking emergency medical
treatment is not the same as having a bad time on a
drug, or even needing serious medical intervention, it
does give an indication of the prevalence and nature
of acute problems following the use of cannabis.
The most commonly implicated was high potency
cannabis, though every type was represented.
The rates of seeking EMT varied widely between
countries. It was surprising that Portugal where resin
predominates and Colombia and Brazil where natural
weed is most common, reported such high rates. GDS
will be looking at just who was most at risk of seeking
acute treatment in the coming months (e.g. less
experienced users, heavier users, those with mental
illness etc.)
Global Drug Survey GDS2016 © Not to be reproduced without authors permission

1 in 3 users wants to use less, 10% are dependent and 1% need to
visit the emergency room each year. This means a lot of people who
are using a drug that we might think of as not that risky, are
experiencing difficulties. Whilst www.drugsmter.com can be a great
source of feedback, we thought some guidelines might help so we
created them at www.saferuselimits.co
Global Drug Survey GDS2016 © Not to be reproduced without authors permission
CANNABIS, VAPING, E-CIG & BUTANE HASH OIL

Cannabis concentrates
BHO continued to show its rising popularity in the US (where just over a third of cannabis users reported use
of BHO) and Canada. The most striking changes compared to last year’s findings were the increase in the
recent cannabis users reporting the use of BHO (6.4% up from 4.2% last year) and the significant drop in
people using it with joints in tobacco and the marked rise in people using bongs to use BHO. Overall the
data from GDS2015 and GDS2016 suggests BHO typically gets people more stoned, more quickly and for
longer than high potency herbal cannabis. The worry is that people also build up tolerance more quickly and
may be more at risk of acute unwanted experiences. These issues will need to be balanced against the
potential health benefits of promoting non-tobacco routes of administration. GDS repeats its request to
manufactures made last year to produce and promote more balanced BHO oils (THC / CBD ratio closer to 2
or 3:1) and for public health agencies to encourage the use of vape pens and other non-tobacco related
routes of use.
With over a third of our last year users reporting use on 100 days or more in the last year and too many
people smoking it and mixing it with tobacco, GDS wants to remind people about our free cannabis tools,
the drugs meter (free on google play and www.drugsmeter.com) and the world’s first ever safer use limits
guide at www.saferuselimits.co . We have data to produce these safer use limit guides for MDMA, cocaine
and ketamine – so if anyone wants to fund these please let us know!
Global Drug Survey GDS2016 © Not to be reproduced without authors permission

SEEKING EMERGENCY MEDICAL TREATMENT (EMT)
Global Drug Survey GDS2016 © Not to be reproduced without authors permission
N = 1.5K
1.11.2
0.6
2.6
0.8
0.4
3.6
2.1
1.1 1.1
0.6
2.5
0.6
0.3
4.2
1.11.2
0.6
2.7
1.2
0.6
2.4
0
0.5
1
1.5
2
2.5
3
3.5
4
4.5
Alcohol Cannabis Cocaine Any NPS MDMA/Ecstacy Ketamine Synthetic
cannabinoids
Any substance
Both Male Female
%
N = 90K N = 47K N = 20K N = 4K N = 30K N = 6K n = 100K
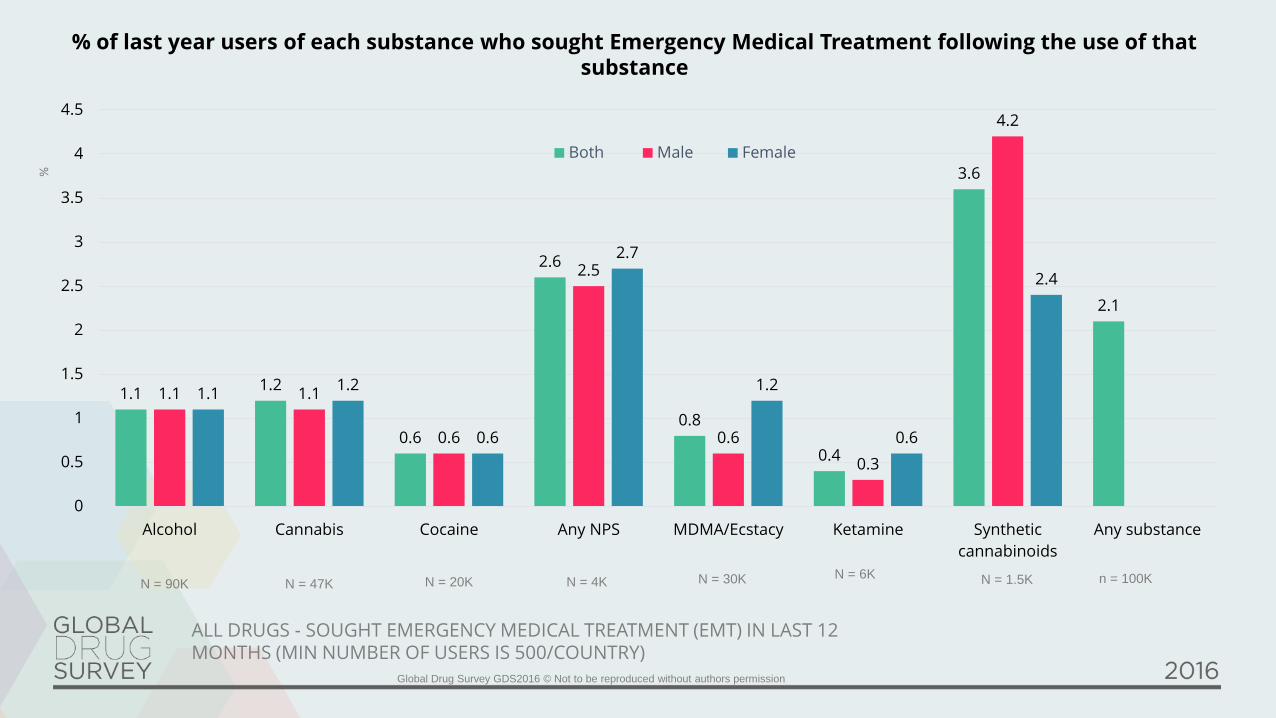
% of last year users of each substance who sought Emergency Medical Treatment following the use of that substance
ALL DRUGS - SOUGHT EMERGENCY MEDICAL TREATMENT (EMT) IN LAST 12MONTHS (MIN NUMBER OF USERS IS 500/COUNTRY)

SYNTHETIC CANNABINOIDS/CANNABIS
The risk of seeking emergency medical treatment is at least
30 x times greater after taking synthetic cannabinoids products than natural
cannabis
(Winstock et al J Psychopharmacology 2015)

Comparing synthetic cannabis to high potency herbal cannabis
46.3
15.8
56.2
8.713.5
20.2
53.3
18.4
36.435.8
18.120.2
14.1
28.9 22.9
15.410.9 11.3
26.0 27.8
0%
10%
20%
30%
40%
50%
60%
70%
80%
90%
100%
Easier to
titrate effect
Quicker
speed of
onset of
effect
Duration of
effect
Worse
withdrawal
Quicker build
up of
tolerance
Hi potency herbal Syn Can Same Don't know
Global Drug Survey GDS2016 © Not to be reproduced without authors permission
Overall synthetic cannabinoids (SCs) can be considered to
have a profile that increases the risk of developing both
short term and long term problems including
dependence. Although at some level it is no longer appropriate
to consider SCs as a homogenous class of drugs broadly
compared to natural cannabis, those using SCs report the more
rapid onset of effects, shorter duration of effects, more rapid
development of tolerance and longer, more physical withdrawal,
which appears to be occurring at lower levels of use than that
seen with natural cannabis. The more pronounced withdrawal is
probably due to a combination of the SC products being more
potent agonists at the THC receptor than THC (the active
ingredient in cannabis) and the absence of a synthetic CBD like
molecule which we know balances/reduces both the adverse,
acute effects of THC as well as reducing the severity of
withdrawal. The addition of synthetic CBD analogues might be
one way to ameliorate these unwanted and potentially
dangerous risks. More research will need to be done to see if our
approaches to managing cannabis withdrawl are sufficient /
effective to manage these more aroused states.
34
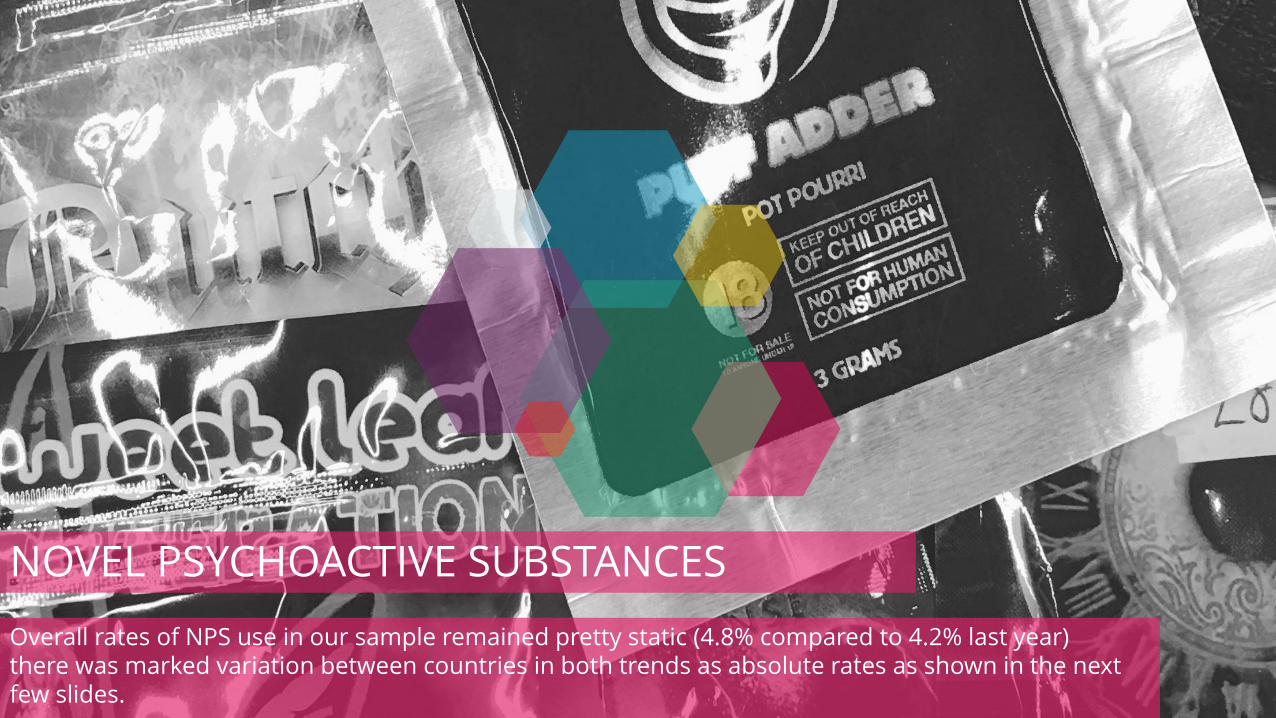
NOVEL PSYCHOACTIVE SUBSTANCES
Overall rates of NPS use in our sample remained pretty static (4.8% compared to 4.2% last year) there was marked variation between countries in both trends as absolute rates as shown in the next few slides.

4.8% of the global GDS2016 sample reported the purchase of NPS in the last 12 month(compared to 4.2% in GDS2015)(n = > 9000 for combined years)
31.4
49.7
30.2
10.1
37.5
52.1
29.5
7.4
Herbal Powder /
Crystal
Tablet / pills Liquids
What was the appearance /
form of the NPS purchased?
GDS2016 What was the appearance / form of
the NPS used
GDS2015 What was the appearance /
%
50.5
23.7
29.2
15.2
3
44.95
27.6
32
17.5
3
On-line Shop Friend Dealer Other
GDS2016 Where did you get them from?
GDS2015 Where did you get them from?
Global Drug Survey GDS2016 © Not to be reproduced without authors permission
GLOBAL – HAVE YOU PURCHASED ANY DRUG PROMOTED AS ‘LEGAL HIGHS’ OR ‘RESEARCH CHEMICALS’ OR ‘BATH SALTS’ IN THE LAST 12 MONTHS? (%)
Where did you source them from
As countries like the UK
attempt to ban these new
drugs with blanket ban
GDS2016 sheds light on what
drives the appeal of typically
less pleasant drugs and how
markets respond to changes
in regulation and existing
street drugs markets.
The first thing to note is that
while national legislation
might reduce access on the
high-street, globally and
indeed in most countries the
most common place where
people purchase NPS is on-
line.

NPS MOTIVATIONS FOR USE
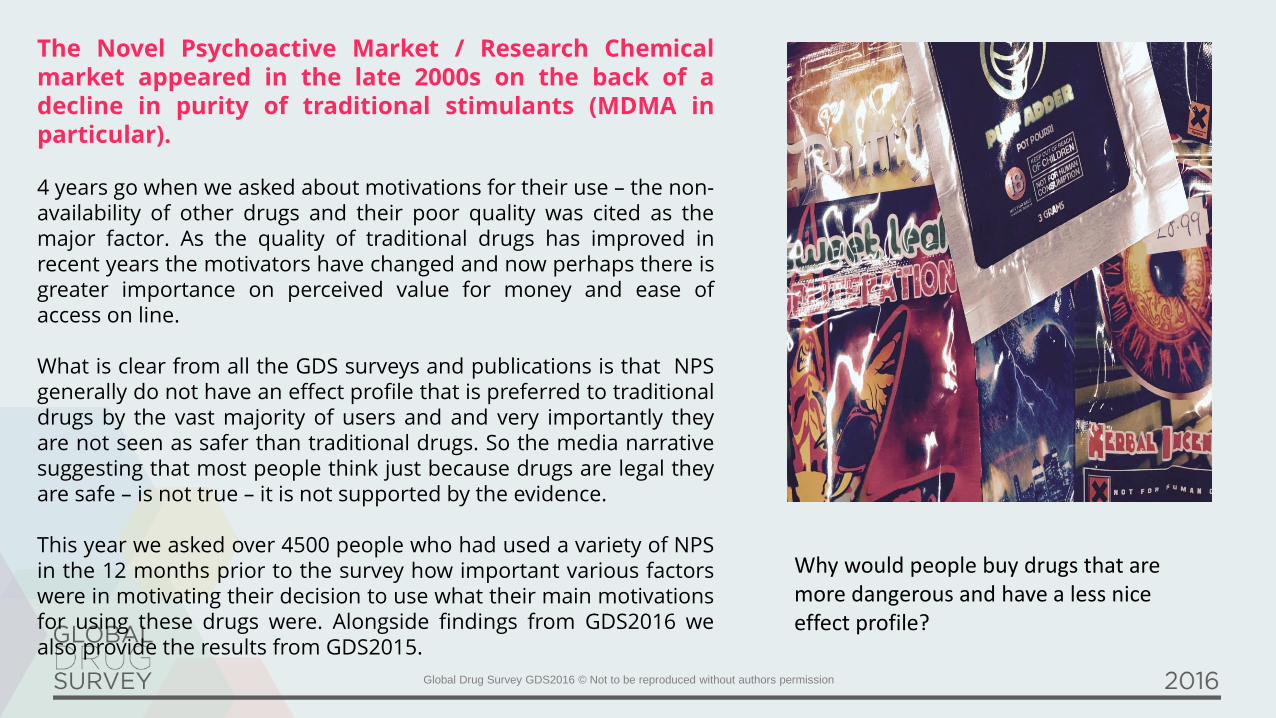
The Novel Psychoactive Market / Research Chemicalmarket appeared in the late 2000s on the back of adecline in purity of traditional stimulants (MDMA inparticular).
4 years go when we asked about motivations for their use – the non-availability of other drugs and their poor quality was cited as themajor factor. As the quality of traditional drugs has improved inrecent years the motivators have changed and now perhaps there isgreater importance on perceived value for money and ease ofaccess on line.
What is clear from all the GDS surveys and publications is that NPSgenerally do not have an effect profile that is preferred to traditionaldrugs by the vast majority of users and and very importantly theyare not seen as safer than traditional drugs. So the media narrativesuggesting that most people think just because drugs are legal theyare safe – is not true – it is not supported by the evidence.
This year we asked over 4500 people who had used a variety of NPSin the 12 months prior to the survey how important various factorswere in motivating their decision to use what their main motivationsfor using these drugs were. Alongside findings from GDS2016 wealso provide the results from GDS2015.
Global Drug Survey GDS2016 © Not to be reproduced without authors permission
Why would people buy drugs that are more dangerous and have a less nice effect profile?
DESERT ISLAND DRUGS

Global Drug Survey GDS2016 © Not to be reproduced without authors permission
This section focuses on answers of 79,040 study
participants who reported illegal drug use and who
answered at least one of the four “desert island drugs”
questions.
Recent discussions about the motivations for the use of new
psychoactive substances (NPS) and increasing NPS use in certain
countries who participated in previous Global Drug Surveys made us
carry out a thought experience. What would be the preference of
recreational drug users if all commonly used drugs were freely
available? Would they still be interested in the use of NPS or would they
be satisfied with the commonly used drugs? We designed a hypothetical
situation and asked the following questions:
Imagine you are shipwrecked on a desert island. Cannabis grows wild and
magic mushrooms (not poisonous ones) cover the island. By chance there is
also a plentiful supply of high purity MDMA and powder cocaine. Alcohol is
easily accessible too.
A genie comes along and says you can exchange any of these for any new
synthetic version of these drugs in the world.
The genie asks if they would exchange?
Cannabis for synthetic cannabis
Cocaine for a synthetic stimulant
MDMA for a another synthetic drug with similar effect
Magic mushrooms (excluding LSD) for a synthetic
hallucinogenics
Options: yes / no / unsure / don’t care /not interested in
this drug
Can any NPS compete with traditional illicit ?

DRUGS AND INTERNET, INCLUDING
DARKNET MARKETS

Global Drug Survey GDS2016 © Not to be reproduced without authors permission
Darknet markets or cryptomarkets have now been operating for 5 years (since the launch of Silk Road in February 2011). In the deep web, site owners, vendors and buyers are able to remain relatively anonymous as their IP addresses are masked. Purchases are made using the decentralised virtual currency Bitcoin, which can also be used relatively anonymously.
Our work on dark-net markets or crypto-markets is already some of the most cited in the world and working with leading researchers in the field like GDS's own Dr Monica Barratt we've continued to tell the story of the biggest challenge to drug laws and their enforcement in a century.
GDS2016 occurred 2 years after the demise of the original Silk Road and 1 year after Operation Onymous which brought down a number of cryptomarkets that had arisen as replacements. Exit scams, where market owners close the market unexpectedly and steal the funds, have become commonplace. Despite these disruptions, we have obtained a record sample of darknet drug buyers in GDS2016 (n=8058).
Drugs have also increasingly been bought through the internet more generally, including ‘normal’ websites and through social media, as reflected in our annual question about internet drug buying.GDS has once again conducted the biggest survey of dark-net involvement ever done and our findings suggest that like other areas of e-commerce it is here to stay. And our findings show that year on year more and more people are shopping on the dark-net. The following two graphs show how samples from most countries where we have the largest number of respondents reported greater rates of dark-net buying compared to previous years, with the highest rates in the UK, US and Ireland.
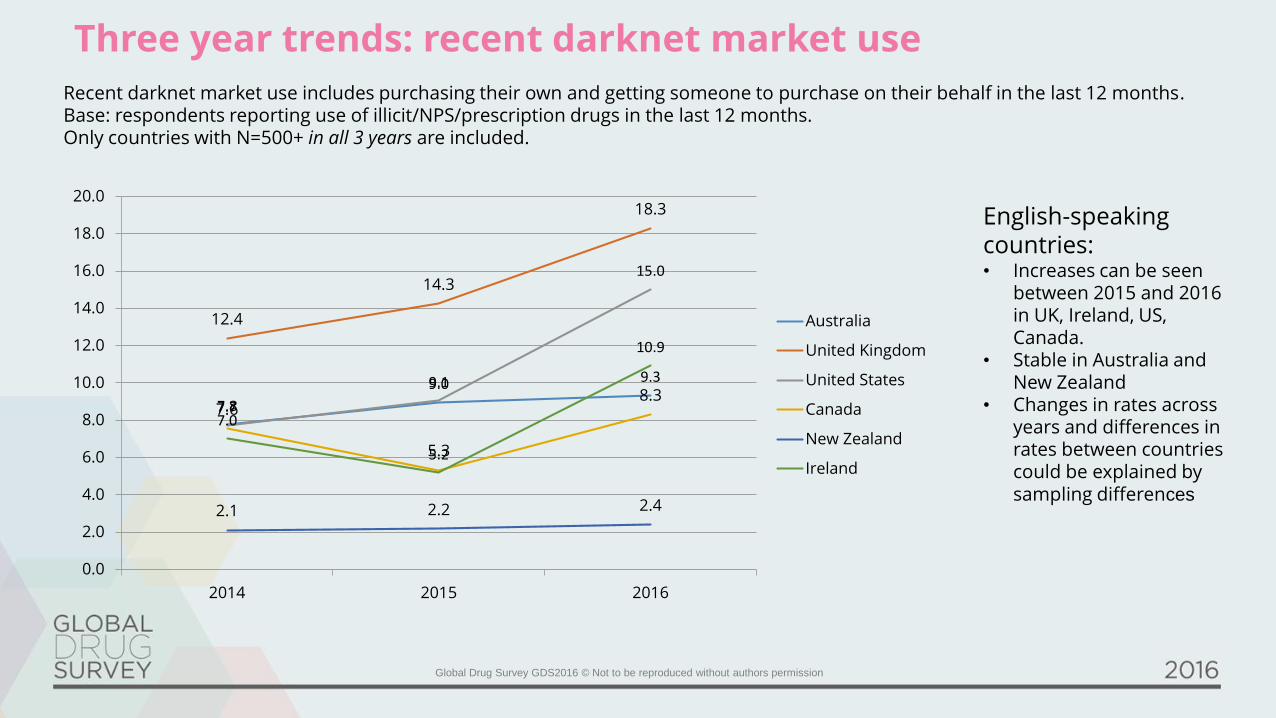
Three year trends: recent darknet market use
Recent darknet market use includes purchasing their own and getting someone to purchase on their behalf in the last 12 months. Base: respondents reporting use of illicit/NPS/prescription drugs in the last 12 months. Only countries with N=500+ in all 3 years are included.
7.8
9.0 9.3
12.4
14.3
18.3
7.7
9.1
15.0
7.6
5.3
8.3
2.1 2.2 2.4
7.0
5.2
10.9
0.0
2.0
4.0
6.0
8.0
10.0
12.0
14.0
16.0
18.0
20.0
2014 2015 2016
Australia
United Kingdom
United States
Canada
New Zealand
Ireland
English-speaking countries:• Increases can be seen
between 2015 and 2016 in UK, Ireland, US, Canada.
• Stable in Australia and New Zealand
• Changes in rates across years and differences in rates between countries could be explained by sampling differences
Global Drug Survey GDS2016 © Not to be reproduced without authors permission
COCAINE
Global Drug Survey GDS2016 © Not to be reproduced without authors permission
1.1
6
0.8
1
0.7
0.6
7
0.6
1
0.5
9
0.5
8
0.5
8
0.5
3
0.5
2
0.5
2
0.5
0.4
9
0.4
9
0.4
5
0.4
3
0.4
1
0.4
0.4
0.4
0.3
9
0.3
9
0.3
9
0.3
3
8.5
8.3
8
11
.39
10
.64 1
1.6
2
12
.33
9.9
7
10
.29
9.2
8 10
11
.23
9.3
7
11
.11
12
.95
11
.7
10
.51 11
.34
13
.4
10
.87
12
.74
11
.93
12
.28
12
.28
12
.19
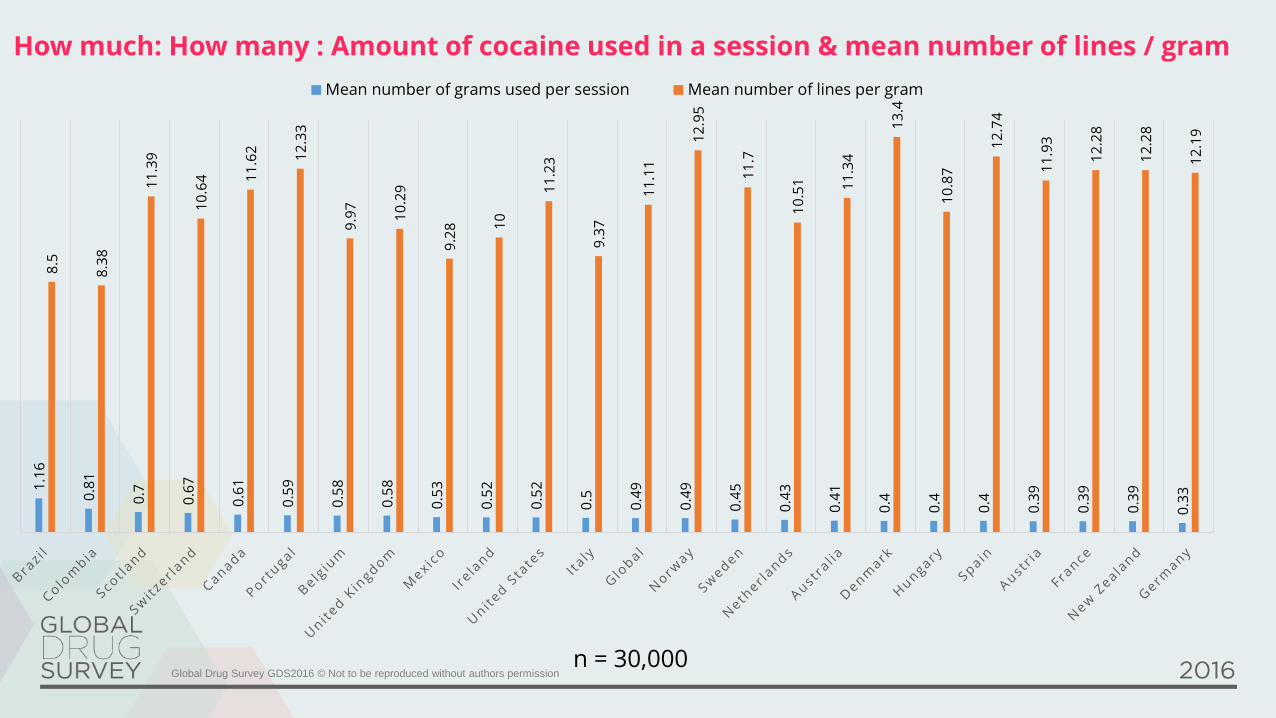
Mean number of grams used per session Mean number of lines per gram
How much: How many : Amount of cocaine used in a session & mean number of lines / gram
n = 30,000
VALUE FOR MONEY

Global Drug Survey GDS2016 © Not to be reproduced without authors permission
Cocaine – probably the worst value for money drug in the world
5
6.8
4
7 7
1
2
3
4
5
6
7
8
9
10
Global
Alcohol Cannabis Cocaine MDMA Pills MDMA Powder
mean value for money score based on global sample
Mean s
core
GDS2016 asked participants to rate drugs based on their value for money from 1-10 (1=poor value for money 10=excellent value for money).

MDMA

Global Drug Survey GDS2016 © Not to be reproduced without authors permission
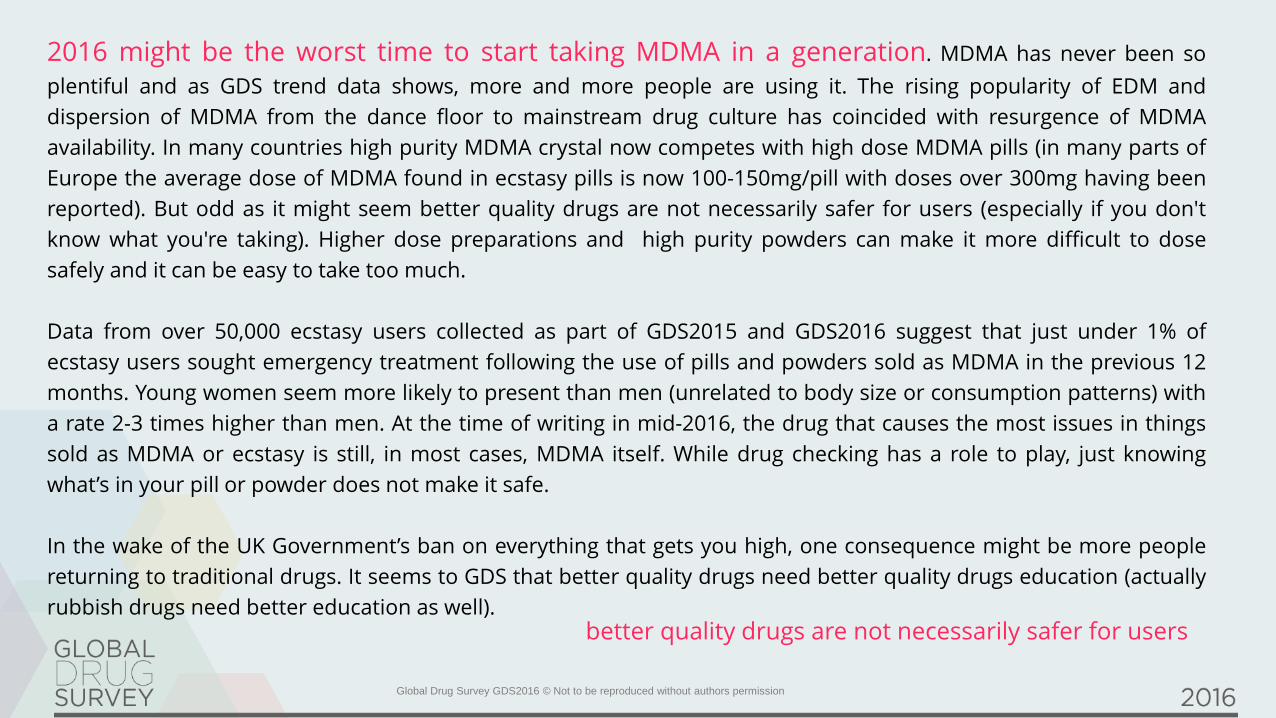
2016 might be the worst time to start taking MDMA in a generation. MDMA has never been so
plentiful and as GDS trend data shows, more and more people are using it. The rising popularity of EDM and
dispersion of MDMA from the dance floor to mainstream drug culture has coincided with resurgence of MDMA
availability. In many countries high purity MDMA crystal now competes with high dose MDMA pills (in many parts of
Europe the average dose of MDMA found in ecstasy pills is now 100-150mg/pill with doses over 300mg having been
reported). But odd as it might seem better quality drugs are not necessarily safer for users (especially if you don't
know what you're taking). Higher dose preparations and high purity powders can make it more difficult to dose
safely and it can be easy to take too much.
Data from over 50,000 ecstasy users collected as part of GDS2015 and GDS2016 suggest that just under 1% of
ecstasy users sought emergency treatment following the use of pills and powders sold as MDMA in the previous 12
months. Young women seem more likely to present than men (unrelated to body size or consumption patterns) with
a rate 2-3 times higher than men. At the time of writing in mid-2016, the drug that causes the most issues in things
sold as MDMA or ecstasy is still, in most cases, MDMA itself. While drug checking has a role to play, just knowing
what’s in your pill or powder does not make it safe.
In the wake of the UK Government’s ban on everything that gets you high, one consequence might be more people
returning to traditional drugs. It seems to GDS that better quality drugs need better quality drugs education (actually
rubbish drugs need better education as well).better quality drugs are not necessarily safer for users

Global Drug Survey GDS2016 © Not to be reproduced without authors permission
N =
1.5K
0.8
0.6
1.2
0
0.2
0.4
0.6
0.8
1
1.2
1.4
MDMA/Ecstacy
Global Male Female
%
GDS2016 % of last year users of each substance who sought Emergency Medical Treatment following the use of *MDMA
(n= 30,000) *not just clubbers
MDMA - SOUGHT EMERGENCY MEDICAL TREATMENT (EMT) IN LAST 12 MONTHS BY GENGER
% L
ast ye
ar
users
.

Global Drug Survey GDS2016 © Not to be reproduced without authors permission
If you found this report interesting and want to know what else we can offer please e-mail us at [email protected]
Please also take just 5 minutes to take part in the first ever GDS mini survey at www.globaldrugsurvey.com/GDS2016.5 where will explore drug-vaping, drug checking, what to do if you mate passes our and the use of psychedelics.
GDS2017 launches in November 2016 if you would like to take part or help promote it in your country please contact us.
Until then have a safe happy summer
Dr Adam R Winstock On behalf on the Global Drug Survey team [email protected]