Embed Size (px)
Citation preview

“WHAT WORKS IN WORKFORCE DEVELOPMENT”
AN ASTD/AJLMEP STUDY OF JOINT LABOR-MANAGEMENT EDUCATIONAL PROGRAMS
Written by Mark E. Van Buren, Ph.D.

“What Works in Workforce Development” An ASTD / AJLMEP Study of Joint Labor-Management Educational Programs
2
“WHAT WORKS IN WORKFORCE DEVELOPMENT:” AN ASTD/AJLMEP STUDY OF
JOINT LABOR-MANAGEMENT EDUCATIONAL PROGRAMS
Introduction In the Spring of 2001, the U.S. Department of Labor commissioned the Association of Joint Labor-Management Educational Programs (AJLMEP) to conduct a study of the impact of the programs on workers, unions, and employers. The purpose of this study was to produce information and resources that will help public and private partnerships build on the strengths and accomplishments of existing programs, identify program design elements that are working, and replicate successful models that have demonstrated a proven track record of results. AJLMEP along with its research partners, the Conference Board of Canada and the American Society for Training & Development (ASTD), embarked on a 16 month, multi-faceted study examining the investment strategies, the effective design elements of workplace training and education delivery systems, learning and workplace outcomes, and the resulting economic, organizational, and individual benefits to employers, unions, and employees in a cross-section of industries. The Conference Board research consisted of detailed, in depth interviews with nine training cohorts from joint labor-management educational programs in the health care, information technology / telecommunications, and hospitality sectors. ASTD’s portion of the study consisted of a comprehensive survey conducted of over twenty joint labor-management educational programs representing a cross-section of industries. Both the Conference Board and the ASTD supplemented their respective research with a review of the research and literature in the field of workforce development pertaining to the impact of joint labor-management programs. This report summarizes the evidence gathered by ASTD from its review of existing literature on the impacts of joint programs. Moreover, it presents the results of its survey, which yielded the most thorough statistical description currently available of joint education programs. Review of Existing Literature THE RISE OF JOINT EDUCATION PROGRAMS During the 1980s, the nature of American industry and work were undergoing fundamental change. The need for increasing the training and education of incumbent and dislocated workers was addressed by a number of unions and employers who created joint labor-management educational programs through their collective bargaining agreements or other cooperative arrangements. The UAW-Ford Education, Development, and Training Programs, (EDTP) negotiated in 1982, was among the first such efforts, and it pioneered many of the features that are now appearing in other collective-bargaining agreements. In their evaluation of UAW-Ford’s early joint training efforts, Tom Pasco and Dickinson pointed out in Joint Training Programs: “A Union-Management Approach to Preparing Workers for the Future” (1991) that EDTP was “hailed as a

“What Works in Workforce Development” An ASTD / AJLMEP Study of Joint Labor-Management Educational Programs
3
prototype of the kind of cooperatively-run institutions desperately needed in America.” This program offers both active and laid-off workers opportunities to upgrade their skills and pursue general education resulting in improved product quality, improved labor-management relations, improved quality of work life, and contributed significantly to Ford’s competitive resurgence. A key to the success of UAW-Ford EDTP was its focus on meeting the career development and learning needs of participants and in the process promoting and creating a culture of lifelong learning. Over the past two decades, joint labor-management programs have become significant providers of both general and work skills-related education and training to workers in a variety of industries, among them: steel; auto; aerospace and transportation; health care; public and private service industries; public service; telecommunications, construction, and other industries. Hundreds of thousands of workers have voluntarily participated in these programs engaging in a range of educational and training activities that have resulted in valuable outcomes for individuals, employers, and unions. A recent survey of 377 employers by the Western Region of Cornell University School of Industrial and Labor Relations provides a glimpse into the preponderance of joint education programs. The report, Champions@Work: Employment, Workplace Practices and Labor-Management Relations in Western New York, found that the most common types of joint labor-management committees were joint safety committees, located in about 80 percent of workplaces surveyed. Joint training committees were reported in about 50 percent of the workplaces. These joint programs represent but just a microcosm of the programs nationwide that offer education and training activities. THE IMPACT OF INVESTMENTS IN EDUCATION AND TRAINING In order to make informed decisions regarding investments in workplace education and training, employers, unions, and employees need reliable information about the benefits and impact of training on key stakeholders – employers, workers, and unions. However, the benefits of investing in workplace education and training are not well understood. The question of how much to invest in workplace education and training has long confounded businesses and unions alike. The fact that few organizations or analysts can answer this question almost surely leads to under-investment in education and training. Employers aren't certain whether additional training investments improve profitability, employees don’t believe that more training will serve their specific needs, and unions are not certain whether training investments improve the job security and welfare of their members. Over the years, business leaders, human resource professionals and researchers have employed a variety of models, methods, and approaches in determining the value and benefits of education and training efforts. While “returns” from investments in training are difficult to calculate, recent breakthrough studies provide compelling evidence that a multitude of benefits result from workplace education and training programs.
As the growing literature on intellectual capital has demonstrated, companies that possess the tools and systems for understanding the “value-added” of worker’s knowledge and skills have recognized the importance of “managing their knowledge assets”. Informed by an understanding of how the skills and knowledge of their workers create value, companies that employ these approaches have vital information upon which to base their decisions, including decisions regarding the amount of their investment in training and education and in technology. The ASTD report, Harnessing the Power of Intellectual Capital (1997) indicates, “Knowledge

“What Works in Workforce Development” An ASTD / AJLMEP Study of Joint Labor-Management Educational Programs
4
management and the intellectual capital it creates are the primary sources of competitive advantage in a growing number of industries. Success increasingly depends on how well companies create, capture, and leverage the skills and knowledge of their employees.”
ASTD’s report, Profiting from Learning: Do Firms Investments in Training and Education Payoff? (2000) offers convincing evidence that companies that invest more heavily in training are more successful and profitable. Based on analyses if unique data on training investments in over 575 publicly-traded firms, the study revealed that firms investing in training experienced better subsequent earnings, return on equity (ROE), and stock performance. The report concludes “that there is evidence that training creates value for organizations.” EXISTING EVIDENCE OF JOINT PROGRAM IMPACTS While these publications demonstrate the powerful benefits that employers can reap from workplace education and training, they do not provide specific evidence on the impacts of joint labor-management education programs. As a result, they are silent on the benefits experienced by other stakeholders in these programs, such as employees and unions. The review of the literature conducted for this study uncovered few solid research studies that examine the impacts of joint programs. While the exceptions provide valuable evidence, the sheer lack of a significant body of relevant literature points to the need for the need for further research. One of the more recent exceptions, a recent Conference Board research report, Turning Skills into Profit: Economic Benefits of Workplace Education Programs, (1999) reviewed a number of U.S. workplace education programs, many of which were joint labor-management efforts. The report found that that 98 percent of surveyed employers reported increases in both employee skills and economic benefits from workplace education programs. Another important outcome cited in the report was improved labor-management relations and higher employee morale as a result of unions and management working together on common workforce development goals. Among the other improvements observed were an improved quality of work, better team performance, improved capacity to deal with workplace change, improved capacity to use new technology, increased productivity, reduced time per task, error rates, and waste, better health and safety, and improved retention of both employees and customers. Broad surveys of joint education programs are very rare. More frequently published are evaluations or case studies of the impacts of specific programs. One example is a 1994 research study of participants in a joint labor-management educational program in the telecommunications industry, Training Partnerships Inc. – CWA/US West – Pathways, Skills for the Workforce of the Future: The Impact of Education and Training on Adult Workers. The author of the study, Mary Margaret Avertt, concluded that, “well-designed and administered training and education programs for adult workers can help meet the difficult problems that workplace changes have foisted upon employees and employers alike.” Avertt also observed that, “particularly important was the perception that the PATHWAYS program’s wide range of educational choices as well as the individualized design and structure of the programs played an important part in favorable outcomes.” A study by Beverly Takahashi and Edwin Melendez, from the Community Development Research Center in New York, reviewed three workforce development initiatives involving unions. The report, Union-Sponsored Workforce Development Initiatives, concluded that “successful union-led workforce development initiatives structured win-win outcomes that benefited both employers and union members.” Among the employee outcomes found by their research were increased job security and improved career ladders. Employers benefited from

“What Works in Workforce Development” An ASTD / AJLMEP Study of Joint Labor-Management Educational Programs
5
improved labor relations, increased efficiency and productivity, and a better equipped workforce. Finally, the programs increased the level of trust between management and workers, reducing grievances and improving teamwork. Another, more specific example of the benefits of joint education programs comes from the U.S. Department of Labor report, Working Together for Public Service (1996). The report describes the case of a joint training program developed by the City of Madison, Wisconsin and AFSCME Local 60 for electricians. The training improved relations between city inspectors and private electrical contractors and reduced by 25 percent the number of inspections needed. While the training cost no more than $4,000, the reduced need for inspections saved about $30,000 annually. Our literature review also uncovered a number of evaluations conducted by the programs themselves. For example, one union evaluated the literacy training it was providing for at risk health care workers in five separate programs. Among the outcomes observed were improved performance by participants in their current jobs, increased self-confidence, improved literacy skills, and a greater desire for more training. The study found that the team teaching model, where multiple instructors share the classroom, was the most promising method they examined. The programs which participated in the Conference Board of Canada’s portion of the current project have conducted numerous internal evaluations of their programs, many of which were carried out by external evaluators to insure their integrity. The Alliance for Employee Growth and Development, for example, has documented the benefits of its program over the years through various studies. One of its studies, conducted in 1999 of computer training for customer care employees, found the following benefits:
Participants felt their skills improved the level of customer service they provided Participants reported significant time savings, estimated at 10,000 hours per year Participants reported fewer requests for help from in-house computer experts, saving
another 600 hours per year Participants reported higher levels of job satisfaction Participants had an increased desire for more training
Another study by the Alliance consisted of a survey of representative sample of employees from one of the largest employers in the program. The study illustrated that the benefits of the training depended upon the motivations of the employees taking the training. Three-quarters of those who took the training to keep up with the requirements for their current job said that they had received skills that could be applied to their job. A similar percentage of those employees reported greater confidence in adapting to changes in their work environment. Of the employees who took training because of beginning a new job, 72 percent felt better prepared to start. And, across all employees, the program found a greater interest in longer-term education. A third study by the Alliance in 2000 examined training received by customer service employees in the use of new web-enabled e-commerce and knowledge management systems. The study was unique in that it evaluated the training from the standpoints of both the employee and the employee’s “coach.” A substantial share of the participants in the e-commerce training reported enhanced employment security (48%) and increased job satisfaction (46%). Participants and their coaches tended to agree that the employees were more responsive to customer inquiries and could provide more current information.

“What Works in Workforce Development” An ASTD / AJLMEP Study of Joint Labor-Management Educational Programs
6
Meanwhile, both types of training improved productivity significantly. The knowledge management training resulted in time savings of over 7,500 hours in its first year and the e-commerce training yielded an estimated time savings of over 9,300 hour. These time savings resulted in tremendous financial benefits to the employer. For each hour of time invested in the training, 7 hours of job-related efficiencies were generated. The total resulting dollar savings came to more than $500,000. These are just a sample of the kinds of impacts that joint programs of all types are having. There are likely many more which we were unable to uncover. Indeed, 65 percent of the programs participating in the ASTD survey in the next section of this report have conducted internal evaluations of their training activities. The portion of this project under the direction of the Conference Board of Canada will elaborate further upon the impacts of the specific programs participating in this research. Survey of Joint Programs METHOD In the fall of 2001, ASTD conducted a mail survey of a sample of joint labor management education programs in the United States. The questionnaire was constructed jointly by ASTD and the Association. It contained 46 questions on the history, nature, extent, and impact of joint programs. Wherever possible, the questions were comparable to those fielded in the ASTD Measurement Kit, the questionnaire used in ASTD’s annual survey of employer-provided training. For these questions, we are able to provide a point of comparison to the data that ASTD collects from hundreds of employers each year. The questionnaire consisted of seven major sections:
A. Background information on the program B. Program education and training expenditures C. Nature and extent of employee participation D. Services offered by the program E. Use of learning technology F. Use of outside training services and evaluation methods G. Impact of training
With the assistance of the AJLMEP, a sample was drawn from the Association’s member programs. Approximately 30 programs were invited to participate in the survey. The survey was sent via email to a key contact at each program who was identified by the Association. Each program was sent at least two follow-up reminders by email, and the Association called each program that had not responded. By the close of the survey period at the end of January 2002, 21 programs submitted complete and valid data to ASTD for inclusion in the study. All data were reviewed by ASTD for errors, invalid responses, and out-of-range responses. ASTD discussed each instance with the relevant program and made the necessary corrections. The data were entered into a database and analyzed with the SPSS statistical package. RESULTS

“What Works in Workforce Development” An ASTD / AJLMEP Study of Joint Labor-Management Educational Programs
7
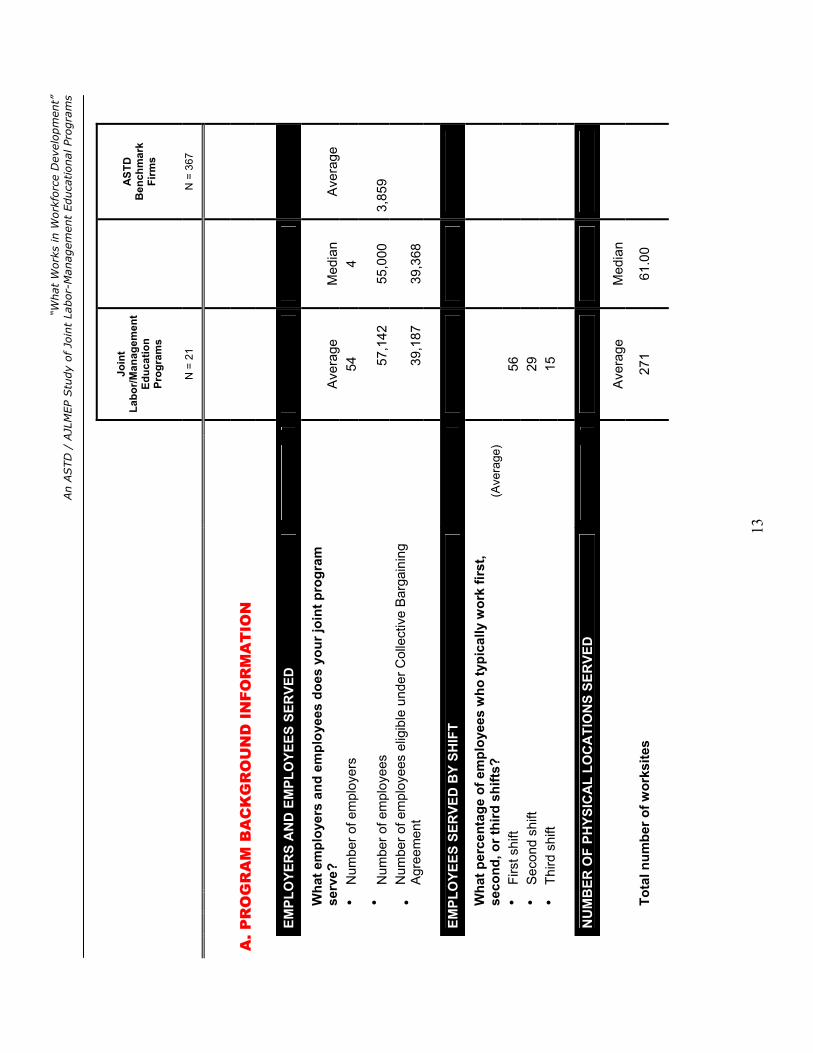
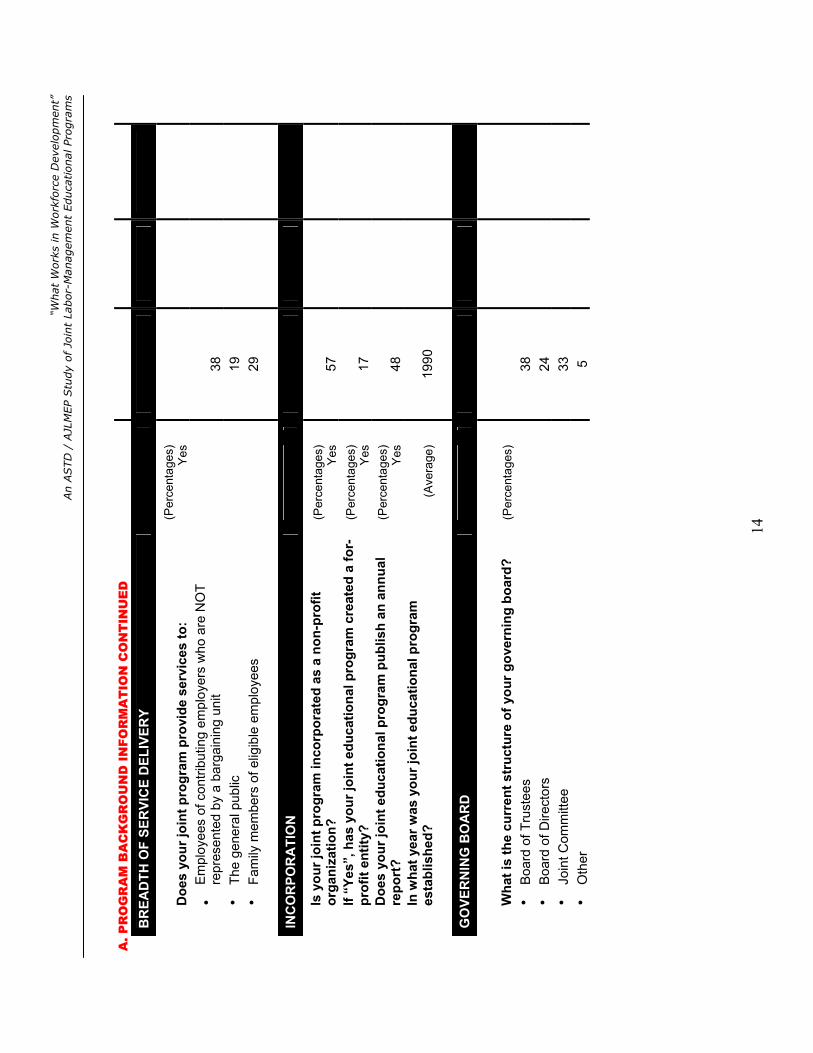
The full set of results from the survey can be found in the accompanying “AJLMEP/ASTD Survey Statistical Report.” In this report, we review the main findings of the survey. The Mission of Joint Programs We begin with an overview of the purposes that joint programs are intended to serve as stated in their mission statements. Of the programs surveyed, 16 submitted copies of their formal mission statements. They varied greatly in length, from as few as 15 words to as many as 215. Not surprisingly, all but three of the mission statements explicitly mentioned their primary objective as providing training, education, or learning. In some cases, the programs also indicated that their charge included retraining (3) or development (4). About half of the programs also provided other career-related services, such as career counseling and curriculum design services. A closer look at the mission statements revealed a stronger bias toward meeting the objectives of workers over those of unions or employers. Only two programs explicitly mentioned union outcomes, and seven programs cited outcomes they sought for employers. Most mission statements, however, noted employee outcomes of their programs (beyond training and education). The most common employee outcomes were personal growth, career growth, and advancement/promotion opportunities. A few programs also specifically sought to provide employees with employability or job security. Breadth and Depth of Programs The survey revealed, for the first time, the true comprehensiveness, reach, and depth of joint programs. The median joint program serves about 4 employers. However, some serve several hundred or more employers. The employers, themselves can be quite large; the typical joint program serves employees in over 60 work sites, but some serve several hundred to over one thousand work sites. On average, these programs serve employers in just one or two industries. About one third of the employers are in telecommunication services, and about one-quarter in health care. Other industries included aerospace, trade, services (hotels), governmental administration, IT services, and durable manufacturing (steel). Collectively, these employers have a workforce of 857,134 employees. The vast majority of these employees (783,737) works under collective bargaining agreements and is eligible for training provided by the joint programs. On average, each program serves 39,187 eligible employees. A sizeable majority of the employees work on the first shift (56%) and another 3 out of 10 work the second shift. The reach of joint programs, however, sometimes goes far beyond the employees under a union’s collective bargaining agreement. Over a third of programs also provide training to other employees who fall outside the agreements. One in three programs provides training to families of eligible employees, and one in five programs even makes some of its services available to the general public. The costs for these training activities are covered by the employer or public funding sources, rather than through joint program funds.

“What Works in Workforce Development” An ASTD / AJLMEP Study of Joint Labor-Management Educational Programs
8
Education and Training Expenditures Another way of sizing up joint education programs is to look at their financials. Funded by a variety of sources, collectively these programs had revenues totaling more than $172 million in 2000, with about $156 million of that coming from employer contributions. The typical program had income of $9.1 million. The largest share of the revenue came from employer contributions (84%), followed by federal, state, and local government grants. The programs reporting total training expenditures spent an average of over $4.8 million for the 2000 fiscal year, for a combined total across all programs of $82 million.1 On an individual employee basis, the programs spent about $128 per eligible employee on training. When averaged across the actual number of training participants, the cost per trainee served comes to $704. This figure is even more impressive when added to the $700 spent per employee by the typical employer in ASTD’s Benchmarking ServiceTM.2 Taken together, each participant in joint program training may have received more than $1,400 of training. The manner in which joint programs allocated their funds, however, differs from the way employers spend their money. A little over 26 percent of training expenditures were spent on wages/salaries of training staff, which is about half of what employers devote to staff wages and salaries (51%). This finding may be a reflection of the fact that 50 percent of the programs relied on the training staff of their employers to provide training. On the other hand, joint programs spent 44 percent of their dollars on tuition reimbursements, while employers spent only 11 percent on these payments. Joint program training also differs from employer-provided training in the subject matter of the training they fund. The content area most heavily funded by the joint programs surveyed was training in professional skills (26% of total training expenditures).3 In 2000, the typical employer spent a mere fraction (8%) on professional skills training. Basic skills training received the second largest share of dollars (15%). This is an encouraging sign given the skill shortage faced by employers and the fact that employers only spent about 2% of their money on providing basic skills training to their employees. Instead, employers devote a much larger share of training dollars to training in IT skills and technical skills (26 percent combined), and to new employee orientation training (8%). Participation in Joint Program Training A third measure of the size of joint programs is the amount of training they provide. As a whole the programs reported delivering in excess of 5.5 million hours of training in 2000. Due to the fact that less than 3 out of every 10 employees eligible for the training took advantage of it, the 1 The marked difference between the levels of revenues and expenditures is the result of several factors. First, several programs reported total revenues, but were unable to provide spending totals. Second, a number of programs excluded certain administrative and curriculum development costs from the expenditure figures they reported. Finally, in a few cases, programs operated with a surplus which they carried over into the following year. If these factors are taken into account, the levels of revenues and expenditures correspond exactly to one another. 2 The ASTD Benchmarking ServiceTM is a free service offered to any organization in the world interested in benchmarking it’s training expenditures, practices, and outcomes against those of other organizations. Each year anywhere from 600 to 1,200 organizations participate in this annual survey. 3 Professional skills training refers to training and educational activities in a specialized body of knowledge or expertise such as accounting, engineering, manufacturing systems, optics, electronics, mechanics, materials science, chemistry, physics, legal, medical, financial services, banking, and consulting. It is discipline and/or industry specific.

“What Works in Workforce Development” An ASTD / AJLMEP Study of Joint Labor-Management Educational Programs
9
typical participant received 69 hours of training in 2000 from joint programs. This represents a impressive amount of training, given that the typical employer reported giving each employee about 24 hours of training that same year.4 Moreover, when combined across the programs we surveyed, eligible employees received about 5.5 million hours of training in 2000, an average of 456,000 hours per program per year. However, since about half of the programs were unable to estimate the total number of training hours provided by their programs, the true volume of training may have been twice this amount. The training usually took place at one of three places. Approximately 35 percent of training occurred at the workplace, and an equivalent amount took place at an educational institution. Another quarter of the training was delivered in the joint program’s training center. Participation in Joint Program Operations and Management One of the hallmarks of joint labor-management committees is their mandated 50/50 committee structure. The survey revealed that joint labor/management committees were highly involved in various aspects of the programs. In nearly all programs, joint committees help implement the training activities (94%). In the majority of programs, joint committees also participate in designing the training (81%), evaluating the training (75%), and evaluating the instructors (69%). Even the selection of instructors is a role played by joint committees in over half of the programs (56%). Another reflection of the “jointness” of these programs is the sharing of decision-making. Our survey queried the programs on the participation of employees, union representatives, and employer representatives in 11 types of decisions. We found nearly identical levels of involvement by union and employer representatives in these decisions (7.3 and 7.4 on an 11-point scale, respectively). There only discernable difference was a higher level of union involvement in decisions concerning the marketing and promotion of the program. By comparison, employees had relatively lower levels of participation in decision making (3.9 on the same scale). This comes as no surprise considering the high level of union involvement which presumably brought the rank and file employees’ voice to these decisions. When involved, employees were more likely to participate in decisions about what training was needed and about marketing the training. It was especially rare for employees to be involved in decisions regarding the program’s budget. Joint Program Services Our survey of joint programs revealed that most programs offer a wide assortment of services beyond training. Some of these services act to support employees training and education needs. The most common training support services included: tuition assistance (84%), computers for onsite training (80%), access to continuing education after training (78%), training resource centers (68%), and special learning needs resources, such as large print books (61%). When offered, the use of these services is relatively light by eligible employees: on average, no more than 45 percent of employees used any given service.
4 Hours measured were measured in terms of instructional time. Hours for degree or credit courses at higher education institutions were calculated at 10 instructional hours for each credit hour.

“What Works in Workforce Development” An ASTD / AJLMEP Study of Joint Labor-Management Educational Programs
10
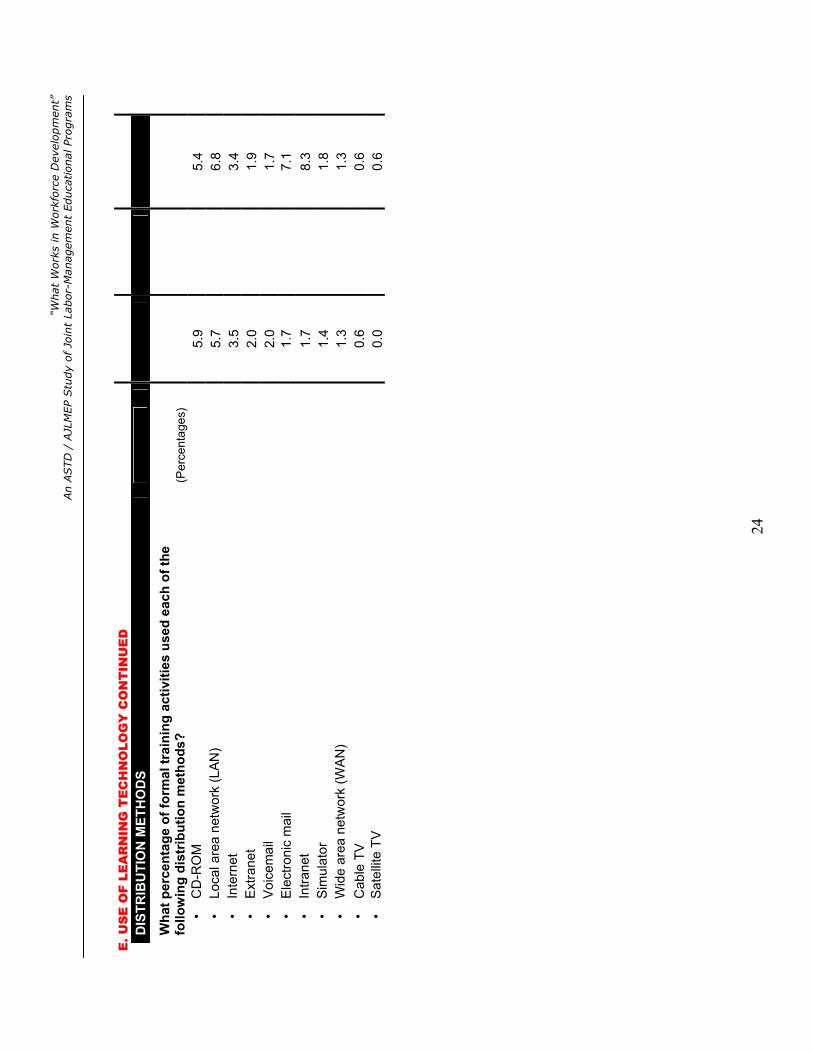
These programs also offer a broad array of career and job placement related services. The most frequently offered career-related services included: career planning and counseling (80%), information about training providers (70%), information about skills necessary for promotion (65%), and access to information on career opportunities and job promotions (65%). Job placement services for workers seeking new or redesigned jobs was the least common service (35%). Use of these services by employees, when available, was somewhat heavier than training-related services. Half or more employees used programs to get information about skill requirements for promotions and about other training providers. It came as no surprise during this period of socio-economic upheaval that joint programs have had to adapt and evolve as the environment around them changed. The results of our study suggest that most programs are trying to be responsive to these changes. A large majority of programs reported revising the content of their training activities in the last five years. The top drivers of changes in content included: changing skill requirements, changes in work processes, and the introduction of new technologies. To a somewhat lesser, but still large, extent, joint programs have also had to adjust the range of training and education activities they conduct, especially as a result of more computer-mediated training. Delivery of Joint Program Training As the times have changed, so too have the technologies available to joint programs to support and deliver training and education. The survey found that, while the majority of their training activities were delivered with traditional classroom methods (84%), 7 percent of training was delivered via e-learning and other distance-learning technologies. Another 7 percent of training employed other methods, such on-the-job training and experiential learning, to deliver training. These delivery numbers are relatively similar to the ASTD benchmarks for employer-provided training. About 80 percent of this training occurred in the classroom, while 9 percent was delivered via some form of technology. Joint programs employ a variety of technologies to deliver their training, from CD-ROMs to email to cable TV. On average, none of these delivery methods is used for more than 6 percent of training activities. CD-ROMs, local area networks, and the Internet were the most commonly used methods for distributing e-learning. The most common method of presenting the e-learning was in the form of computer-based text (CBT), used for about 14 percent of courses. As we reported earlier, joint education programs spent substantially larger percentages on training and education provided by external organizations and individuals in 2000. In addition to 44 percent which went toward tuition assistance, about 27 percent of spending went to pay outside training vendors. Joint programs use a variety of outside vendors to deliver training. Independent training consultants/contractors, community colleges, and technical/vocational institutions were used by 85 to 90 percent of the programs. Somewhat unexpectedly, we found that only 70 percent of programs reported using internal joint program staff to deliver training. When compared to ASTD employer-provided training benchmarks, joint programs used almost all types of outside training providers more than employers. The only exceptions were private training and consulting firms and product suppliers, both of which were used by employers much more frequently. Selecting high quality, dependable outside providers is often a difficult task. It can be a challenge to get behind the marketing material used by providers to promote themselves. In our survey, joint programs shared with us that they use several vender selection criteria much more

“What Works in Workforce Development” An ASTD / AJLMEP Study of Joint Labor-Management Educational Programs
11
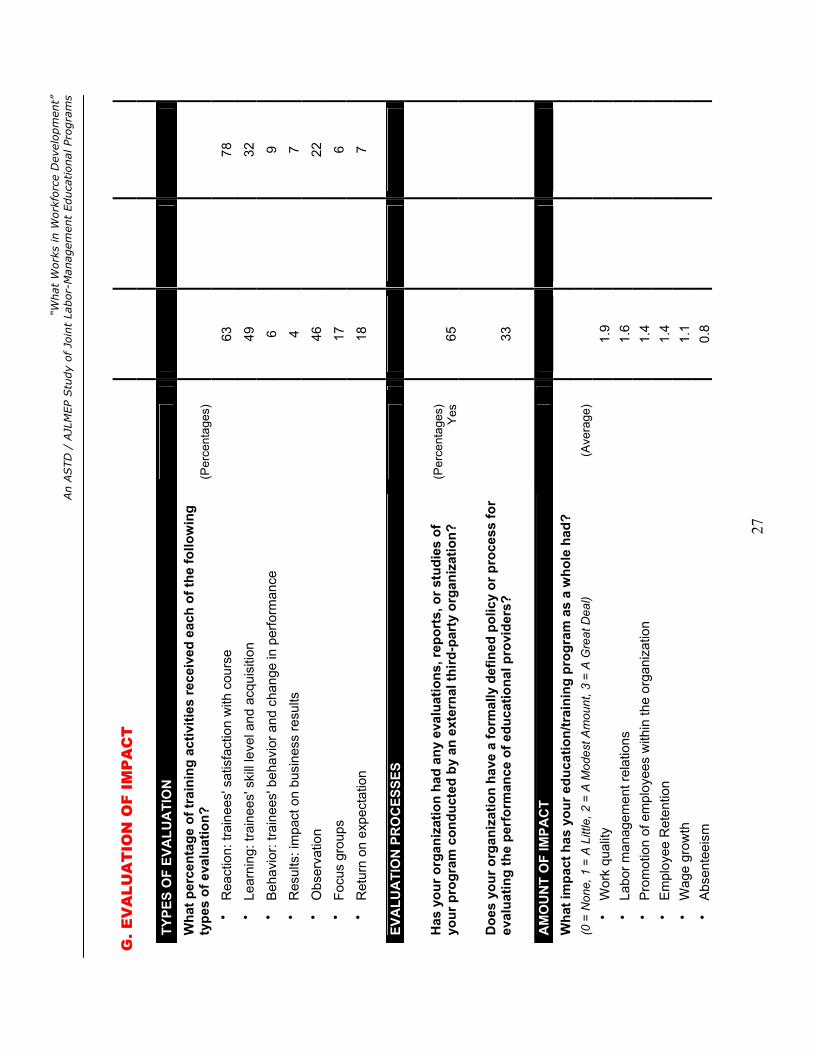
frequently than others. Far and away, the most important criterion was the quality of the provider’s content (53%). Next in importance were the qualifications of the firm and its staff (35%) and the match between the provider’s skill sets and the specific project requirements (29%). Surprisingly, none of the programs listed the ability to address security concerns as a key criterion. ASTD benchmarks on vendor selection criteria suggest that employers share two of the top three criteria used by joint programs: the qualifications of the firm and its staff (#3) and the match between the provider’s skill sets and the specific project requirements (#1). Evaluating the Impact of Joint Programs As mentioned earlier, a key challenge faced by joint programs is demonstrating the value they provide to various stakeholders, including employees, the union, and employers. The survey not only examined the methods of impact assessment and evaluation used by the joint programs, but also gathered some subjective data on the actual impact the programs have had in a number of areas. As with employer-provided training, the most common form of assessment conducted by joint programs was measuring trainee satisfaction with their courses. However, the average program collected this information on only 63 percent of its courses in 2000, compared with 78 percent of employer-provided courses. More encouraging was the finding that the impact of the training on trainee skills and knowledge was gathered in 49 percent of joint program courses on average, while employers gathered this information on only 32 percent of courses. Joint programs were also more likely than employers to use less formal methods of evaluation, such as focus groups, observation, and assessing whether expectations were met. We also found that many programs (65%) were concerned enough about their impact that they had hired third party organizations to conduct studies of their training and other services. A smaller number (33%) had also established a formal process for evaluating educational providers. We believe that joint programs were relatively pleased by what they have found from their evaluations. The joint programs surveyed universally reported that their activities had positive impacts. All programs reported positive impacts of the training on work quality, and four out of five programs indicated their impact on labor-management relations and employee advancement had been positive. The actual amount of the impact however varied according to the outcome being assessed. On average, the greatest positive impacts occurred in the quality of work and in labor-management relations. The programs’ impacts on wage growth and absenteeism, while still positive, were somewhat weaker. Conclusions Through joint labor-management programs, unions and their partner employers can be a powerful source of training and education for employees of all types. Indeed, ASTD’s 2002 State of the Industry Report suggests that as many as 30 percent of employers nationwide use unions, trade associations, or professional associations to provide training to their employees.

“What Works in Workforce Development” An ASTD / AJLMEP Study of Joint Labor-Management Educational Programs
12
The results of ASTD’s survey reveal the tremendous potential of joint programs to reach millions of employees in hundreds of thousands of employers each year. However, this potential will only be fully realized to the extent that joint labor-management education programs can successfully meet the needs of employees, unions, and employers. The evidence from research prior to this study hinted at the amount of success joint programs have achieved, but was not definitive. This study, particularly the ASTD survey, is the first systematic attempt to gather all the necessary information on the full range of joint education programs to make conclusive statements about their ability to realize their potential. We found that most programs are multi-faceted and complex, yet well designed. The design elements of the programs and the nature of the training and other services they provided compare well with those provided solely by employers. In fact, employees in workplaces where their employers and joint labor-management programs invest heavily in their training and education are likely to find a wealth of skill development and learning opportunities. Of greater significance to the survival and growth of joint education programs were the overwhelmingly positive impacts the programs have had thus far. We found that the majority of joint programs have resulted in improvements in work quality, labor-management relations, advancement opportunities, and employee retention. The picture our study draws is one of “wins” all around: for unions, workers, and employers. With the information gathered by this survey and the research of the Conference Board of Canada, under the direction of the AJLMEP, employers and unions have further evidence to demonstrate the returns to the workplace education and training provided by joint programs. Moreover, in illustrating the full breadth and depth of these programs statistically, other programs can now benchmark themselves and better position themselves for success. Many questions however, remain unanswered. Chief among them is the question of what makes for a successful joint training program. The data in this study reveal that certain programs stand out from the rest. What is it about them that sets them apart? Are there particular elements that any well-designed program should have? Answers to these questions will help employers and unions identify the success factors or levers they need to begin or improve their own programs. Alas, these types of questions can only be answered by gathering additional data on larger numbers of joint training programs. In the future, the AJLMEP and ASTD hope to extend this research beyond the participants in the present survey and provide even more definitive and practical information to guide the growth and management of joint labor-management educational programs.
“What
Work
s in
Work
forc
e D
evel
opm
ent”
An A
STD
/ A
JLM
EP
Stu
dy
of
Join
t La
bor
-Manag
emen
t Educa
tional
Pro
gra
ms
13
Join
t La
bor/M
anag
emen
t Ed
ucat
ion
Prog
ram
s
A
STD
B
ench
mar
k Fi
rms
N =
21
N
= 3
67
A. P
RO
GR
AM
BA
CK
GR
OU
ND
IN
FOR
MA
TIO
N
EM
PLO
YER
S A
ND
EM
PLO
YEES
SER
VED
Wha
t em
ploy
ers
and
empl
oyee
s do
es y
our j
oint
pro
gram
se
rve?
A
vera
ge
Med
ian
Ave
rage
•
Num
ber o
f em
ploy
ers
54
4
• N
umbe
r of e
mpl
oyee
s
57,
142
55
,000
3,85
9
• N
umbe
r of e
mpl
oyee
s el
igib
le u
nder
Col
lect
ive
Bar
gain
ing
Agr
eem
ent
3
9,18
7
39,3
68
EM
PLO
YEES
SER
VED
BY
SHIF
T
Wha
t per
cent
age
of e
mpl
oyee
s w
ho ty
pica
lly w
ork
first
, se
cond
, or t
hird
shi
fts?
(Ave
rage
)
•
Firs
t shi
ft
56
•
Seco
nd s
hift
29
• Th
ird s
hift
15
NU
MB
ER O
F PH
YSIC
AL
LOC
ATI
ON
S SE
RVE
D
Ave
rage
M
edia
n
Tota
l num
ber o
f wor
ksite
s
27
1 61
.00
“What
Work
s in
Work
forc
e D
evel
opm
ent”
An A
STD
/ A
JLM
EP
Stu
dy
of
Join
t La
bor
-Manag
emen
t Educa
tional
Pro
gra
ms
14
A. P
RO
GR
AM
BA
CK
GR
OU
ND
IN
FOR
MA
TIO
N C
ON
TIN
UE
D
BR
EAD
TH O
F SE
RVI
CE
DEL
IVER
Y
Doe
s yo
ur jo
int p
rogr
am p
rovi
de s
ervi
ces
to:
(Per
cent
ages
) Y
es
• E
mpl
oyee
s of
con
tribu
ting
empl
oyer
s w
ho a
re N
OT
repr
esen
ted
by a
bar
gain
ing
unit
38
• Th
e ge
nera
l pub
lic
19
• Fa
mily
mem
bers
of e
ligib
le e
mpl
oyee
s
29
IN
CO
RPO
RA
TIO
N
Is y
our j
oint
pro
gram
inco
rpor
ated
as
a no
n-pr
ofit
orga
niza
tion?
(P
erce
ntag
es)
Yes
57
If “Y
es”,
has
you
r joi
nt e
duca
tiona
l pro
gram
cre
ated
a fo
r-pr
ofit
entit
y?
(Per
cent
ages
) Y
es
17
Doe
s yo
ur jo
int e
duca
tiona
l pro
gram
pub
lish
an a
nnua
l re
port
? (P
erce
ntag
es)
Yes
48
In w
hat y
ear w
as y
our j
oint
edu
catio
nal p
rogr
am
esta
blis
hed?
(A
vera
ge)
19
90
G
OVE
RN
ING
BO
AR
D
Wha
t is
the
curr
ent s
truc
ture
of y
our g
over
ning
boa
rd?
(Per
cent
ages
)
•
Boa
rd o
f Tru
stee
s
38
•
Boa
rd o
f Dire
ctor
s
24
•
Join
t Com
mitt
ee
33
• O
ther
5

“What
Work
s in
Work
forc
e D
evel
opm
ent”
An A
STD
/ A
JLM
EP
Stu
dy
of
Join
t La
bor
-Manag
emen
t Educa
tional
Pro
gra
ms
15
B. E
DU
CA
TIO
N A
ND
TR
AIN
ING
EX
PE
ND
ITU
RE
S
INC
OM
E
W
hat p
erce
ntag
e of
the
tota
l inc
ome
for y
our j
oint
pro
gram
dur
ing
the
last
yea
r cam
e fr
om th
e fo
llow
ing
sour
ces?
(P
erce
ntag
e)
• E
mpl
oyer
con
tribu
tions
83
.6
• P
ublic
gra
nts
(loca
l, st
ate,
and
fede
ral)
18.2
•
Priv
ate
foun
datio
n an
d co
rpor
ate
gran
ts
0.4
• O
ther
sou
rces
3.
4
Tota
l inc
ome
(per
pro
gram
) (A
vera
ge)
$9.1
milli
on
EXPE
ND
ITU
RES
W
hat p
erce
ntag
e of
the
tota
l exp
endi
ture
s by
you
r joi
nt p
rogr
am
durin
g th
e la
st y
ear w
as s
pent
on
the
follo
win
g ty
pes
of tr
aini
ng
cost
s?
(Per
cent
ages
)
• W
ages
and
sal
arie
s of
trai
ning
per
sonn
el
26
.3
50
.8
• P
aym
ents
to o
utsi
de tr
aine
rs o
r out
side
trai
ning
com
pani
es
27
.1
22
.2
• Tu
ition
for c
ours
es e
mpl
oyee
s to
ok a
t edu
catio
nal i
nstit
utio
ns
43
.9
11
.0
•
Exp
endi
ture
s on
ele
ctro
nic
hard
war
e an
d so
ftwar
e us
ed to
del
iver
in
form
atio
n an
d fa
cilit
ate
the
deve
lopm
ent o
f ski
lls a
nd k
now
ledg
e.
0.
4
3.7
• O
ther
trai
ning
exp
endi
ture
s
9.0
12
.3
Tota
l tra
inin
g ex
pend
iture
s (p
er p
rogr
am)
(Ave
rage
) $4
.8 m
illion
To
tal t
rain
ing
expe
nditu
res
per e
ligib
le e
mpl
oyee
(A
vera
ge)
$128
$704
Tota
l tra
inin
g ex
pend
iture
s pe
r act
ual t
rain
ing
part
icip
ant
$7
04

“What
Work
s in
Work
forc
e D
evel
opm
ent”
An A
STD
/ A
JLM
EP
Stu
dy
of
Join
t La
bor
-Manag
emen
t Educa
tional
Pro
gra
ms
16
B. E
DU
CA
TIO
N A
ND
TR
AIN
ING
EX
PE
ND
ITU
RE
S C
ON
TIN
UE
D
EXPE
ND
ITU
RES
BY
TRA
ININ
G C
ON
TEN
T
W
hat p
erce
ntag
e of
you
r exp
endi
ture
s on
the
desi
gn, d
eliv
ery,
and
an
alys
is o
f tra
inin
g ac
tiviti
es w
ent t
owar
d th
e fo
llow
ing
type
s of
tr
aini
ng/e
duca
tiona
l cou
rses
? (P
erce
ntag
es)
•
Pro
fess
iona
l ski
lls
26
8
• B
asic
ski
lls
15
2
• O
ther
12
N/A
•
Inte
rper
sona
l com
mun
icat
ions
11
6
•
Car
eer a
nd e
duca
tiona
l cou
nsel
ing
and
advi
sing
ser
vice
s
10
N/A
•
Join
t lab
or-m
anag
emen
t com
mitt
ee tr
aini
ng
5
N/A
•
Man
ager
ial/s
uper
viso
ry s
kills
3
10
•
Occ
upat
iona
l saf
ety/
com
plia
nce
3
9
•
Info
rmat
ion
tech
nolo
gy s
kills
3
13
•
Tech
nica
l pro
cess
es a
nd p
roce
dure
s
2
13
•
Cus
tom
er re
latio
ns
2
7
•
Exe
cutiv
e or
lead
ersh
ip d
evel
opm
ent
2
3
•
New
em
ploy
ee o
rient
atio
n
1
8
• Q
ualit
y, c
ompe
titio
n, a
nd b
usin
ess
prac
tices
1
5
• S
ales
and
dea
ler t
rain
ing
0
4
•
Pro
duct
kno
wle
dge
0
9

“What
Work
s in
Work
forc
e D
evel
opm
ent”
An A
STD
/ A
JLM
EP
Stu
dy
of
Join
t La
bor
-Manag
emen
t Educa
tional
Pro
gra
ms
17
C. N
AT
UR
E A
ND
EX
TE
NT
OF
EM
PLO
YE
E P
AR
TIC
IPA
TIO
N
PA
RTI
CIP
ATI
ON
IN T
RA
ININ
G
Wha
t per
cent
age
of e
ligib
le e
mpl
oyee
s to
ok p
art i
n tr
aini
ng
durin
g th
e la
st y
ear?
(P
erce
ntag
e)
29
78
HO
UR
S O
F TR
AIN
ING
REC
EIVE
D
Wha
t was
the
tota
l num
ber o
f hou
rs o
f for
mal
trai
ning
and
ed
ucat
ion
rece
ived
by
all e
ligib
le e
mpl
oyee
s la
st y
ear?
(A
vera
ge)
455,
896
Num
ber o
f hou
rs o
f tra
inin
g pe
r par
ticip
ant
(Ave
rage
)
69
N
umbe
r of h
ours
of t
rain
ing
per e
ligib
le e
mpl
oyee
(A
vera
ge)
25
24
VEN
UE
OF
TRA
ININ
G
Wha
t per
cent
age
of a
ll tr
aini
ng to
ok p
lace
at t
he fo
llow
ing
loca
tions
? (P
erce
ntag
es)
•
At t
he p
artic
ipan
t's w
orkp
lace
35
•
Col
lege
or u
nive
rsity
35
•
Join
t pro
gram
trai
ning
cen
ter
25
• A
t the
par
ticip
ant's
hom
e
2
• A
t the
uni
on h
all
2
•
Oth
er
0

“What
Work
s in
Work
forc
e D
evel
opm
ent”
An A
STD
/ A
JLM
EP
Stu
dy
of
Join
t La
bor
-Manag
emen
t Educa
tional
Pro
gra
ms
18
C. N
AT
UR
E A
ND
EX
TE
NT
OF
EM
PLO
YE
E P
AR
TIC
IPA
TIO
N C
ON
TIN
UE
D
JOIN
T C
OM
MIT
TEE'
S R
OLE
Was
a jo
int l
abor
/man
agem
ent c
omm
ittee
invo
lved
in th
e fo
llow
ing
activ
ities
? (P
erce
ntag
es)
Yes
• Im
plem
enta
tion
of th
e tra
inin
g ac
tiviti
es
94
• D
esig
n of
the
train
ing
activ
ities
81
•
Eva
luat
ion
of th
e tra
inin
g ac
tiviti
es
75
• E
valu
atio
n of
the
inst
ruct
or(s
)
69
•
Sel
ectio
n of
the
inst
ruct
or(s
)
56
•
Oth
er a
ctiv
ities
23
D
ECIS
ION
MA
KIN
G
How
muc
h sh
ared
dec
isio
n m
akin
g oc
curs
con
cern
ing
the
man
agem
ent a
nd im
plem
enta
tion
of y
our t
rain
ing
activ
ities
? (P
erce
ntag
es)
Yes
Ran
k an
d fil
e em
ploy
ees
parti
cipa
te?
Uni
on
repr
esen
tativ
es
parti
cipa
te?
Em
ploy
er o
r m
anag
emen
t re
pres
enta
tives
pa
rtici
pate
?
• W
hat t
rain
ing
is n
eede
d?
76
95
100
• H
ow is
trai
ning
to b
e do
ne?
56
79
84
• W
ho is
to re
ceiv
e tra
inin
g?
44
89
89
• W
here
will
train
ing
sess
ions
be
held
?
56
72
72
•
Sel
ectio
n of
cou
rse
mat
eria
ls
25
61
67
• O
vers
eein
g or
man
agem
ent o
f the
join
t pro
gram
’s tr
aini
ng b
udge
t
7 89
89
•
Sel
ectio
n of
the
inst
ruct
or(s
) for
the
train
ing
activ
ities
19
56
56
•
Eva
luat
ion
of th
e tra
inin
g ac
tiviti
es
50
72
67
• E
valu
atio
n of
the
inst
ruct
or(s
) of t
he tr
aini
ng a
ctiv
ities
56
61
61
•
Mar
ketin
g an
d pr
omot
ing
your
pro
gram
’s e
duca
tiona
l and
trai
ning
act
iviti
es
69
94
83
•
Sel
ectio
n of
out
side
trai
ning
con
sulta
nts
and
train
ing
com
pani
es
19
67
72
Num
ber o
f act
iviti
es p
artic
ipat
ed (P
artic
ipat
ion
Inde
x)
(Ave
rage
)
3.9
7.3
7.4

“What
Work
s in
Work
forc
e D
evel
opm
ent”
An A
STD
/ A
JLM
EP
Stu
dy
of
Join
t La
bor
-Manag
emen
t Educa
tional
Pro
gra
ms
19
C. N
AT
UR
E A
ND
EX
TE
NT
OF
EM
PLO
YE
E P
AR
TIC
IPA
TIO
N C
ON
TIN
UE
D
N
EED
S A
NA
LYSI
S PR
OC
ESS
Do
you
have
a fo
rmal
pro
cess
for a
sses
sing
the
need
for
deve
lopi
ng n
ew p
rogr
am a
ctiv
ities
? (P
erce
ntag
es)
Yes
78

“What
Work
s in
Work
forc
e D
evel
opm
ent”
An A
STD
/ A
JLM
EP
Stu
dy
of
Join
t La
bor
-Manag
emen
t Educa
tional
Pro
gra
ms
20
D. J
OIN
T P
RO
GR
AM
SE
RV
ICE
S
G
ENER
AL
PRA
CTI
CES
AN
D S
ERVI
CES
Are
any
of t
he fo
llow
ing
gene
ral s
ervi
ces
and
prac
tices
ava
ilabl
e to
you
r elig
ible
par
ticip
ants
and
ple
ase
estim
ate
the
perc
enta
ge
of p
artic
ipan
ts th
at u
se th
em?
Per
cent
of
prog
ram
s w
ith s
ervi
ce
Per
cent
of
parti
cipa
nts
usin
g se
rvic
e
• Tu
ition
ass
ista
nce
84
27
• C
ompu
ters
or o
ther
tech
nolo
gies
for e
mpl
oyee
s to
use
on-
site
in
the
prog
ram
80
45
• A
cces
s to
con
tinui
ng e
duca
tion
activ
ities
upo
n co
mpl
etio
n of
a
train
ing
activ
ity
78
35
•
Trai
ning
reso
urce
cen
ters
68
39
• R
esou
rce
libra
ry
67
22
•
Par
ticip
atio
n in
join
t lab
or/m
anag
emen
t com
mitt
ees
65
17
• S
peci
al le
arni
ng n
eeds
(e.g
., la
rge-
prin
t tex
tboo
ks fo
r the
vis
ion
impa
ired)
61
1
•
One
-on-
one
tuto
ring
serv
ices
56
10
• S
mal
l gro
up tu
torin
g se
rvic
es
50
10
• M
ento
ring
activ
ities
/ser
vice
s (e
.g.,
bein
g pa
ired
with
mor
e ex
perie
nced
em
ploy
ee)
37
5
• O
ther
tech
nolo
gies
for w
orke
rs to
use
at h
ome
37
8
• P
re-e
mpl
oym
ent t
rain
ing
activ
ities
22
43
• C
ompu
ters
for w
orke
rs to
use
at h
ome
11
0

“What
Work
s in
Work
forc
e D
evel
opm
ent”
An A
STD
/ A
JLM
EP
Stu
dy
of
Join
t La
bor
-Manag
emen
t Educa
tional
Pro
gra
ms
21
D. J
OIN
T P
RO
GR
AM
SE
RV
ICE
S C
ON
TIN
UE
D
C
AR
EER
OR
JO
B P
LAC
EMEN
T SE
RVI
CES
Doe
s yo
ur jo
int p
rogr
am p
rovi
de a
ny o
f the
follo
win
g ca
reer
or
job
plac
emen
t ser
vice
s to
em
ploy
ees
who
took
par
t in
your
tr
aini
ng a
ctiv
ities
? W
hat p
erce
ntag
e of
all
your
par
ticip
ants
m
ade
use
of th
ese
serv
ices
?
Per
cent
of
prog
ram
s w
ith s
ervi
ce
Per
cent
of
parti
cipa
nts
usin
g se
rvic
e
• C
aree
r pla
nnin
g or
cou
nsel
ing
80
38
•
Info
rmat
ion
abou
t edu
catio
n an
d tra
inin
g pr
ovid
ers
70
60
• A
cces
s to
up-
to-d
ate
info
rmat
ion,
abo
ut c
aree
r opp
ortu
nitie
s an
d jo
b op
enin
gs
65
46
•
Info
rmat
ion
abou
t ski
lls a
nd tr
aini
ng n
eede
d fo
r pro
mot
ion
65
50
•
Ass
ista
nce
with
find
ing
a ne
w jo
b
55
27
• A
rticu
late
d ca
reer
ladd
er p
roce
ss
50
32
•
Job
plac
emen
t ser
vice
s fo
r dis
plac
ed e
mpl
oyee
s
44
14
• Jo
b P
lace
men
t ser
vice
s fo
r inc
umbe
nt w
orke
rs u
pgra
ding
to n
ew
or re
desi
gned
pos
ition
s
35
20
VO
LUN
TAR
Y V.
MA
ND
ATO
RY
SER
VIC
ES
Are
the
educ
atio
nal o
r tra
inin
g se
rvic
es o
ffere
d by
you
r joi
nt
educ
atio
nal p
rogr
am v
olun
tary
or m
anda
tory
for e
mpl
oyee
s?
(Per
cent
ages
)
•
Vol
unta
ry
80
• M
anda
tory
0
• S
ome
prog
ram
s vo
lunt
ary,
oth
ers
man
dato
ry
20

“What
Work
s in
Work
forc
e D
evel
opm
ent”
An A
STD
/ A
JLM
EP
Stu
dy
of
Join
t La
bor
-Manag
emen
t Educa
tional
Pro
gra
ms
22
D. J
OIN
T P
RO
GR
AM
SE
RV
ICE
S C
ON
TIN
UE
D
C
HA
NG
ES IN
SER
VIC
ES
How
has
you
r joi
nt p
rogr
am c
hang
ed o
ver t
he p
ast f
ive
year
s?
(Per
cent
ages
) Y
es
• H
as th
e co
nten
t of y
our e
duca
tion/
train
ing
activ
ities
cha
nged
in
resp
onse
to c
hang
ing
job/
skill
s re
quire
men
ts?
95
• H
as th
e co
nten
t of y
our e
duca
tion/
train
ing
activ
ities
cha
nged
in
resp
onse
to c
hang
es in
wor
k pr
oces
s?
84
• H
as th
e co
nten
t of y
our e
duca
tion
and
train
ing
activ
ities
cha
nged
in
resp
onse
to th
e in
trodu
ctio
n of
new
tech
nolo
gies
in th
e w
orkp
lace
?
79
• H
as th
e co
nten
t of y
our e
duca
tion
and
train
ing
activ
ities
cha
nged
in
resp
onse
to th
e in
trodu
ctio
n of
new
pro
duct
s an
d se
rvic
es?
74
• H
as th
e ra
nge
of e
duca
tiona
l and
trai
ning
act
iviti
es o
ffere
d by
you
r pr
ogra
m p
lace
d an
incr
easi
ng e
mph
asis
on
com
pute
r rel
ated
tra
inin
g?
74
• H
as th
e ra
nge
of e
duca
tiona
l and
trai
ning
act
iviti
es o
ffere
d by
you
r pr
ogra
m p
lace
d an
incr
easi
ng e
mph
asis
on
job-
rela
ted
skills
tra
inin
g?
72
• H
as y
our j
oint
pro
gram
offe
red
activ
ities
that
pla
ce a
gre
ater
em
phas
is o
n ed
ucat
iona
l and
car
eer c
ouns
elin
g?
68
• H
as th
e ra
nge
of e
duca
tiona
l and
trai
ning
act
iviti
es o
ffere
d by
you
r pr
ogra
m p
lace
d an
incr
easi
ng e
mph
asis
on
com
mun
icat
ion
skills
(s
oft-s
kills
trai
ning
)?
61
• H
as y
our j
oint
pro
gram
dev
elop
ed e
duca
tiona
l/tra
inin
g pr
ogra
ms
for d
ispl
aced
wor
kers
?
47

“What
Work
s in
Work
forc
e D
evel
opm
ent”
An A
STD
/ A
JLM
EP
Stu
dy
of
Join
t La
bor
-Manag
emen
t Educa
tional
Pro
gra
ms
23
E. U
SE
OF
LEA
RN
ING
TE
CH
NO
LOG
Y
PR
IMA
RY
DEL
IVER
Y M
ETH
OD
S
W
hat p
erce
ntag
e of
all
trai
ning
tim
e w
as d
eliv
ered
to p
artic
ipan
ts b
y th
e fo
llow
ing
met
hods
? (P
erce
ntag
es)
• C
lass
room
(ins
truct
or-le
d or
adv
ance
d te
chno
logy
)
83
.8
79
.4
• D
ista
nce
Lear
ning
(ele
ctro
nic
lear
ning
tech
nolo
gies
to d
eliv
er
info
rmat
ion
and
faci
litat
e th
e de
velo
pmen
t of s
kills
and
kno
wle
dge)
6.
9
8.8
• O
ther
sel
f-pac
ed in
stru
ctio
n
2.
3
7.2
• O
ther
del
iver
y m
etho
ds
6.9
4.
3
PR
ESEN
TATI
ON
MET
HO
DS
W
hat p
erce
ntag
e of
form
al tr
aini
ng a
ctiv
ities
use
d ea
ch o
f the
fo
llow
ing
pres
enta
tion
met
hods
? (P
erce
ntag
es)
• C
ompu
ter-b
ased
text
(CB
T, te
xt o
nly)
14
.3
7.
9
•
Mul
timed
ia
4.9
17
.0
• In
tera
ctiv
e TV
1.
5
0.9
• E
lect
roni
c pe
rform
ance
sup
port
syst
em
0.8
0.
1
•
Tele
conf
eren
cing
0.
5
3.9
• G
roup
war
e
0.
4
3.6
• V
irtua
l rea
lity
0.0
0.
1
“What
Work
s in
Work
forc
e D
evel
opm
ent”
An A
STD
/ A
JLM
EP
Stu
dy
of
Join
t La
bor
-Manag
emen
t Educa
tional
Pro
gra
ms
24
E. U
SE
OF
LEA
RN
ING
TE
CH
NO
LOG
Y C
ON
TIN
UE
D
DIS
TRIB
UTI
ON
MET
HO
DS
W
hat p
erce
ntag
e of
form
al tr
aini
ng a
ctiv
ities
use
d ea
ch o
f the
fo
llow
ing
dist
ribut
ion
met
hods
? (P
erce
ntag
es)
• C
D-R
OM
5.
9
5.4
• Lo
cal a
rea
netw
ork
(LAN
)
5.
7
6.8
• In
tern
et
3.5
3.
4
•
Ext
rane
t
2.
0
1.9
• V
oice
mai
l
2.
0
1.7
• E
lect
roni
c m
ail
1.7
7.
1
•
Intra
net
1.7
8.
3
•
Sim
ulat
or
1.4
1.
8
•
Wid
e ar
ea n
etw
ork
(WA
N)
1.3
1.
3
•
Cab
le T
V
0.6
0.
6
•
Sat
ellit
e TV
0.
0
0.6

“What
Work
s in
Work
forc
e D
evel
opm
ent”
An A
STD
/ A
JLM
EP
Stu
dy
of
Join
t La
bor
-Manag
emen
t Educa
tional
Pro
gra
ms
25
F. O
UT
SID
E T
RA
ININ
G S
ER
VIC
ES
AN
D E
VA
LUA
TIO
N M
ET
HO
DS
O
UTS
IDE
TRA
ININ
G P
RO
VID
ERS
W
hich
of t
he fo
llow
ing
sour
ces
prov
ided
trai
ning
to y
our e
mpl
oyee
s du
ring
the
perv
ious
yea
r?
(Per
cent
age
of P
rogr
ams
Indi
catin
g "Y
es")
• In
depe
nden
t tra
inin
g co
nsul
tant
s or
con
tract
ors
90
77
• C
omm
unity
and
juni
or c
olle
ges
85
59
• Te
chni
cal a
nd v
ocat
iona
l ins
titut
ions
85
45
• 4-
year
col
lege
s an
d un
iver
sitie
s
75
71
• O
ther
firm
s, in
clud
ing
priv
ate
train
ing
and
cons
ultin
g co
mpa
nies
70
82
• Y
our j
oint
pro
gram
inte
rnal
sta
ff
70
N/A
• E
mpl
oyer
’s in
tern
al tr
aini
ng s
taff
50
N
/A
• P
rodu
ct s
uppl
iers
45
71
• Tr
ade
or p
rofe
ssio
nal a
ssoc
iatio
ns
40
30
• Fe
dera
l, st
ate,
or l
ocal
gov
ernm
ent o
rgan
izat
ions
30
26
• O
ther
sou
rce
8
N/A

“What
Work
s in
Work
forc
e D
evel
opm
ent”
An A
STD
/ A
JLM
EP
Stu
dy
of
Join
t La
bor
-Manag
emen
t Educa
tional
Pro
gra
ms
26
F. O
UT
SID
E T
RA
ININ
G S
ER
VIC
ES
AN
D E
VA
LUA
TIO
N M
ET
HO
DS
CO
NT
INU
ED
IM
POR
TAN
CE
OF
VEN
DO
R S
ELEC
TIO
N C
RIT
ERIA
W
hich
of t
he fo
llow
ing
are
the
thre
e m
ost i
mpo
rtan
t crit
eria
for
sele
ctin
g a
vend
or?
Per
cent
age
Ran
king
C
riter
ia in
To
p Th
ree
AS
TD R
ank
Ord
er (1
=
Hig
hest
)
• Q
ualit
y of
con
tent
53
N/A
•
Qua
lific
atio
ns o
f the
firm
and
thei
r sta
ff
35
3
•
Mat
ch o
f ven
dor s
kill
sets
with
pro
ject
crit
eria
29
1
•
Fit o
f ven
dor c
hara
cter
istic
s w
ith o
rgan
izat
ion
cultu
re
24
8
• U
nder
stan
ding
of t
he w
ork
requ
irem
ents
24
5
•
Qua
lity
of th
e pr
ojec
t des
ign
24
2
• Fe
es
18
6
• P
ast e
xper
ienc
e w
ith c
ompa
ny
12
11
•
Incr
ease
the
impa
ct o
f tra
inin
g/le
arni
ng
12
4
• R
esou
rces
not
ava
ilabl
e in
tern
ally
12
10
• C
usto
mer
Ser
vice
12
N/A
•
Gai
n ac
cess
to w
orld
cla
ss c
apab
ilitie
s
6
12
•
Incr
ease
ope
ratio
nal e
ffici
ency
of t
he tr
aini
ng/le
arni
ng fu
nctio
n
0
7
• R
educ
e op
erat
ing
cost
s
0
9
• S
ecur
ity
0
N/A
•
Abi
lity
of p
rodu
cts
to in
terfa
ce s
eam
less
ly w
ith c
urre
nt re
quire
men
ts
0
N
/A
“What
Work
s in
Work
forc
e D
evel
opm
ent”
An A
STD
/ A
JLM
EP
Stu
dy
of
Join
t La
bor
-Manag
emen
t Educa
tional
Pro
gra
ms
27
G. E
VA
LUA
TIO
N O
F IM
PA
CT
TYPE
S O
F EV
ALU
ATI
ON
W
hat p
erce
ntag
e of
trai
ning
act
iviti
es re
ceiv
ed e
ach
of th
e fo
llow
ing
type
s of
eva
luat
ion?
(P
erce
ntag
es)
• R
eact
ion:
trai
nees
' sat
isfa
ctio
n w
ith c
ours
e
63
78
• Le
arni
ng: t
rain
ees'
ski
ll le
vel a
nd a
cqui
sitio
n
49
32
• B
ehav
ior:
train
ees'
beh
avio
r and
cha
nge
in p
erfo
rman
ce
6
9
• R
esul
ts: i
mpa
ct o
n bu
sine
ss re
sults
4
7
• O
bser
vatio
n
46
22
• Fo
cus
grou
ps
17
6
• R
etur
n on
exp
ecta
tion
18
7
EVA
LUA
TIO
N P
RO
CES
SES
H
as y
our o
rgan
izat
ion
had
any
eval
uatio
ns, r
epor
ts, o
r stu
dies
of
your
pro
gram
con
duct
ed b
y an
ext
erna
l thi
rd-p
arty
org
aniz
atio
n?
(Per
cent
ages
) Y
es
65
D
oes
your
org
aniz
atio
n ha
ve a
form
ally
def
ined
pol
icy
or p
roce
ss fo
r ev
alua
ting
the
perf
orm
ance
of e
duca
tiona
l pro
vide
rs?
33
AM
OU
NT
OF
IMPA
CT
Wha
t im
pact
has
you
r edu
catio
n/tr
aini
ng p
rogr
am a
s a
who
le h
ad?
(0
= N
one,
1 =
A L
ittle
, 2 =
A M
odes
t Am
ount
, 3 =
A G
reat
Dea
l) (A
vera
ge)
• W
ork
qual
ity
1.9
• La
bor m
anag
emen
t rel
atio
ns
1.6
• P
rom
otio
n of
em
ploy
ees
with
in th
e or
gani
zatio
n
1.
4
•
Em
ploy
ee R
eten
tion
1.4
• W
age
grow
th
1.1
• A
bsen
teei
sm
0.8