Embed Size (px)
Citation preview

What’s Behind 2018 and 2019 Marketplace Insurer Participation and Pricing Decisions?
Support for this research was provided by the Robert Wood Johnson Foundation. The views expressed here do not necessarily reflect the views of the Foundation.
January 2019
by John Holahan, Linda J. Blumberg, Erik Wengle, and Caroline Elmendorf
U.S. Health Reform—Monitoring and Impact

U.S. Health Reform—Monitoring and Impact 2
INTRODUCTIONIn 2018, insurers exited from many Affordable Care Act (ACA) nongroup insurance marketplaces, and remaining insurers increased their premiums sharply in many areas. In 2019, most areas experienced modest increases, or even decreases, in premiums,1 despite the pending elimination of the individual mandate penalties. And nationally, more insurers entered marketplaces than exited.2 To better understand these developments, we conducted case study interviews with marketplace administrators and insurers selling marketplace coverage in ten states: California, Florida, Georgia, Indiana, Maryland, Minnesota, Ohio, Virginia, Washington, and West Virginia. These states vary considerably in the number of insurers participating in their marketplaces, as well as by changes in premiums in 2018 and 2019.
Our analysis focuses primarily on marketplace insurer participation and pricing decisions. However, we also explore several related topics: movement to narrow-network insurance products; the introduction of short-term, limited-duration plans; the impact of reinsurance programs in two of our study states; and the impact of “silver loading,” the practice of increasing silver premiums to account for insurer costs of providing cost-sharing subsidies, on enrollment in bronze and gold plans.
The key findings were: � Insurer participation declined in the 2018 plan year primarily because of policy changes made in 2017 as well as increased political uncertainty and the associated financial risks. Policy changes included the ending of direct funding of cost sharing subsidies, reduction in the length
of the open enrollment period, and reduced funding for outreach and enrollment assistance. Efforts to repeal the ACA also were felt to discourage enrollment and thus insurer participation.
� For the 2019 plan year there has been some increase in insurer participation. More insurers came to believe that the risks they faced were manageable, and thus they became more willing to enter new markets.
� Marketplace premiums increased dramatically for the 2018 plan year. Much of this resulted from the administration refusing to directly fund cost-sharing reductions; thus, insurers had to account for these costs by increasing premiums. Uncertainty over the policies that would be in force during the year and the effect of the political debate on enrollment also increased insurers’ perceived risks, which were reflected in higher premiums than would be the case without the ACA.
� Premium increases were considerably smaller for the 2019 plan year. In some cases, premiums fell due to insurers finding that 2018 premiums were more than adequate.
� There was a clear trend toward plans offering narrow provider networks. The HMO products offered by Blue Cross Blue Shield affiliates and Medicaid insurers came to dominate many markets. PPO products had a difficult time competing due to higher prices for broader networks. The exception was in rural areas where it is extremely difficult to establish narrow networks because of provider scarcity and consolidation.
With support from the Robert Wood Johnson Foundation (RWJF), the Urban Institute is undertaking a comprehensive monitoring and tracking project to examine the implementation and effects of health reform. The project began in May 2011 and will take place over several years. The Urban Institute will document changes to the implementation of national health reform to help states, researchers and policymakers learn from the process as it unfolds. Reports that have been prepared as part of this ongoing project can be found at www.rwjf.org and www.healthpolicycenter.org.

U.S. Health Reform—Monitoring and Impact 3
� The expansion of non-ACA compliant short-term plans and health care sharing ministries affected some marketplaces in 2018. In general, most insurers were not convinced these types of options would be attractive to many individuals since they could not be purchased with ACA premium tax credits. However, the effect of short-term plans is anticipated to increase during the course of 2019 and beyond.
� Two of our study states instituted reinsurance programs. They saw significant reductions in premiums from these
programs, but the need for state financing of part of the cost was thought to inhibit use in other states.
� One impact of the increase in silver premiums to fund cost sharing reductions was that bronze plans became very inexpensive relative to the size of many premium tax credits, and even gold plans could frequently be purchased with a small increase in out-of-pocket costs. Thus the number of people with bronze and gold plans increased in most of the study states.
INSURER PARTICIPATION IN MARKETPLACES, 2018 AND 2019Insurer participation has varied significantly across geographic areas and years since the health insurance marketplaces created by the ACA began selling coverage for 2014. Insurer participation increased in the average state in 2015 and held roughly steady in 2016, but declined in 2017 and 2018.3 Indications of insurer profitability now look positive.4 Therefore, we asked insurers how they feel about their 2018 participation decisions at the end of the plan year and their outlooks for 2019.
Policy activity in 2017, when 2018 plan year participation decisions were made, caused significant market upheaval, making choices to expand participation very risky. Numerous administrative changes affected marketplace plans for the 2018 plan year, with the biggest effect likely resulting from halting direct reimbursements to insurers for cost-sharing subsidies. The administration also cut the length of the nongroup open enrollment period in half and substantially reduced federal funding for outreach and enrollment assistance. Simultaneously, efforts to repeal the ACA and institute substantially different policies mounted in Congress. At different times, the president declared the ACA “dead,” confusing many consumers. At least partly because of this tumult, the number of insurers participating in marketplaces in 2018 fell or stayed constant in every state except Alabama and New Jersey, which each gained one insurer for the plan year. Some insurers selling coverage in the 2018 marketplaces expanded within the states in which they were already participating, but generally, expansions were minimal.
In addition to our interviews, in our study states, we assessed insurer entrances and exits in select large metropolitan areas (see the appendix for details). In Seattle, Washington, Richmond, Virginia, and the Washington, D.C., suburbs of Virginia, three insurers left the marketplace in 2018. In Indiana, two insurers, Anthem and MDwise, left the
marketplace in 2018, following on numerous exits since the ACA marketplaces launched in 2014.5 Florida and Georgia experienced a single exit by the same insurer, Humana. Ohio’s marketplace lost Anthem but gained Oscar. California lost Anthem as well, and Oscar expanded in the state in 2018. Cigna left the Maryland marketplace, and no new insurer entered.6
Marketplace participation is now dominated by two insurer types: Medicaid-managed care organizations that entered the private insurance market for the first time under the ACA and affiliates of Blue Cross Blue Shield. In many cases, national insurers (e.g., Humana, Aetna, and UnitedHealthcare) and provider-sponsored insurers (an important exception being Kaiser Permanente) have left the marketplaces. Regional insurers are still in some rating regions but have left others.
The contraction of insurer participation in many instances is due to the inability to develop adequate provider networks at favorable payment rates. Interviewees from various insurers indicated that offering broad network products was no longer tenable in most instances. Sources believed that insurers that succeed in the marketplaces have established narrower provider networks with favorable provider payment rates. These narrower networks enable insurers to better control costs and keep premiums low. Several interviewees noted that broad network products tend to attract people with worse risk for which risk adjustment does not adequately account. Expansion into areas with low population density, which are often rural, presents significant challenges. Insurers noted that it can be very difficult to meet network adequacy requirements with reasonable payment rates in these areas.
Similarly, deciding whether to participate in a particular region often depended on whether the insurer had already established provider relationships, or if the firm felt that they

U.S. Health Reform—Monitoring and Impact 4
could establish favorable rates with the local providers. In areas with little to no competition between provider systems, negotiating desirable provider payment rates is harder, and therefore the decision to participate is more difficult. This factor is arguably the biggest limitation to insurer marketplace participation. One insurer, noting areas where they do not participate, said:
“The other counties tend to have monopolistic providers…It makes some counties more difficult than others.”
Following the tumultuous 2018 plan year, insurer participation increased in many markets in 2019. Eighteen states have more insurers offering coverage in their marketplaces than they had in 2018, and all other states held their number of insurers constant.7 Among our states, Florida, Ohio, and Virginia each gained one insurer relative to 2018. These insurers were Oscar (Florida and Ohio), Anthem (entering with a small footprint in Ohio), and Virginia Premier (a Medicaid insurer in Virginia). Many of our interviewees also indicated their firms would be open to expansion if they could count on more stable regulations and policy. Respondents across states, particularly
the Medicaid insurers, indicated they are actively evaluating expanding into more areas within states where they currently operate and, in some cases, into new states.
In addition to problems developing networks, increasing insurer participation will also be inhibited by concerns over the risk pool in some areas and political stability. For example, insurers considering entering the Maryland market report hesitation because of the high average claims reported by CareFirst. Maryland has attempted to address the ever-climbing marketplace premiums by implementing a reinsurance program. This program reimburses ACA-compliant nongroup market insurers for 80 percent of individual annual claims between $20,000 and $250,000. Ideally, this policy will make the state’s marketplace more attractive to insurers by lowering their potential financial exposure and backstopping participating insurers in managing some of their higher claims. The policy has already led CareFirst, currently the only statewide marketplace participant, to substantially lower 2019 premiums. It is unclear whether the reinsurance program will be enough to attract new insurers.8
Table 1: Average Percentage Change in Lowest-Cost Marketplace Premium Across Insurers, Select Rating Regions in Study States in Silver and Gold Coverage Tiers
2017-18 2018-19
State Rating Area Silver Gold Silver Gold
California Northern Counties 31.7% 21.0% 6.1% 6.2%
Sacramento 14.8% 2.7% 5.7% 8.4%
East Los Angeles 28.4% 16.7% 4.2% 5.9%
West Los Angeles 26.9% 16.2% 6.1% 7.8%
San Diego 24.5% 10.6% -0.1% 3.5%
Florida Tampa 50.3% 18.1% 3.3% 6.0%
Miami 50.3% 18.1% -0.5% 6.0%
Georgia Atlanta 50.1% 53.1% 2.2% -7.0%
Augusta 44.3% 66.5% 5.5% -4.1%
Indiana Indianapolis 28.2% 34.4% 5.0% 5.1%
Maryland Baltimore 49.3% 18.1% -9.9% -12.3%
Washington, D.C. Suburbs 49.3% 18.1% -9.9% -12.3%
Minnesota Minneapolis -8.2% -8.1% -14.9% -17.7%
Ohio Columbus 39.6% 28.5% 4.8% 5.5%
Cleveland 24.3% 13.5% 6.6% 10.3%
Virginia Richmond 52.0% 53.3% 13.6% -15.9%
Washington, D.C. Suburbs 60.0% 43.5% 20.7% 5.4%
Washington Seattle 40.3% 31.2% 7.2% 6.3%
West Virginia Charleston 15.3% 21.3% 9.6% 7.5%
Source: Urban Institute Analysis of data from healthcare.gov and relevant state based marketplace websites.

U.S. Health Reform—Monitoring and Impact 5
Almost every respondent, regardless of recent market experience, claimed federal policy changes have made the markets too unstable to expand into additional marketplace areas. Many noted that they would like to expand further if conditions settle down. One insurer noted:
“Given the continued uncertainty and volatility in the [state] individual market, we wanted to make sure we could be successful before building out a larger footprint.”
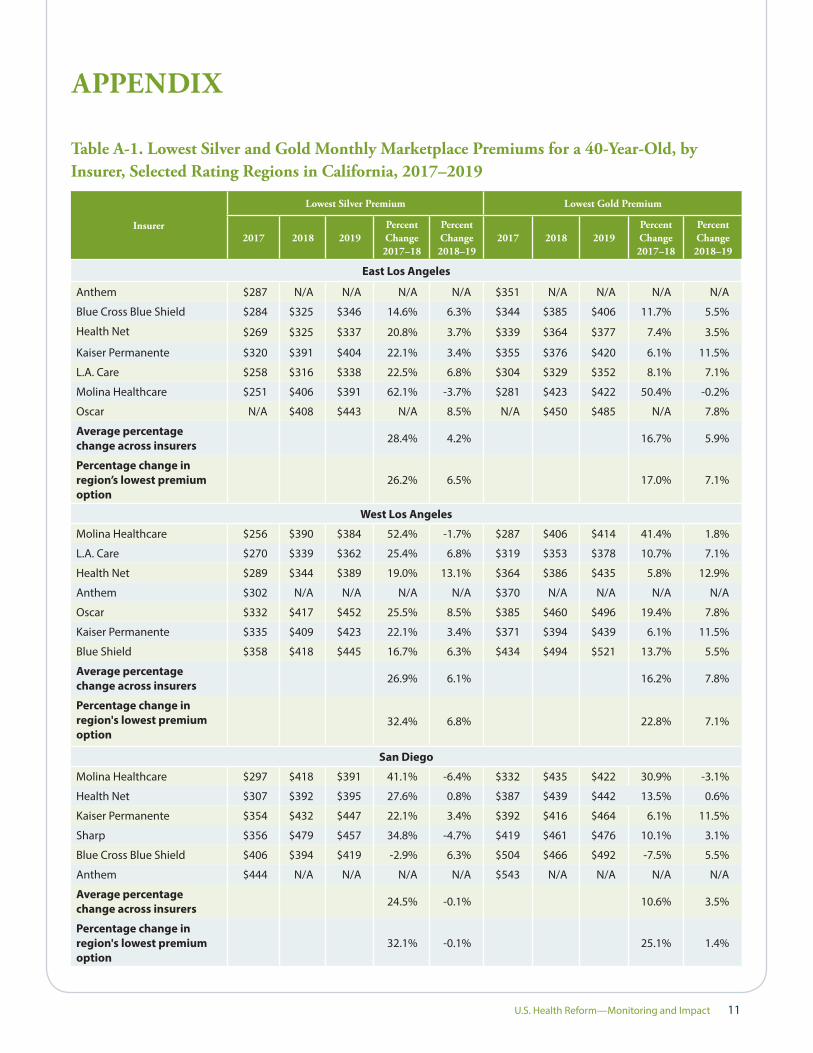
MARKETPLACE PREMIUM CHANGES, 2018 AND 2019Premiums, particularly for silver plans, increased dramatically in many premium areas in 2018, including in our study states (table 1). However, in 2019, the increases tended to be much more modest, and some premiums decreased significantly. Still, premiums varied considerably across the country. For example, in East Los Angeles, the average change in each insurer’s lowest marketplace silver premium was 28.4 percent in 2018, compared with 4.2 percent in 2019. In the northern counties of California, the corresponding increases were 31.7 percent in 2018 and 6.1 percent in 2019. The 2018 increases in all the regions studied in California were substantially greater for silver coverage than for gold, perhaps because this was the first plan year for which the administration refused to directly reimburse insurers for cost-sharing reductions. Therefore, California, like most states, directed insurers to load costs associated with those subsidies into their calculation of silver plan premiums.9
In Baltimore and the Maryland suburbs outside Washington, D.C., the average increase for insurers’ lowest silver marketplace premiums was 49.3 percent. The average increase for silver plans was much greater than for gold (49.3 percent versus 18.1 percent in both regions), again reflecting the state’s silver-loading strategy. In 2019, however, the average premium of these lowest-priced options decreased by 9.9 percent after
Maryland passed the state reinsurance program for ACA-compliant private nongroup insurance plans.
In Seattle, Washington, the average increase in insurers’ lowest silver premiums was 40.3 percent in 2018, compared with 7.2 percent in 2019. Premium increases for silver plans exceeded those for gold. Both Cleveland and Columbus, Ohio, also had very large increases for their lowest-priced silver plans in 2018 and much smaller increases in 2019. Again, premiums increased for silver plans more than for gold plans the year silver loading began. The same was true for Miami and Tampa, Florida.
Indiana did not use silver loading for the 2018 plan year, but insurers were required to load the cost-sharing reduction costs into the premiums for their marketplace plans only. The average lowest-cost silver premiums increase was 28.2 percent, compared with 34.4 percent for gold in the Indianapolis market. Both gold and silver premium increases in that market for 2019 were only about 5 percent. Georgia did not mandate that plans silver load in 2018 either; they let insurers decide how to handle these costs. Marketplace insurers in the Atlanta and Augusta, Georgia areas increased their lowest-priced plan premiums more for gold than for silver plans in 2018. In 2019, the silver increases were small, and the lowest-cost gold plan premiums decreased on average.
WHY THE LARGE PREMIUM INCREASES IN 2018?The large premium increases in 2018 largely resulted from the administration’s decision to stop directly reimbursing cost-sharing reductions. Most states directed insurers to increase premiums for silver plans to ensure that insurers could pay for the cost-sharing reductions that they are legally obligated to provide low-income enrollees, regardless of federal reimbursement. As a result, premiums for silver plans increased more than insurers otherwise anticipated, around an additional 10 to 20 percent. Even increases in 2018 premiums
for gold plans were larger than expected, seemingly reflecting insurers’ concerns about the uncertainty over regulatory changes and policy debates, and an expectation that healthier people would increasingly leave the market, with less-healthy people more likely to choose gold plans as silver premiums increased.
In 2017, policy changes and the wide-ranging repeal and replace efforts created tremendous uncertainty for insurers setting premiums for 2018. The policy changes included

U.S. Health Reform—Monitoring and Impact 6
various regulatory moves that led insurers to increase premiums substantially in all metal tiers, especially in states that did not require silver loading and spread the costs associated with low-income cost-sharing subsidies across all coverage tiers. Whether the individual mandate would be repealed or not enforced also influenced premium setting for 2018. Other factors include reduced outreach and enrollment funding and the shortened open enrollment period. Together with the continued threats of other health insurance changes and the administration’s willingness to change regulatory rules in the middle of a plan year, this uncertainty led to high 2018 premiums. Insurer responses include the following:
� “2018 was the year of a great deal of uncertainty. Who knew if ‘repeal and replace’ would go through, that the individual mandate would go away midyear. The [cost-sharing reduction] funding wasn’t decided until we had all submitted pricing. We generally went into 2018 with a lot of uncertainty. I’m not an actuary, but our actuary told us the best way to deal with uncertainty is to price for it. So, our general bias was to have higher rate increases for the uncertainty.”
� “Everyone had large increases in 2018, primarily because of the [cost-sharing reductions]. It could have been because of political uncertainty as well. Let’s face it, it was almost unbelievable how anyone could have priced anything. We didn’t know if the law would be repealed; there were too many variables coming into play, including confused potential customers.”
� “We feel like the cost-sharing reductions added about 20% to trend.”
Interviewees also mentioned insurers leaving the market as influencing 2018 premiums. Small insurers with low market shares leaving the market had a small effect. But if a major carrier offering a preferred provider organization
(PPO) product that attracted a disproportionate share of high-risk enrollees left the market, those high-risk enrollees would shift to the remaining insurers, increasing uncertainty around insurers’ pricing strategy. Interviewed insurers often mentioned that the difficulty of sustaining PPO products destabilized the markets. In markets with narrow-network plans and many insurers, premiums were lower. However, in these markets, PPOs struggled to achieve sufficient market share and remain, given their broader networks and higher provider payment rates. Their exits from markets created challenging transitions for those remaining, as expressed by interviewed insurers:
� “When a large insurer offering a PPO product that was attracting bad risks left, that would have an impact. That would cause very large rate increases, say, in the order of 30 percent. If there was an exit of a large carrier offering a PPO product, that would leave the remaining carriers with more risk, and risk adjustment may not fully adjust for this.”
� “We were faced in 2018 with being one of the only PPOs in the marketplace. We attract a different, riskier population than many of the [health maintenance organizations]. We also find that sicker individuals gravitate towards gold and platinum.”
In rural areas, almost all products were PPOs, reflecting that only open-network products were viable. There were not enough providers to develop narrow-network options in most cases, as noted by one interviewee:
“Payments are higher in rural areas. Rural areas aren’t big enough and do not have enough population or enough providers. If you are a big hospital and you own provider groups, there is no way for the insurers to negotiate a competitive rate. In urban areas, it’s possible that there are enough competing groups that you can stitch together networks, but not in the more rural parts of states.”
THE 2019 PREMIUM GROWTH SLOWDOWNIn 2019, premium increases were generally low, and in some cases, premiums fell relative to 2018. This readjustment occurred despite continuing political and policy uncertainty (including expansion of short-term, limited-duration plans, and elimination of individual mandate penalties) as well as further reduced federal outreach and enrollment funding for plan year 2019. The smaller increases in 2019 appear due to insurers over-adjusting for uncertainty and policy changes for the 2018 plan year; in many cases, they appear to have set premiums higher than was necessary. As a result, 2019 premiums were scaled back.
� “I think the carriers probably overreacted. I think two things: I think carriers probably asked for too much in 2018 on both rounds. The first round based on cost trends, and there was so much concern about the uncertainty in the market that they were already a little high. And then when the [decision to halt reimbursement for] cost-sharing reductions came through, I think they probably asked for too much. The insurance commissioner in our state is usually a little tough with carriers, but I think he went soft with them because of all of the political uncertainty.”

U.S. Health Reform—Monitoring and Impact 7
� “Rate increases are lower in 2019. Insurers are more stable and confident now. In 2019, the pricing is much more modest. I think that Insurer A only had a 4% increase, and I think that Insurer B and Insurer C were significantly lower than the prior year, something like 6 to 12 percent reductions. Insurer D had very high increases, but I think that in 2018 their premiums were probably too low. Unlike the other carriers that overdid it, they underdid it in 2018.”
� “The low price increases in 2019 reflect the prices in 2018. The premiums had to be high because of all the federal policy unknowns. Some of the uncertainties that led us to price high didn’t play out as we expected, but were mitigated. Thus, the lower the premium increases in 2019.”
Unlike in 2018, insurers setting premiums for 2019 knew that the individual mandate penalties would be eliminated that year. As demonstrated in the quotes below, interviewed insurers disagreed on the magnitude of the effect of eliminating the penalties in 2019. In part, this disagreement results from knowing that some consumers were confused in 2018, reacting as if the mandate had already been eliminated, and lack of agreement as to whether the mandate had been driving coverage since ACA implementation. Most insurers expected the 2019 individual mandate effect to be small, leading to risk pool changes that would increase premiums by less than 5 percent. However, one source suggested that repealing the mandate penalties could ultimately lead to premium increases as high as 13 percent.
� “The insurance commissioner in Washington [State] did not allow insurers to use the individual mandate as a reason to increase premiums in 2019. I think [the insurers] were raising [2019] rates to offset the losses that they were experiencing, and then raising rates to compensate for the uncertainty.”
� “Individual mandate penalties do not have a material effect on premiums. We were a little worried about people sitting out, but we don’t consider it material. Certainly, there will be some rate increases as a result, but in the low single digits.”
The Trump administration’s decision to loosen Obama-era regulations limiting short-term, limited-duration plans to three months or less also affected 2019 premiums. Allowing the sales of these non–ACA compliant policies for as long as 364 days threatens to pull healthier people out of ACA-compliant nongroup insurance pools, including marketplace and nonmarketplace coverage. At the time of our interviews, sources had unclear expectations about the likely impact of expanded short-term plans, and some expected their states’ regulations to prevent disasters, as noted below.
� “While we were concerned about short-term plans, this is probably a bit early to fully understand.”
� “Short-term plans will take people out of the risk pool, increasing premiums—how much of an effect is unclear.”
Most felt that people eligible for premium tax credits were unlikely to choose these expanded short-term plans. Those who hazarded a guess estimated that premiums could increase by 3 percent to 5 percent.
As noted previously, sources in Maryland believed that the state’s new reinsurance program was responsible for 2019’s large premium reductions. Before the state received the federal waiver to implement the reinsurance program, marketplace insurers had requested extremely large premium increases for 2019.10 CareFirst initially requested a 91 percent premium increase for their PPO product; after the reinsurance program was introduced, they revised the request to an 11 percent reduction. Two interviewees, explained the reinsurance program’s impact.
� “Reinsurance has a big effect on any carrier with a lot of high-cost cases. While reinsurance was generally expected to reduce premiums by 20 percent, it can have a much larger effect on PPO products.”
� “We had a small decrease in 2018 rather than a large increase, and our biggest variable driving that was our reinsurance program.”
THE TREND TOWARD NARROWER NETWORKSPPO products struggled in nearly every study state, and health maintenance organization (HMO) products dominated market shares. Sources in multiple states felt PPO products were more appealing to sicker people because of such products’ increased provider choice, namely the flexibility to see doctors or use hospitals outside the plan’s network and have at least some costs covered. Providing out-of-network coverage is often significantly more expensive for the insurer, because
prices charged are not based upon previously negotiated rates. For the entire individual market, one insurer noted:
“The PPO was a difficult platform […] What we’re seeing in the market, if you look at the landscape, is a shift toward the HMO platform: more tightly managed, more narrow networks, lower price points.”

U.S. Health Reform—Monitoring and Impact 8
One source noted that the struggle to maintain a PPO is even greater in states with limited verification for special enrollment periods. This person explained that people are “getting sick and then coming and buying a PPO, and then getting access to whatever doctor they want in the network without having to go through a [primary care physician] to get the care they need, and then leaving.” This insurer felt that eliminating penalties for being uninsured would only increase this problem’s frequency.
Several insurers perceived that the risk-adjustment system did not adequately compensate PPOs for the additional risk of their enrollees. Some insurers we spoke with believed that resultant financial losses caused insurers to pull PPO products from the marketplace in several states, thus increasing the average risk profile of other plans’ enrollees.
Some of our sources saw HMO products enabling insurers to enter portions of marketplace rating regions, choosing the counties where they could effectively contract with the providers for the lowest rates. This strategy, in the presence of a PPO competitor, allowed the HMO to pull healthier people to their new, narrow, low-cost option. Some of our sources felt that this dynamic caused further harm to PPO plans, which are required to charge the same premium across a rating region. Losing healthier risks in certain subregions then necessitated that PPO plans raise premiums across an entire rating region, exacerbating the risk imbalance between PPO and HMO plans. Again, though all interviewees saw risk adjustment as critical,
many felt it inadequately adjusted for existing risk differentials by plan type.
However, though interviewees saw PPOs as difficult to sustain, several conveyed the difficulty of creating and maintaining an HMO network in rural areas. Provider scarcity and consolidation makes it difficult to meet state network adequacy requirements while maintaining negotiating power to keep rates steady. Some sources did note that dominant insurers could still market products in rural areas because they have the leverage to threaten providers with leaving the region. Providers often preferred their patients to have an option for coverage, even if that meant accepting lower payment rates.
Insurers frequently saw the more successful marketplace competitors as those that originated as Medicaid plans or Blue Cross Blue Shield–affiliated HMO plans. Multiple sources believed that Blue Cross Blue Shield HMO products often derive from plans with broader networks and are created by large insurers that have more bargaining power, which has allowed them to create smaller HMO networks with the providers willing to keep payment rates lower than commercial levels. Medicaid insurers had already negotiated with provider networks for lower payment rates under their Medicaid contracts. Even if provider payment rates increased from Medicaid levels for their marketplace business, Medicaid insurers could still price their products below traditional commercial levels.
ADDITIONAL ISSUES Non–ACA Compliant PlansSources were concerned about the ramifications of expanded availability of non–ACA compliant, short-term plans for the marketplaces; however, insurers generally expected that the plans would have low enrollment and, in many states, a small impact on premiums. Several insurers were not convinced that these plans would be attractive to many consumers. Multiple respondents said their firms were against the plans and did not want to sell them, but also said they would sell them if it became a competitive imperative. One respondent said the short-term plans in their state were beneficial, because the ACA-compliant plans were unaffordable for many people with incomes between 400 and 600 percent of FPL, who are ineligible for assistance. Similarly, health sharing ministries caused concern for insurers in some states, but they appeared unimportant in other states where they were less prevalent. Some states have banned short-term plans; others have regulated them so that their availability should not increase with new federal regulations; and others have little regulation,
meaning expansion is still anticipated.11 Examples of insurer perspectives on short-term policies include the following:
� “We commented strongly on the short-term rules, and I think the big thing is we were hoping state law would not be preempted. We are pleased that that is the case. Minnesota law is complicated, but it essentially allows a short-term plan to be no more than 185 days over a 500-day period. The complex formula accounts for the fact that someone can be on a short-term plan more than once. We think that limits the exposure we have there.”
� “Short-term policies are regulated, not banned. The rules do not permit renewable short-term limited duration plans, so they can only sell a three-month plan. They increased consumer notifications to make sure that people understand they can’t be renewed.”
� “We are very worried about health sharing ministries in Washington [State]. They have made some queries into

U.S. Health Reform—Monitoring and Impact 9
this market, and the insurance commissioner is watching it closely.”
� “In California, there has been legislative action to prevent short-term policies, so that’s not part of our marketplace. Our expectation is that 1 to 2 percent would find short-term policies attractive. There is more robust coverage on the ACA plans; 75 percent or more of our membership [is] subsidized, and that reduces the price for most consumers.”
� “Short-term policies already have a big role in Virginia. That being said, there isn’t that much regulation of them. My message is: let’s put guardrails around them because we know that they are going to be offered. Some people want to put guardrails around them so they can’t be offered. As you know, [the Centers for Medicare & Medicaid Services] would love to have plans step forward on all of our short-term plans as a potential solution to the folks that don’t get the subsidies and are facing high premiums, so we may see some of our competitors step forward on that.”
Reinsurance Reinsurance has already greatly impacted the Maryland and Minnesota ACA-compliant markets, as well as in other states implementing such programs that are not part of our study. Others contemplating reinsurance thought that reinsurance in their state would not be worthwhile, given states’ required financial obligation. Respondents in Maryland and Minnesota felt reinsurance brought stability to the individual market, and that it would encourage insurers who exited the market to reenter. Sources in Minnesota were concerned about whether the state would continue to finance the program, which was initiated for the 2018 plan year (the program’s guaranteed state funding was only set through 2019), but the premium tax that financed Maryland’s new program appeared to provide a steady source of ongoing funding. Three interviewees highlighted the importance of federal support for state reinsurance programs:
� “In Minnesota, we are very concerned about the future of the reinsurance program. We understand that our market can fluctuate quickly if we did not deal with issues pertaining to reinsurance. We understand that it may be viewed as a temporary solution, and we agree, but that is the position we are in until we receive clarity at the federal level.”
� “In Maryland, we capitalized on the fact that the federal government was waiving the health insurance fee for 2019, so we imposed a broad-based 2.75 percent premium tax. With that, we were able to raise $365 million. Together with the federal government pass-through funding, we will end up just shy of $1 billion dollars in a five-year period…On the PPO product, when CareFirst filed rates [for 2019], they filed for a 90
percent increase. After reinsurance, they ended up with an 11.1 percent decrease. That amount of reinsurance money went towards all the products but tended to have the biggest effects on CareFirst PPO products.”
� “I [a Washington State respondent] would love to have a federal reinsurance program. Right now we have some states that have been able to pass reinsurance locally, but that is a very expensive thing to do. Federal reinsurance would make a huge difference.”
Cost-Sharing Reductions, Silver Loading, and Shifts across Metal Tiers As noted previously, without direct federal reimbursement for cost-sharing reductions in 2018, most state Departments of Insurance instructed insurers to load the associated costs into their silver plan premiums. In addition to covering insurer costs, this strategy increased each area’s benchmark silver premium, thus increasing federal premium tax credits. This approach also increased unsubsidized silver premiums substantially. In comparison, bronze plans became much less expensive, and the additional cost of a gold plan over a silver plan tended to shrink. Thus, as noted in the interviewee quotes below, insurers reported a significant shift in enrollment from silver plans to bronze and gold options among those ineligible for cost-sharing reductions.
� “Overall we [a California insurer] are seeing a lot more bronze. There’s an increase in overall [advance premium tax credits] and because of that, if you are a subsidy-eligible member, you can get bronze plans in many regions for a dollar. By applying the [advance premium tax credit] to premiums, if you are shopping primarily on monthly premiums, bronze becomes really attractive.”
� “In response to cost-sharing reductions, we had more people move to both bronze and to gold. Some of that was movement of nonsubsidized enrollees who didn’t want to pay the premium on silver. They were thinking, with those prices, they might as well buy a gold plan, or ‘I’d try to buy a bronze plan and get as much control on my premium as I possibly can.’”
� “The longer-term effect of the lack of funding of cost-sharing reduction has been a dramatic shift to bronze. I am not happy about that.”

U.S. Health Reform—Monitoring and Impact 10
DISCUSSIONWe found that insurer participation in the marketplaces began to rebound in 2019, following decreases in participation in many areas in 2018. Some insurers expanded their geographic footprint in states in which they already participated, and others expanded to new states. Insurers were generally satisfied with the outcomes of their 2018 decisions.
Interviewees questioned the survival of PPO products, particularly in areas where they competed against closed-network plans. Many felt that they were disproportionately attractive to enrollees with greater health care needs, and the risk-adjustment system insufficiently compensated PPO products for those risks. However, HMOs struggle in rural areas, where meeting network adequacy standards is extremely challenging.
Also, following many dramatic marketplace premium increases in 2018, premium growth in 2019 tended to be modest, and even negative in some areas. The 2018 increases were largely attributable to insurers incorporating the costs associated with cost-sharing reductions into their premiums and to the tremendous uncertainty created by other regulatory changes and the political debate surrounding reform. Insurers appear to be readjusting premium growth in 2019 to account for 2018 overestimates.
Before seeing evidence from the 2019 open enrollment period, most insurers seemed to downplay the ramifications of ending the individual mandate penalties and expanding short-term, limited-duration plans for the coming year’s risk pools. Yet, as of late December 2018, it seems likely that enrollment in the marketplaces in 2019 will be slightly lower than in 2018. Currently, it is impossible to assess how much of the enrollment change results from consumer decisions to drop insurance all together versus exits to noncompliant plans. The elimination of the mandate penalties makes both types of changes more likely. The implications for the average health care risk of marketplace enrollees may be greater than many insurers anticipate. If this is the case, financial losses for ACA-compliant insurers could increase in the coming year, with participation dropping and premiums increasing yet again for 2020. States using the reinsurance waiver–based strategy to help stabilize their markets may find these programs particularly helpful in stemming the effects of any falling enrollment in 2019.
U.S. Health Reform—Monitoring and Impact 11
Table A-1. Lowest Silver and Gold Monthly Marketplace Premiums for a 40-Year-Old, by Insurer, Selected Rating Regions in California, 2017–2019
Insurer
Lowest Silver Premium Lowest Gold Premium
2017 2018 2019Percent Change
2017–18
Percent Change
2018–192017 2018 2019
Percent Change
2017–18
Percent Change
2018–19
East Los Angeles
Anthem $287 N/A N/A N/A N/A $351 N/A N/A N/A N/A
Blue Cross Blue Shield $284 $325 $346 14.6% 6.3% $344 $385 $406 11.7% 5.5%
Health Net $269 $325 $337 20.8% 3.7% $339 $364 $377 7.4% 3.5%
Kaiser Permanente $320 $391 $404 22.1% 3.4% $355 $376 $420 6.1% 11.5%
L.A. Care $258 $316 $338 22.5% 6.8% $304 $329 $352 8.1% 7.1%
Molina Healthcare $251 $406 $391 62.1% -3.7% $281 $423 $422 50.4% -0.2%
Oscar N/A $408 $443 N/A 8.5% N/A $450 $485 N/A 7.8%
Average percentage change across insurers 28.4% 4.2% 16.7% 5.9%
Percentage change in region’s lowest premium option
26.2% 6.5% 17.0% 7.1%
West Los Angeles
Molina Healthcare $256 $390 $384 52.4% -1.7% $287 $406 $414 41.4% 1.8%
L.A. Care $270 $339 $362 25.4% 6.8% $319 $353 $378 10.7% 7.1%
Health Net $289 $344 $389 19.0% 13.1% $364 $386 $435 5.8% 12.9%
Anthem $302 N/A N/A N/A N/A $370 N/A N/A N/A N/A
Oscar $332 $417 $452 25.5% 8.5% $385 $460 $496 19.4% 7.8%
Kaiser Permanente $335 $409 $423 22.1% 3.4% $371 $394 $439 6.1% 11.5%
Blue Shield $358 $418 $445 16.7% 6.3% $434 $494 $521 13.7% 5.5%
Average percentage change across insurers 26.9% 6.1% 16.2% 7.8%
Percentage change in region's lowest premium option
32.4% 6.8% 22.8% 7.1%
San Diego
Molina Healthcare $297 $418 $391 41.1% -6.4% $332 $435 $422 30.9% -3.1%
Health Net $307 $392 $395 27.6% 0.8% $387 $439 $442 13.5% 0.6%
Kaiser Permanente $354 $432 $447 22.1% 3.4% $392 $416 $464 6.1% 11.5%
Sharp $356 $479 $457 34.8% -4.7% $419 $461 $476 10.1% 3.1%
Blue Cross Blue Shield $406 $394 $419 -2.9% 6.3% $504 $466 $492 -7.5% 5.5%
Anthem $444 N/A N/A N/A N/A $543 N/A N/A N/A N/A
Average percentage change across insurers 24.5% -0.1% 10.6% 3.5%
Percentage change in region's lowest premium option
32.1% -0.1% 25.1% 1.4%
APPENDIX

U.S. Health Reform—Monitoring and Impact 12
Table A-2. Lowest Silver and Gold Monthly Marketplace Premiums for a 40-Year-Old, by Insurer, in Miami and Tampa, Florida, 2017-2019
Insurer
Lowest Silver Premium Lowest Gold Premium
2017 2018 2019Percent Change
2017–18
Percent Change
2018–192017 2018 2019
Percent Change
2017–18
Percent Change
2018–19
Miami
Ambetter $296 $435 $440 46.7% 1.2% $407 $467 $476 14.9% 2.0%
Health Options $318 $442 $458 39.0% 3.5% $412 $456 $507 10.6% 11.3%
Molina Healthcare $320 $567 $568 77.5% 0.1% $372 $537 $630 44.2% 17.4%
Florida Blue (BCBS of Florida) $422 $583 $543 37.9% -6.9% $623 $640 $597 2.7% -6.6%
Humana1 $477 N/A N/A N/A N/A $559 N/A N/A N/A N/A
Average percentage change across insurers 50.3% -0.5% 18.1% 6.0%
Percentage change in region's lowest premium option
46.7% 1.2% 22.4% 4.5%
Table A-1. Lowest Silver and Gold Monthly Marketplace Premiums for a 40-Year-Old, by Insurer, Selected Rating Regions in California, 2017–2019
Sacramento
Kaiser Permanente $402 $478 $494 19.1% 3.4% $445 $460 $513 3.5% 11.5%
Western Health Advantage $426 $557 $596 30.7% 7.0% $512 $568 $607 11.0% 6.9%
Blue Cross Blue Shield $479 $446 $474 -6.9% 6.3% $595 $527 $556 -11.4% 5.5%
Health Net $501 $584 $620 16.5% 6.1% $625 $673 $738 7.7% 9.7%
Average percentage change across insurers 14.8% 5.7% 2.7% 8.4%
Percentage change in region’s lowest premium option
11.0% 6.3% 3.5% 11.5%
Northern Counties
Anthem $408 $602 $623 47.5% 3.6% $516 $726 $700 40.8% -3.6%
Blue Cross Blue Shield $450 $578 $644 28.4% 11.3% $559 $664 $736 18.8% 10.8%
Kaiser Permanente $402 $478 $494 19.1% 3.4% $445 $460 $513 3.5% 11.5%
Health Net $519 N/A N/A N/A N/A $647 N/A N/A N/A N/A
Average percentage change across insurers 31.7% 6.1% 21.0% 6.2%
Percentage change in region's lowest premium option
19.1% 3.4% 3.5% 11.5%
Source: Cover California.
Note: Insurers instructed to load the cost of cost-sharing reductions into silver marketplace premiums only.
continued

U.S. Health Reform—Monitoring and Impact 13
Table A-3. Lowest Silver and Gold Monthly Marketplace Premiums for a 40-Year-Old, by Insurer, in Atlanta and Augusta, Georgia, 2017–2019
Insurer
Lowest Silver Premium Lowest Gold Premium
2017 2018 2019Percent Change
2017–18
Percent Change
2018–192017 2018 2019
Percent Change
2017–18
Percent Change
2018–19
Atlanta
Ambetter $264 $417 $440 57.8% 5.4% $362 $465 $497 28.3% 6.8%
Blue Cross Blue Shield of Georgia (Anthem)
$324 $581 $438 79.2% -24.5% $499 $1,030 $680 106.5% -34.0%
Kaiser Permanente $372 $421 $529 13.3% 25.5% $444 $552 $585 24.3% 6.0%
Humana1 $538 N/A N/A N/A N/A N/A N/A N/A N/A N/A
Average percentage change across insurers 50.1% 2.2% 53.1% -7.0%
Percentage change in region's lowest premium option
57.8% 5.4% 28.3% 6.8%
Augusta
Blue Cross Blue Shield of Georgia (Anthem)
$322 $464 $490 44.3% 5.5% $495 $824 $790 66.5% -4.1%
Average percentage change across insurers 44.3% 5.5% 66.5% -4.1%
Percentage change in region's lowest premium option
44.3% 5.5% 66.5% -4.1%
Source: Healthcare.gov Public Use File.
Note: Insurers instructed to load the cost of cost-sharing reductions into all silver plans, both on marketplace and off.1Humana did not offer a gold plan during the 2017 plan year.
Table A-2. Lowest Silver and Gold Monthly Marketplace Premiums for a 40-Year-Old, by Insurer, in Miami and Tampa, Florida, 2017-2019
Tampa
Ambetter $305 $428 $467 40.3% 9.2% $418 $460 $506 9.9% 10.1%
Health Options $325 $481 $491 48.1% 2.1% $421 $495 $544 17.8% 9.8%
Molina Healthcare $339 $567 $585 67.3% 3.1% $395 $537 $648 35.9% 20.8%
Blue Cross Blue Shield of Florida
$341 $496 $489 45.5% -1.4% $502 $544 $538 8.3% -1.2%
Humana $428 N/A N/A N/A N/A N/A N/A N/A N/A N/A
Average percentage change across insurers 50.3% 3.3% 18.0% 9.9%
Percentage change in region's lowest premium option
40.3% 9.2% 16.4% 10.1%
Source: Healthcare.gov Public Use File.
Note: Insurers instructed to load the cost of cost-sharing reductions into silver marketplace premiums only.1Humana did not offer a gold plan during the 2017 plan year.
continued

U.S. Health Reform—Monitoring and Impact 14
Table A-4. Lowest Silver and Gold Monthly Marketplace Premiums for a 40-Year-Old, by Insurer, in Indianapolis, Indiana, 2017–2019
Insurer
Lowest Silver Premium Lowest Gold Premium
2017 2018 2019Percent Change
2017–18
Percent Change
2018–192017 2018 2019
Percent Change
2017–18
Percent Change
2018–19
Indianapolis
Ambetter $284 $364 $372 28.2% 2.0% $391 $514 $498 31.2% -3.0%
CareSource $286 $366 $396 28.1% 7.9% $364 $501 $567 37.6% 13.2%
Anthem $414 N/A N/A N/A N/A $647 N/A N/A N/A N/A
MDwise $317 N/A N/A N/A N/A $424 N/A N/A N/A N/A
Average percentage change across insurers 28.2% 5.0% 34.4% 5.1%
Percentage change in region's lowest premium option
28.2% 2.0% 37.6% -0.6%
Source: Healthcare.gov Public Use Files.
Note: Insurers instructed to load the cost of cost-sharing reductions into all marketplace metal tiers.
Table A-5. Lowest Silver and Gold Monthly Marketplace Premiums for a 40-Year-Old, by Insurer, in Baltimore and the Washington D.C., Suburbs, Maryland, 2017–2019
Insurer
Lowest Silver Premium Lowest Gold Premium
2017 2018 2019Percent Change
2017–18
Percent Change
2018–192017 2018 2019
Percent Change
2017–18
Percent Change
2018–19
Baltimore
Kaiser Permanente $309 $436 $404 41.1% -7.4% $401 $450 $408 12.1% -9.3%
CareFirst $355 $559 $489 57.5% -12.5% $416 $516 $437 24.0% -15.3%
Cigna $415 N/A N/A N/A N/A $548 N/A N/A N/A N/A
Average percentage change across insurers 49.3% -9.9% 18.1% -12.3%
Percentage change in region's lowest premium option 41.1% -7.4% 12.1% -9.3%
Washington, D.C., Suburbs
Kaiser Permanente $309 $436 $404 41.1% -7.4% $401 $450 $408 12.1% -9.2%
CareFirst $355 $559 $489 57.5% -12.5% $416 $516 $437 24.0% -15.3%
Cigna $409 N/A N/A N/A N/A $540 N/A N/A N/A N/A
Average percentage change across insurers 49.3% -9.9% 18.1% -12.3%
Percentage change in region's lowest premium option 41.1% -7.4% 12.1% -9.2%
Source: Maryland Health Connection.

U.S. Health Reform—Monitoring and Impact 15
Table A-6. Lowest Silver and Gold Monthly Marketplace Premiums for a 40-Year-Old, by Insurer, in Minneapolis, Minnesota, 2017–2019
Insurer
Lowest Silver Premium Lowest Gold Premium
2017 2018 2019Percent Change
2017–18
Percent Change
2018–192017 2018 2019
Percent Change
2017–18
Percent Change
2018–19
Minneapolis
HealthPartners $363 $327 $304 -9.9% -7.1% $463 $410 $367 -11.4% -10.4%
UCare $366 $315 $282 -13.8% -10.4% $490 $413 $363 -15.7% -12.1%
Medica $395 $352 $300 -10.9% -14.7% N/A1 $418 $343 N/A -17.9%
Blue Plus $419 $425 $309 1.7% -27.5% $489 $502 $349 2.7% -30.6%
Average percentage change across insurers -8.2% -14.9% -8.1% -17.7%
Percentage change in region's lowest premium option
-13.2% -10.4% -11.4% -16.3%
Sources: 2017 data taken from RWJF HIX compare dataset. 2018 and 2019 data were gathered from MNsure.
Note: 1Data missing
Table A-7. Lowest Silver and Gold Monthly Marketplace Premiums for a 40-Year-Old, by Insurer, in Columbus and Cleveland, Ohio, 2017–2019
Insurer
Lowest Silver Premium Lowest Gold Premium
2017 2018 2019Percent Change
2017–18
Percent Change
2018–192017 2018 2019
Percent Change
2017–18
Percent Change
2018–19
Columbus
CareSource $284 $385 $474 35.4% 23.3% $367 $464 $564 26.6% 21.5%
Molina Healthcare $301 $461 $444 53.5% -3.7% $383 $501 $500 30.8% -0.2%
Medical Mutual $326 $423 $437 29.9% 3.4% $402 $515 $550 28.0% 6.8%
Anthem Blue Cross and Blue Shield
$342 N/A N/A N/A N/A $467 N/A N/A N/A N/A
Ambetter from Buckeye Health Plan
N/A $417 $401 N/A -3.7% N/A $531 $498 N/A -6.3%
Oscar N/A N/A $382 N/A N/A N/A N/A $510 N/A N/A
Average percentage change across insurers 39.6% 4.8% 28.5% 5.5%
Percentage change in region's lowest premium option 35.4% -0.8% 26.6% 7.3%

U.S. Health Reform—Monitoring and Impact 16
Table A-8. Lowest Silver and Gold Monthly Marketplace Premiums for a 40-Year-Old, by Insurer, in Richmond and the Washington D.C., Suburbs, Virginia, 2017–2019
Insurer
Lowest Silver Premium Lowest Gold Premium
2017 2018 2019Percent Change
2017–18
Percent Change
2018–192017 2018 2019
Percent Change
2017–18
Percent Change
2018–19
Richmond
Aetna $289 N/A N/A N/A N/A N/A N/A N/A N/A N/A
Cigna $296 $439 $490 48.0% 11.7% $403 $719 $502 78.2% -30.2%
Anthem HealthKeepers $303 $497 $531 64.2% 6.7% $435 $740 $531 70.1% -28.3%
Kaiser Permanente $329 $447 $638 36.0% 42.7% $457 $483 $611 5.7% 26.5%
UnitedHealthcare1 $333 N/A N/A N/A N/A $482 N/A N/A N/A N/A
Piedmont Community Health Plan
$357 $572 $674 60.0% 17.9% $437 $696 $639 59.3% -8.2%
Optima Health N/A $900 $801 N/A -11.0% N/A $1,343 $812 N/A -39.5%
Virginia Premier Health N/A N/A $504 N/A N/A N/A N/A $499 N/A N/A
Average percentage change across insurers 52.0% 13.6% 53.3% -15.9%
Percentage change in region's lowest premium option 51.6% 11.7% 19.8% 3.3%
Table A-7. Lowest Silver and Gold Monthly Marketplace Premiums for a 40-Year-Old, by Insurer, in Columbus and Cleveland, Ohio, 2017–2019
Cleveland
Ambetter from Buckeye Health Plan
$224 $307 $323 36.8% 5.1% $312 $391 $400 25.3% 2.3%
Molina Healthcare $252 $346 $366 37.2% 5.7% $321 $376 $411 16.9% 9.5%
CareSource $253 $319 $371 26.2% 16.1% $326 $385 $440 18.0% 14.4%
Anthem Blue Cross and Blue Shield
$363 N/A N/A N/A N/A $496 N/A N/A N/A N/A
Medical Mutual $376 $364 $360 -3.1% -1.2% $470 $440 $454 -6.3% 3.2%
Oscar N/A $434 $466 N/A 7.4% N/A $509 $623 N/A 22.3%
Average percentage change across insurers 24.3% 6.6% 13.5% 10.3%
Percentage change in region's lowest premium option 36.8% 5.1% 20.3% 6.5%
Source: Healthcare.gov Public Use File.
Note: Insurers instructed to load the cost of cost-sharing reductions into silver marketplace premiums only.
continued

U.S. Health Reform—Monitoring and Impact 17
Table A-8. Lowest Silver and Gold Monthly Marketplace Premiums for a 40-Year-Old, by Insurer, in Richmond and the Washington D.C., Suburbs, Virginia, 2017–2019
Washington, D.C., Suburbs
Innovation Health $296 N/A N/A N/A N/A $396 N/A N/A N/A N/A
Cigna $313 $458 $508 46.1% 11.0% $426 $750 $520 75.8% -30.6%
UnitedHealthcare $319 N/A N/A N/A N/A N/A N/A N/A N/A N/A
Kaiser Permanente $329 $447 $638 36.0% 42.7% $457 $483 $611 5.7% 26.5%
Anthem HealthKeepers $336 $511 $552 52.3% 8.0% $482 $770 $552 59.7% -28.3%
CareFirst BlueChoice, Inc. $432 $720 $802 66.7% 11.3% $498 $653 $751 31.1% 14.9%
Group Hospitalization and Medical Services, Inc. (CareFirst)
$466 $928 $1,210 98.9% 30.5% $556 $807 $1,167 45.1% 44.7%
Average percentage change across insurers 60.0% 20.7% 43.5% 5.4%
Percentage change in region's lowest premium option 51.4% 13.5% 21.9% 7.68%
Source: Healthcare.gov Public Use File.
Notes: Insurers instructed to load the cost of cost-sharing reductions into silver marketplace premiums only.1United did not offer a gold plan during the 2017 plan year.
Table A-9. Lowest Silver and Gold Monthly Marketplace Premiums for a 40-Year-Old, by Insurer, in Seattle, Washington, 2017–2019
Insurer
Lowest Silver Premium Lowest Gold Premium
2017 2018 2019Percent Change
2017–18
Percent Change
2018–192017 2018 2019
Percent Change
2017–18
Percent Change
2018–19
Seattle
Coordinated Care $235 $328 $368 39.6% 12.3% $317 $419 436 32.3% 4.1%
Molina HealthCare $257 $385 $412 49.7% 6.9% $320 $476 511 48.9% 7.3%
Group Health (Kaiser Permanente)
$280 $404 $439 44.2% 8.7% $344 $414 474 20.2% 14.7%
BridgeSpan Health Company $315 N/A N/A N/A N/A $409 N/A N/A N/A N/A
LifeWise $324 N/A N/A N/A N/A $417 N/A N/A N/A N/A
Regence $326 N/A N/A N/A N/A $433 N/A N/A N/A N/A
Premera Blue Cross $404 $517 $520 27.9% 0.7% $501 $617 612 23.4% -0.9%
Average percentage change across insurers 40.3% 7.2% 31.2% 6.3%
Percentage change in region's lowest premium option 39.6% 12.3% 30.7% 5.4%
Source: Washington Healthplan Finder.
Note: Insurers instructed to load the cost of cost-sharing reductions into silver marketplace premiums only.
continued

U.S. Health Reform—Monitoring and Impact 18
Table A-10. Lowest Silver and Gold Monthly Marketplace Premiums for a 40-Year-Old, by Insurer, in Charleston, West Virginia, 2017–2019
InsurerLowest Silver Premium Lowest Gold Premium
2017 2018 2019Percent Change
2017–18
Percent Change
2018–192017 2018 2019
Percent Change
2017–18
Percent Change
2018–19
Charleston
CareSource $505 $555 $611 9.8% 10.2% $638 $747 $817 17.0% 9.5%
Highmark Blue Cross Blue Shield West Virginia
$541 $653 $713 20.7% 9.1% $664 $834 $880 25.6% 5.5%
Average percentage change across insurers 15.3% 9.6% 21.3% 7.5%
Percentage change in region's lowest premium option
9.8% 10.2% 17.0% 9.5%
Source: Healthcare.gov Public Use File.
Note: Insurers instructed to load the cost of cost-sharing reductions into all metal tiers, both on marketplace and off.

U.S. Health Reform—Monitoring and Impact 19
Copyright© January 2019. The Urban Institute. Permission is granted for reproduction of this file, with attribution to the Urban Institute.
About the AuthorsJohn Holahan and Linda Blumberg are Institute Fellows, Erik Wengle is a Research Analyst, and Caroline Elmendorf is a Research Assistant, all in the Urban Institute’s Health Policy Center.
AcknowledgmentsThe authors are grateful for comments and suggestions from Sabrina Corlette and Kevin Lucia.
The views expressed are those of the authors and should not be attributed to the Urban Institute, its trustees, or its funders. Funders do not determine research findings or the insights and recommendations of Urban experts. Further information on the Urban Institute’s funding principles is available at www.urban.org/support.
About the Robert Wood Johnson FoundationFor more than 45 years the Robert Wood Johnson Foundation has worked to improve health and health care. We are working alongside others to build a national Culture of Health that provides everyone in America a fair and just opportunity for health and well-being. For more information, visit www.rwjf.org. Follow the Foundation on Twitter at www.rwjf.org/twitter or on Facebook at www.rwjf.org/facebook.
About the Urban InstituteThe nonprofit Urban Institute is dedicated to elevating the debate on social and economic policy. For nearly five decades, Urban scholars have conducted research and offered evidence-based solutions that improve lives and strengthen communities across a rapidly urbanizing world. Their objective research helps expand opportunities for all, reduce hardship among the most vulnerable, and strengthen the effectiveness of the public sector. For more information, visit www.urban.org. Follow the Urban Institute on Twitter or Facebook. More information specific to the Urban Institute’s Health Policy Center, its staff, and its recent research can be found at www.healthpolicycenter.org.
NOTES1. Fehr, Rachel, Rabah Kamal, Marco Ramirez, et al. 2018. “How ACA Marketplace
Premiums Are Changing by County in 2019.”Henry J. Kaiser Family Foundation. https://www.kff.org/health-costs/issue-brief/how-aca-marketplace-premiums- are-changing-by-county-in-2019.
2. Richman, Eli. 2018. “ACA marketplace participation is on the upswing in 2019. But rural areas are still struggling.” Fierce Healthcare, November 15. https://www.fiercehealthcare.com/payer/aca-marketplace-participation-back-upswing-2019-but-rural-areas-are-still-struggling.
3. Fehr, Rachel, Cynthia Cox, and Larry Levitt. 2018. “Insurer Participation on ACA Marketplaces, 2014-2019.” Henry J. Kaiser Family Foundation. https://www.kff.org/health-reform/issue-brief/insurer-participation-on-aca-marketplaces-2014-2019.
4. S&P Global Ratings. 2018. “The Outlook For The U.S. Health Care Sector Is Mixed As Fourth-Quarter 2018 Approaches.” Published September 25. https://www.capitaliq.com/CIQDotNet/CreditResearch/RenderArticle.aspx?articleId=2106238&SctArtId=461430&from=CM&nsl_code=LIME&sourceObjectId=10704037&sourceRevId=4&fee_ind=N&exp_date=20281016-02:49:38.
5. Fehr, Rachel, Cynthia Cox, and Larry Levitt. 2018. “Insurer Participation on ACA Marketplaces, 2014-2019.” Henry J. Kaiser Family Foundation. https://www.kff.org/health-reform/issue-brief/insurer-participation-on-aca-marketplaces-2014-2019.
6. Authors’ analysis of marketplace public use files from healthcare.gov.
7. Fehr, Rachel, Cynthia Cox, and Larry Levitt. 2018. “Insurer Participation on ACA Marketplaces, 2014-2019.” Henry J. Kaiser Family Foundation. https://www.kff.org/health-reform/issue-brief/insurer-participation-on-aca-marketplaces-2014-2019.
8. Ransom, Gene. 2018. “Maryland must take another step to shore up its Obamacare exchange.” Baltimore Sun, August 23. https://www.baltimoresun.com/news/opinion/oped/bs-ed-op-0824-medchi-20180823-story.html. Dresser, Michael. “U.S. approves waiver allowing Maryland to lower Obamacare premium costs.” Baltimore Sun, August 21. https://www.baltimoresun.com/news/maryland/politics/bs-md-health-waiver-20180821-story.html.
9. Sabrina Corlette, Kevin Lucia, and Maanasa Kona. 2017. “States Step Up to Protect Consumers in Wake of Cuts to ACA Cost-Sharing Reduction Payments.” To the Point (blog), The Commonwealth Fund. https://www.commonwealthfund.org/blog/2017/states-step-protect-consumers-wake-cuts-aca-cost-sharing-reduction-payments.
10. Cox, Erin. 2018. “New Maryland program staves off huge health insurance increases.” Washington Post, September 21. https://www.washingtonpost.com/local/md-politics/new-maryland-program-staves-off-huge-health-insurance-increases/2018/09/21/a55bf09a-bda3-11e8-b7d2-0773aa1e33da_story.html?utm_term=.28453a13f1fa.
11. Lucia, Kevin, Justin Giovanelli, Sabrina Corlette, et al. 2018. State Regulation of Coverage Options Outside of the Affordable Care Act: Limiting the Risk to the Individual Market. Washington: The Commonwealth Fund. The Commonwealth Fund. 2018. “What Is Your State Doing to Affect Access to Adequate Health Insurance?” Published December 13. https://www.commonwealthfund.org/publications/maps-and-interactives/2018/dec/what-your-state-doing-affect-access-adequate-health.