Embed Size (px)
Citation preview
What’s Next: Trade, North America and the World
Presentation by Joel Kotkin, Chapman University, to TMC Conference Long
Beach, CA March 4th, 2014

Long Term Fundamentals
• Regional diversity is key to US future
• U.S. only advanced country with large, growing population
• Huge resource base
• Economic system most resilient among advanced countries
• Dispersion of trade and growth of Third Coast

0
50,000,000
100,000,000
150,000,000
200,000,000
250,000,000
300,000,000
350,000,000
400,000,000
1960 1970 1980 1990 2000 2010 2030 2050
More Crowding to Come: US Population Growth 1960-2050
Source: Bureau of the Census, CensusScope

Labor Force Growth
U.S. Census Bureau, International Database
United States, 37%
Korea, -30%
Europe, -21%
China, -10%
Japan, -39%
-45%
-35%
-25%
-15%
-5%
5%
15%
25%
35%
45%
2000 2005 2010 2015 2020 2025 2030 2035 2040 2045 2050
Growth in Age 15-64

0.12
0.26
0.36
0.09
0.19
0.45
0.53
0.82
0.37 0.34
0.0
0.1
0.2
0.3
0.4
0.5
0.6
0.7
0.8
0.9
China Europe Japan Singapore United States
65
& O
ver
Pe
rso
ns
pe
r U
nd
er
15
2010
2050
Ratio of Elderly to Working Age Population 65 & OVER PERSONS PER 15-64 YEARS
Calculated from
UN Population Prospects:
2010 Revision

$0
$3
$6
$9
$12
$15
$18
1995 2000 2005 2010
Trill
ion
s
United StatesChinaIndiaJapanGermany
5 Largest World Economies GDP-PPP: 1994-2012
Source of Data:
World Bank

In a post-industrial age, stuff still matters…

America’s Opportunity
Food and Agriculture Organization of the United Nations
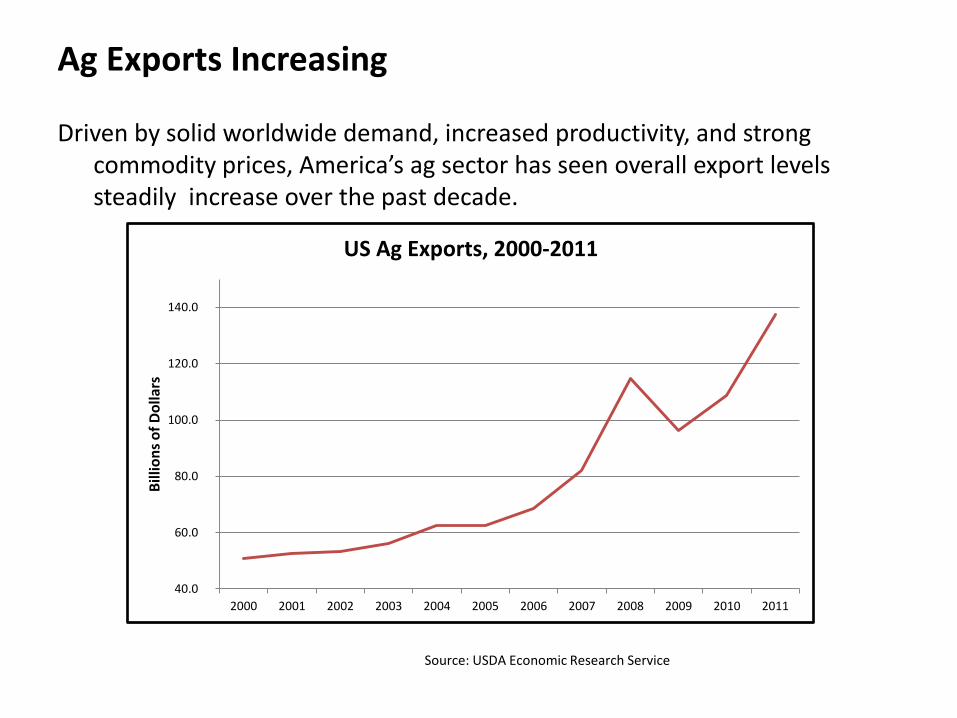
Ag Exports Increasing
Driven by solid worldwide demand, increased productivity, and strong commodity prices, America’s ag sector has seen overall export levels steadily increase over the past decade.
40.0
60.0
80.0
100.0
120.0
140.0
2000 2001 2002 2003 2004 2005 2006 2007 2008 2009 2010 2011
Bill
ion
s o
f D
olla
rs
US Ag Exports, 2000-2011
Source: USDA Economic Research Service
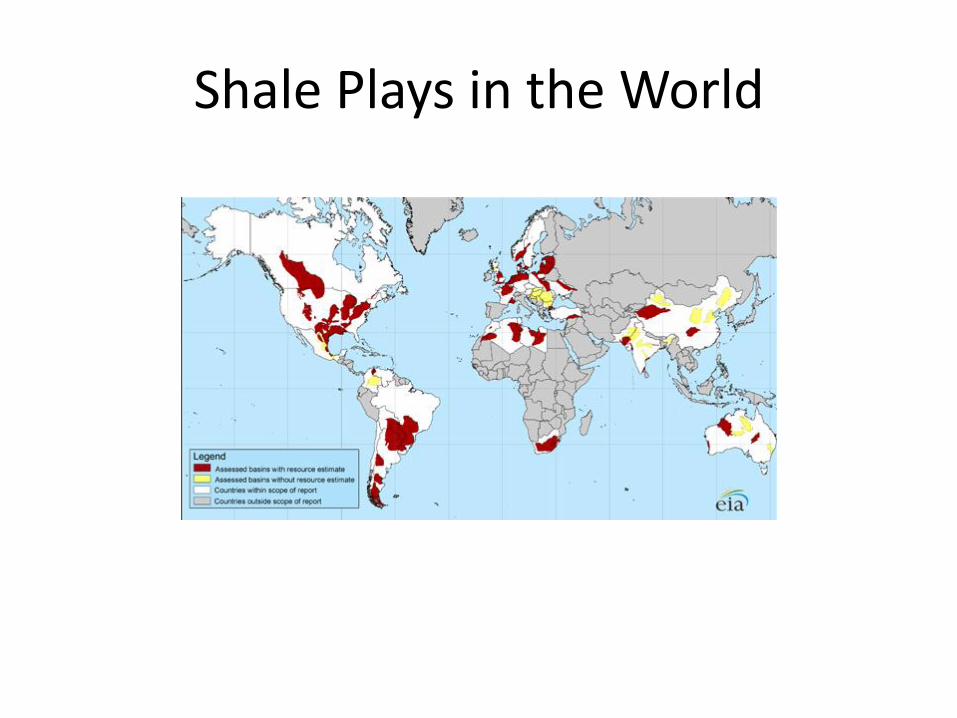
Shale Plays in the World

Leading in Gas Production
611
589
182
152
139
117
106
97
85
85
84
83
United States
Russia
European Union
Canada
Iran
Qatar
Norway
China
Netherlands
Algeria
Saudi Arabia
Indonesia
Natural Gas Production, Billions of Cu M
CIA World Factbook

0 20,000 40,000 60,000 80,000 100,000 120,000 140,000 160,000 180,000 200,000
Texas
Oklahoma
Colorado
California
Louisiana
Pennsylvania
Kansas
Florida
New Mexico
North Dakota
Ohio
Wyoming
Arkansas
West Virginia
Illinois
Michigan
Mississippi
Alaska
Utah
Oil and Gas Extraction Job Growth, 2001-2011
Source: EMSI Complete Employment, 2011.4

U.S. Share of Global Manufacturing Holds Steady
0%
1%
2%
3%
4%
5%
6%
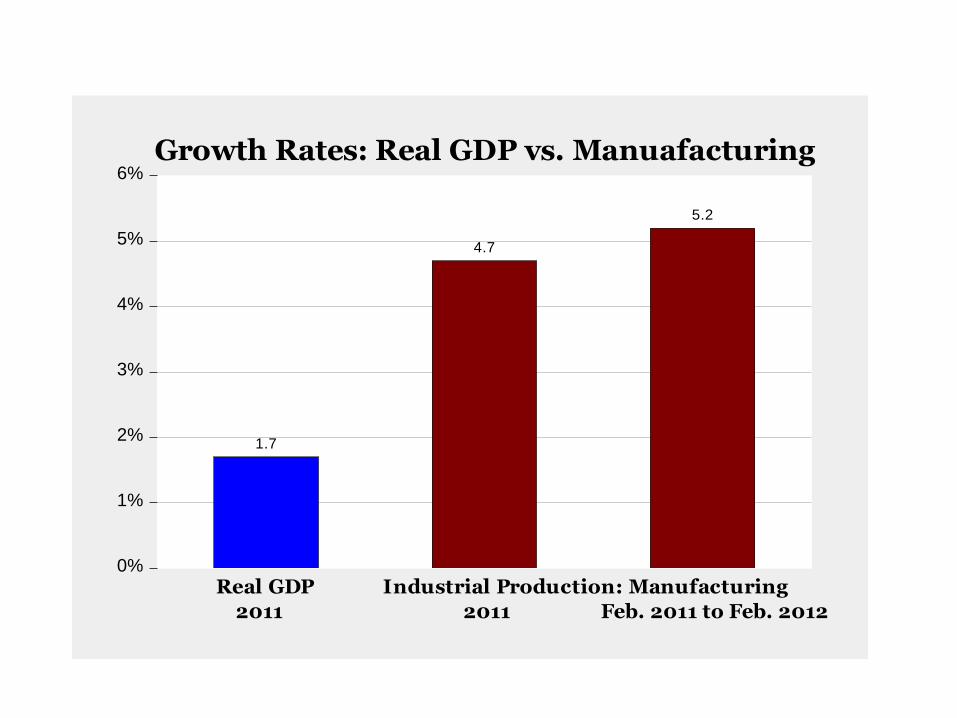
1.7
4.7
5.2
Real GDP Industrial Production: Manufacturing
2011 2011 Feb. 2011 to Feb. 2012
Growth Rates: Real GDP vs. Manuafacturing


Top States for New Plants, 2010

11.5% 11.1% 10.9%
8.4%
9.4%
Third Coast TTU PlainsCounties
SoutheastManufacturing
Belt
IntermountainWest
Nation
Heavy Metal Manufacturing Job Growth 2010-2012


2013-2023 JOB GROWTH % CHANGE Research by EMSI, Inc.
-5.0%
0.0%
5.0%
10.0%
15.0%
20.0%
25.0%
30.0%
2013-2023 %change
2003-2013 %change

1.0
1.2
1.4
1.6
1.8
2.0
2.2
2.4
2.6
2.8
3.0
2003 2004 2005 2006 2007 2008 2009 2010 2011
Indexed Growth in Exports, 2003=1.0
Gulf Coast Ports
All Other US Ports
Source: U.S. Census Bureau: Foreign Trade Division. Total Value, All Commodities

CAFTA (Central Am.), 4.1
South America, 18.2
Africa, 6.2
European Union, 14
NAFTA (North Am.), 29.2
Asia, 26.2
0
5
10
15
20
25
30
35
2005 2006 2007 2008 2009 2010
Bill
ion
s
Third Coast Exports by Destination

Where did my customers go?
….some moved, and their kids did too. America’s demography is changing in
ways that effect your business.

Gaining States

Losing States

Cities of Aspiration, Demographic Trends: DOMESTIC MIGRATION
2007-2012 (Excluding 2010) Divided by 2007 Population (Census Bureau)
-5.00%
-3.00%
-1.00%
1.00%
3.00%
5.00%
7.00%
-0.20% -0.15% -0.10% -0.05% 0.00% 0.05% 0.10% 0.15% 0.20% 0.25% 0.30%
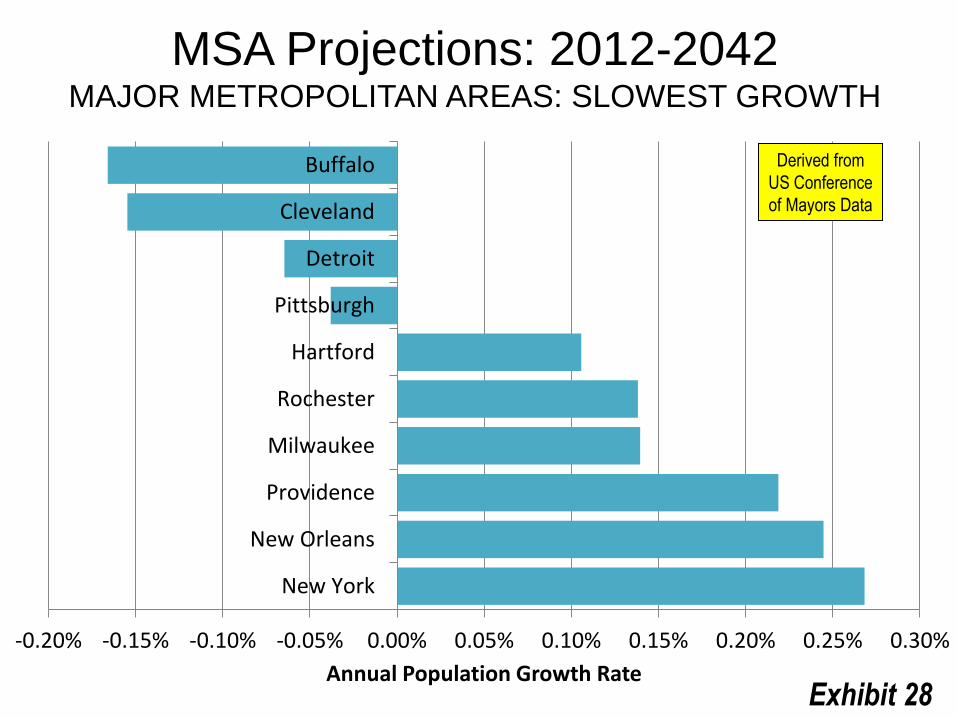
New York
New Orleans
Providence
Milwaukee
Rochester
Hartford
Pittsburgh
Detroit
Cleveland
Buffalo
Annual Population Growth Rate
MSA Projections: 2012-2042 MAJOR METROPOLITAN AREAS: SLOWEST GROWTH
Derived from
US Conference
of Mayors Data
Exhibit 28

0.00% 0.50% 1.00% 1.50% 2.00% 2.50%
Cape Coral
Provo
McAllen
Austin
Phoenix
Raleigh
Riverside-San Bernardino
Orlando
Boise
Atlanta
Annual Population Growth Rate
MSA Population Projection: 2012-2042 MAJOR METROPOLITAN AREAS: FASTEST GROWTH
NATIONAL AVERAGE Derived from
US Conference
of Mayors Data
Exhibit 29
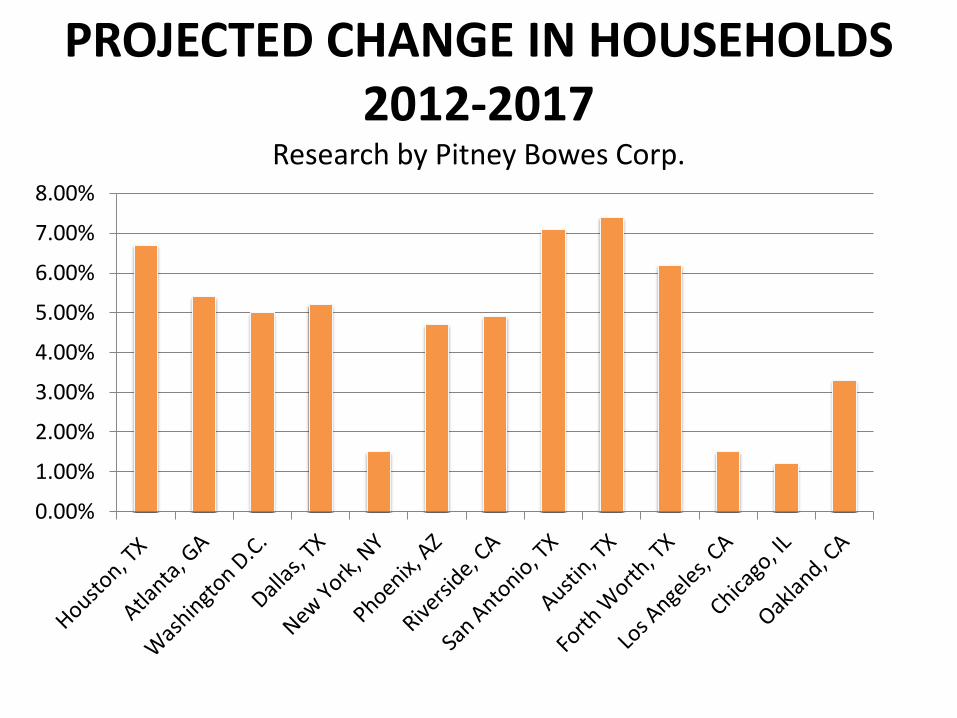
PROJECTED CHANGE IN HOUSEHOLDS 2012-2017
Research by Pitney Bowes Corp.
0.00%
1.00%
2.00%
3.00%
4.00%
5.00%
6.00%
7.00%
8.00%

Cities of Aspiration, Demographic Trends: CHANGES IN FOREIGN BORN POPULATION
2007-2011 Percentage Change: (ACS)
-5.00%
0.00%
5.00%
10.00%
15.00%
20.00%
25.00%
30.00%
35.00%

Looking Ahead: America and the World in the next
decade
• Growth and markets will shift to opportunity regions • New global centers emerging • Basic Industries key drivers
JOELKOTKIN.COM A vivid snapshot of America in 2050 focusing on the evolution of the more intimate units of American society—families, towns, neighborhoods, industries. It is upon the success or failure of these communities that the American future rests.

Questions and Comment


![Joel Kotkin PPT [Read-Only] - c.ymcdn.com · (PPIC) • 70% of downshifting boomers “retiring in place ... Microsoft PowerPoint - Joel Kotkin PPT [Read-Only]](https://img.pdfslide.net/doc/110x75/5c90882709d3f242278b78ff/joel-kotkin-ppt-read-only-cymcdncom-ppic-70-of-downshifting-boomers.jpg)