Embed Size (px)
Citation preview

DRAFT: 4/17/18
Specialty Pharmacy Industry Outlook:
What’s Happened & What’s Ahead
Adam J. Fein, Drug Channels Institute
Lisa Gill, J.P. Morgan Securities
Doug Long, IQVIA
http://drugch.nl/asembia18

DRAFT: 4/17/18
Agenda
• The State of Specialty Pharmacy 2018 – Adam
• Key Themes for 2018 – Lisa
• The US Pharmaceutical Market: Trends, Issues, and Outlook – Doug
• Good Morning, Asembia! With Adam, Lisa, & Doug

DRAFT: 4/17/18
The State of Specialty Pharmacy 2018
Adam J. Fein, Ph.D.
Drug Channels Institute
www.DrugChannels.net
@DrugChannels

DRAFT: 4/17/18
The Specialty Pharmacy Accreditation Boom Continues
2015 2016 2017
Nu
mb
er o
f u
niq
ue
ph
arm
acy
loca
tio
ns
ACHC only CPPA only URAC only Multiple accreditations
ACHC = Accreditation Commission for Health Care; CPPA = Center for Pharmacy Practice Accreditation; URAC = Utilization Review Accreditation Commission Source: Drug Channels Institute research. Figures show number of unique accredited locations at the end of the year. For comparability, data for ACHC and CPPA exclude certain accredited pharmacy spoke locations within retail chains. Multiple category includes locations with accreditation from two or three of the accrediting organizations. Figures exclude locations with provisional, conditional, and expected accreditation. This chart appears as Exhibit 40 in The 2018 Economic Report on U.S. Pharmacies and Pharmacy Benefit Managers, Drug Channels Institute. Available at http://drugch.nl/pharmacy
381
499
729
+32%
+46%
NUMBER OF PHARMACY LOCATIONS WITH SPECIALTY PHARMACY ACCREDITATION, BY ORGANIZATION
© 2018 Pembroke Consulting, Inc. d/b/a Drug Channels Institute. All Rights Reserved.

DRAFT: 4/17/18
Hospitals and Physicians: Key Specialty Pharmacy Participants
4%
17%
10% 11%
59%
2%
11% 12%
26%
49%
Wholesaler PBM/Health Plan Retail/LTC Chain Healthcare Provider Independent
2015 (n=381) 2017 (n=729)
PERCENTAGE OF PHARMACY LOCATIONS WITH SPECIALTY PHARMACY ACCREDITATION, BY CORPORATE OWNERSHIP
LTC = Long-term care 1. Includes private independent pharmacies, pharmacies owned by private equity firms, and independently owned franchise locations. 2. Includes pharmacies owned by hospitals, health systems, physician practices, and providers’ group purchasing organizations. 3. Includes pharmacy locations owned by chain drugstores, grocery chains, and national long-term care pharmacy chains. Source: The 2018 Economic Report on U.S. Pharmacies and Pharmacy Benefit Managers, Exhibit 44. Figures show number of unique pharmacy locations accredited by ACHC, CPPA, and URAC at the end of the year. For comparability, data for ACHC and CPPA exclude certain accredited pharmacy spoke locations within retail chains. Figures exclude locations with provisional, conditional, and expected accreditation. Locations owned by manufacturers excluded for purposes of presentation
2 3 1
© 2018 Pembroke Consulting, Inc. d/b/a Drug Channels Institute. All Rights Reserved.

DRAFT: 4/17/18
Payers and PBMs Still Dominate Specialty Dispensing
Source: The 2018 Economic Report on U.S. Pharmacies and Pharmacy Benefit Managers, Exhibit 42. Includes revenues from retail, specialty, and mail pharmacies. Excludes revenues from network pharmacies of PBM-owned specialty pharmacies and infusion services covered by medical benefit. Reflects pro-forma impact of 2017 acquisitions.
PBM / health plan
Independent
Retail chain
Wholesaler
SHARE OF SPECIALTY DRUG DISPENSING REVENUES, BY COMPANY, 2017
CVS Health Express Scripts Walgreens/Prime OptumRx (UNH) Humana Cigna
Diplomat Avella BioPlus SenderraRx PANTHERx
Walmart Kroger
AmerisourceBergen McKesson
Everyone else
© 2018 Pembroke Consulting, Inc. d/b/a Drug Channels Institute. All Rights Reserved.

DRAFT: 4/17/18
Copay Accumulator Adjustment: A Benefit Design Challenge
62%
39%
31%
Recognized correct definition of “health plan deductible”
Knew the meaning of the term “out-of-pocket maximum”
Had a good understanding of the term “co-insurance”
Accumulator Adjustment: A manufacturer’s patient support payments do not count
toward the patient’s deductible and out-of-pocket maximum obligations
See Copay Accumulators: Costly Consequences of a New Cost-Shifting Pharmacy Benefit, Drug Channels, January 2018
% of U.S. consumers
© 2018 Pembroke Consulting, Inc. d/b/a Drug Channels Institute. All Rights Reserved.
DRAFT: 4/17/18
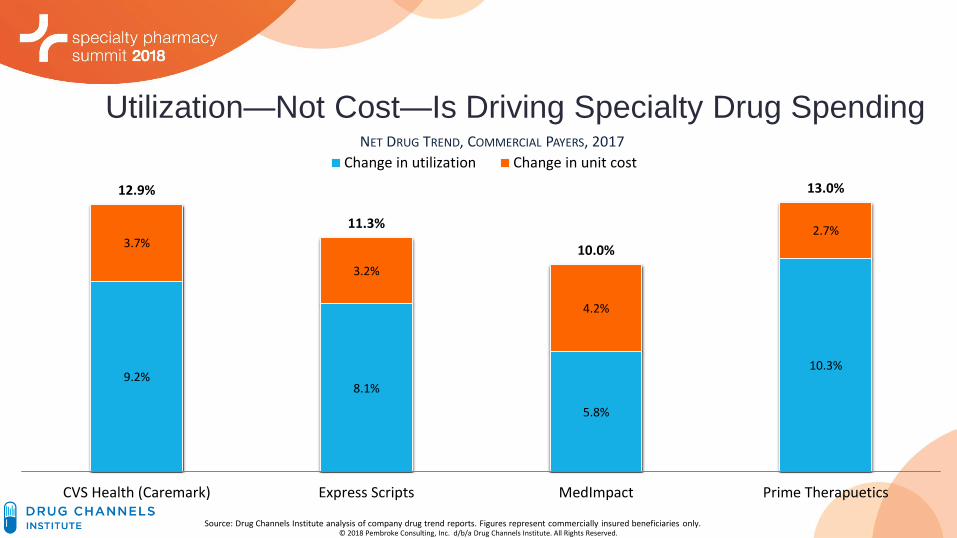
12.9%
11.3%
10.0%
13.0%
CVS Health (Caremark) Express Scripts MedImpact Prime Therapuetics
9.2% 8.1%
5.8%
10.3%
3.7%
3.2%
4.2%
2.7%
Change in utilization Change in unit cost
Utilization—Not Cost—Is Driving Specialty Drug Spending
Source: Drug Channels Institute analysis of company drug trend reports. Figures represent commercially insured beneficiaries only.
NET DRUG TREND, COMMERCIAL PAYERS, 2017
© 2018 Pembroke Consulting, Inc. d/b/a Drug Channels Institute. All Rights Reserved.

DRAFT: 4/17/18
Vertical Integration: The Medical-Pharmacy Specialty Future?
9
See the following Drug Channels articles: • Cigna-Express Scripts: Vertical Integration and PBMs’ Medical-Pharmacy Future • Five Takeaways About Cigna's Strategy for Express Scripts • The CVS-Aetna Deal: Five Industry and Drug Channel Implications • Why the Walgreens/Prime Deal Could Transform the PBM Industry
Insurer
PBM
Specialty Pharmacy
© 2018 Pembroke Consulting, Inc. d/b/a Drug Channels Institute. All Rights Reserved.

DRAFT: 4/17/18
Outlook and Implications
• REDUX: Pharmacies, PBMs, health plans, and providers continue to battle for
control of the specialty market, the patient journey, and the public narrative
• New accumulator adjustment benefit designs threaten to disrupt care, raise
patient costs, and slow the specialty pharmacy business
• Vertical integration will strengthen medical/pharmacy benefit management, extend
payer control, and increase channel concentration
• Politicians, regulators, and the media will scrutinize the specialty channel’s impact
on “drug prices” and consumers’ out-of-pocket spending, though the system’s
complexity will create deep confusion about appropriate solutions
• Amazon may (or may not) change everything
© 2018 Pembroke Consulting, Inc. d/b/a Drug Channels Institute. All Rights Reserved.

DRAFT: 4/17/18
Key Themes for 2018
Lisa Gill
J.P. Morgan Securities
DRAFT: 4/17/18

DRAFT: 4/17/18

DRAFT: 4/17/18

DRAFT: 4/17/18

DRAFT: 4/17/18

DRAFT: 4/17/18

DRAFT: 4/17/18

DRAFT: 4/17/18

DRAFT: 4/17/18

DRAFT: 4/17/18

DRAFT: 4/17/18

DRAFT: 4/17/18

DRAFT: 4/17/18
The US Pharmaceutical Market: Trends,
Issues, and Outlook
Doug Long
IQVIA
DRAFT: 4/17/18
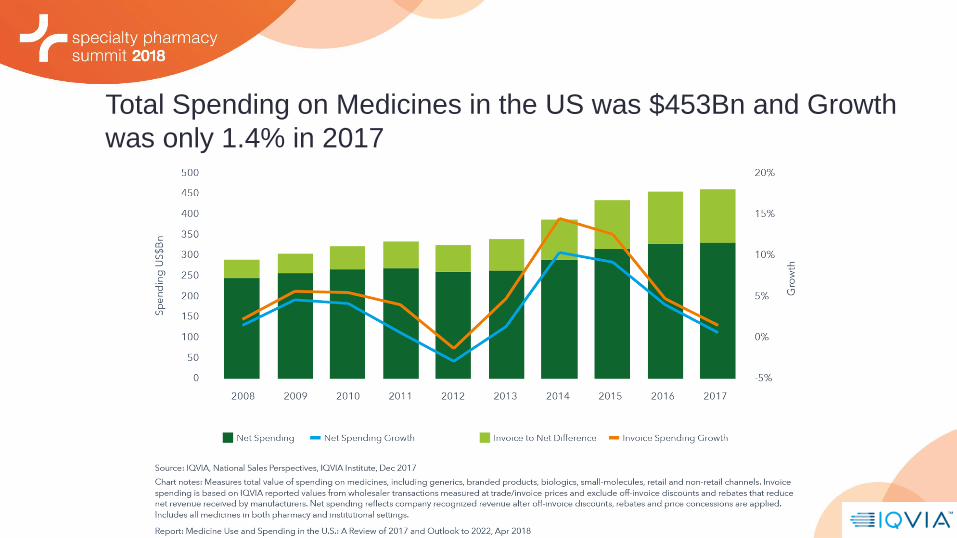
Total Spending on Medicines in the US was $453Bn and Growth
was only 1.4% in 2017

DRAFT: 4/17/18
Specialty growth is outpacing traditional growth and now is 43.4% of the
total non-discounted spend
$104.8 $132.7 $162.0 $179.0 $195.7
$226.9 $245.9
$263.0 $265.6 $255.0 $331.7
$378.6 $425.0 $444.6 $450.7
-10%
0%
10%
20%
30%
$0
$100
$200
$300
$400
$500
Gro
wth
N
on
-Dis
cou
nte
d S
pen
d (
BN
s)
SPECIALTY TRADITIONAL SPECIALTY GROWTH TRADITIONAL GROWTH TOTAL MARKET GROWTH
In 2017, specialty spend is growing at 9.3% while traditional is declining at 4.0%
Source: IQVIA, National Sales Perspectives, March 2018
Share of Sales 2013 2014 2015 2016 2017
SPECIALTY 31.6% 35.0% 38.1% 40.3% 43.4%
TRADITIONAL 68.4% 65.0% 61.9% 59.7% 56.6%

DRAFT: 4/17/18
Real Net Per Capita Medicine Spending is growing for Specialty
and declining for Traditional
DRAFT: 4/17/18
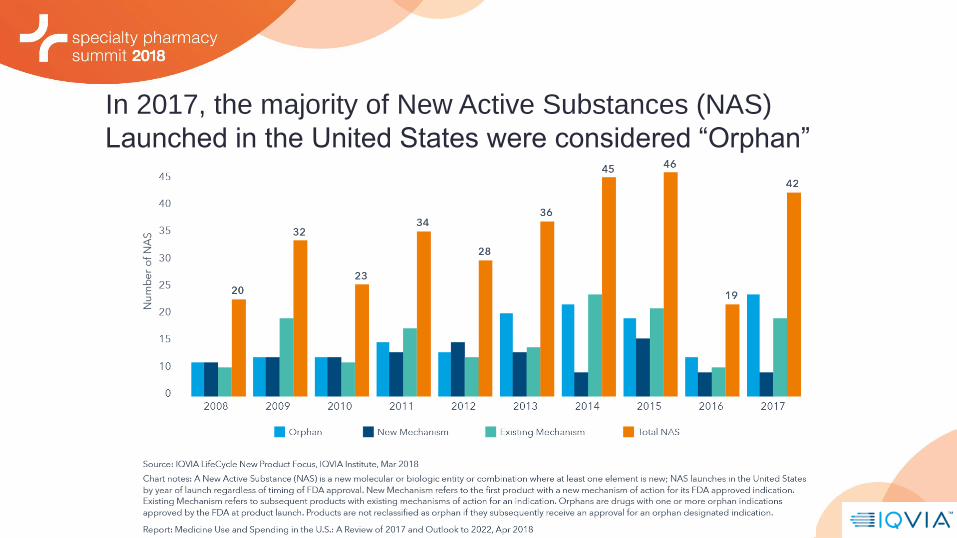
In 2017, the majority of New Active Substances (NAS)
Launched in the United States were considered “Orphan”

DRAFT: 4/17/18
Oncology, infectious disease, and CNS are the areas with the
most launches in 2017
Source: IQVIA, National Sales Perspectives
Digestive and Metabolic (non-
diabetes) 7%

DRAFT: 4/17/18
IQVIA’s Top 2017 Performers
Product Company Indication Launch Year 1 Sales
to date Specialty / Traditional
Biologic/ Small Molecule
Ocrevus Genentech Multiple sclerosis Apr-17 $1.1B Specialty Biologic
Mavyret AbbVie Hepatitis C Aug-17 $480M Specialty Small Molecule
Dupixent Sanofi/ Regeneron
Moderate-to-severe atopic dermatitis Mar-17 $319M Specialty Biologic
Spinraza Biogen Spinal muscular atrophy Feb-17 $240M* Specialty Antisense Oligo
Vosevi Gilead Hepatitis C Jul-17 $221M Specialty Small Molecule
Eucrisa Pfizer Mild atopic dermatitis Feb-17 $133M Traditional Small Molecule
Radicava Mitsubishi Tanabe Amyotrophic lateral sclerosis Aug-17 $86M Specialty Small Molecule
Kisqali Novartis Breast cancer Mar-17 $79M Specialty Small Molecule
Tremfya Janssen Plaque psoriasis Jul-17 $72M Specialty Biologic
Soliqua Sanofi Diabetes Jan-17 $68M Traditional Hormone
Sales through Jan 2018
Source: IQVIA, National Sales Perspectives *Likely understated owing to product reporting blocks

DRAFT: 4/17/18
Nephron Pharma Price Auditor: March Gx deflation is
-7.5%; Bx inflation 7.2%
Source: Nephron Research, Glass Box Analytics, IQVIA
7.2%
-7.5%

DRAFT: 4/17/18
Consumer price index is above estimated brand net price
growth for the first time

DRAFT: 4/17/18
In 2017, Janssen’s weighted average list prices grew by 8.1%,
while average net prices declined by 4.6%
Source: Drug Channels, Janssen’s New Transparency Report: A Peek Behind the Drug Pricing Curtain Raises Troubling Questions About Rebates, March 2018
DRAFT: 4/17/18
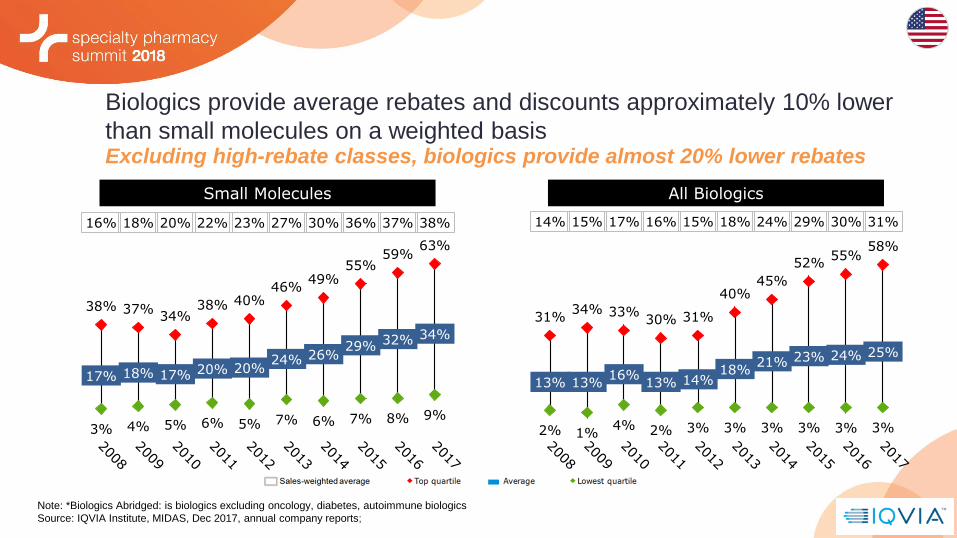
Biologics provide average rebates and discounts approximately 10% lower
than small molecules on a weighted basis Excluding high-rebate classes, biologics provide almost 20% lower rebates
38% 37% 34%
38% 40% 46%
49% 55%
59% 63%
17% 18% 17% 20% 20% 24% 26%
29% 32% 34%
3% 4% 5% 6% 5% 7% 6% 7% 8% 9%
16% 18% 20% 22% 23% 27% 30% 36% 37% 38%
31% 34% 33%
30% 31%
40% 45%
52% 55%
58%
13% 13% 16%
13% 14% 18%
21% 23% 24% 25%
2% 1% 4% 2% 3% 3% 3% 3% 3% 3%
14% 15% 17% 16% 15% 18% 24% 29% 30% 31%
Small Molecules All Biologics
Note: *Biologics Abridged: is biologics excluding oncology, diabetes, autoimmune biologics
Source: IQVIA Institute, MIDAS, Dec 2017, annual company reports;

DRAFT: 4/17/18
Specialty is continuing to show value growth in the current calendar year
(+$16.8BN), while traditional value growth is declining (-$10.7BN)
Source: IQVIA, National Sales Perspectives, April 2018
$16.8
$91.0
-$10.7
$28.0
$6.1
$119.0
-$25
-$5
$15
$35
$55
$75
$95
$115
2016-2017 2013-2017Ab
solu
te V
alu
e G
row
th (
US$
BN
s)
Specialty and Traditional Year over Year Value Growth
SPECIALTY TRADITIONAL

DRAFT: 4/17/18
Autoimmune and oncology are driving value growth in specialty;
viral hepatitis value growth is declining year over year since 2015
Source: IQVIA, National Sales Perspectives, April 2018
$2.7
$3.0
$1.8
$10.3
$4.9
$5.2
$4.9
$2.5
$2.1
$6.6
$6.0
$7.3
$4.6
$0.1 $2.5
-$3.9
$6.1
$7.6
$4.8
$1.2
$1.9
-$4.1
$5.2
$7.7
-$10.0 -$5.0 $0.0 $5.0 $10.0 $15.0 $20.0 $25.0 $30.0
ALL OTHER
MULTIPLE SCLEROSIS
HIV ANTIVIRALS
VIRAL HEPATITIS
ONCOLOGICS
AUTOIMMUNE DISEASES
Year over Year Spending Growth (US$ in BNs)
2013-2014 2014-2015 2015-2016 2016-2017
Top Specialty Therapy Areas – Absolute Value Growth
DRAFT: 4/17/18
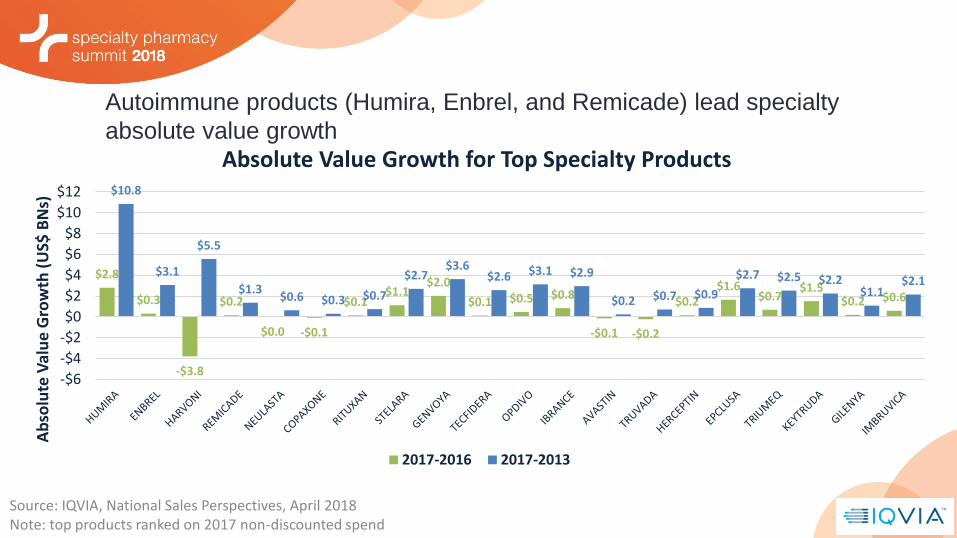
Autoimmune products (Humira, Enbrel, and Remicade) lead specialty
absolute value growth
Source: IQVIA, National Sales Perspectives, April 2018 Note: top products ranked on 2017 non-discounted spend
$2.8
$0.3
-$3.8
$0.2
$0.0 -$0.1
$0.1 $1.1
$2.0
$0.1 $0.5 $0.8
-$0.1 -$0.2
$0.2 $1.6
$0.7 $1.5
$0.2 $0.6
$10.8
$3.1
$5.5
$1.3 $0.6 $0.3 $0.7
$2.7 $3.6
$2.6 $3.1 $2.9
$0.2 $0.7 $0.9
$2.7 $2.5 $2.2 $1.1
$2.1
-$6
-$4
-$2
$0
$2
$4
$6
$8
$10
$12
Ab
solu
te V
alu
e G
row
th (
US$
BN
s)
Absolute Value Growth for Top Specialty Products
2017-2016 2017-2013

DRAFT: 4/17/18
Biosimilar uptake in the US is modest to date
DRAFT: 4/17/18
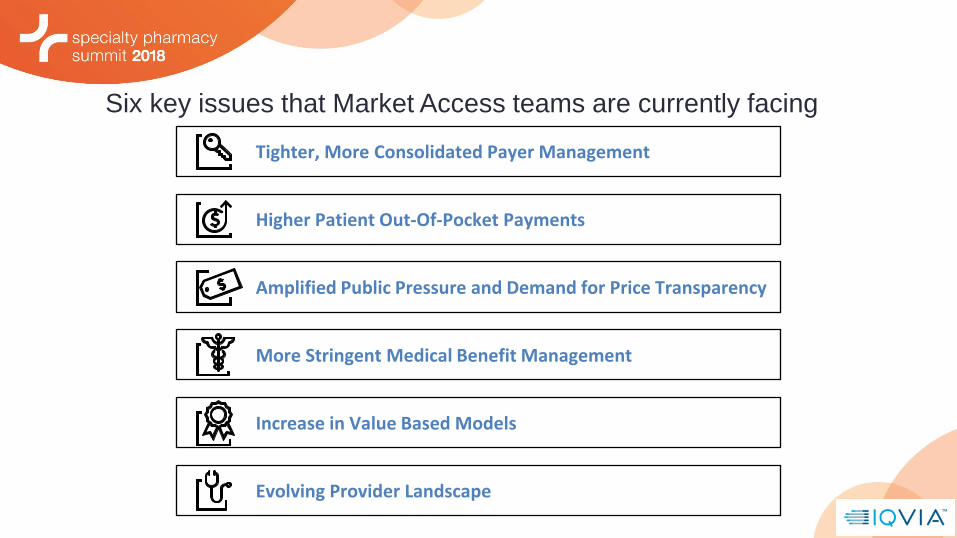
Six key issues that Market Access teams are currently facing
Amplified Public Pressure and Demand for Price Transparency
More Stringent Medical Benefit Management
Increase in Value Based Models
Higher Patient Out-Of-Pocket Payments
Tighter, More Consolidated Payer Management
Evolving Provider Landscape
DRAFT: 4/17/18
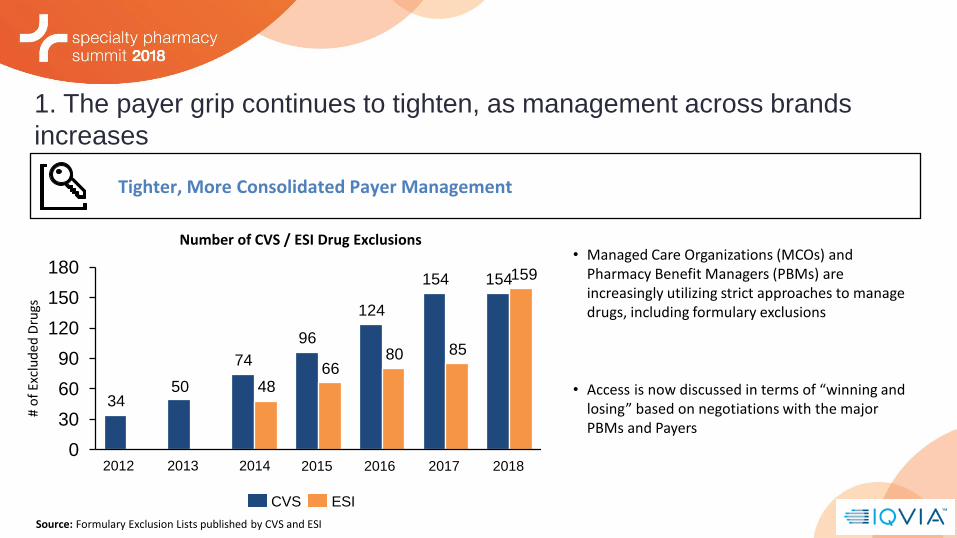
1. The payer grip continues to tighten, as management across brands
increases
Tighter, More Consolidated Payer Management
34 50
74
96
124
154 154
48 66
80 85
159
0
30
60
90
120
150
180
2018 2012
# o
f Ex
clu
ded
Dru
gs
2017 2013 2016 2015 2014
ESI CVS
Number of CVS / ESI Drug Exclusions • Managed Care Organizations (MCOs) and
Pharmacy Benefit Managers (PBMs) are increasingly utilizing strict approaches to manage drugs, including formulary exclusions
• Access is now discussed in terms of “winning and losing” based on negotiations with the major PBMs and Payers
Source: Formulary Exclusion Lists published by CVS and ESI

DRAFT: 4/17/18
2. Patients are facing increasing financial pressure, as payers are transferring a
higher percentage of costs to patients
Higher Patient Out-Of-Pocket Payments
$338 $350 $366 $383 $401 $424 $446 $469 $492 $517 $542
$0
$500
$250
$750
+5% CAGR
2021 2020 2019 2018 2017 2016 2015
+4% CAGR
2025 2024 2023 2022
US Out-of-Pocket Health Spending (in $USD Billions) Average Commercial Co-
pay Increase (2016-2017)*
14%
Source: CMS National Health Expenditure Accounts Data; IQVIA Formulary Impact Analyzer (FIA); *Excludes buy-and-bill and hospital products

DRAFT: 4/17/18
Deductible plans are increasingly common and deductible levels
are rising
Cumulative Increases in Deductibles, Premiums, Wages and Inflation
Source: Kaiser/HRET Survey of Employer-Sponsored Health Benefits, 1999-2015. Bureau of Labor Statistics, Consumer Price
Index, U.S. City Average of Annual Inflation (April to April), 1999-2015; Bureau of Labor Statistics, Seasonally Adjusted Data
from the Current Employment Statistics Survey, 1999-2015 (April to April).
6%
63%
19% 21%
133%
-20%
0%
20%
40%
60%
80%
100%
120%
140%
160%
2011 2012 2013 2014 2015 2016
Overall Inflation
Single Coverage Deductibles, all Workers
Single Coverage Premiums
Medicine Net Manufacturer Revenues
% of Patients With a Deductible Plan

DRAFT: 4/17/18
Almost 1 in 4 prescriptions are abandoned by patients
during their deductible phase Abandonment Rates for Branded Medicines
9%
23%
27%
No Deductible Brands with Deductible Specialty Brands with Deductible
Source: Amundsen Consulting (a division of QuintilesIMS) analysis for PhRMA; IMS FIA; Rx Benefit Design, 2015
DRAFT: 4/17/18
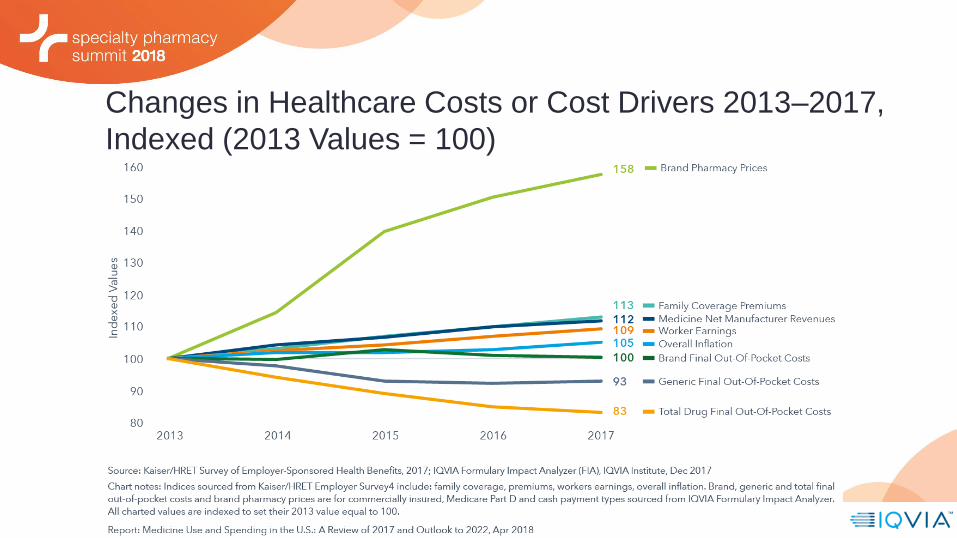
Changes in Healthcare Costs or Cost Drivers 2013–2017,
Indexed (2013 Values = 100)

DRAFT: 4/17/18
3. New environment of stricter pricing scrutiny and demand for transparency
Amplified Public Pressure and Demand for Price Transparency
Increased Public Scrutiny on Drug Pricing Number of State Bills Introduced on Price Transparency (2015-2017)
20
10
0
5
15
25
2015
8*
2
4
2
2017
22***
12
9
1
2016 N
um
ber
of
bill
s
2
14
2 18**
Maximum Allowable Price
Net Price Disclosure
List Price Increases
*AR, CA, MA, ME, NC, NY, OR **CA, CO, LA, MD, MN, NJ, RI, TN, VA, VT, WA ***CA, CT, IL, IN, LA, MA, MD, MT, NV, NY, OR, RI, TN, WA

DRAFT: 4/17/18
4. Medical benefit drugs will no longer be protected, as payers are developing
new capabilities to manage the medical benefit
Increased Medical Benefit Management Techniques Development of Vertically Integrated Payer Models
More Stringent Medical Benefit Management
+
+
Increased vertical integration between PBMs and MCOs leads to increased ability to manage both pharmacy and medical cost
As specialty drugs have become increasingly costly, payers have implemented more utilization management techniques for medical benefit drugs
Developing medical formularies
Increased utilization management
Shifting medical benefit drugs to the pharmacy benefit
Site-of-care management
+

DRAFT: 4/17/18
5. Value frameworks are expanding influence, and use of value-based payment
models and innovative agreements has increased
Increase in Value Based Models
Evidence BlocksTM
Drug Abacus
Value Framework
Value Framework
Mag. of Clinical Benefit Scale
Value framework
June 2015
Oct. 2015
Sept. 2015
June 2015
May 2015
Nov 2016
Launch date
Development of Value Frameworks
• Novartis negotiated pay-for-performance agreements with Aetna and Cigna ‒ Cigna: Payments depend on
patient hospitalization rates ‒ Aetna: Payments linked to
delivering real-world results similar to those seen in clinical trials
Recent Examples of Value-Based Payment Models
• Amgen negotiated outcomes-based agreements with Harvard Pilgrim ‒ Amgen will pay a refund for all
eligible patients who had a heart attack or stroke while on Repatha

DRAFT: 4/17/18
6. Finally, the provider landscape is constantly evolving,
with continued growth in the number of IDNs and ACOs
Evolving Provider Landscape
• To streamline care and costs, providers are merging to form integrated delivery networks (IDNs)
• Lines are also blurring between providers and payers through the formation of vertically integrated accountable care organizations (ACOs)
• IDNs / ACOs have become more influential in prescribing decisions and have demonstrated willingness to manage drug utilization at the class level

DRAFT: 4/17/18
Late Phase R&D Pipeline by Top Therapy Areas

DRAFT: 4/17/18
10 key turnings points in 2018 Harbingers of change for the outlook to 2022
Innovation trends
Medicine spending growth drivers
New approaches to value
• Real-world data use in clinical practice guided by FDA • Next-generation biotherapeutics move toward mainstream • Apps make their way into treatment guidelines • Telehealth usage surges
• Branded medicine spending in developed markets falls • Specialty medicines drive all spending growth in developed markets • Slower growth in China and other pharmerging markets
• U.S. real net per capita spending on medicines steadies • Outcomes-based contracts find limited role • New wave of biosimilar market opportunities emerges
DRAFT: 4/17/18
Good Morning, Asembia!
Adam J. Fein, Drug Channels Institute
Lisa Gill, J.P. Morgan Securities
Doug Long, IQVIA

DRAFT: 4/17/18
Additional Material

DRAFT: 4/17/18
DRAFT: 4/17/18

DRAFT: 4/17/18

DRAFT: 4/17/18

DRAFT: 4/17/18
Disclaimer:
• The analyses, their interpretation, and related information contained herein are made and provided subject to the assumptions, methodologies, caveats, and variables described in this report and are based on third party sources and data reasonably believed to be reliable. No warranty is made as to the completeness or accuracy of such third party sources or data.
• As with any attempt to estimate future events, the forecasts, projections, conclusions, and other information included herein are subject to certain risks and uncertainties, and are not to be considered guarantees of any particular outcome.
• All reproduction rights, quotations, broadcasting, publications reserved. No part of this presentation may be reproduced or transmitted in any form or by any means, electronic or mechanical, including photocopy, recording, or any information storage and retrieval system, without express written consent of IQVIA.
• ©2018 IQVIA Incorporated and its affiliates. All rights reserved. Trademarks are registered in the United States and in various other countries.
Thank you

DRAFT: 4/17/18
Please rate this session in the 2018 Summit mobile app.
Thank you!