Embed Size (px)
Citation preview
What’s Happening?!What’s Happening?!Chief Information Officers (CIOs) expect IT budgets to increase by 2.5 percent in 2005, and believe their focus will be on supporting business growth and results, according to a survey by Gartner Inc.
In the past few years, CIOs have had to focus on internal efficiency and cost control, while preparing their organization for an economic upswing.
CIOs voiced concerns about their relationship with the CEO and whether they have the right people to meet current and future business needs.
Ted Kennedy says that the solution for run-away costs with Medicare is Information Technology.

ATP ClinicATP Clinic
Tomorrow, Wednesday at 4 to 5 PMTomorrow, Wednesday at 4 to 5 PM Baskin Engineering, room 318.Baskin Engineering, room 318. Leslie Clark will run the session.Leslie Clark will run the session.

ISM ToastmastersISM Toastmasters
First session on Thursday at noon.First session on Thursday at noon.
Engineering II building – room 280.Engineering II building – room 280.
Chapter 3Chapter 3
The Porter Competitive Model for The Porter Competitive Model for
Industry Structure AnalysisIndustry Structure Analysis

AgendaAgenda
Porter Competitive ModelPorter Competitive Model– ObjectivesObjectives– Generic ExampleGeneric Example– Specific ExampleSpecific Example
Value Chain ModelValue Chain Model– Generic ExampleGeneric Example– Specific ExampleSpecific Example
Competitive StrategiesCompetitive Strategies
Porter Model ObjectivesPorter Model Objectives Build barriers to prevent a company from entering an industry
Build in costs that would make it difficult for a customer to switch to another supplier
Change the basis for competition within the industry
Change the balance of power in the relationship that a company has with customers or suppliers
Provide the basis for new products and services, new markets or other new business opportunities

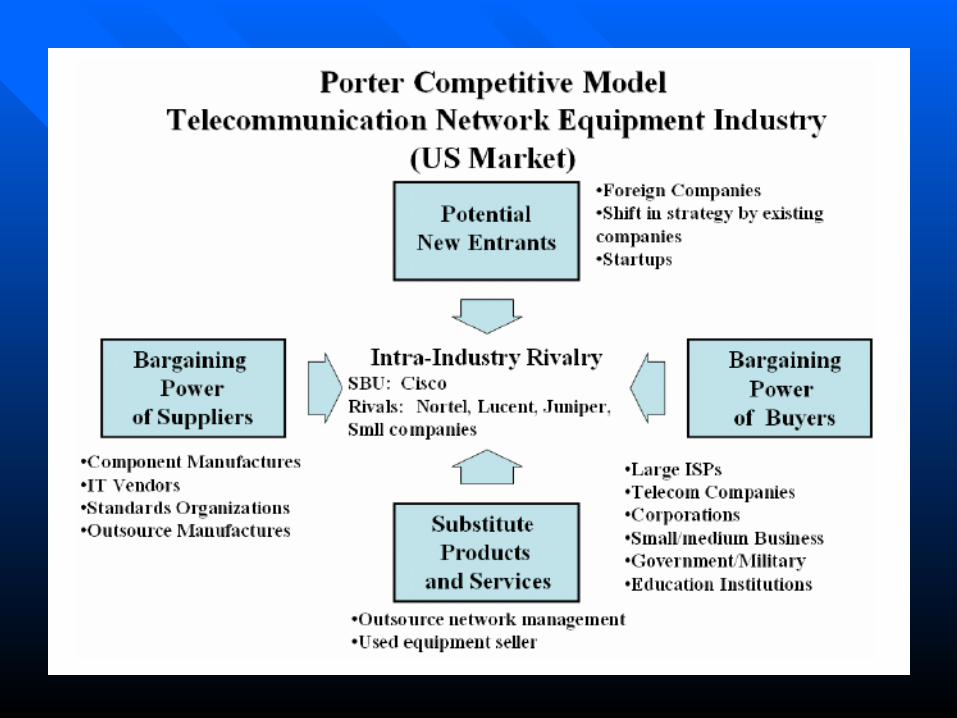
Intra-Industry Rivalry
Strategic Business Unit
BargainingPower
of Buyers
Bargaining Power
of Suppliers
Substitute Products
and Services
PotentialNew Entrants
Figure 3-1
Source: Michael E. Porter“Forces Governing Competition in IndustryHarvard Business Review, Mar.-Apr. 1979
Porter Competitive ModelPorter Competitive Model

INBOUNDLOGISTICS
OPERATIONS OUTBOUNDLOGISTICS
MARKETING AND SALES
SERVICE
PRIMARY ACTIVITIES
PROCUREMENT
TECHNOLOGY DEVELOPMENT
HUMAN RESOURCE MANAGEMENT
FIRM INFRASTRUCTURE
SU
PP
OR
T A
CT
IVIT
IES
Figure 3-6Adapted with the permission of the Free Press, an imprint of Simon & Schuster Inc.. from COMPETITIVE ADVANTAGE: Creating and Sustaining Superior Performance by Michael Porter. Copyright © 1985 by Michael E. Porter.
Generic Value ChainGeneric Value Chain

Value Chain Model – US Department of JusticeValue Chain Model – US Department of Justice

Competitive StrategiesCompetitive Strategies
Primary StrategiesPrimary Strategies
Differentiation StrategyDifferentiation Strategy Low-Cost StrategyLow-Cost Strategy
SupportingSupporting StrategiesStrategies
InnovationInnovation GrowthGrowth AllianceAlliance

Examples of Wal-Mart Examples of Wal-Mart StrategiesStrategies
Primary Strategy: Least Cost as evidenced by its every-day low prices sales strategy.
Supporting Strategies:Innovation: In both business processes and the use of information systems.Growth: Sales volume growth adds to their ability to leverage purchasing discounts from suppliers and gain operational productivity.Alliances: Joint efforts with suppliers to implement leading edge e-business processes.

Possible Exam QuestionsPossible Exam Questions
1. To date we have addressed three models developed by Michael Porter: Diamond of National Advantage, Competitive Model and Value Chain. Explain the objective to be gained from using each of these models.
2. Identify three mistakes that are often made in using the Porter Competitive Model.
Chapter 4 IntroductionChapter 4 Introduction
Airline Industry AnalysisAirline Industry Analysis
Objectives and Key PointsObjectives and Key Points
History and Deregulation in 1978History and Deregulation in 1978 Recommendations to ensure strong Recommendations to ensure strong
competitioncompetition Analysis of the Airline Industry using the Analysis of the Airline Industry using the
Porter Competitive ModelPorter Competitive Model Airline Industry Business Strategy ModelAirline Industry Business Strategy Model Two Successful AirlinesTwo Successful Airlines Importance of IT in the Airline IndustryImportance of IT in the Airline Industry

Industry HistoryIndustry History
Wright brothers’ first successful flight in Kitty Wright brothers’ first successful flight in Kitty Hawk in 1903. Hawk in 1903.
American Airlines in 1928 and United Airlines in American Airlines in 1928 and United Airlines in 1931.1931.
Development of the mail system by the U.S. Development of the mail system by the U.S. Postal Service helped create the airline industry. Postal Service helped create the airline industry.
Increased R&D of aircraft after World War II.Increased R&D of aircraft after World War II. FAA created in 1958 to develop an air traffic FAA created in 1958 to develop an air traffic
control system.control system. Deregulation in 1978.Deregulation in 1978.

Some Necessary BackgroundSome Necessary Background
Deregulation – Entry and exit of routes and the Deregulation – Entry and exit of routes and the pricing of fares were deregulated.pricing of fares were deregulated.
Benefits:Benefits:
1. The creation of new jobs and lower fares.1. The creation of new jobs and lower fares.
2. More Americans were flying so airplane 2. More Americans were flying so airplane load factors were up. load factors were up.
3. There was increased competition and a 3. There was increased competition and a wider choice for passengers. wider choice for passengers.
Does the airline industry have basic structural Does the airline industry have basic structural problems or is it just a collection of poorly problems or is it just a collection of poorly
managed companies? managed companies?
Question raised by Presidential Commission addressing the competitiveness of the industry

Presidential Commission Report Presidential Commission Report RecommendationsRecommendations
Reducing the burden of regulation.Reducing the burden of regulation. Reducing the tax burden.Reducing the tax burden. Moving beyond nationalism in the air Moving beyond nationalism in the air
service.service. Modernizing the air traffic control system.Modernizing the air traffic control system.

Porter Competitive ModelPorter Competitive Model
Intra-Industry RivalrySBU: American AirlinesNetwork (traditional) Rivals: United, Delta, Northwest, US AirLow-cost Rivals: Southwest, JetBlue, ATA
BargainingPower of Buyers
Bargaining Power
of Suppliers
Substitute Products
and Services
PotentialNew Entrants
Airline Industry Analysis – U.S. Market
•Travel Agents •Business Travelers•Pleasure Travelers•Charter Service•Federal Government•U.S. Military•Cargo and Mail
•Alternate Travel Services•Fast Trains•Boats
•Private Transportation•Videoconferencing•Groupware
•Aircraft Manufacturers•Aircraft Leasing Companies•Labor Unions•Food Service Companies•Fuel Companies•Airports•Local Transportation Service •FAA•Hotels
•Foreign Carriers•Regional Carrier Start ups•Cargo Carrier Business Strategy Change
Figure 4-2

Airline Industry StrategiesAirline Industry Strategies
North AmericaNorth America EuropeEurope AsiaAsia Latin AmericaLatin America
IndependentIndependent AlliancesAlliances Code SharingCode Sharing
Markets
Routes and Route Structure
Short HaulShort Haul Long HaulLong Haul
Hub and SpokeHub and Spoke Point to PointPoint to Point
Company Structure
Information Systems
Customer Systems Operational Systems Logistical Systems Business SystemsCustomer Systems Operational Systems Logistical Systems Business Systems
Scheduled Flights Chartered Flights Air Freight Mail
Products/Services
Business Travelers Personal Travelers Seniors Families Government
Customers
Low FaresLow Fares Premium FaresPremium Fares
Fare Strategy

Two Successful AirlinesTwo Successful Airlines
1.1. Southwest AirlinesSouthwest Airlines
2.2. Singapore AirlinesSingapore Airlines

Importance of ITImportance of IT
Convenience to Customers.Convenience to Customers. Knowledge of Customers.Knowledge of Customers. Providing a Foundation of Other Systems.Providing a Foundation of Other Systems. Building a Base for other Business.Building a Base for other Business.
Can be assessed through the use of the Can be assessed through the use of the Value Chain.Value Chain.

ConclusionsConclusions
A clearly structured industry.A clearly structured industry. Vital role of Information Systems in the Vital role of Information Systems in the
industry.industry. The industry is greatly affected by many The industry is greatly affected by many
factors.factors. Strategies dictated by the market are Strategies dictated by the market are
crucial.crucial. Still regulated. Still regulated.

Chapter 4Chapter 4
Porter Competitive Model Porter Competitive Model
and and
the Airline Industrythe Airline Industry

Key PointsKey Points
Analysis of the Airline Industry using the Porter Analysis of the Airline Industry using the Porter
Competitive ModelCompetitive Model
Airline Industry Business Strategy ModelAirline Industry Business Strategy Model
Lessons Learned from Profitable Airlines Lessons Learned from Profitable Airlines
A Perspective of the Challenges of the IndustryA Perspective of the Challenges of the Industry
A Historical PerspectiveA Historical Perspective
Importance of IT in the IndustryImportance of IT in the Industry

U.S. Airline IndustryU.S. Airline Industry
Does the airline industry have basic structural problems or is it just a collection of poorly managed companies?
Question raised by 1993 Presidential Commission addressing the competitiveness of the industry

This industry is always in the
grip of its dumbest competitors.
Robert CrandallFormer CEOAmerican Airlines
We must look at the world as it is versus how airlines would like it to be.
Robert L. Crandall
And as government officials, politicians and consumers would like it to be.

Airline Industry GoalsAirline Industry Goals
Public Service. (Service to Customers)
Return to Investors.
Country Strategic Resource.
Are these consistent or in frequent conflict?

Porter Competitive ModelPorter Competitive Model
Intra-Industry RivalrySBU: American Airlines Network Rivals: United, Delta, US Air, NorthwestLow-cost Rivals: Southwest,JetBlue, ATA, etc.
BargainingPower of Buyers
Bargaining Power
of Suppliers
Substitute Products
and Services
PotentialNew Entrants
Airline Industry Analysis – U.S. Market
•Travel Agents •Business Travelers•Leisure Travelers•Charter Service•Federal Government•U.S. Military•Cargo and Mail
•Alternate Travel Services•Fast Trains•Boats
•Private Transportation•Videoconferencing•Groupware
•Aircraft Manufacturers•Aircraft Leasing Companies•Labor Unions•Food Service Companies•Fuel Companies•Airports•Local Transportation Service •FAA•Hotels
•Foreign Carriers•Regional Carrier Start ups•Cargo Carrier Business Strategy Change
Figure 4-2

Europe North American Pacific Rim
Short Haul Long Haul
Hub and Spoke Point to Point
Low Fare Premium Fare
Independent Alliances
Figure 4-1
Latin American
Passengers Operations Logistics Business
Product/Service StrategyScheduled Passengers
Charter Services Cargo
Mail Air Express
Code Sharing
Business Strategy
Model –
Airline Industry
Customer/Fare/Market StrategyBusiness Travelers
Leisure Travelers
Senior Citizens
First Time Flyers
Frequent Flyers
Sales Strategy
Reservation Agents Travel Agents Web Page
Super Saver
Routes and Route Structure Strategies
Company Structure Strategy
Information Systems Strategy

Airline Industry Value ChainAirline Industry Value Chain
INBOUNDLOGISTICS
OPERATIONS OUTBOUNDLOGISTICS
MARKETING AND SALES
SERVICE
PROCUREMENT
TECHNOLOGY DEVELOPMENT
HUMAN RESOURCE
MANAGEMENT
FIRM INFRASTRUCTURE
Adapted with the permission of Michael E. Porter from Competitive Advantage: Creating and Sustaining Superior Performance, copyright 1985 by Michael E. Porter.
-Financial Policy - Accounting -Regulatory Compliance - Legal - Community Affairs
Pilot TrainingSafety Training
Agent Training
In-flight Training
Baggage Tracking System
•Promotion•Advertising•Advantage Program•Travel Agent Programs•Group Sales
•Ticket Counter Operations•Gate Operations•Aircraft Operations•On-board Service•Baggage Handling•Ticket Offices
•Route Selection•Passenger Service System•Yield Management System (Pricing)•Fuel •Flight Scheduling•Crew Scheduling•Facilities Planning•Aircraft Acquisition
Information TechnologyCommunications
Product DevelopmentMarket Research
•Lost Baggage Service•Complaint Follow-up
•Baggage System•Flight Connections•Rental Car and Hotel Reservation System
Computer Reservation System, In-flight SystemFlight Scheduling System, Yield Management System
Baggage HandlingTraining
Flight, route andyield analysttraining
Figure 4-3

Suppliers Services PassengersTravel & Tourism
Airline IndustryCarriers, General Aviation, Airports
• Aircraft
• Engines
• Electronics
• Computers
• Chemicals
• Insurance• Financing• Distribution• Telecom• Maintenance• Fuel
• Business Travelers
• Leisure Travelers
• Travel Agents• Tourist Attractions• Conferences and Conventions• Hotels• Restaurants• Retailers
Lower Sales
Lower Sales
Decreased Productivity & Weaker Relationships
Lost Revenue
Impacts of a Weakened Airline Industry
Induced Costs

Airline Related StatisticsAirline Related Statistics
The total economic impact of the airline industry is The total economic impact of the airline industry is approximately $900 billion or 9% of the U.S. GDP.approximately $900 billion or 9% of the U.S. GDP.
Ten million people owe their jobs directly or indirectly to Ten million people owe their jobs directly or indirectly to the airline industry.the airline industry.
U. S. leisure travelers spent $187 billion in 2000. This was U. S. leisure travelers spent $187 billion in 2000. This was 7% less in 2001.7% less in 2001.
A financially viable airline industry is necessary for a healthy U.S. economy.
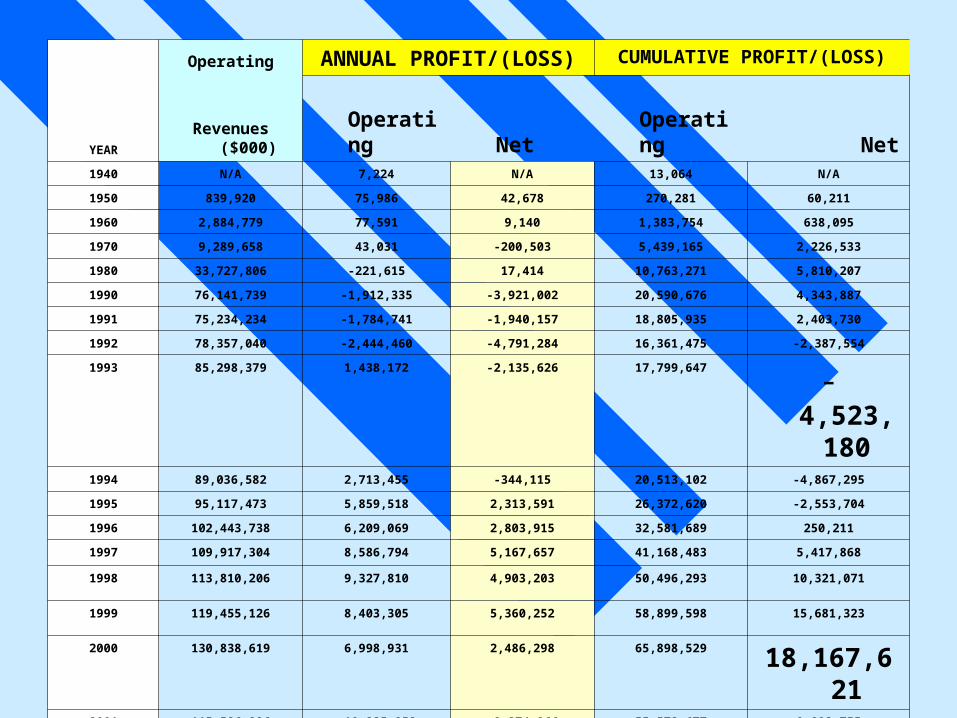
YEAR
Operating ANNUAL PROFIT/(LOSS) CUMULATIVE PROFIT/(LOSS)
Revenues ($000) Operating Net Operating Net1940 N/A 7,224 N/A 13,064 N/A
1950 839,920 75,986 42,678 270,281 60,211
1960 2,884,779 77,591 9,140 1,383,754 638,095
1970 9,289,658 43,031 -200,503 5,439,165 2,226,533
1980 33,727,806 -221,615 17,414 10,763,271 5,810,207
1990 76,141,739 -1,912,335 -3,921,002 20,590,676 4,343,887
1991 75,234,234 -1,784,741 -1,940,157 18,805,935 2,403,730
1992 78,357,040 -2,444,460 -4,791,284 16,361,475 -2,387,554
1993 85,298,379 1,438,172 -2,135,626 17,799,647
-4,523,1801994 89,036,582 2,713,455 -344,115 20,513,102 -4,867,295
1995 95,117,473 5,859,518 2,313,591 26,372,620 -2,553,704
1996 102,443,738 6,209,069 2,803,915 32,581,689 250,211
1997 109,917,304 8,586,794 5,167,657 41,168,483 5,417,868
1998 113,810,206 9,327,810 4,903,203 50,496,293 10,321,071
1999 119,455,126 8,403,305 5,360,252 58,899,598 15,681,323
2000 130,838,619 6,998,931 2,486,298 65,898,529 18,167,6212001 115,526,896 -10,325,852 -8,274,866 55,572,677 9,892,755
2002 106,985,463 -8,566,412 -11,312,415 47,006,265 -1,419,660
2003 115,906,315 -2,200,450 -3,624,682 44,807,448
-5,042,7102004 2004 results expected from U.S. DOT in June 2005

Aviation Week ContentionsAviation Week Contentions
U.S. major hub-and-spoke carriers are being forced to restructure their operations or face the prospect of eventually going out of business.
The crux of the problem is a combination of excessive costs in relation to carriers' current and projected revenues, an imbalance between the supply and demand for available airline seats, and an inability to boost air fares.
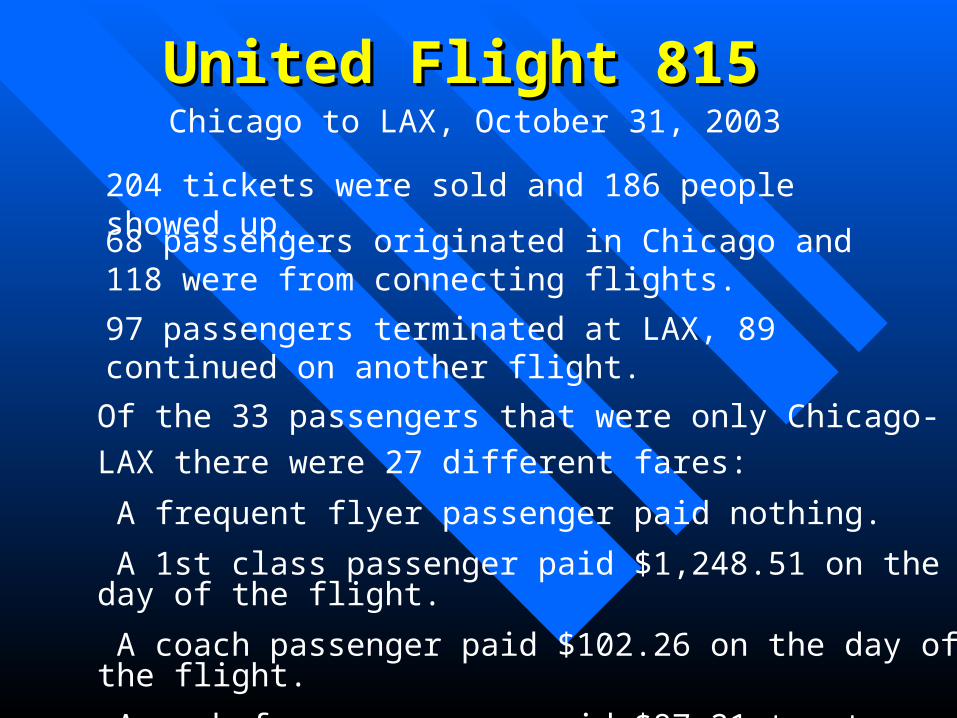
United Flight 815 United Flight 815 Chicago to LAX, October 31, 2003
204 tickets were sold and 186 people showed up.
68 passengers originated in Chicago and 118 were from connecting flights.
97 passengers terminated at LAX, 89 continued on another flight.
Of the 33 passengers that were only Chicago-LAX there were 27
different fares:
A frequent flyer passenger paid nothing.
A 1st class passenger paid $1,248.51 on the day of the flight.
A coach passenger paid $102.26 on the day of the flight.
A cash fare passenger paid $87.21 twenty-nine days in advance .

Airline ProfitabilityAirline Profitability
In order to survive and profit in this tough environment, airlines attempt to manipulate three main variables:
Cost, calculated as total operating expenses divided by available seat miles (ASM)
Yield, calculated as total operating revenues divided by the number of revenue passenger miles (RPM)
Load Factor, calculated as the ratio between RPMs and ASMs, which measures capacity utilization.
Profitability = [yield X load factor] - cost
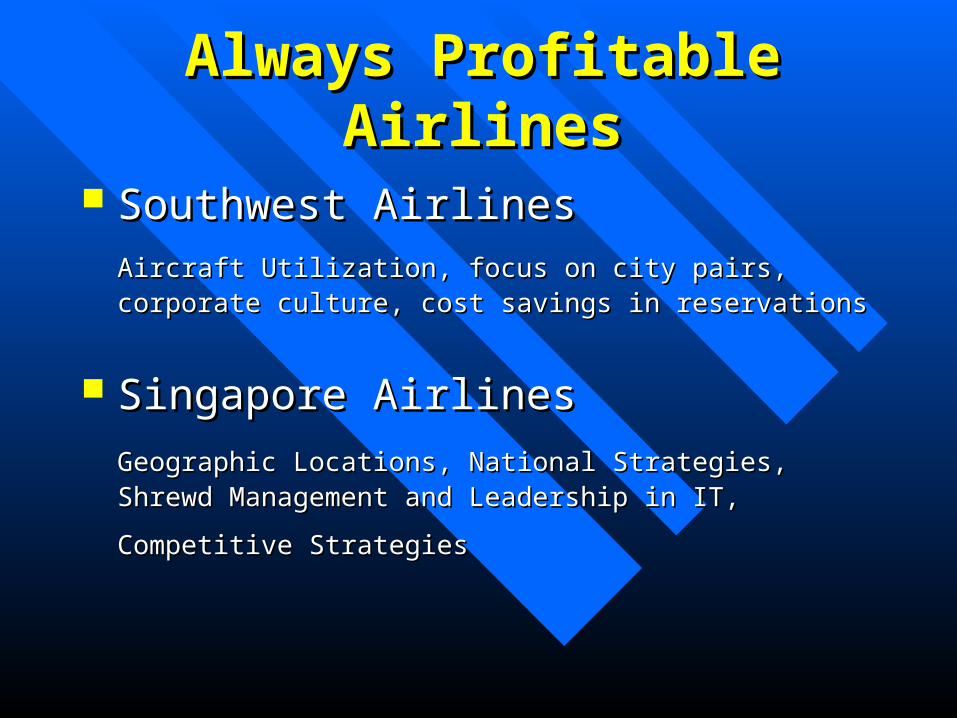
Always Profitable AirlinesAlways Profitable Airlines
Southwest AirlinesSouthwest Airlines
Aircraft Utilization, focus on city pairs, corporate culture, cost savings Aircraft Utilization, focus on city pairs, corporate culture, cost savings in reservationsin reservations
Singapore AirlinesSingapore Airlines
Geographic Locations, National Strategies, Shrewd Management and Geographic Locations, National Strategies, Shrewd Management and
Leadership in IT, Competitive StrategiesLeadership in IT, Competitive Strategies

Southwest AirlinesSouthwest Airlines A U.S. carrier success story. Commuter airline that concentrates on city pairs.
(Average flight is 541 miles and takes about one hour)
CEO Herb Kelleher, a Connecticut attorney turned Texan, had the best labor relations in the industry and an excellent company culture.
Lowest cost structure in the industry. 31 years of consecutive profitability

Why Southwest is SuccessfulWhy Southwest is Successful
1. The success of Southwest starts with the following three important factors: 1) Focus, 2) focus and 3) focus.
2. Standardizing their fleet on the Boeing 727 provides major operational and financial benefits. 3. Herb Kelleher as one of the founders and the long time
CEO should probably be cited as the number one reason for the success of this airline.
4. Focus on high volume city to city routes.

Southwest SuccessSouthwest Success
5. Southwest came into the deregulated era of the industry as a small, intra-state airline that had always been able to compete on the terms that they chose since they were not subject to federal regulation.
6. The financial success of Southwest has received a large amount of free publicity that has certainly helped to create an image of an airline to be trusted and used by many passengers.

Best Airlines for Business TravelersBest Airlines for Business Travelers
1. Singapore Airlines2. Swiss Air3. Cathay Pacific4. Midwest Express **5. Japan Airlines6. Quantas7. ANA8. Virgin Atlantic9. Lufthansa10. KLM-Royal Dutch
11. Finnair
12. British Airways
13. Alaska
14. Air France
15. Varig
16. Aer Lingus
17. Kiwi
18. Air Canada
19. American **
20. Delta**
Source: Zagat Survey of Frequent Flyers

Singapore AirlinesSingapore Airlines
Winner of multiple awards for “airline excellence.”
Leader of the Orient Airlines Association (OAA)
– Abacus reservation system.
– Price collusion on major routes. Outsourced IS application development. Nervous regarding U.S. carrier price competition.

Why SIA is SuccessfulWhy SIA is Successful
1. Singapore has always been only an international carrier and focused accordingly on global competitiveness through quality customer service.
2. The airline is an integral part of the country strategy to be the center for commerce and travel within Southeast Asia.
3. The success of the country strategies promotes travel demands.
4. SIA has been blessed with excellent senior management.

SIA Success FactorsSIA Success Factors
5. While suggested above, the point needs to be made that excellent management is capable and willing to do aggressive things and take chances when it feels that it is prudent to do so.
6. Prudent financial management has been a major strength of the airline.
7. SIA had a labor cost advantage during its early years.
8. There were no comparable competitors in Southeast Asia.

Major Airline IssuesMajor Airline Issues
1. Dysfunctional labor situation.
2. High taxes, fees and other government-mandated costs.
3. Inadequate long-term plans for air and ground infrastructure.
4. Restrictions on airline consolidation and foreign investment.

Earnings for Paid HoursEarnings for Paid Hours
Based on a U.S. survey of 437 professions in 2001.Based on a U.S. survey of 437 professions in 2001.
Pilots includes regional, commuters and general Pilots includes regional, commuters and general aviation.aviation.
Transportation attendants includes airline flight Transportation attendants includes airline flight attendants.attendants.

Rank Occupation Hourly Weekly
Earnings Hours
1 Pilots $107.22 21.9
2 Lawyers $59.78 41.4
21 Math Teachers $37.51 38.9
33 Electrical Engineers $34.56 41.0
37 Financial Managers $34.29 40.4
45 Transportation Attendants $32.73 20.7
56 Computer Scientists $30.52 40.1
58 High School Teachers $30.23 37.1
100 Architects $24.08 39.7
120 Aircraft Mechanics, Engine $22.04 40.0
130 Police $21.50 40.0
141 Aircraft Mechanics, Non-engine $20.64 40.0
National Average $17.13 39.6

Airline Labor CostsAirline Labor Costs
Labor negotiations in the airline industry are governed by the Railway Labor Act (RLA) of 1926.
A key distinction between the application of the RLA is that the railroad unions bargain on a national basis while airlines bargain as individual companies.
Within the airline industry there is incredible sensitivity to contract changes at other carriers that results in continuously spiraling labor costs.
The negotiation process is very complex and drawn out. It can take multiple years to work through the approximately fifteen stages.

Union PowerUnion Power
The highly unionized airline industry is unable to respond in a timely manner to changing markets and unable to prevent labor led service disruptions.

American AirlinesAmerican Airlines
Has historically been the largest airline in Has historically been the largest airline in the world in terms of revenue and number the world in terms of revenue and number one in the U.S.one in the U.S.
A premium service carrier.A premium service carrier. Hub and Spoke SystemHub and Spoke System SABRE SystemSABRE System Strongly opposed industry deregulation.Strongly opposed industry deregulation. Financial losses same as most other carriersFinancial losses same as most other carriers

CEO Revolving DoorCEO Revolving Door
AMR – Donald Carty to Gerald Arpey, May 2004AMR – Donald Carty to Gerald Arpey, May 2004
United – James Goodwin to John Creighton, Oct. 2001 United – James Goodwin to John Creighton, Oct. 2001
John Creighton to Glenn Tilton, Sept. 2002John Creighton to Glenn Tilton, Sept. 2002
Delta –Delta – Leo Mullin to Gerald Grinstein, Jan. 2004 Leo Mullin to Gerald Grinstein, Jan. 2004
Northwest – Richard Anderson toNorthwest – Richard Anderson to Douglas Steenland, Oct. 2004Douglas Steenland, Oct. 2004
US Airways – Rakesh Gangwal toUS Airways – Rakesh Gangwal to Dave Siegel, May 2002Dave Siegel, May 2002

Airline Industry Time LineAirline Industry Time Line12/17/03 First flight in Kitty Hawk, North Carolina 12/17/03 First flight in Kitty Hawk, North Carolina 1927 Lindbergh Trans-Atlantic Flight to Paris1927 Lindbergh Trans-Atlantic Flight to Paris1931 United Airlines was created from earlier multiple companies1931 United Airlines was created from earlier multiple companies1934 American Airlines was created from earlier multiple companies.1934 American Airlines was created from earlier multiple companies.1941-1945 World War II1941-1945 World War II1949 First flight of Pacific Southwest Airlines (PSA)1949 First flight of Pacific Southwest Airlines (PSA)1971 First flight of Southwest Airlines1971 First flight of Southwest Airlines1972 Singapore Airlines is created in split from Malaysian Airways1972 Singapore Airlines is created in split from Malaysian Airways1978 US airline industry was deregulated1978 US airline industry was deregulated1987 Pacific Southwest bought by USAir1987 Pacific Southwest bought by USAir1/16/91-2/27/01 Gulf War—Desert Storm1/16/91-2/27/01 Gulf War—Desert Storm10/22/01 US invasion of Afghanistan10/22/01 US invasion of Afghanistan2/11/03 Iraq War starts2/11/03 Iraq War startsOn-going – Many problems for most US airlines On-going – Many problems for most US airlines

A Glamour IndustryA Glamour Industry
The place for the rich and famous:The place for the rich and famous:
Barney Oldfield, Amelia Earhart, Howard Hughes, Bill Barney Oldfield, Amelia Earhart, Howard Hughes, Bill Boeing, Manfred von Richthofen aka The Red Baron, Eddie Boeing, Manfred von Richthofen aka The Red Baron, Eddie Rickenbacker, Billy Mitchell, Jimmie Doolittle, Saburo Rickenbacker, Billy Mitchell, Jimmie Doolittle, Saburo Sakai, Curtis LeMay, Frank Borman, Sir Freddie Laker, Sakai, Curtis LeMay, Frank Borman, Sir Freddie Laker, Frank Lorenzo, Richard Ferris, Robert Six, Richard Branson, Frank Lorenzo, Richard Ferris, Robert Six, Richard Branson, Jan Carlzon, Herb Kelleher, Bob Crandall, Stephen Wolf, Jan Carlzon, Herb Kelleher, Bob Crandall, Stephen Wolf, Sam Walton, Larry Ellison Sam Walton, Larry Ellison
Conquistadores del Cielo, crop duster, jet-setter, Concorde, Conquistadores del Cielo, crop duster, jet-setter, Concorde, SABRE, CRS, frequent flyer, Admirals Club. SABRE, CRS, frequent flyer, Admirals Club.

Orville Wright Wilbur Wright

First flight by Orville Wright, December 17, 1903

If I had been at Kitty Hawk when Orville Wright took off, I would have shot him down as a public spirited act for the benefit of future capitalists.
Warren Buffett
Airline Industry Financial Airline Industry Financial Viability?Viability?
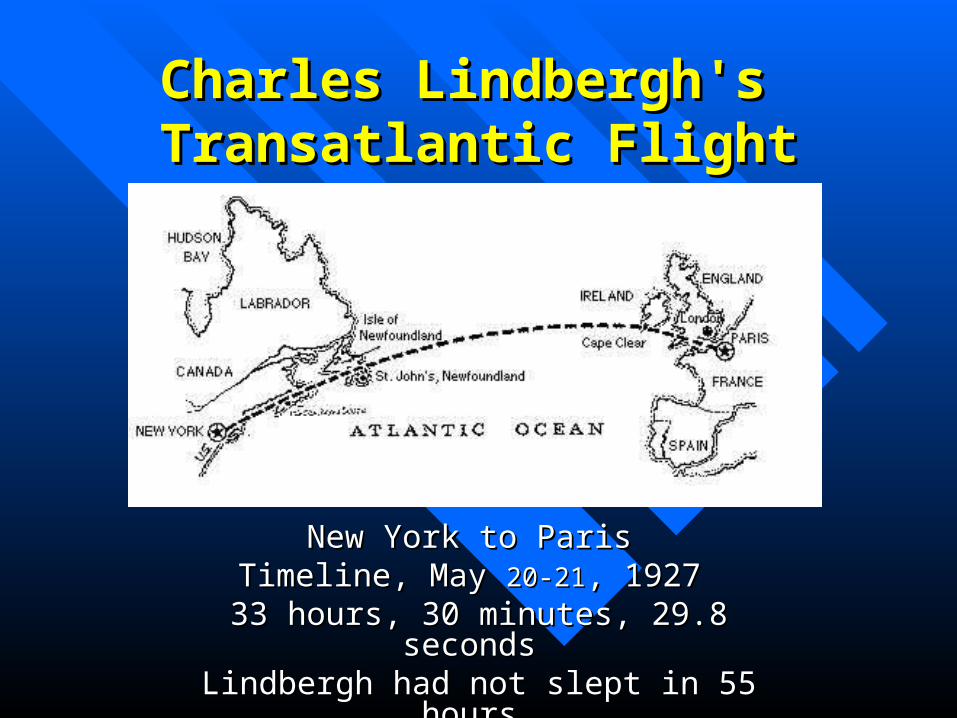
Charles Lindbergh's Charles Lindbergh's Transatlantic FlightTransatlantic Flight
New York to Paris New York to Paris Timeline, May Timeline, May 20-2120-21, 1927 , 1927
33 hours, 30 minutes, 29.8 seconds 33 hours, 30 minutes, 29.8 seconds Lindbergh had not slept in 55 hours Lindbergh had not slept in 55 hours

Pacific Southwest AirlinesPacific Southwest Airlines

In the BeginningIn the BeginningPacific Southwest Airlines began initial operations on May 6, 1949, flying a leased DC-3 aircraft with a seating capacity of 31 passengers once a week between San Diego and Oakland via Hollywood/Burbank.
Original fares for the three-city route structure were: SAN-OAK $15.60, SAN-BUR $5.65, and BUR-OAK $9.95.
By the end of 1949, PSA was operating two DC-3s and had carried 15,011 revenue passengers over 321,112 plane miles.
The airline posted operating revenues of $172,796 against operating expenses of $160,902 for a net profit of $11,984.

PSA's 1969 fleet consisted of one DC-9, one Boeing 727-100, 14 PSA's 1969 fleet consisted of one DC-9, one Boeing 727-100, 14 Boeing 727-200s, and nine Boeing 737-200s. Boeing 727-200s, and nine Boeing 737-200s.
The airline's fare structure included the following: SAN-LAX, The airline's fare structure included the following: SAN-LAX, SAN-BUR, SAN-ONT, SFO-SMF $7.14; SAN-SFO, SAN-SAN-BUR, SAN-ONT, SFO-SMF $7.14; SAN-SFO, SAN-OAK, SAN-SJC $20.95; LAX-SFO, LAX-OAK, LAX-SJC, OAK, SAN-SJC $20.95; LAX-SFO, LAX-OAK, LAX-SJC, BUR-SFO, BUR-OAK, BUR-SJC $14.52. BUR-SFO, BUR-OAK, BUR-SJC $14.52.
PSA entered the seventies with an all Boeing-equipped fleet that PSA entered the seventies with an all Boeing-equipped fleet that included one 727-100, 16 727-200s, and nine 737-200s. included one 727-100, 16 727-200s, and nine 737-200s.

With Growth Came Financial With Growth Came Financial ProblemsProblems
One million passengers flew PSA in the month of August, One million passengers flew PSA in the month of August, 1986 marking the first time in the carrier's history that it 1986 marking the first time in the carrier's history that it boarded that many passengers in a single month. boarded that many passengers in a single month.
PSA carried a record 10.7 million travelers in 1986, but posted PSA carried a record 10.7 million travelers in 1986, but posted a year end net loss of $3 million. a year end net loss of $3 million.

The End of PSAThe End of PSA
On May 29, 1987 Pacific Southwest Airlines became a On May 29, 1987 Pacific Southwest Airlines became a division of USAir. division of USAir.
The last PSA departure left San Diego, California as flight The last PSA departure left San Diego, California as flight
1486 bound for Las Vegas, Nevada on April 8, 1988.1486 bound for Las Vegas, Nevada on April 8, 1988.

The National Commission to Ensure a The National Commission to Ensure a Strong Competitive Airline IndustryStrong Competitive Airline Industry
Change, Challenge and Change, Challenge and CompetitionCompetition
A Report to the President and CongressAugust 1993

Commission Findings
• The Airline Industry is more competitive than before deregulation in 1978.
• Travelers and shippers are charged less than in 1978.
• The Airline Industry has never made a sustained, substantial return on investment.
• It lost huge amounts of money from 1990 to 1993.
• It canceled many aircraft orders shortly after an unprecedented buying binge.
• Its freedom to compete in international markets is uncertain because of government restrictions.

Commission Conclusions
For the U.S. to prosper in a global marketplace the airline industry must: • Be efficient and technologically superior.
• Have the financial strength to respond to rapid change and opportunity.
• Efficiently move people, products and services to markets, wherever they exist.

Recommendations
Efficiency: Reinvent the FAA.
Financial Health: Deal with factors that impact the financial health of the industry.
Access to Foreign Markets: Replace the current bilateral system with a multi-national regime.

To return their balance sheets to respectability, most airlines would have to achieve profit margins that are almost unprecedented in their history, and sustain those margins for years.

September 11 ImpactSeptember 11 Impact
An absolute disaster for the industry.

A Sobering FactA Sobering Fact
Before September 11, 2001, the global industry was showing a net loss on international services of around $3 billion.

US Airline Industry Must US Airline Industry Must Restructure or DieRestructure or Die
Aviation Week & Space TechnologyAviation Week & Space TechnologyNovember 2002November 2002
Low-Cost Airlines, Not September 11, Have Transformed Industry Fundamentals
"When people say the traditional industry model is broken, they are moving their jaw without putting their brain in gear," responds former American Airlines CEO Robert Crandall. He added that he is skeptical that the industry will ever be competitive as long as there are so many carriers selling what has evolved into a commodity product.

Corrective ActionsCorrective Actions
It will take much more than concessions by labor for major U.S. airlines to solve their financial problems.

Airline Industry US Market Airline Industry US Market ShareShare
Based on current trends, the domestic market share held by the six major US airlines (American, Continental, Delta, Northwest, United and US Airways) plus Alaska Airlines will drop from 75% in 2002 to 62% in 2010—and 45% by 2020, according to an industry projection.
Southwest could pass American to become the largest U.S. airline by 2013, and JetBlue could pass Delta to become the third largest by 2020.

Industry Structure ProblemsIndustry Structure Problems
The fact that low-cost carriers have been able to mature this far says as much about what's wrong with the majors as it does about what's right with their low-cost counterparts, and begs the question: does the underlying strategy or business model employed by the large hub-and-spoke airlines still work?
Analysts and other industry observers believe it does, but to function properly carriers must reduce their costs and restore the balance between supply and demand.

1. Convenience to Customers.
2. Knowledge of Customers.
3. Providing a foundation for other
systems.
4. Building a base for other businesses.
Benefits of Information Systems to an Airline

Business Traveler Choice?
Personal Traveler Choice?
Ticket-less Versus No Reservation?
Computer Reservation System:
Airline AlliancesAirline Alliances
The Star Alliance is the largest of the major groupings. Consisting of 15 airlines led by United Air Lines and Lufthansa. Star serves about 815 destinations in more than 130 countries.
Oneworld, which is eclipsed by only Star among the major airline alliances, is led by British and American Airlines. Eight airlines offer service to 550 destinations in more than 130 countries.
SkyTeam is quickly becoming a major alliance player by serving more than 450 destinations in nearly 100 countries. Led by Air France and Delta, SkyTeam has also consolidated cargo services.

Code Sharing AgreementsCode Sharing Agreements
The US Transportation and Justice Departments approved a pact that will let Delta Air Lines, Continental Airlines and Northwest Airlines share access to each other's routes.
The code-share agreement allows each carrier to market the others' routes as its own. One Northwest flight, for instance, might also have a Continental flight number and a Delta flight number.
The agreement is the biggest in the industry. US Airways and United Airlines have a similar agreement.

Code Sharing AgreementsCode Sharing Agreements
It's an especially appealing arrangement to frequent fliers who prefer to build up miles on one airline while flying all three.
The government placed several conditions on the deal. Specifically, the DOT said 60 percent of any new code-sharing routes must serve those areas of the country that are considered under-served.
It also bans anti-competitive practices like coordinated pricing or shared decisions about route planning and capacity.
Barriers to EntryBarriers to Entry
Access to airports continues to be impeded by:
(1) Federal limits on takeoff and landing slotsat the major airports in Chicago, New York, and Washington
(2) Long-term, exclusive-use gate leases
(3) “Perimeter Rules” prohibiting flights at New York’s LaGuardia and Washington’s National airports that exceed a certain distance.

US Industry StrengthUS Industry StrengthFifteen major US carriers represent the following significance in the world-wide airline industry:
29% of the aircraft
46% of the employees
32.5% of the the 2000 passenger miles
Based on a number of years of operating in a deregulated environment within the US that forced them to compete in a very tough market.

International Airline IndustryInternational Airline Industry
Between 1982 and 2002 the IATA airlines had Between 1982 and 2002 the IATA airlines had
revenues of $2 trillion and cumulative losses of $5 revenues of $2 trillion and cumulative losses of $5
billion.billion.
Does a business model exist that is more susceptible to things going wrong?

Deregulated But Very RegulatedDeregulated But Very Regulated
Safety factors.
Air traffic controllers.
Impact on constituents.
International routes.

Continuing ConcernsContinuing Concerns
1. Fuel costs
2. Decisions regarding passenger services like whether to charge for food, the need for more electronic capabilities.
3. Upgrading aircraft.
4. Route strategies.
5. Union relations.
6. Relations with travel agents.

Needed for the IndustryNeeded for the Industry
1. Changes in tax laws as they relate to airlines.
2. Encourage foreign investment in U.S. carriers.
3. Changes to bankruptcy laws to eliminate the ability for airlines to hide from their creditors under court protection.
4. Improve the capacity and capabilities of airports. Airports belong to cities and counties so there is no national-wide plan.

Needed for the IndustryNeeded for the Industry
5. Provide a better air traffic control system to minimize flight delays.
6. Continue to negotiate better international rights for U.S. carriers.
7. Gain equalization of the regulatory requirements on U.S. and foreign carriers worldwide.
8. Further eliminate unnecessary and costly regulatory requirements on airlines within the United States.

Airline Industry Conclusions Airline Industry Conclusions
It is a vivid example of the dynamics of the markets that it serves.
Establishing strategies dictated by the market is critical.
Once the right strategies have been identified, information systems can play an important supporting role.


![ExercÃ-cios [2ª V.A.]](https://img.pdfslide.net/doc/110x75/55cf8ec3550346703b956371/exerca-cios-2aa-va.jpg)